samhita’etal. ,figures1 -...
TRANSCRIPT
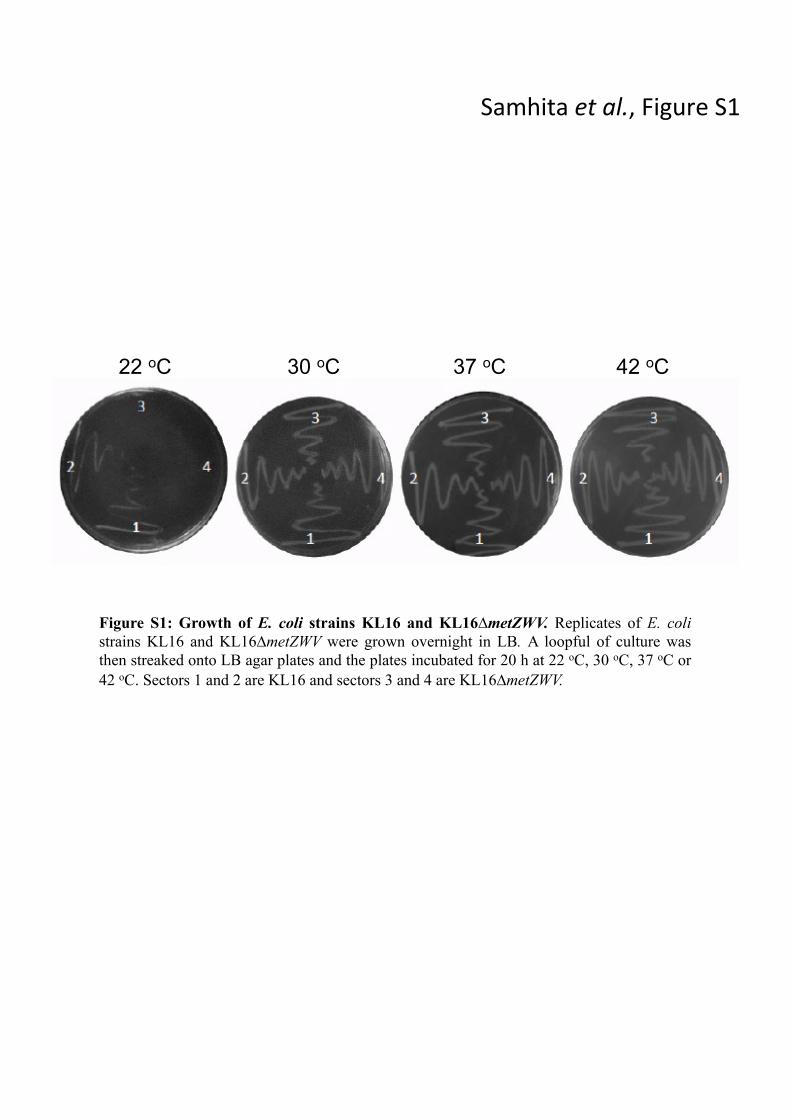
Samhita et al., Figure S1
22 oC 30 oC 37 oC 42 oC
Figure S1: Growth of E. coli strains KL16 and KL16∆metZWV. Replicates of E. coli strains KL16 and KL16∆metZWV were grown overnight in LB. A loopful of culture was then streaked onto LB agar plates and the plates incubated for 20 h at 22 oC, 30 oC, 37 oC or 42 oC. Sectors 1 and 2 are KL16 and sectors 3 and 4 are KL16∆metZWV.
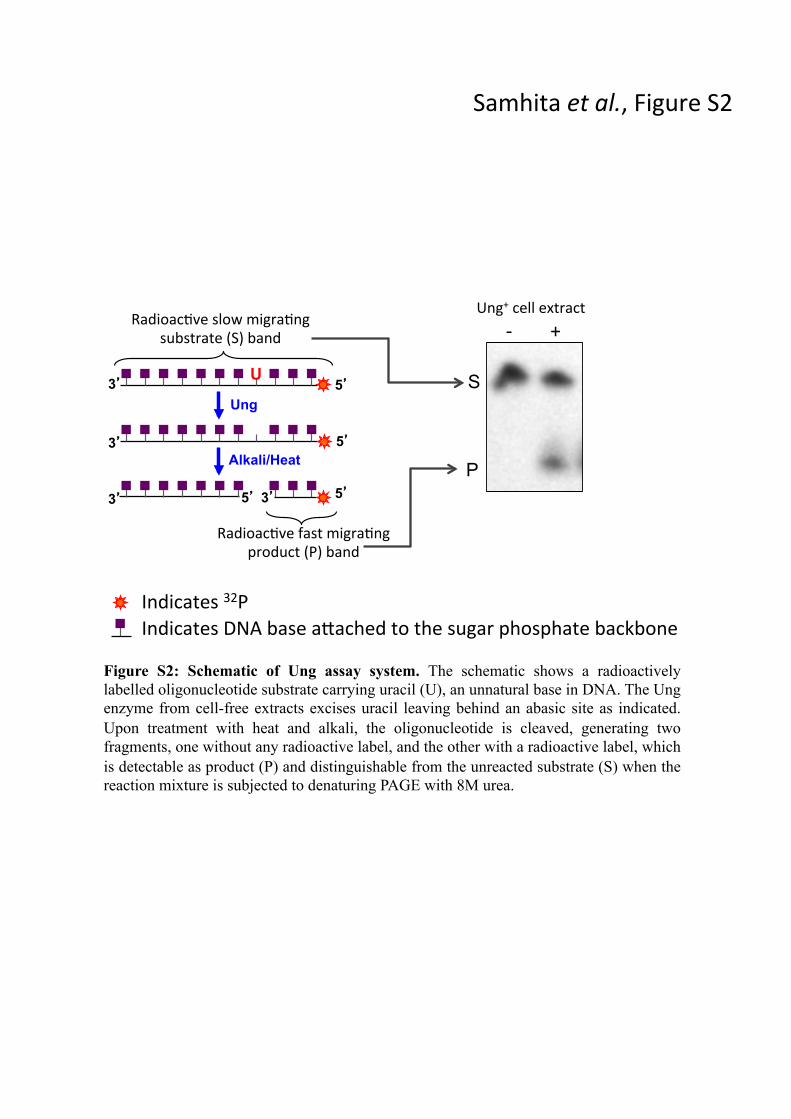
Samhita et al., Figure S2
Figure S2: Schematic of Ung assay system. The schematic shows a radioactively labelled oligonucleotide substrate carrying uracil (U), an unnatural base in DNA. The Ung enzyme from cell-free extracts excises uracil leaving behind an abasic site as indicated. Upon treatment with heat and alkali, the oligonucleotide is cleaved, generating two fragments, one without any radioactive label, and the other with a radioactive label, which is detectable as product (P) and distinguishable from the unreacted substrate (S) when the reaction mixture is subjected to denaturing PAGE with 8M urea.
Samhita'et#al.,'Figure'S2'
U
Ung
Alkali/Heat
5� 3�
3�
3�
5�
5� 5� 3�
Radioac4ve'fast'migra4ng'product'(P)'band'
Radioac4ve'slow'migra4ng'substrate'(S)'band'
S
P
Ung+'cell'extract'C''''''''+''''''
Indicates'32P'Indicates'DNA'base'aIached'to'the'sugar'phosphate'backbone'
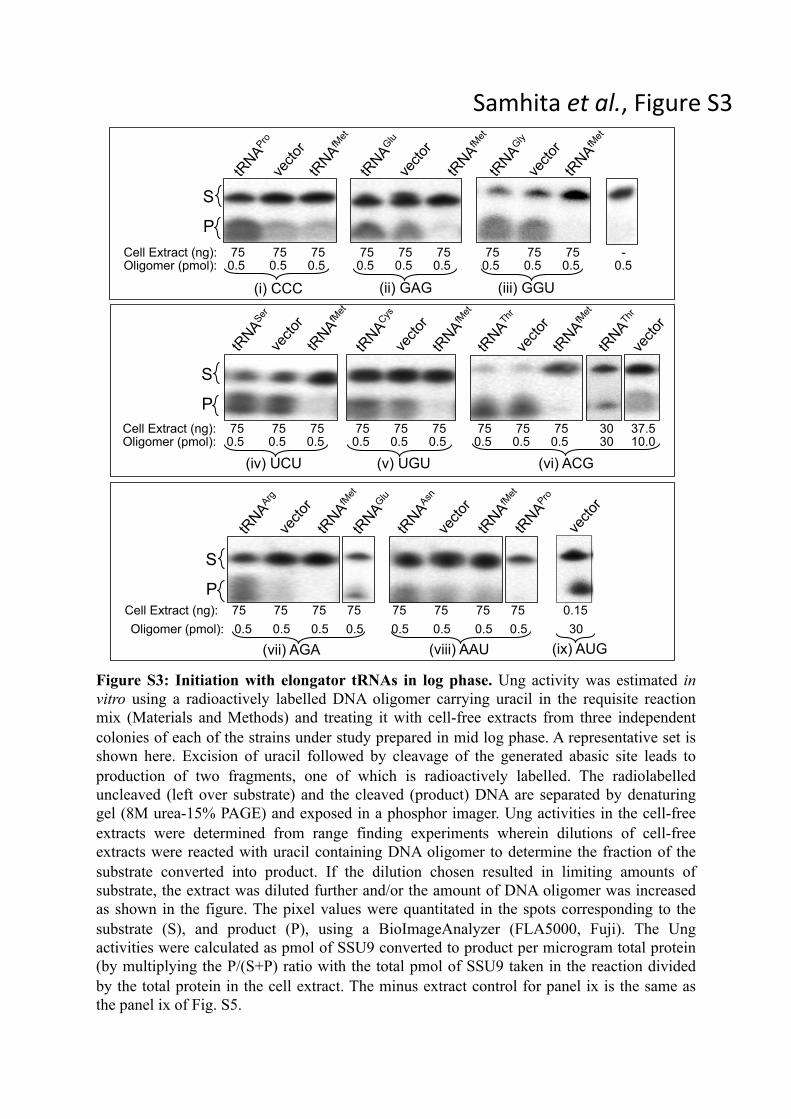
Samhita et al., Figure S3
Figure S3: Initiation with elongator tRNAs in log phase. Ung activity was estimated in vitro using a radioactively labelled DNA oligomer carrying uracil in the requisite reaction mix (Materials and Methods) and treating it with cell-free extracts from three independent colonies of each of the strains under study prepared in mid log phase. A representative set is shown here. Excision of uracil followed by cleavage of the generated abasic site leads to production of two fragments, one of which is radioactively labelled. The radiolabelled uncleaved (left over substrate) and the cleaved (product) DNA are separated by denaturing gel (8M urea-15% PAGE) and exposed in a phosphor imager. Ung activities in the cell-free extracts were determined from range finding experiments wherein dilutions of cell-free extracts were reacted with uracil containing DNA oligomer to determine the fraction of the substrate converted into product. If the dilution chosen resulted in limiting amounts of substrate, the extract was diluted further and/or the amount of DNA oligomer was increased as shown in the figure. The pixel values were quantitated in the spots corresponding to the substrate (S), and product (P), using a BioImageAnalyzer (FLA5000, Fuji). The Ung activities were calculated as pmol of SSU9 converted to product per microgram total protein (by multiplying the P/(S+P) ratio with the total pmol of SSU9 taken in the reaction divided by the total protein in the cell extract. The minus extract control for panel ix is the same as the panel ix of Fig. S5.
(ii) GAG (i) CCC (iii) GGU
Cell Extract (ng): 75 75 75 75 75 75 75 75 75 - Oligomer (pmol): 0.5 0.5 0.5 0.5 0.5 0.5 0.5 0.5 0.5 0.5
S
P
(v) UGU (vi) ACG
Cell Extract (ng): 75 75 75 75 75 75 75 75 75 30 37.5 Oligomer (pmol): 0.5 0.5 0.5 0.5 0.5 0.5 0.5 0.5 0.5 30 10.0
(iv) UCU
S
P
Samhita'et#al.,'Figure'S3'
(viii) AAU (vii) AGA
Cell Extract (ng): 75 75 75 75 75 75 75 75 0.15 Oligomer (pmol): 0.5 0.5 0.5 0.5 0.5 0.5 0.5 0.5 30
S
P
(ix) AUG
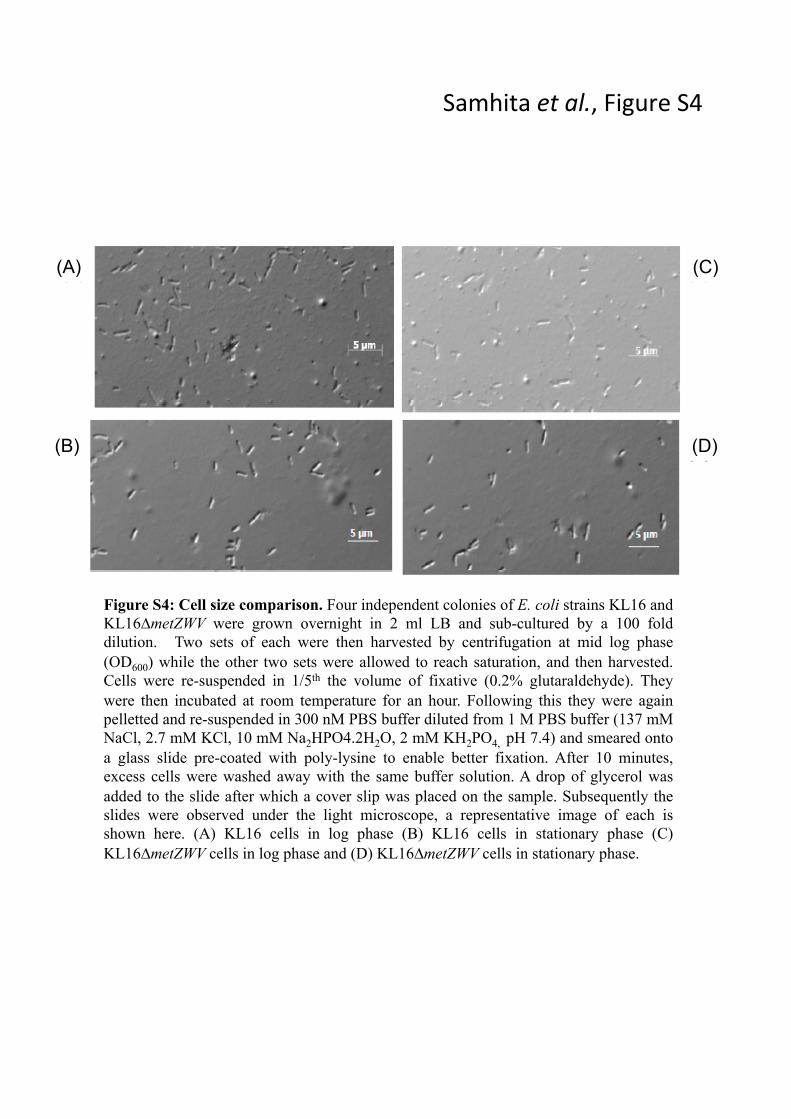
Samhita et al., Figure S4
(A)
(B)
(C)
(D)
Figure S4: Cell size comparison. Four independent colonies of E. coli strains KL16 and KL16∆metZWV were grown overnight in 2 ml LB and sub-cultured by a 100 fold dilution. Two sets of each were then harvested by centrifugation at mid log phase (OD600) while the other two sets were allowed to reach saturation, and then harvested. Cells were re-suspended in 1/5th the volume of fixative (0.2% glutaraldehyde). They were then incubated at room temperature for an hour. Following this they were again pelletted and re-suspended in 300 nM PBS buffer diluted from 1 M PBS buffer (137 mM NaCl, 2.7 mM KCl, 10 mM Na2HPO4.2H2O, 2 mM KH2PO4, pH 7.4) and smeared onto a glass slide pre-coated with poly-lysine to enable better fixation. After 10 minutes, excess cells were washed away with the same buffer solution. A drop of glycerol was added to the slide after which a cover slip was placed on the sample. Subsequently the slides were observed under the light microscope, a representative image of each is shown here. (A) KL16 cells in log phase (B) KL16 cells in stationary phase (C) KL16∆metZWV cells in log phase and (D) KL16∆metZWV cells in stationary phase.

Samhita et al., Figure S5
Figure S5: Initiation with elongator tRNAs in stationary phase. Ung activity was estimated in vitro using a radioactively labelled DNA oligomer carrying uracil in the requisite reaction mix (Materials and Methods) and treating it with cell-free extracts from three independent colonies of each of the strains under study prepared in stationary phase. A representative set is shown here. Ung activities in the cell free extracts were determined from range finding experiments as described in Fig. S3.
(ii) GAG (i) CCC (iii) GGU
Cell Extract (ng): 75 75 75 75 - 75 75 75 30 - 75 75 75 30 Oligomer (pmol): 0.5 0.5 0.5 5.0 5.0 0.5 0.5 0.5 30 30 0.5 0.5 0.5 30
S
P
(v) UGU (vi) ACG
Cell Extract (ng): 75 75 75 75 37.5 75 75 75 37.5 75 75 75 30 37.5 Oligomer (pmol): 0.5 0.5 0.5 5.0 10.0 0.5 0.5 0.5 10.0 0.5 0.5 0.5 30 10.0
(iv) UCU
S
P
(viii) AAU (vii) AGA
Cell Extract (ng): 75 75 75 75 75 75 75 75 75 75 0.15 - Oligomer (pmol): 0.5 0.5 0.5 5.0 5.0 0.5 0.5 0.5 5.0 5.0 30 30
S
P
(ix) AUG
Samhita'et#al.,'Figure'S5'
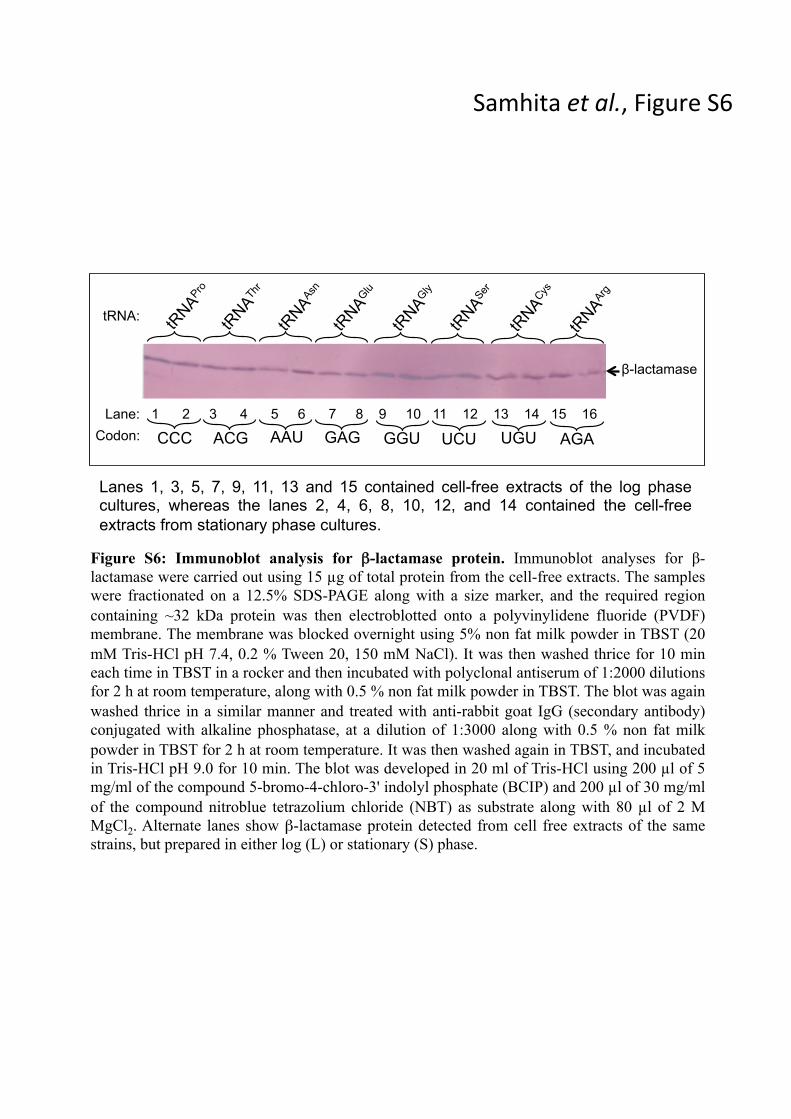
Samhita et al., Figure S6
Figure S6: Immunoblot analysis for β-lactamase protein. Immunoblot analyses for β- lactamase were carried out using 15 µg of total protein from the cell-free extracts. The samples were fractionated on a 12.5% SDS-PAGE along with a size marker, and the required region containing ~32 kDa protein was then electroblotted onto a polyvinylidene fluoride (PVDF) membrane. The membrane was blocked overnight using 5% non fat milk powder in TBST (20 mM Tris-HCl pH 7.4, 0.2 % Tween 20, 150 mM NaCl). It was then washed thrice for 10 min each time in TBST in a rocker and then incubated with polyclonal antiserum of 1:2000 dilutions for 2 h at room temperature, along with 0.5 % non fat milk powder in TBST. The blot was again washed thrice in a similar manner and treated with anti-rabbit goat IgG (secondary antibody) conjugated with alkaline phosphatase, at a dilution of 1:3000 along with 0.5 % non fat milk powder in TBST for 2 h at room temperature. It was then washed again in TBST, and incubated in Tris-HCl pH 9.0 for 10 min. The blot was developed in 20 ml of Tris-HCl using 200 µl of 5 mg/ml of the compound 5-bromo-4-chloro-3' indolyl phosphate (BCIP) and 200 µl of 30 mg/ml of the compound nitroblue tetrazolium chloride (NBT) as substrate along with 80 µl of 2 M MgCl2. Alternate lanes show β-lactamase protein detected from cell free extracts of the same strains, but prepared in either log (L) or stationary (S) phase.
Lane: 1 2 3 4 5 6 7 8 9 10 11 12 13 14 15 16
GAG CCC GGU AAU AGA UGU ACG UCU Codon:
tRNA:
Samhita'et#al.,'Figure'S6'
β-lactamase
Lanes 1, 3, 5, 7, 9, 11, 13 and 15 contained cell-free extracts of the log phase cultures, whereas the lanes 2, 4, 6, 8, 10, 12, and 14 contained the cell-free extracts from stationary phase cultures.

Samhita et al., Figure S7
Figure S7: Initiation with elongator tRNAs in RRFts strain of E. coli (LJ14). Ung activity was estimated in vitro using a radioactively labelled DNA oligomer carrying uracil in the requisite reaction mix (Materials and Methods) and treating it with cell-free extracts from three independent colonies of each of the strains under study prepared in log phase. A representative set is shown here. Ung activities in the cell free extracts were determined from range finding experiments as described in Fig. S3.
AAU
Cell Extract (ng): 75 75 75 - Oligomer (pmol): 0.5 0.5 0.5 0.5
Samhita'et#al.,'Figure'S7'