sarah fitzgerald
TRANSCRIPT

FOOD CHOICE AT WORK STUDY Sarah Fitzgerald, Post-doctoral Researcher, Food Choice at Work
Lead Investigator: Dr Fiona Geaney
Principal Investigator: Prof Ivan Perry
Problem...
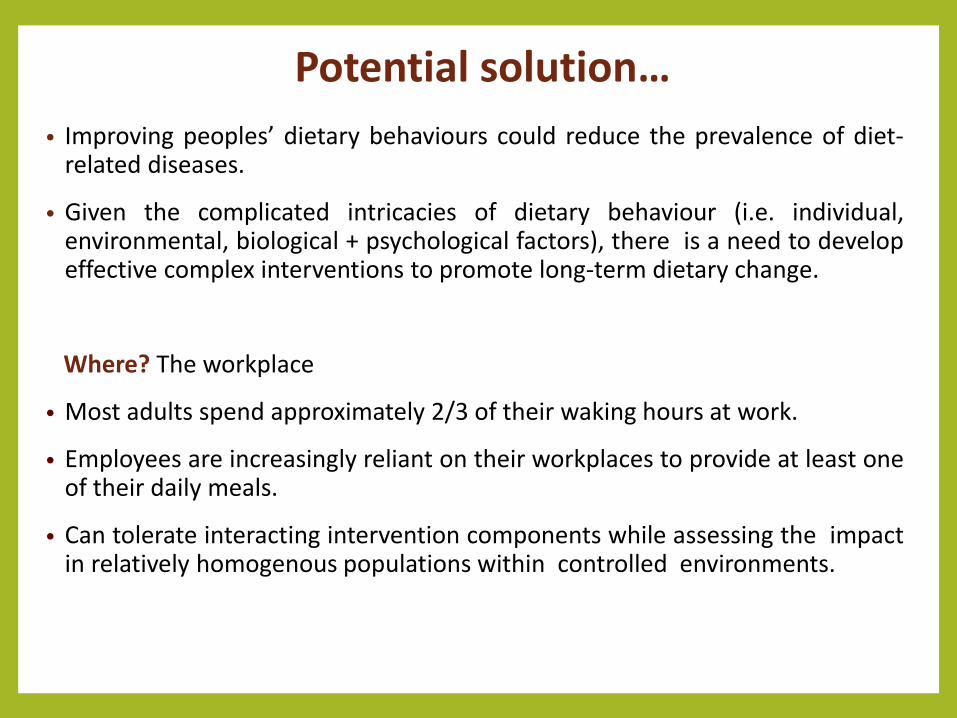
Potential solution…
• Improving peoples’ dietary behaviours could reduce the prevalence of diet-related diseases.
• Given the complicated intricacies of dietary behaviour (i.e. individual, environmental, biological + psychological factors), there is a need to develop effective complex interventions to promote long-term dietary change.
Where? The workplace
• Most adults spend approximately 2/3 of their waking hours at work.
• Employees are increasingly reliant on their workplaces to provide at least one of their daily meals.
• Can tolerate interacting intervention components while assessing the impact in relatively homogenous populations within controlled environments.
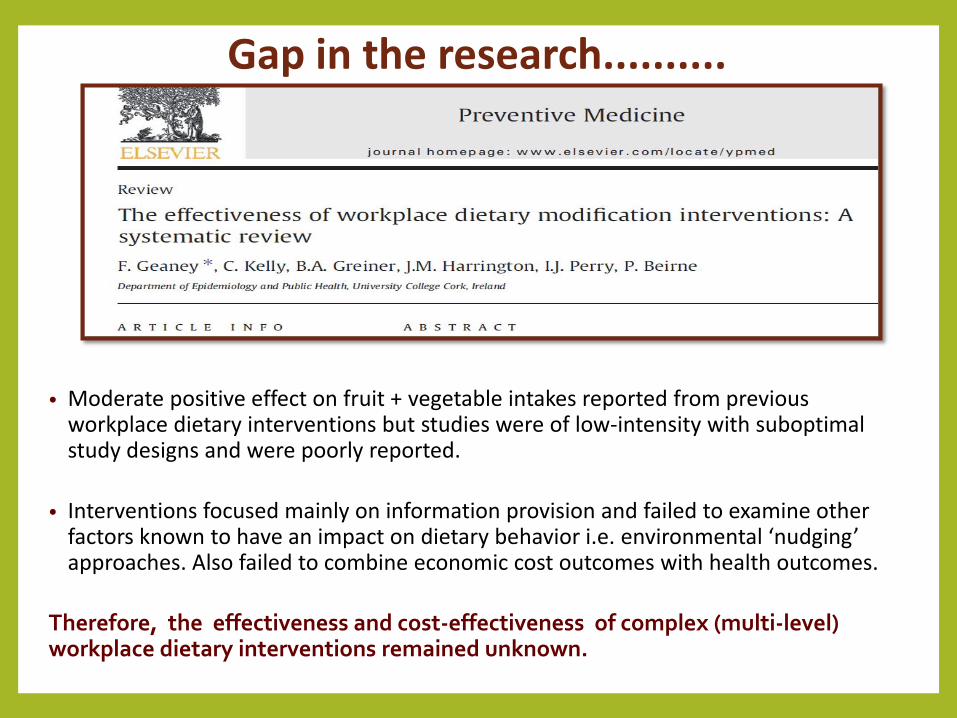
Gap in the research..........
• Moderate positive effect on fruit + vegetable intakes reported from previous workplace dietary interventions but studies were of low-intensity with suboptimal study designs and were poorly reported.
• Interventions focused mainly on information provision and failed to examine other factors known to have an impact on dietary behavior i.e. environmental ‘nudging’ approaches. Also failed to combine economic cost outcomes with health outcomes.
Therefore, the effectiveness and cost-effectiveness of complex (multi-level) workplace dietary interventions remained unknown.
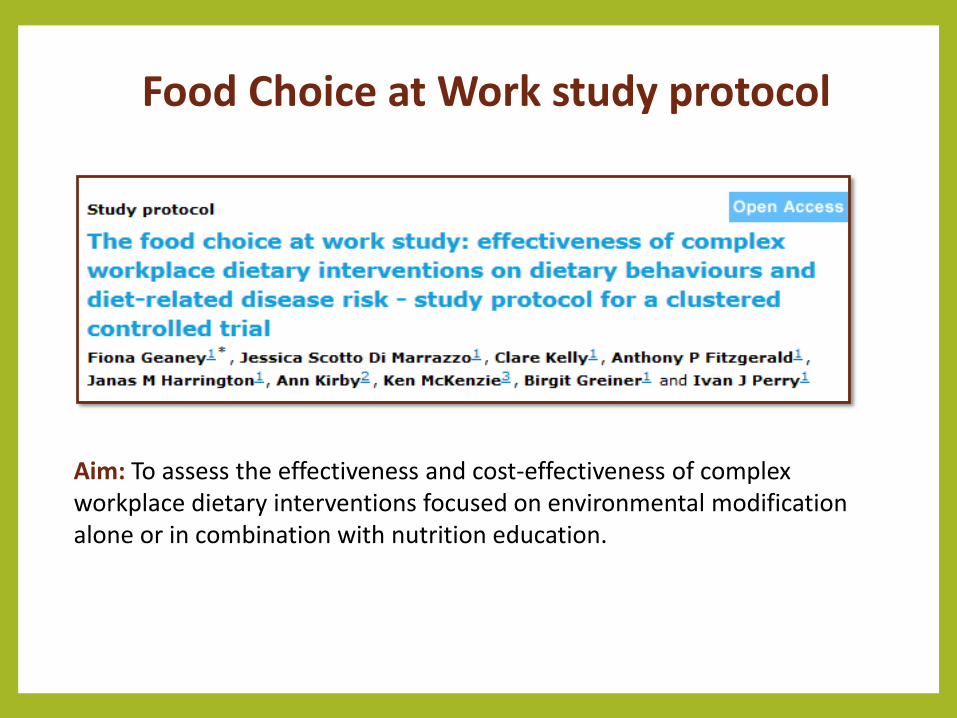
Food Choice at Work study protocol
Aim: To assess the effectiveness and cost-effectiveness of complex workplace dietary interventions focused on environmental modification alone or in combination with nutrition education.

Recruitment
IDA website: list of manufacturing workplaces in Cork Eligible if met the specified selection criteria Purposively selected and allocated 4 workplaces
Workplace inclusion criteria
- Manufacturing multinational workplace
- Employs >250 employees
- Daily workplace canteen for employees
- Commit to complex intervention for duration of the study
Employee inclusion criteria
- Any permanent, full-time employee
- Consumes at least one main meal at work daily

Control workplace
Education workplace
Environment workplace
Combined workplace (education + environment)

FINDINGS FROM THE FOOD CHOICE AT WORK STUDY
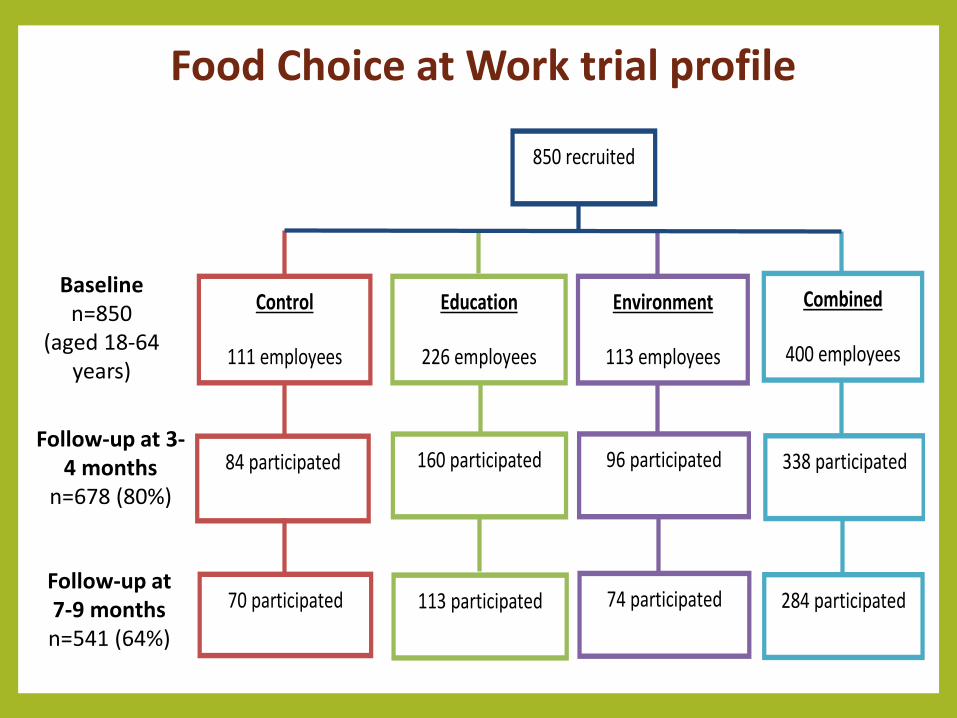
Food Choice at Work trial profile
Baseline n=850
(aged 18-64 years)
Follow-up at 3-4 months
n=678 (80%)
Follow-up at 7-9 months n=541 (64%)
850 recruited
Control
111 employees
84 participated
Education
226 employees
160 participated
Environment
113 employees
96 participated
Combined
400 employees
338 participated
70 participated
113 participated
74 participated
284 participated
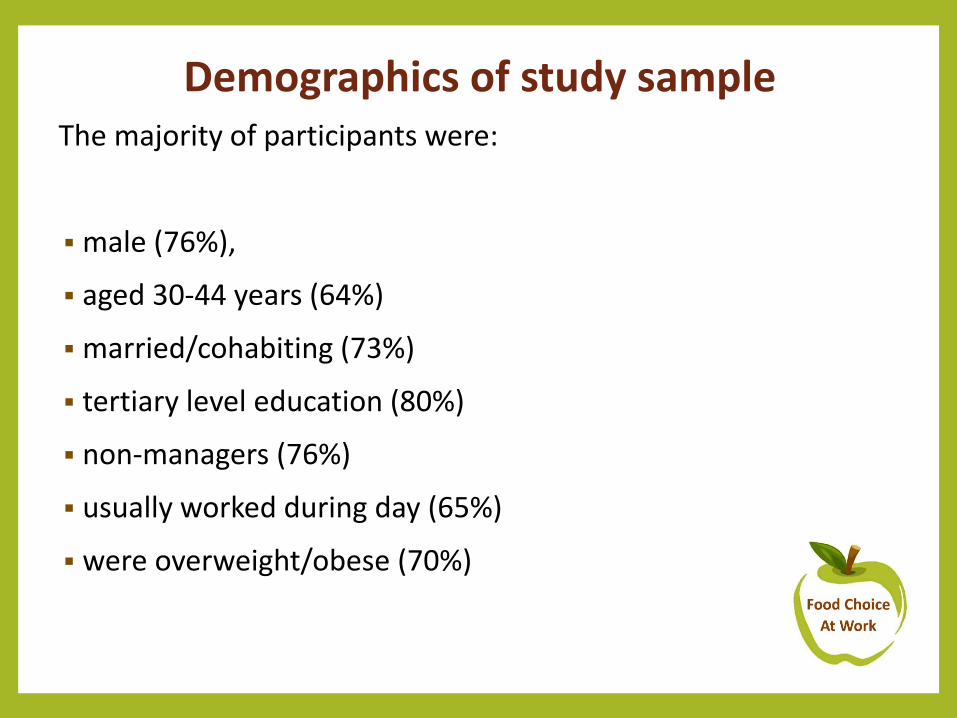
Demographics of study sample The majority of participants were:
male (76%),
aged 30-44 years (64%)
married/cohabiting (73%)
tertiary level education (80%)
non-managers (76%)
usually worked during day (65%)
were overweight/obese (70%)
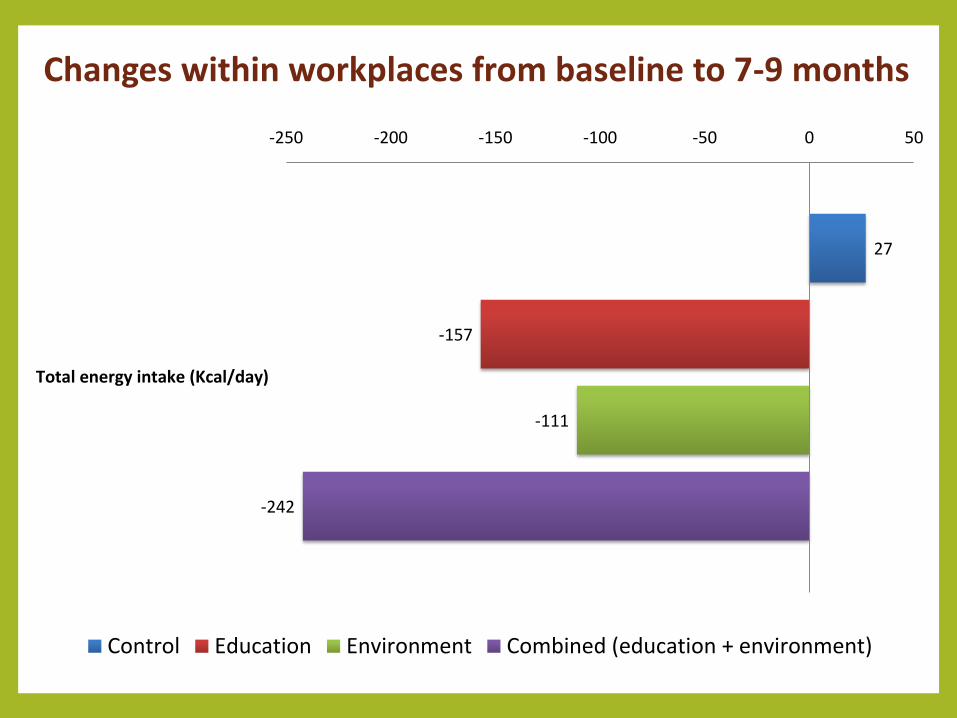
Changes within workplaces from baseline to 7-9 months
27
-157
-111
-242
-250 -200 -150 -100 -50 0 50
Total energy intake (Kcal/day)
Control Education Environment Combined (education + environment)
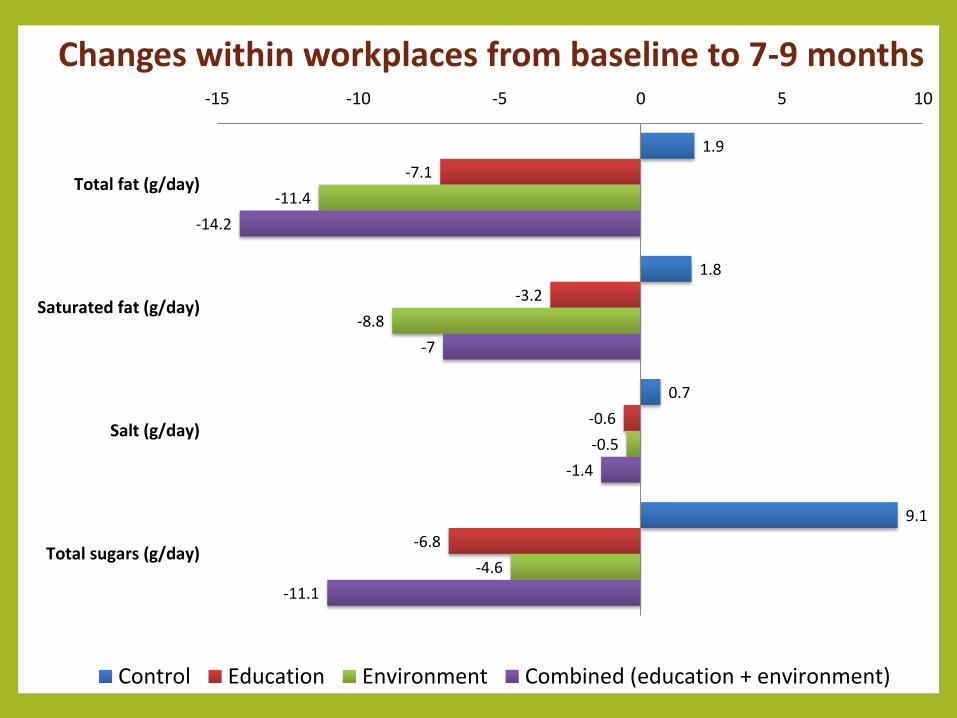
Changes within workplaces from baseline to 7-9 months
1.9
1.8
0.7
9.1
-7.1
-3.2
-0.6
-6.8
-11.4
-8.8
-0.5
-4.6
-14.2
-7
-1.4
-11.1
-15 -10 -5 0 5 10
Total fat (g/day)
Saturated fat (g/day)
Salt (g/day)
Total sugars (g/day)
Control Education Environment Combined (education + environment)
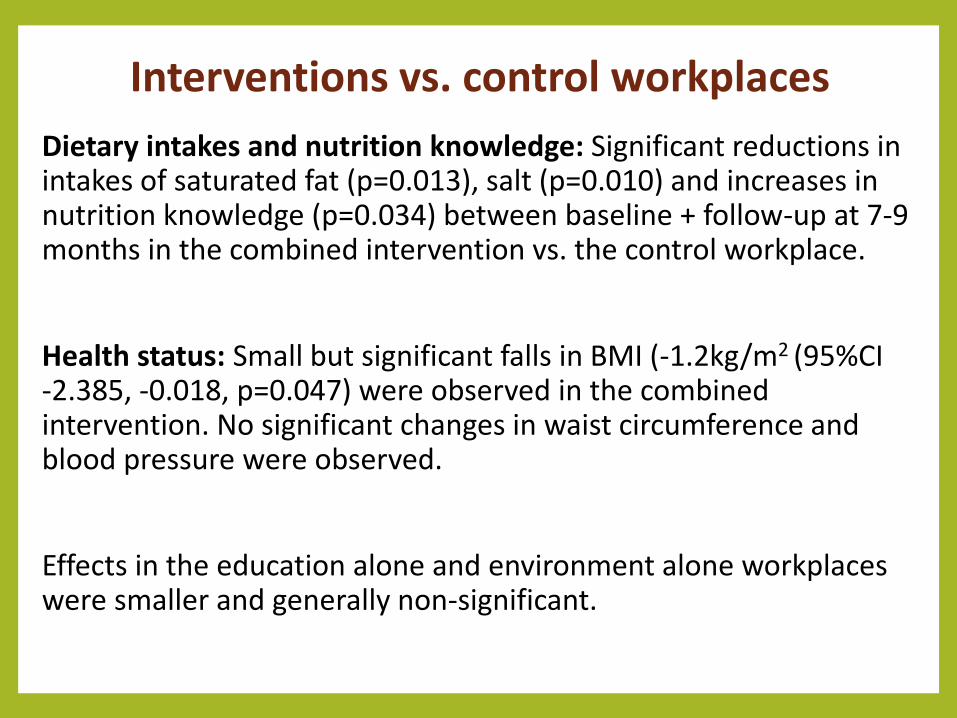
Interventions vs. control workplaces
Dietary intakes and nutrition knowledge: Significant reductions in intakes of saturated fat (p=0.013), salt (p=0.010) and increases in nutrition knowledge (p=0.034) between baseline + follow-up at 7-9 months in the combined intervention vs. the control workplace.
Health status: Small but significant falls in BMI (-1.2kg/m2 (95%CI -2.385, -0.018, p=0.047) were observed in the combined intervention. No significant changes in waist circumference and blood pressure were observed.
Effects in the education alone and environment alone workplaces were smaller and generally non-significant.
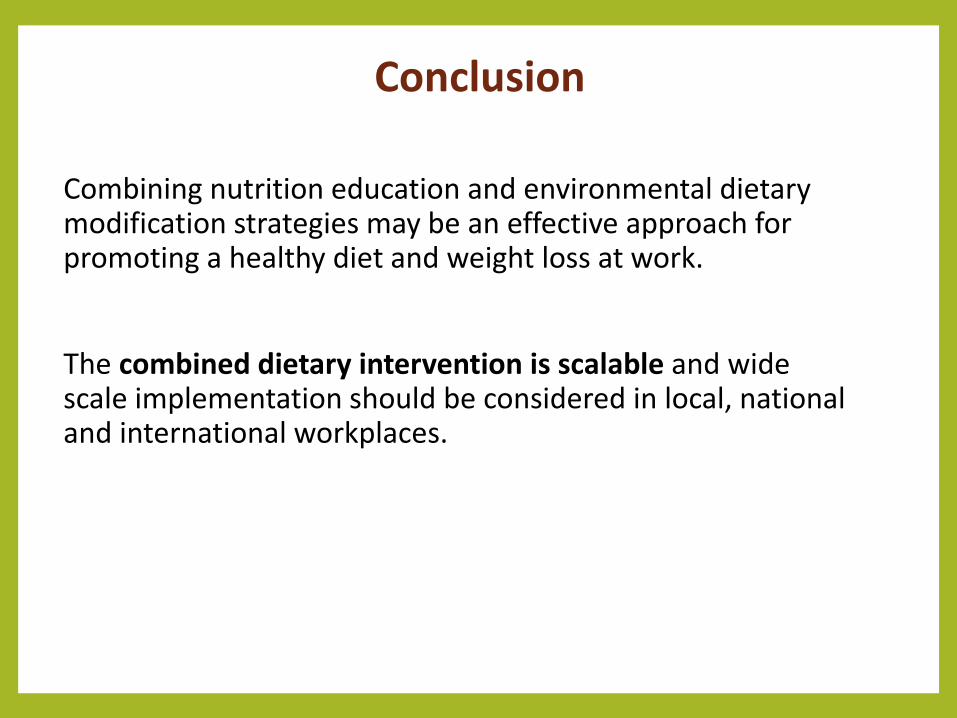
Combining nutrition education and environmental dietary modification strategies may be an effective approach for promoting a healthy diet and weight loss at work.
The combined dietary intervention is scalable and wide scale implementation should be considered in local, national and international workplaces.
Conclusion
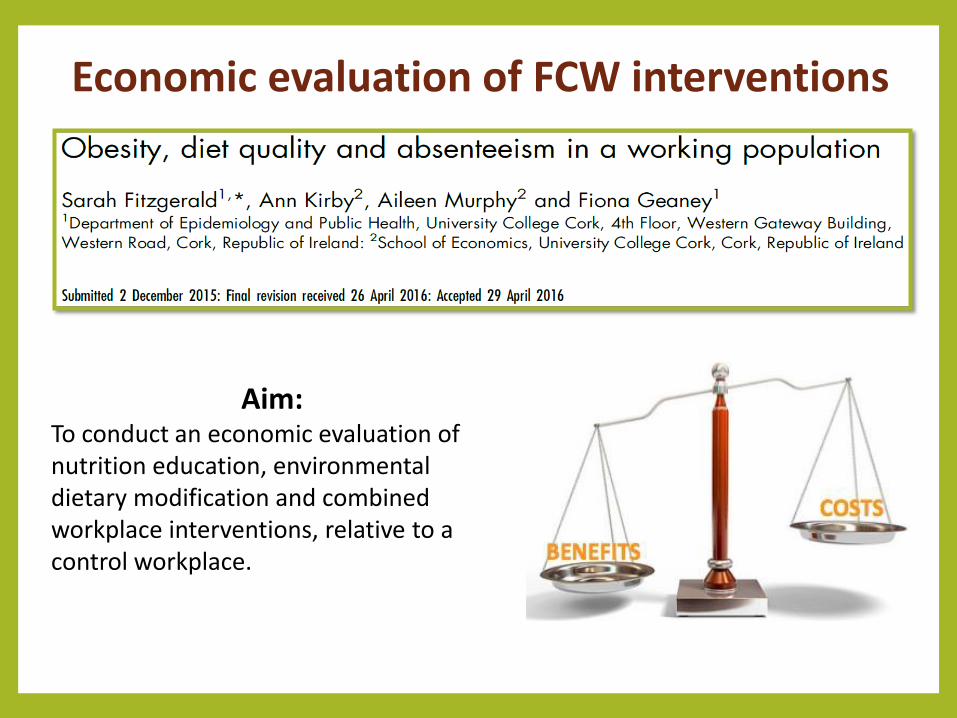
Economic evaluation of FCW interventions
Aim: To conduct an economic evaluation of nutrition education, environmental dietary modification and combined workplace interventions, relative to a control workplace.
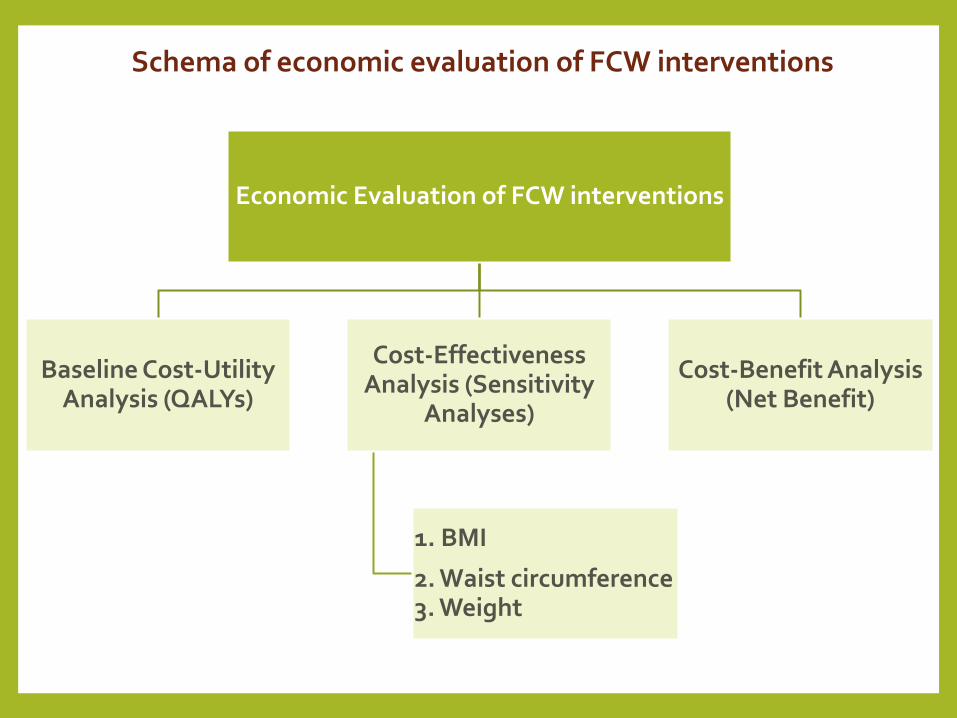
Economic Evaluation of FCW interventions
Baseline Cost-Utility Analysis (QALYs)
Cost-Effectiveness Analysis (Sensitivity
Analyses)
1. BMI
2. Waist circumference 3. Weight
Cost-Benefit Analysis (Net Benefit)
Schema of economic evaluation of FCW interventions
Education
Costs (€)
Environ.
Costs (€)
Combined
Costs (€)
Control
Costs (€)
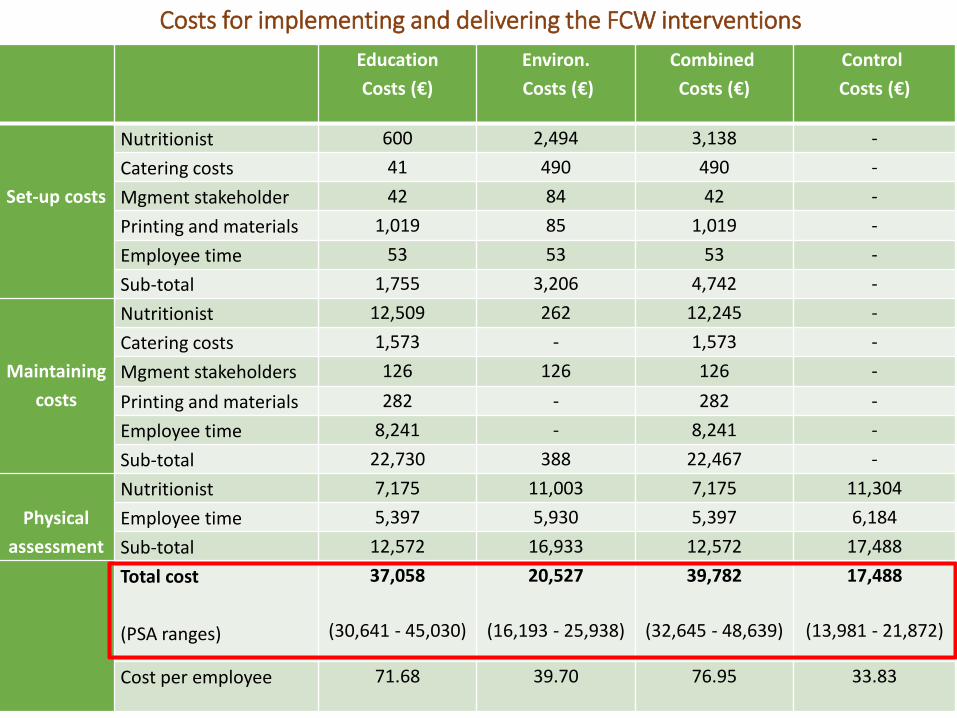
Set-up costs
Nutritionist 600 2,494 3,138 -
Catering costs 41 490 490 -
Mgment stakeholder 42 84 42 -
Printing and materials 1,019 85 1,019 -
Employee time 53 53 53 -
Sub-total 1,755 3,206 4,742 -
Maintaining
costs
Nutritionist 12,509 262 12,245 -
Catering costs 1,573 - 1,573 -
Mgment stakeholders 126 126 126 -
Printing and materials 282 - 282 -
Employee time 8,241 - 8,241 -
Sub-total 22,730 388 22,467 -
Physical
assessment
Nutritionist 7,175 11,003 7,175 11,304
Employee time 5,397 5,930 5,397 6,184
Sub-total 12,572 16,933 12,572 17,488
Total cost
(PSA ranges)
37,058
(30,641 - 45,030)
20,527
(16,193 - 25,938)
39,782
(32,645 - 48,639)
17,488
(13,981 - 21,872)
Cost per employee 71.68 39.70 76.95 33.83
Costs for implementing and delivering the FCW interventions
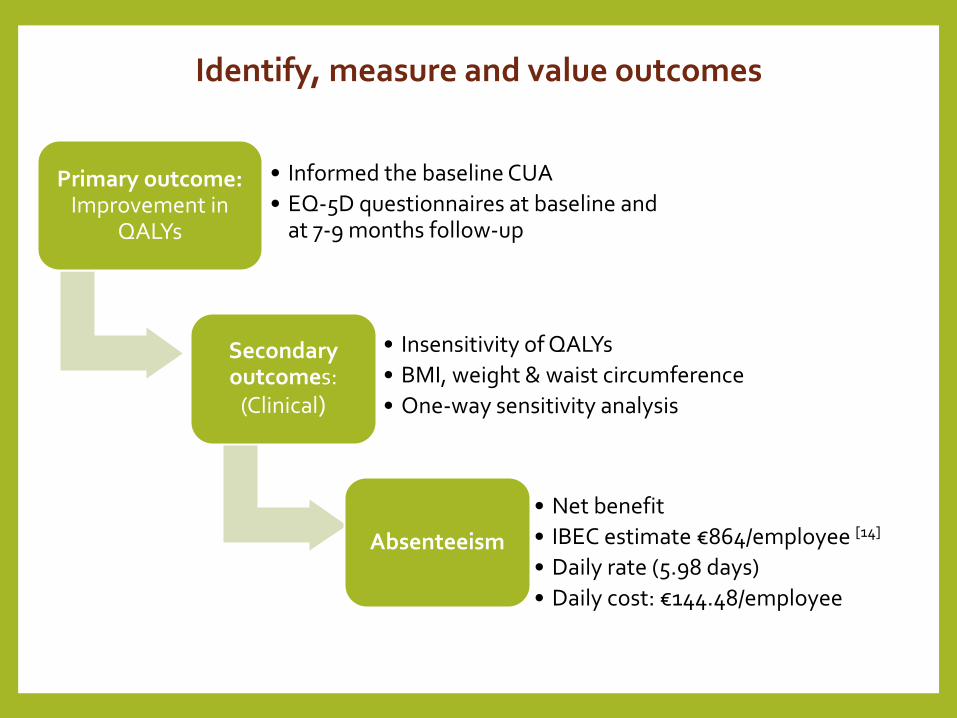
Primary outcome: Improvement in
QALYs
• Informed the baseline CUA
• EQ-5D questionnaires at baseline and at 7-9 months follow-up
Secondary outcomes:
(Clinical)
• Insensitivity of QALYs
• BMI, weight & waist circumference
• One-way sensitivity analysis
Absenteeism
• Net benefit
• IBEC estimate €864/employee [14]
• Daily rate (5.98 days)
• Daily cost: €144.48/employee
Identify, measure and value outcomes
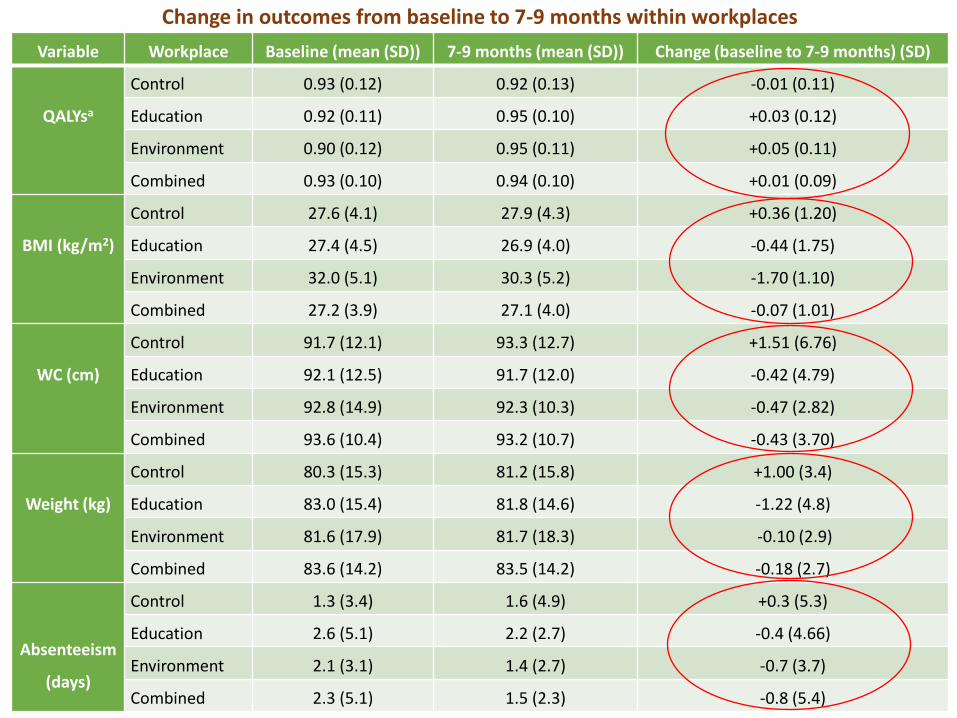
Variable Workplace Baseline (mean (SD)) 7-9 months (mean (SD)) Change (baseline to 7-9 months) (SD)
QALYsa
Control 0.93 (0.12) 0.92 (0.13) -0.01 (0.11)
Education 0.92 (0.11) 0.95 (0.10) +0.03 (0.12)
Environment 0.90 (0.12) 0.95 (0.11) +0.05 (0.11)
Combined 0.93 (0.10) 0.94 (0.10) +0.01 (0.09)
BMI (kg/m2)
Control 27.6 (4.1) 27.9 (4.3) +0.36 (1.20)
Education 27.4 (4.5) 26.9 (4.0) -0.44 (1.75)
Environment 32.0 (5.1) 30.3 (5.2) -1.70 (1.10)
Combined 27.2 (3.9) 27.1 (4.0) -0.07 (1.01)
WC (cm)
Control 91.7 (12.1) 93.3 (12.7) +1.51 (6.76)
Education 92.1 (12.5) 91.7 (12.0) -0.42 (4.79)
Environment 92.8 (14.9) 92.3 (10.3) -0.47 (2.82)
Combined 93.6 (10.4) 93.2 (10.7) -0.43 (3.70)
Weight (kg)
Control 80.3 (15.3) 81.2 (15.8) +1.00 (3.4)
Education 83.0 (15.4) 81.8 (14.6) -1.22 (4.8)
Environment 81.6 (17.9) 81.7 (18.3) -0.10 (2.9)
Combined 83.6 (14.2) 83.5 (14.2) -0.18 (2.7)
Absenteeism
(days)
Control 1.3 (3.4) 1.6 (4.9) +0.3 (5.3)
Education 2.6 (5.1) 2.2 (2.7) -0.4 (4.66)
Environment 2.1 (3.1) 1.4 (2.7) -0.7 (3.7)
Combined 2.3 (5.1) 1.5 (2.3) -0.8 (5.4)
Change in outcomes from baseline to 7-9 months within workplaces
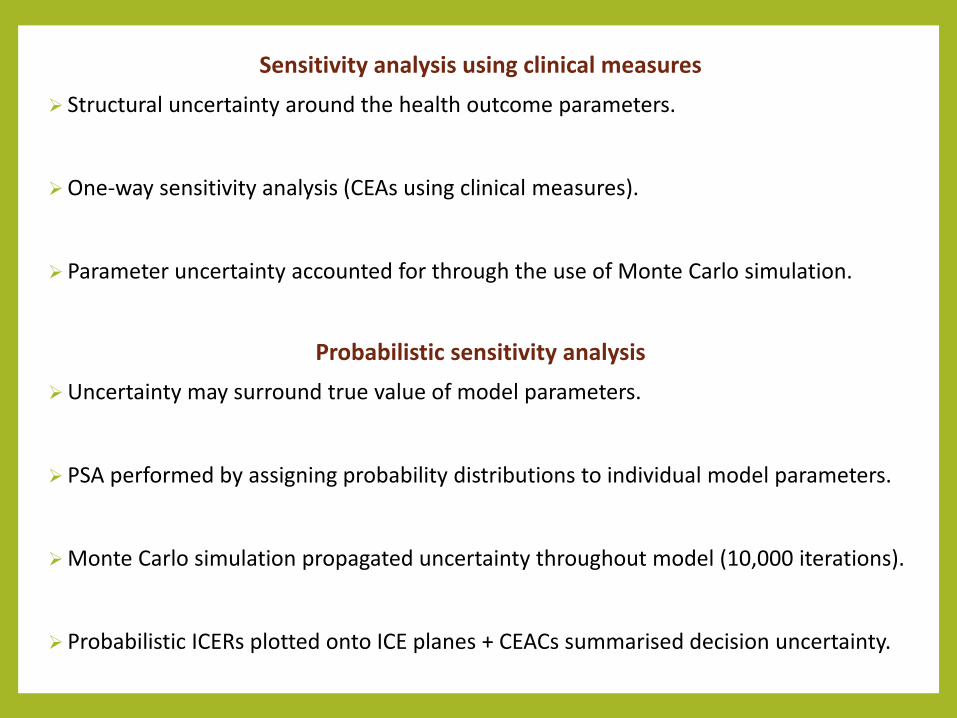
Sensitivity analysis using clinical measures
Structural uncertainty around the health outcome parameters.
One-way sensitivity analysis (CEAs using clinical measures).
Parameter uncertainty accounted for through the use of Monte Carlo simulation.
Probabilistic sensitivity analysis
Uncertainty may surround true value of model parameters.
PSA performed by assigning probability distributions to individual model parameters.
Monte Carlo simulation propagated uncertainty throughout model (10,000 iterations).
Probabilistic ICERs plotted onto ICE planes + CEACs summarised decision uncertainty.
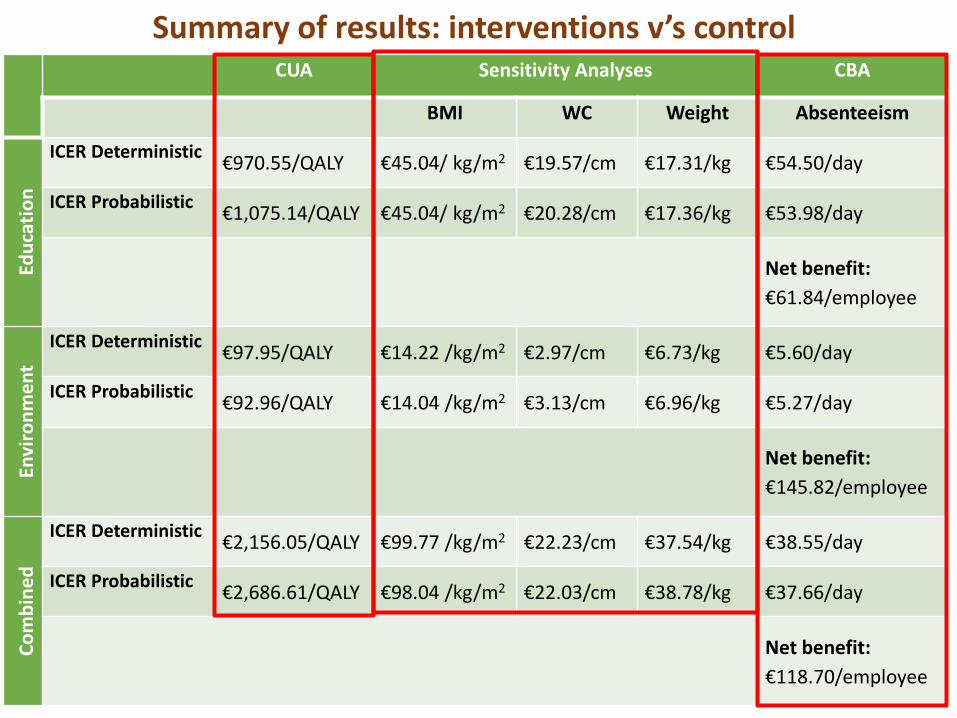
Summary of results: interventions v’s control CUA Sensitivity Analyses CBA
BMI WC Weight Absenteeism
Edu
cati
on
ICER Deterministic €970.55/QALY €45.04/ kg/m2 €19.57/cm €17.31/kg €54.50/day
ICER Probabilistic €1,075.14/QALY €45.04/ kg/m2 €20.28/cm €17.36/kg €53.98/day
Net benefit:
€61.84/employee
Envi
ron
me
nt
ICER Deterministic €97.95/QALY €14.22 /kg/m2 €2.97/cm €6.73/kg €5.60/day
ICER Probabilistic €92.96/QALY €14.04 /kg/m2 €3.13/cm €6.96/kg €5.27/day
Net benefit:
€145.82/employee
Co
mb
ine
d
ICER Deterministic €2,156.05/QALY €99.77 /kg/m2 €22.23/cm €37.54/kg €38.55/day
ICER Probabilistic €2,686.61/QALY €98.04 /kg/m2 €22.03/cm €38.78/kg €37.66/day
Net benefit:
€118.70/employee
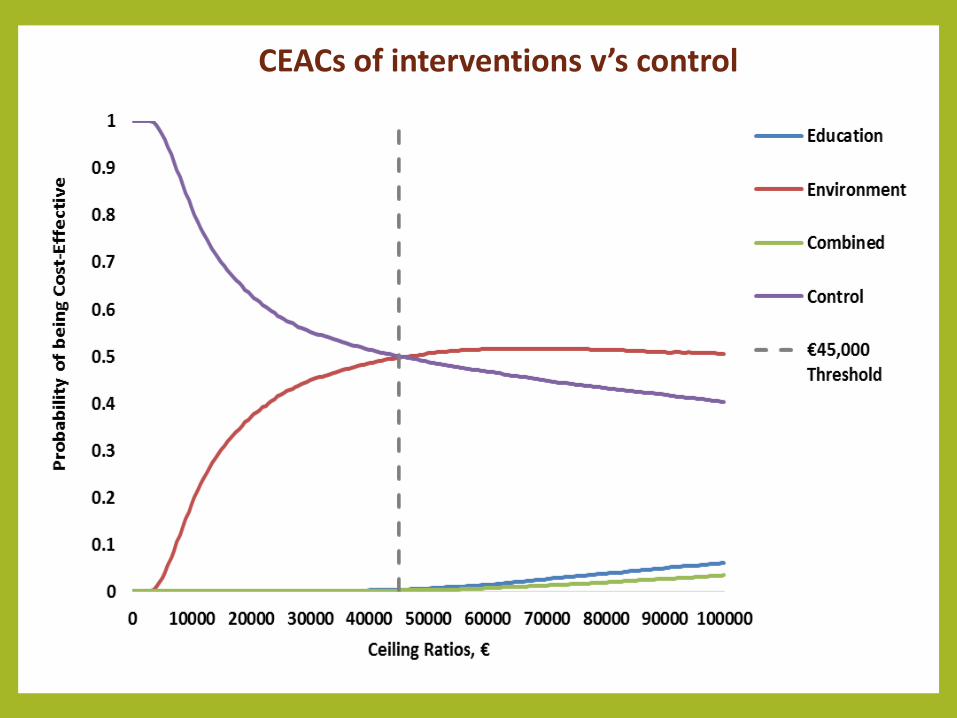
CEACs of interventions v’s control
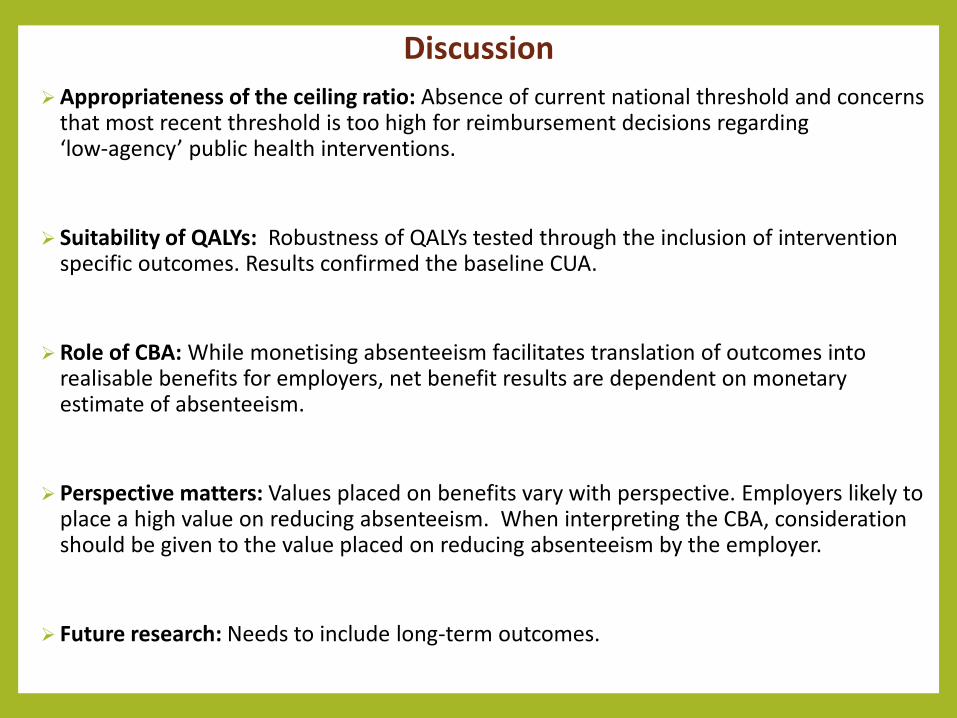
Appropriateness of the ceiling ratio: Absence of current national threshold and concerns that most recent threshold is too high for reimbursement decisions regarding ‘low-agency’ public health interventions.
Suitability of QALYs: Robustness of QALYs tested through the inclusion of intervention specific outcomes. Results confirmed the baseline CUA.
Role of CBA: While monetising absenteeism facilitates translation of outcomes into realisable benefits for employers, net benefit results are dependent on monetary estimate of absenteeism.
Perspective matters: Values placed on benefits vary with perspective. Employers likely to place a high value on reducing absenteeism. When interpreting the CBA, consideration should be given to the value placed on reducing absenteeism by the employer.
Future research: Needs to include long-term outcomes.
Discussion

FOOD CHOICE AT WORK
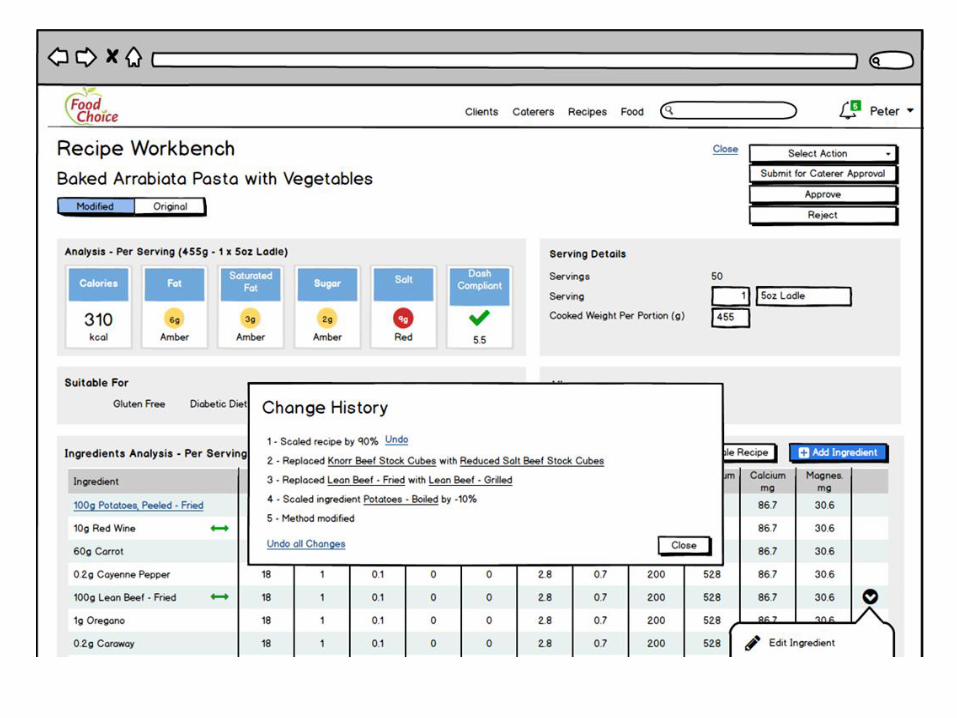
Ultimate healthy eating management system for employees, workplace stakeholders and caterers

Food Choice at Work Programme
Healthier Menus (DASH-Omni Heart Meals, Lower in FSSS & Portion Size Guidance)
Ground-Breaking Solutions for a Healthier Eating Environment (choice architecture)
Daily Application of Our Calorie & Traffic Light Coding System
Strategic Positioning of Healthier Alternatives
Monthly Nutrition Themes: Emails, Posters & Video Sessions
Health Check and Nutrition Clinics

Our Team
Management • Dr Fiona Geaney
• Frank Beechinor
• Clare Kelly
Research and Development • Professor Ivan Perry
• Sarah Fitzgerald, Post-doctorate
• Karen Buckley O’Farrell, MPH Intern
Workplace leaders • Jessica Scotto Di
Marrazzo
• Clodagh Murphy
• Lauri Gilgan
• Louise Welland
A highly experienced team of research nutritionists and dieticians implement, monitor and evaluate our programme in each workplace
Sell directly to the corporate customers and indirectly through catering partners

Customers so far… 2017 Customers...
Conclusion
• Food Choice at Work represents a potentially viable model that is effective and feasible to implement in all public and private workplace settings.
• If adopted by healthcare/ workplace stakeholders + policy makers may reduce the prevalence + economic burden of diet-related disease nationally and internationally.

Thank you for your time.
Any questions?