scenarios/modeling/backcasting: tools and examples … modeling... · analytic hierarchy process...
TRANSCRIPT

Scenarios/Modeling/Backcasting:
Tools and examples of low-carbon cites
Kei GOMI (五味 馨)Graduate School of Global Environmental Studies, Kyoto University
16th Feb 2010
Sustainable and Low-carbon development in Indonesia and Asia: Dialogues between policy makers and scientists
IPB International Conference Centre, Bogor, Indonesia
2
Contents
• Local Low-carbon society targets
• Methodology
• AIM tools for Local LCS
– Extended snapshot tool (ExSS)
– Socio-economic design template (SED template)
– Backcasting tool (BCT)
– Analytic hierarchy process tool (AHP tool )
– Input-Output table reconciliation tool (IOTR)
• An example in Shiga prefecture
3
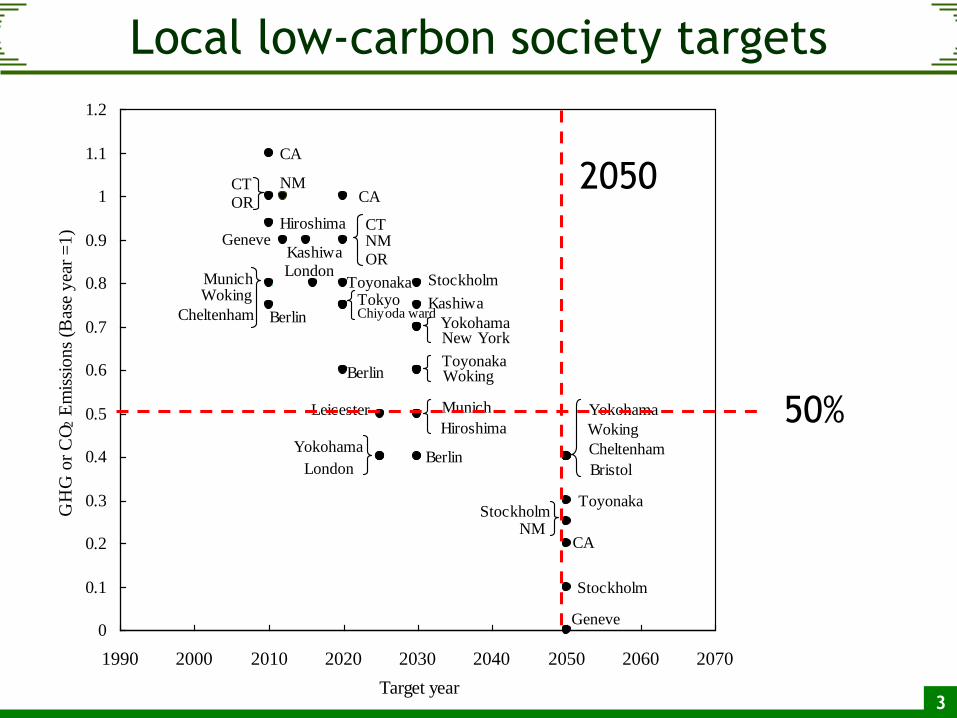
Local low-carbon society targets
CA
Stockholm
Hiroshima
London
London Bristol
Cheltenham
Cheltenham
Woking
Woking
Woking
Leicester
CA
CA
NM
NM
NM
CT
CT
OR
OR
Stockholm
Stockholm
Berlin
Berlin
Berlin
Munich
Munich
Toyonaka
Toyonaka
Toyonaka
Yokohama
Yokohama
Geneve
Geneve
Yokohama
Hiroshima
KashiwaChiyoda ward
Kashiwa
Tokyo
New York
0
0.1
0.2
0.3
0.4
0.5
0.6
0.7
0.8
0.9
1
1.1
1.2
1990 2000 2010 2020 2030 2040 2050 2060 2070
Target year
GH
G o
r C
O2 E
mis
sions
(Bas
e yea
r =
1)
.
50%
2050
4
A methodology to develop Local low-carbon
society scenarios
•Backcasting approach
• “Designing a future”
•Procedure of the methodology
5
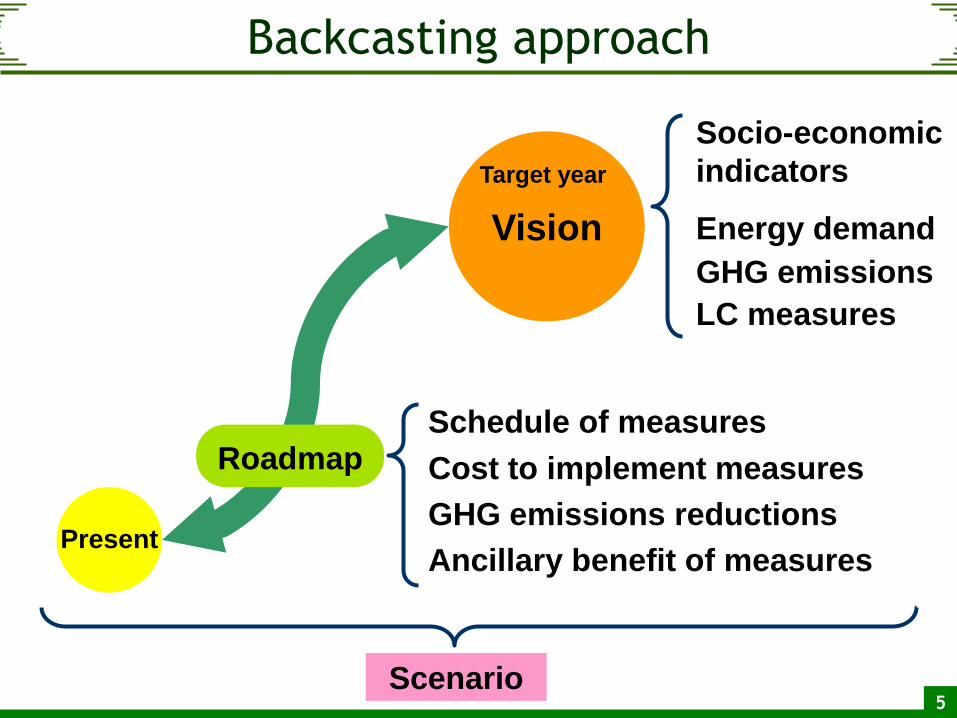
Backcasting approach
Vision
Socio-economic
indicators
Energy demand
GHG emissions
LC measures
Target year
RoadmapSchedule of measures
Cost to implement measures
GHG emissions reductions
Ancillary benefit of measuresPresent
Scenario

6
Designing a future• GHG emission is related
to most of the activities in the society.
• Required low-carbon measures strongly depends on the situation.
• Therefore, consider both;
– situation of the society as a whole
– detailed technologies used in the society.
• Follow-up (e.g. every five years)
Economic
growth rate
Industrial
structure
Transport
systemLifestyle
Building
stockLand-use
structure
Power
supply
End-use
energy device
Demography

7
Procedure(1) Target setting
(3) Socio-
economic scenario
development
(4) Developing low-
carbon measures
database
(6) Estimating a quantitative
snapshot as a LCS
(7) Developing a
system of detailed
measures
(8) Setting
quantitative
information of
measures
(9) Estimating a
roadmap using BCT
(5) Evaluation of
measures’
integrated effect
(implementation)
(2) Information collection
(10) Follow-up

8
AIM tools(1) Target setting
(3) Socio-
economic scenario
development
(4) Developing low-
carbon measures
database
(6) Estimating a quantitative
snapshot as a LCS
(7) Developing a
system of detailed
measures
(8) Setting
quantitative
information of
measures
(9) Estimating a
roadmap using BCT
(5) Evaluation of
measures’
integrated effect
(implementation)
(2) Information collection
(10) Follow-up
AHP tool
BCT
SED template
ExSS
IOTR
LCBD
9
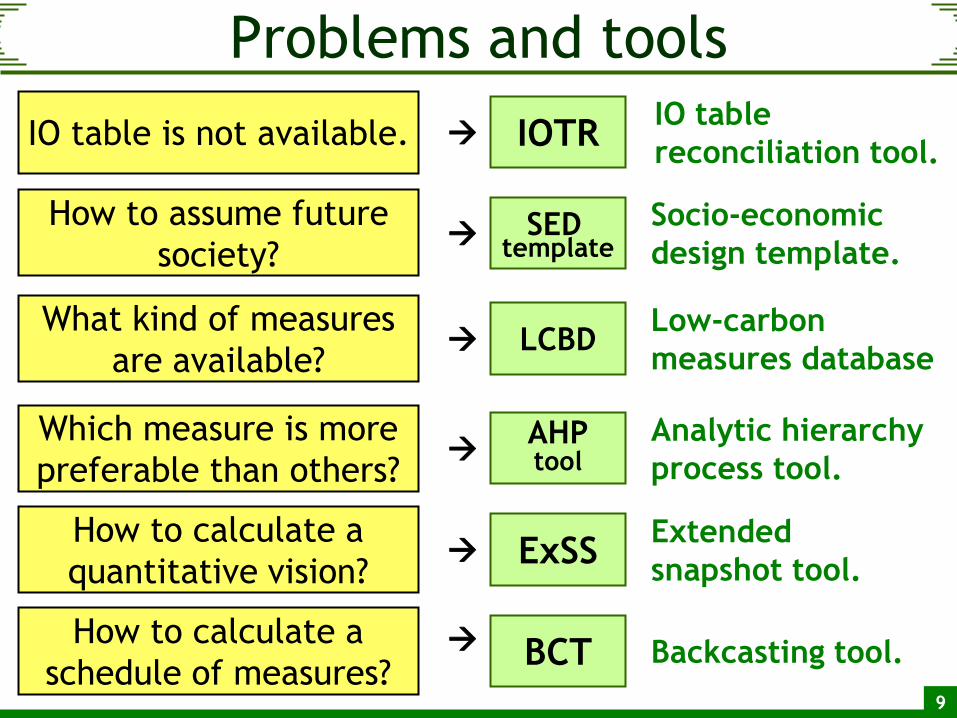
Problems and tools
AHPtool
BCT
SEDtemplate
ExSS
IOTRIO table is not available.
How to assume future
society?
Which measure is more
preferable than others?
How to calculate a
quantitative vision?
How to calculate a
schedule of measures?
IO table
reconciliation tool.
Socio-economic
design template.
Analytic hierarchy
process tool.
Extended
snapshot tool.
Backcasting tool.
LCBDWhat kind of measures
are available?
Low-carbon
measures database
10
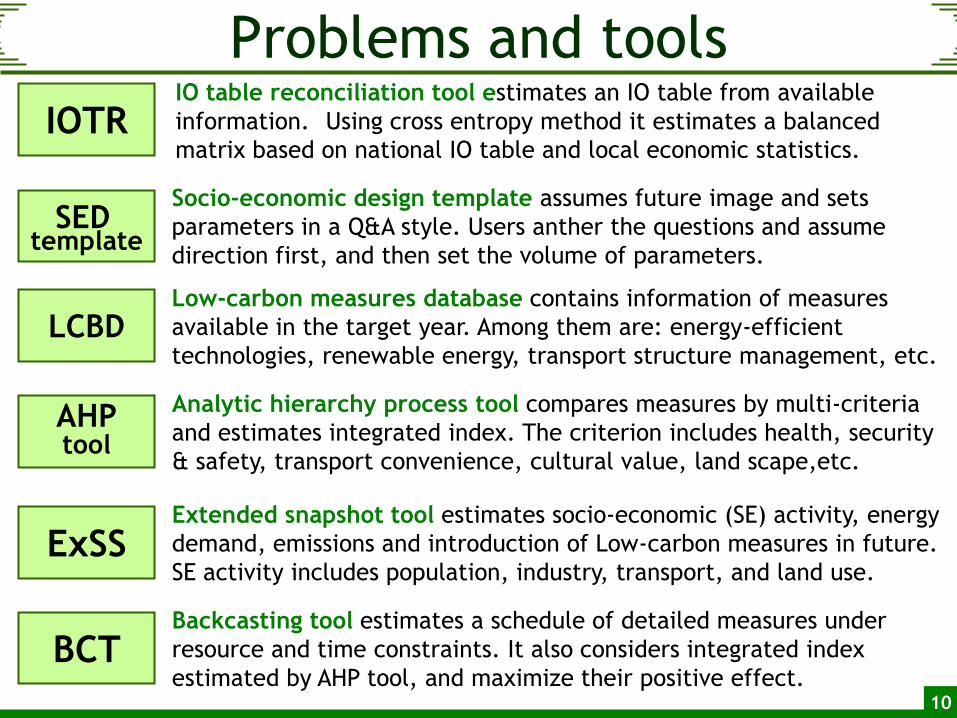
Problems and tools
AHPtool
BCT
SEDtemplate
ExSS
IOTRIO table reconciliation tool estimates an IO table from available
information. Using cross entropy method it estimates a balanced
matrix based on national IO table and local economic statistics.
Socio-economic design template assumes future image and sets
parameters in a Q&A style. Users anther the questions and assume
direction first, and then set the volume of parameters.
Analytic hierarchy process tool compares measures by multi-criteria
and estimates integrated index. The criterion includes health, security
& safety, transport convenience, cultural value, land scape,etc.
Extended snapshot tool estimates socio-economic (SE) activity, energy
demand, emissions and introduction of Low-carbon measures in future.
SE activity includes population, industry, transport, and land use.
Backcasting tool estimates a schedule of detailed measures under
resource and time constraints. It also considers integrated index
estimated by AHP tool, and maximize their positive effect.
LCBDLow-carbon measures database contains information of measures
available in the target year. Among them are: energy-efficient
technologies, renewable energy, transport structure management, etc.

11
SED template, LCDB and ExSS
Questions of various
aspects of the
future society
Decide number of
socio-economic
parameters
Calculation
using ExSS
Socio-economic Indicators,
Energy demand,
GHG emission
Setting LC measures
implementation in the
target year
(energy parameters)
SED template
ExSS
LCDB
12
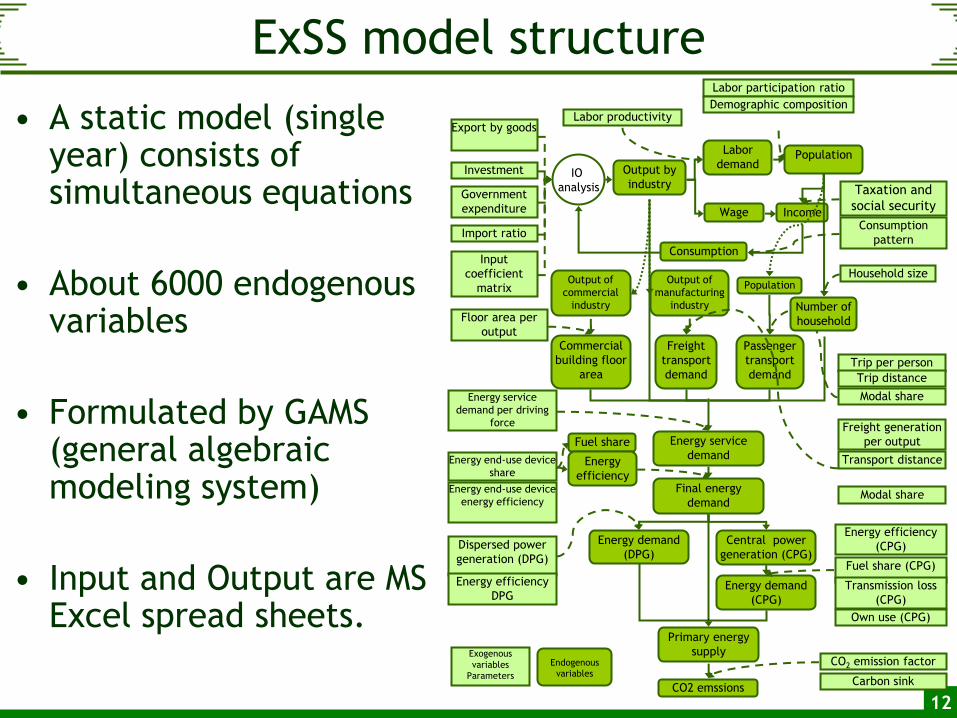
ExSS model structure
• A static model (single year) consists of simultaneous equations
• About 6000 endogenous variables
• Formulated by GAMS (general algebraic modeling system)
• Input and Output are MS Excel spread sheets.
Wage Income
Export by goods
Government
expenditure
Investment
Import ratio
Input
coefficient
matrix
Labor productivity
Labor participation ratio
Household size
Consumption
pattern
Demographic composition
Taxation and
social security
Floor area per
output
Freight generation
per output
Transport distance
Modal share
Trip per person
Trip distance
Modal shareEnergy service
demand per driving
force
Fuel share
Energy
efficiency
CO2 emission factor
IO
analysis
Output by
industry
Consumption
Labor
demandPopulation
Number of
household
Output of
commercial
industry
Commercial
building floor
area
Freight
transport
demand
Passenger
transport
demand
Population
Energy service
demand
Output of
manufacturing
industry
Exogenous
variables
Parameters
Endogenous
variables
Final energy
demand
Energy demand
(DPG)
Central power
generation (CPG)
Energy demand
(CPG)
Primary energy
supply
Dispersed power
generation (DPG)
CO2 emssions
Energy efficiency
DPG
Energy efficiency
(CPG)
Fuel share (CPG)
Transmission loss
(CPG)
Own use (CPG)
Energy end-use device
share
Energy end-use device
energy efficiency
Carbon sink
13
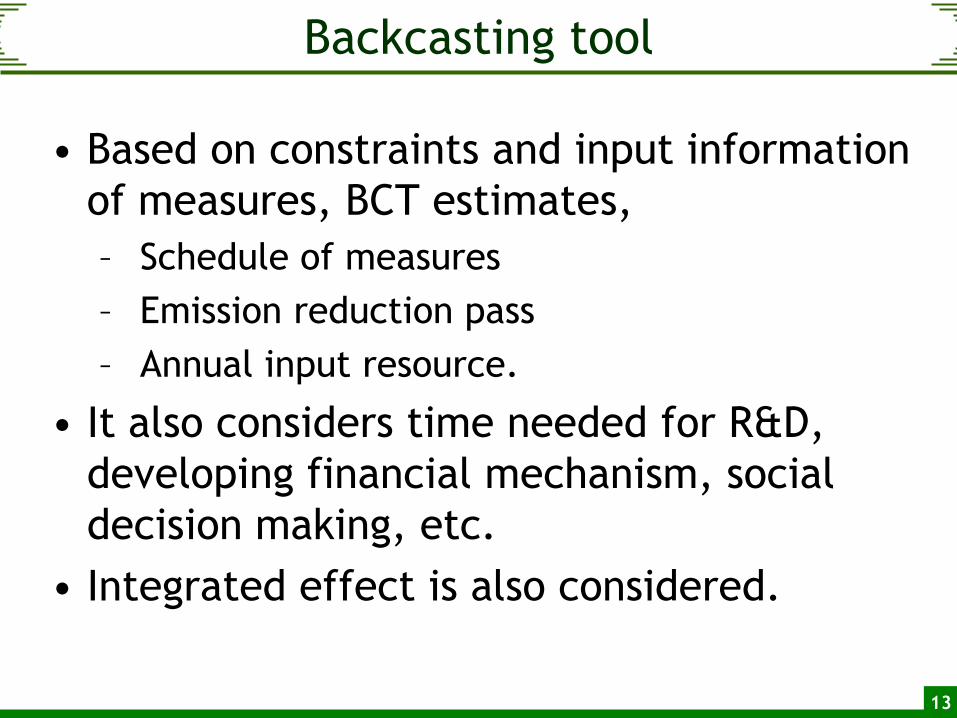
Backcasting tool
• Based on constraints and input information
of measures, BCT estimates,
– Schedule of measures
– Emission reduction pass
– Annual input resource.
• It also considers time needed for R&D,
developing financial mechanism, social
decision making, etc.
• Integrated effect is also considered.
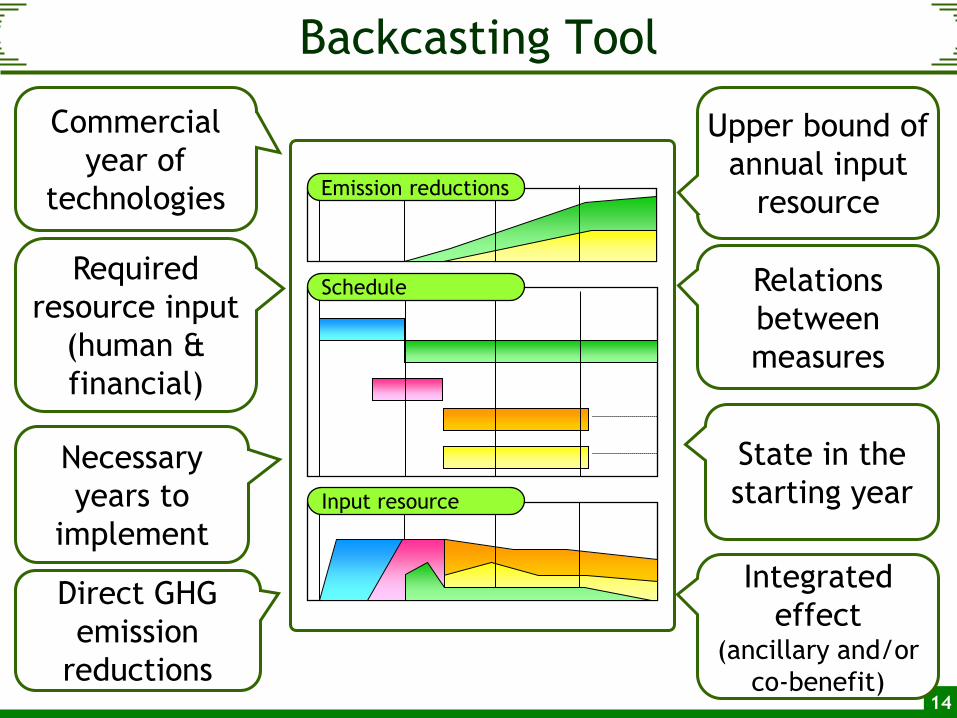
14
Commercial
year of
technologies
Necessary
years to
implement
Direct GHG
emission
reductions
Upper bound of
annual input
resource
Relations
between
measures
State in the
starting year
Required
resource input
(human &
financial)
Integrated
effect(ancillary and/or
co-benefit)
Schedule
Emission reductions
Input resource
Backcasting Tool
15
• An application to Shiga prefecture,
Japan.
– Three environmental targets
– Moderate economic growth
– Industrial structure change

16
About Shiga prefecture
KyotoOsaka
NagoyaKobe
17
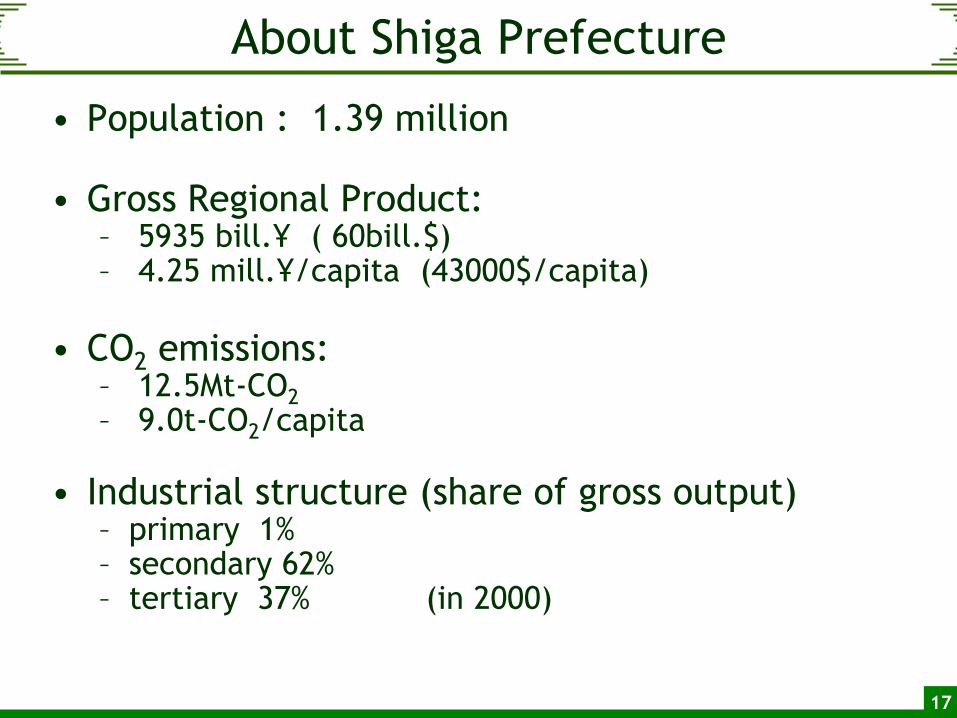
About Shiga Prefecture
• Population : 1.39 million
• Gross Regional Product: – 5935 bill.¥ ( 60bill.$)– 4.25 mill.¥/capita (43000$/capita)
• CO2 emissions: – 12.5Mt-CO2
– 9.0t-CO2/capita
• Industrial structure (share of gross output)– primary 1%– secondary 62%– tertiary 37% (in 2000)
18
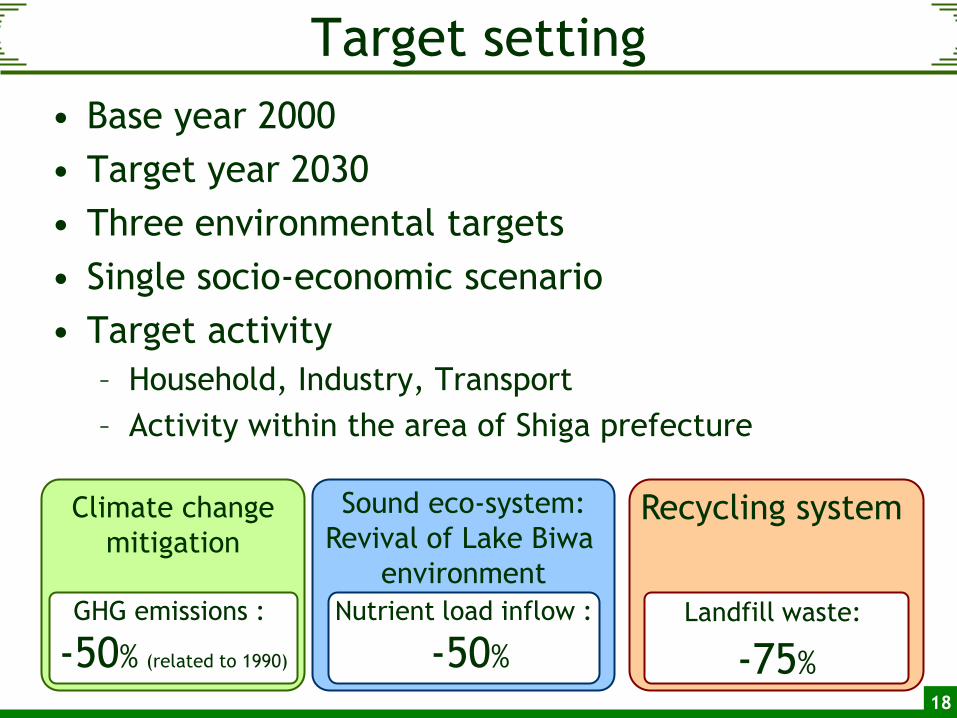
Target setting
• Base year 2000
• Target year 2030
• Three environmental targets
• Single socio-economic scenario
• Target activity
– Household, Industry, Transport
– Activity within the area of Shiga prefecture
Climate change
mitigation
Sound eco-system:
Revival of Lake Biwa
environment
Recycling system
GHG emissions :
-50% (related to 1990)
Nutrient load inflow :
-50%
Landfill waste:
-75%

19
ExSS: further extension
Output by
industry
PopulationNumber of
household
Commercial
building floor
area
Freight
transport
demand
Passenger
transport
demand
Land use
demand
Agriculture
production
Number of
livestock
Municipal waste
generation
Waste
landfill
CH4 emission
from griculture
Carbon sink
(forest)
Waste
incineration
CO2 emission
from incineration
CH4 emission
from landfill
Water nutrient
load emission
Water quality
GHGs Water Waste
Industrial waste
generation
20
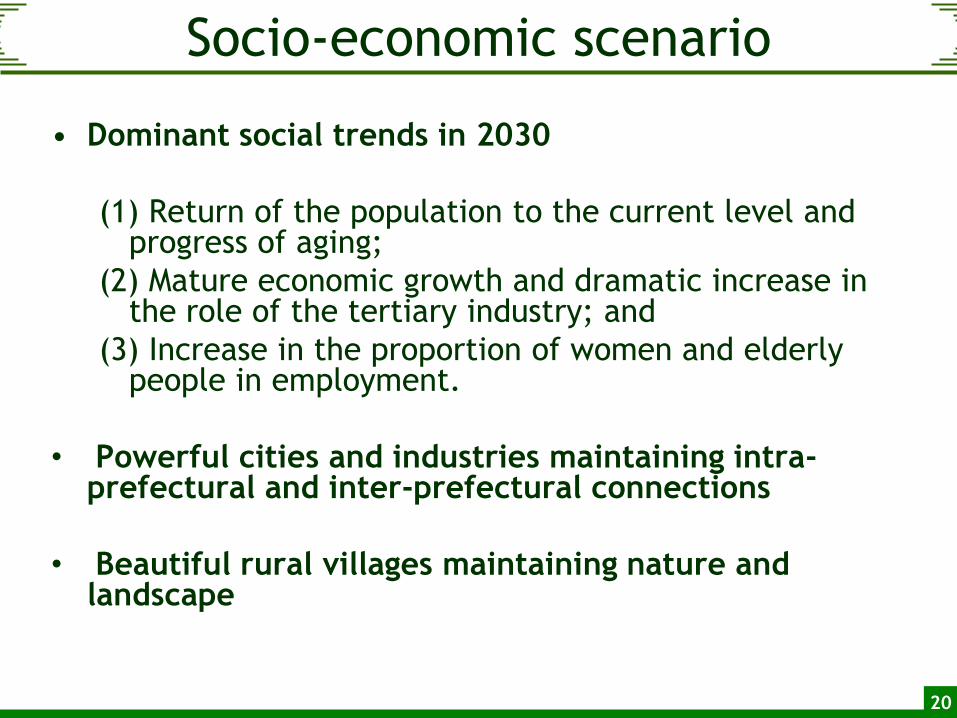
Socio-economic scenario
• Dominant social trends in 2030
(1) Return of the population to the current level and progress of aging;
(2) Mature economic growth and dramatic increase in the role of the tertiary industry; and
(3) Increase in the proportion of women and elderly people in employment.
• Powerful cities and industries maintaining intra-prefectural and inter-prefectural connections
• Beautiful rural villages maintaining nature and landscape
21
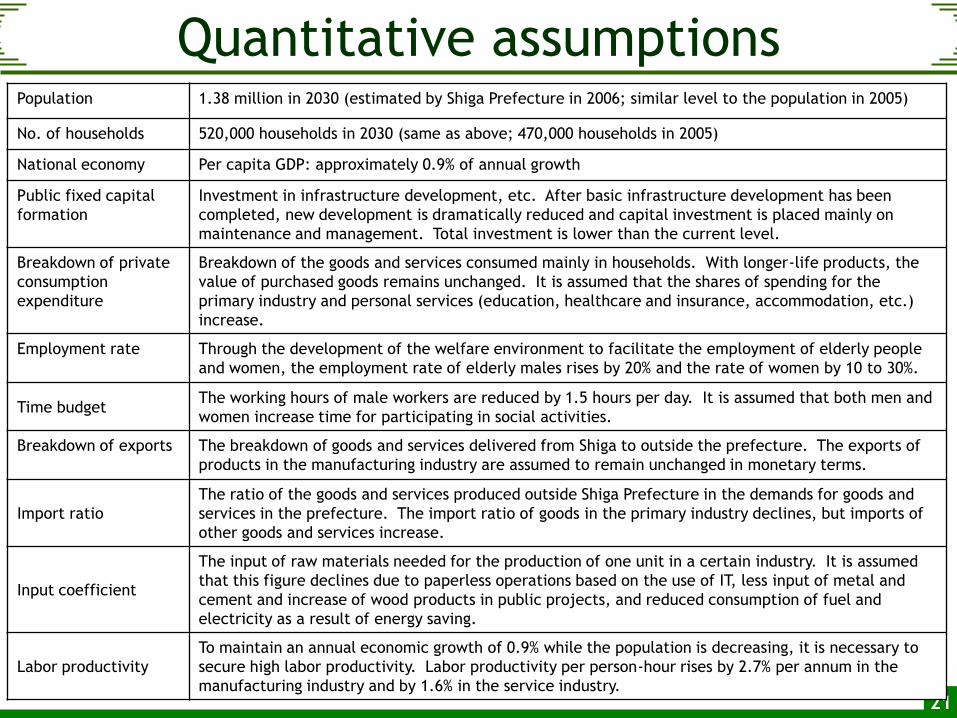
Quantitative assumptionsPopulation 1.38 million in 2030 (estimated by Shiga Prefecture in 2006; similar level to the population in 2005)
No. of households 520,000 households in 2030 (same as above; 470,000 households in 2005)
National economy Per capita GDP: approximately 0.9% of annual growth
Public fixed capital
formation
Investment in infrastructure development, etc. After basic infrastructure development has been
completed, new development is dramatically reduced and capital investment is placed mainly on
maintenance and management. Total investment is lower than the current level.
Breakdown of private
consumption
expenditure
Breakdown of the goods and services consumed mainly in households. With longer-life products, the
value of purchased goods remains unchanged. It is assumed that the shares of spending for the
primary industry and personal services (education, healthcare and insurance, accommodation, etc.)
increase.
Employment rate Through the development of the welfare environment to facilitate the employment of elderly people
and women, the employment rate of elderly males rises by 20% and the rate of women by 10 to 30%.
Time budgetThe working hours of male workers are reduced by 1.5 hours per day. It is assumed that both men and
women increase time for participating in social activities.
Breakdown of exports The breakdown of goods and services delivered from Shiga to outside the prefecture. The exports of
products in the manufacturing industry are assumed to remain unchanged in monetary terms.
Import ratio
The ratio of the goods and services produced outside Shiga Prefecture in the demands for goods and
services in the prefecture. The import ratio of goods in the primary industry declines, but imports of
other goods and services increase.
Input coefficient
The input of raw materials needed for the production of one unit in a certain industry. It is assumed
that this figure declines due to paperless operations based on the use of IT, less input of metal and
cement and increase of wood products in public projects, and reduced consumption of fuel and
electricity as a result of energy saving.
Labor productivity
To maintain an annual economic growth of 0.9% while the population is decreasing, it is necessary to
secure high labor productivity. Labor productivity per person-hour rises by 2.7% per annum in the
manufacturing industry and by 1.6% in the service industry.
22
Population Household
Passenger transport
Freight transport
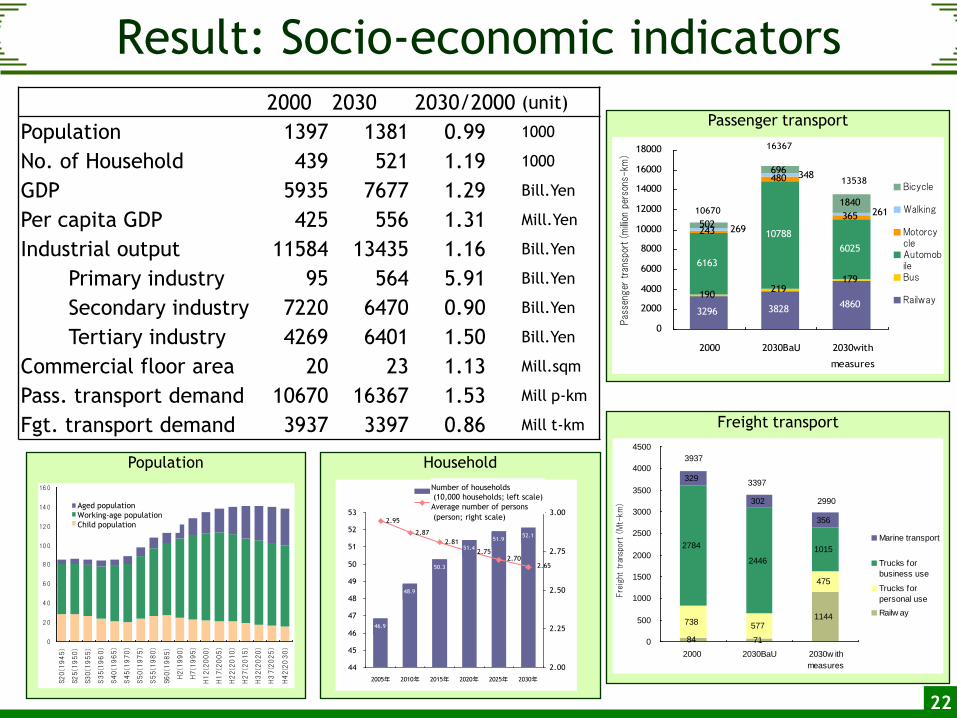
Result: Socio-economic indicators
0
20
40
60
80
100
120
140
160
S20(1
945)
S25(1
950)
S30(1
955)
S35(1960)
S40(1
965)
S45(1
970)
S50(1
975)
S55(1
980)
S60(1
985)
H2(1
990)
H7(1
995)
H12(2
000)
H17(2
005)
H22(2
010)
H27(2
015)
H32(2
020)
H37(2025)
H42(2030)
老年 人口
生産 年齢人口
年少 人口
Aged population
Working-age population
Child population
3296 38284860
190219
179
6163
10788
6025
243
480
365502
1840
348
269
261
696
0
2000
4000
6000
8000
10000
12000
14000
16000
18000
2000 2030BaU 2030with
measures
Pas
seng
er t
rans
port (
million
per
sons
-km
)
Bicycle
Walking
MotorcycleAutomobileBus
Railway
10670
16367
13538
84 71
1144738 577
475
2784
2446
1015
329
302
356
0
500
1000
1500
2000
2500
3000
3500
4000
4500
2000 2030BaU 2030w ith
measures
Fre
ight
tra
nspo
rt (
Mt-
km
)
Marine transport
Trucks for
business use
Trucks for
personal use
Railw ay
3937
3397
2990
2000 2030 2030/2000 (unit)
Population 1397 1381 0.99 1000
No. of Household 439 521 1.19 1000
GDP 5935 7677 1.29 Bill.Yen
Per capita GDP 425 556 1.31 Mill.Yen
Industrial output 11584 13435 1.16 Bill.Yen
Primary industry 95 564 5.91 Bill.Yen
Secondary industry 7220 6470 0.90 Bill.Yen
Tertiary industry 4269 6401 1.50 Bill.Yen
Commercial floor area 20 23 1.13 Mill.sqm
Pass. transport demand 10670 16367 1.53 Mill p-km
Fgt. transport demand 3937 3397 0.86 Mill t-km
46.9
48.9
50.3
51.4
51.952.1
2.95
2.87
2.81
2.652.70
2.75
44
45
46
47
48
49
50
51
52
53
2005年 2010年 2015年 2020年 2025年 2030年
2.00
2.25
2.50
2.75
3.00
世帯数 (万世帯:左目盛)
平均世帯人員 (人:右目盛)
Number of households
(10,000 households; left scale)
Average number of persons
(person; right scale)

23
GHG emissions by sector
Result: Energy and GHG
600469
960
924
897
416
335
12401686
2114
1430
12631013
67496383
6436
3769
1155
2906
1734
10801149
240101
283
235
156
165
303
303
-477
-2000
0
2000
4000
6000
8000
10000
12000
14000
16000
1990 2000 2030BaU 2030with
measures
GHG e
missions
(1,0
00 t
-CO2eq)
Forestabsorption
Agriculture(methane)
Wasteincineration
Industrialprocess
FreightTransport
PassengerTransport
Industry
Businessoprrations
Household
12496
12877
14369
6276
Carbon Sink
Agriculture (methane)
Waste incineration
Industrial process
Freight transport
Passenger transport
Industry
Commercial
Household
Primary energy demand
319
2643 3043
1160
10501056
886
405
498
361
109
231
542650
87
12085
25
0
1000
2000
3000
4000
5000
6000
2000 2030BaU 2030CM
Pri
mary
energ
y dem
and (
kto
e)
Coal Oil Natural gas Nuclear power Hydropower Renewables
4883 5344
3044
24
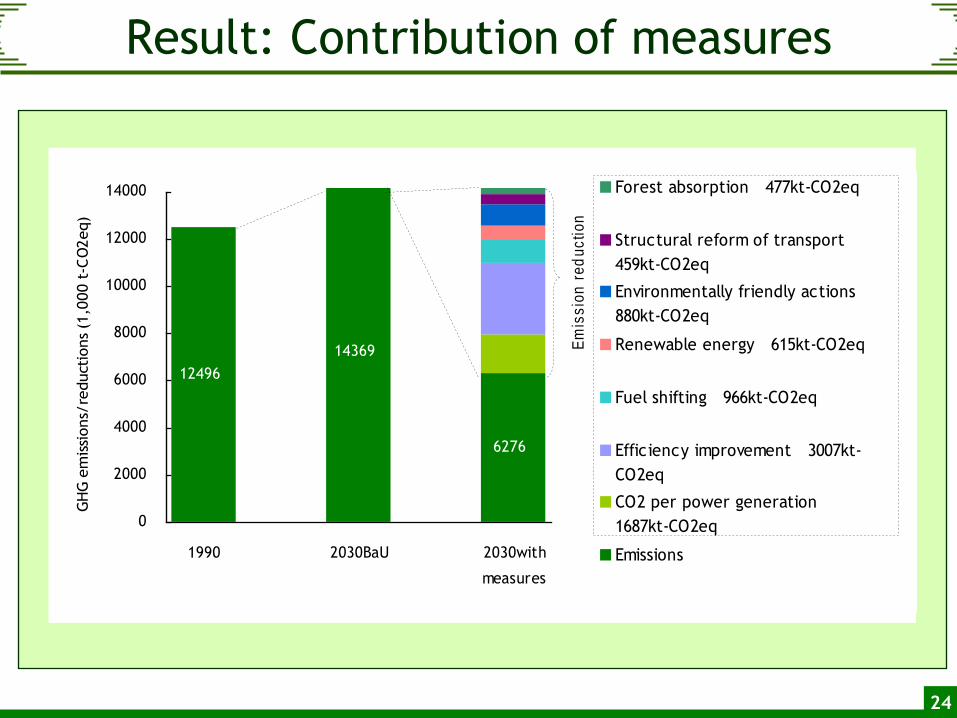
Result: Contribution of measures
12496
14369
6276
0
2000
4000
6000
8000
10000
12000
14000
1990 2030BaU 2030with
measures
GH
G e
mis
sions/
reduct
ions
(1,0
00 t
-CO
2eq)
Forest absorption 477kt-CO2eq
Structural reform of transport
459kt-CO2eq
Environmentally friendly actions
880kt-CO2eq
Renewable energy 615kt-CO2eq
Fuel shifting 966kt-CO2eq
Efficiency improvement 3007kt-
CO2eq
CO2 per power generation
1687kt-CO2eq
Emissions
Em
iss
ion
re
du
cti
on

25
Result: Water nutrient load
4.0
0.5
1.6
0.3
0.6
0.7
8.0
4.4
0.1
0.1
1.9
1.6
0
2
4
6
8
10
12
14
16
18
2000 2030
Load f
low
s in
to L
akeBiw
a(k
t/y)
7.7
16.2
1.8
0.9
0.6
0.2
0.3
0.4
3.0
0.9
0.4
0.4
0.7
0.6
0
1
2
3
4
5
6
7
8
2000 2030
6.7
3.3
0.16
0.01
0.05
0.02
0.12
0.02
0.02
0.02
0.02
0.010.0070.02
0.0
0.1
0.2
0.3
0.4
0.5
2000 2030
Rainfall on the Lake surface
Groundwater
Landuse
Livestock
Factories
Households
0.38
0.09
COD TN TP

26
Generation and landfill of
industrial waste
Generation and landfill of
municipal waste
Result: Waste landfill
286 146 71
1664 19102315
156198
259
18941950
2371
0
1000
2000
3000
4000
5000
6000
2000年 2004年 2030年
千トン
減量化量
有償物量
再生利用量
最終処分量
40004203
5017
Reduced
Valuable
Recycled
Landfill
Kt
92
23
28.9
100.8
39
260
345
60
4.9
0.4
0
100
200
300
400
500
600
2000年 2030年
千トン
自家処理量
減量化量
再生利用量
集団回収量
最終処分量
509
444 Treated at home
Reduced
Recycled
Group separation
and collection
Landfill
Kt
92
23
28.9
100.8
39
260
345
60
4.9
0.4
0
100
200
300
400
500
600
2000年 2030年
千トン
自家処理量
減量化量
再生利用量
集団回収量
最終処分量
509
444 Treated at home
Reduced
Recycled
Group separation
and collection
Landfill
Kt
92
23
28.9
100.8
39
260
345
60
4.9
0.4
0
100
200
300
400
500
600
2000年 2030年
千トン
自家処理量
減量化量
再生利用量
集団回収量
最終処分量
509
444 Treated at home
Reduced
Recycled
Group separation
and collection
Landfill
Kt
92
23
28.9
100.8
39
260
345
60
4.9
0.4
0
100
200
300
400
500
600
2000年 2030年
千トン
自家処理量
減量化量
再生利用量
集団回収量
最終処分量
509
444 Treated at home
Reduced
Recycled
Group separation
and collection
Landfill
Kt
27
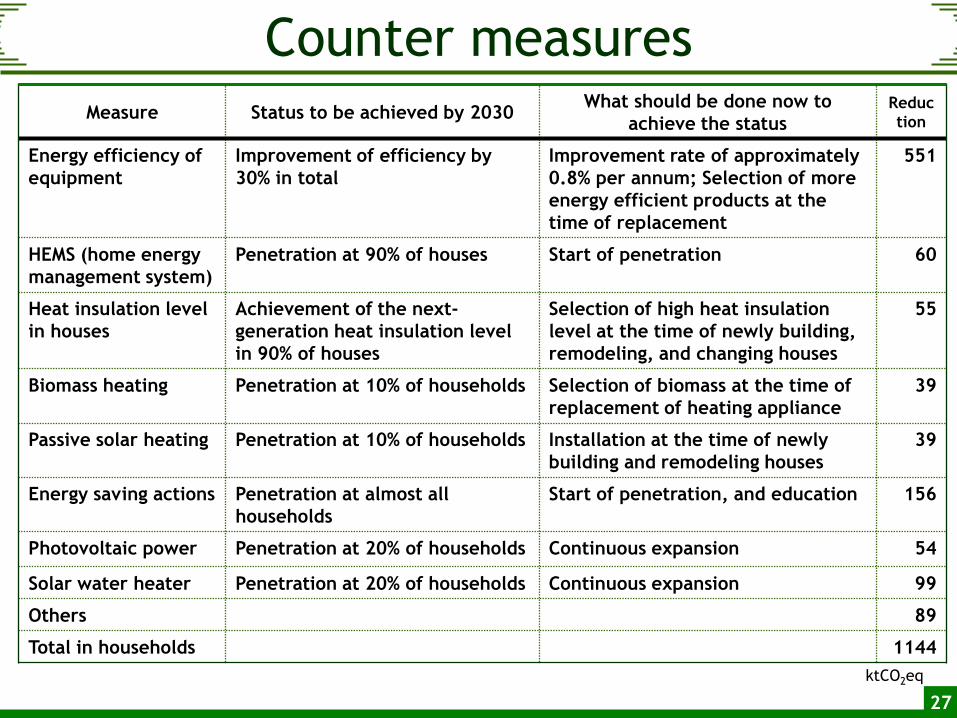
Counter measures
Measure Status to be achieved by 2030What should be done now to
achieve the statusReduc
tion
Energy efficiency of
equipment
Improvement of efficiency by
30% in total
Improvement rate of approximately
0.8% per annum; Selection of more
energy efficient products at the
time of replacement
551
HEMS (home energy
management system)
Penetration at 90% of houses Start of penetration 60
Heat insulation level
in houses
Achievement of the next-
generation heat insulation level
in 90% of houses
Selection of high heat insulation
level at the time of newly building,
remodeling, and changing houses
55
Biomass heating Penetration at 10% of households Selection of biomass at the time of
replacement of heating appliance
39
Passive solar heating Penetration at 10% of households Installation at the time of newly
building and remodeling houses
39
Energy saving actions Penetration at almost all
households
Start of penetration, and education 156
Photovoltaic power Penetration at 20% of households Continuous expansion 54
Solar water heater Penetration at 20% of households Continuous expansion 99
Others 89
Total in households 1144
ktCO2eq

28
Policy recommendation
Main efforts and actions required for the respective players to
achieve different environmental targets
Realization of a low
carbon economy
Rehabilitation of the
environment of Lake Biwa
Establishment of a
recycling system
Businesses Introduction of high
efficiency production
equipment
Fuel switching in
manufacturing and
transportation
More efficient logistics
and modal shift
Reduction of water pollutant
loads per production value
Recycling of waste
Development of efficient
recycling plants
Citizen Environmentally friendly
houses
Penetration of fuel-
efficient passenger
vehicles
Energy saving actions
Use of railway, bicycles,
and walking
Kitchen management
Reuse of bathwater and
rainwater
Control of municipalwaste generation through
the use of rented and
leased goods
Separation and recycling
of domestic waste
Local
government
s, etc.
Maintenance of forests
formation of compact
cities
Encouragement of modal
shift
Development of sewage
systems and reception of
industrial effluent
Measures for drainage in urban
Direct purification of river
water and dredging
Conversion to natural
lakeshores
Establishment of a
system for the reuse and
recycling of municipalwaste
Establishment of
efficient
recycling routes
29
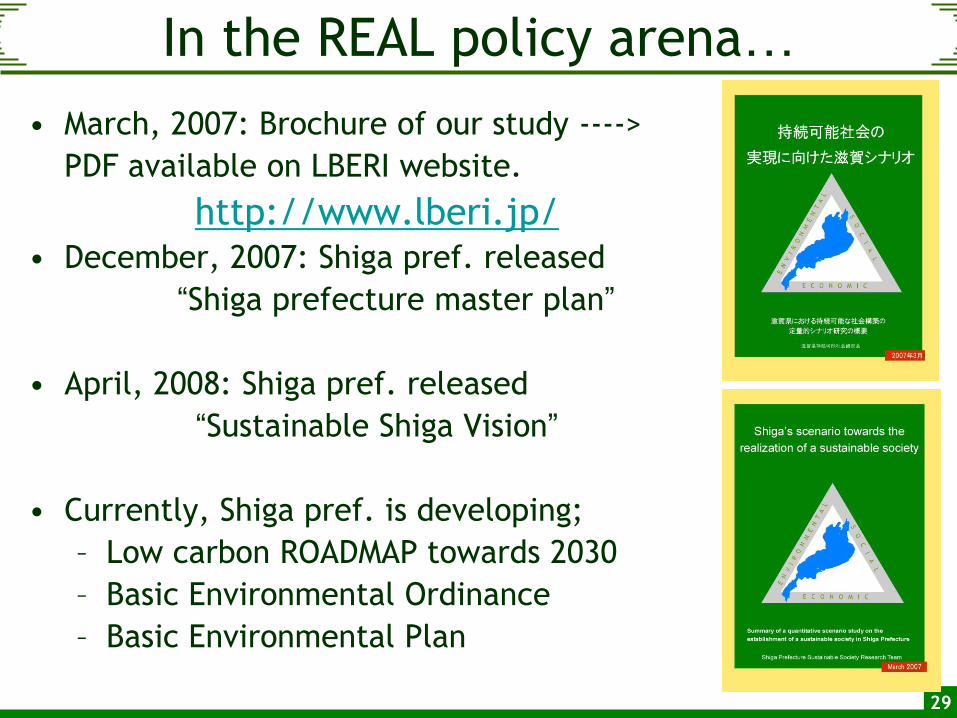
In the REAL policy arena…
• March, 2007: Brochure of our study ---->
PDF available on LBERI website.
http://www.lberi.jp/• December, 2007: Shiga pref. released
“Shiga prefecture master plan”
• April, 2008: Shiga pref. released
“Sustainable Shiga Vision”
• Currently, Shiga pref. is developing;
– Low carbon ROADMAP towards 2030
– Basic Environmental Ordinance
– Basic Environmental Plan

30Pdf available on NIES website
For other cities
• Completed – Kyoto city, Japan
– Johor (Iskandar Malaysia)
– Ahmedabad, India
• Proceeding/plannning– Higashi-ohmi, Japan
– Nagasaki, Japan
– Hanoi, Vietnum
– Dalian, China
– Guangzhou, China
– Bhopal, India