science (1)
TRANSCRIPT
Electrochemical corrosion monitoring ofgalvanized steel under cyclic wet±dry
conditions
Gamal Ahmed El-Mahdy*, 1, Atsushi Nishikata, Tooru Tsuru
Department of Metallurgical Engineering, Tokyo Institute of Technology, 2-12-1, O-okayama, Meguro-
ku, Tokyo, 152, Japan
Received 18 January 1999; accepted 24 February 1999
Abstract
The corrosion behavior of a galvanized steel was investigated under cyclic wet±dryenvironments using electrochemical techniques. The wet±dry cyclic was conducted byexposure to alternate conditions of 1 h-immersion in a 0.05 M NaCl solution (or Na2SO4
solution) and 7 h-drying at 60% RH. The polarization resistance Rp of the galvanized steel
was monitored during the wet±dry cycles by AC impedance method. Simultaneously, thecorrosion potential Ecorr was measured only when the specimen was immersed in thesolution. The corrosion current density icorr of the zinc coating was estimated from the
monitored Rp using Stern±Geary equation. The corrosion mass loss DM, which wasobtained from the icorr vs time curve, was plotted vs the wet±dry cycle number. The averagecorrosion rate per cycle starts to decrease and the Ecorr shifts in the noble direction,
immediately before the red rust (FeOOH) appears on the coating surface. It seems that theunderlying steel corrosion commences when the zinc coating does not act as sacri®cialanode due to accumulation of zinc corrosion products on the coating surface. Theelectrochemical methods, such as impedance and corrosion potential measurements, are an
e�ective tool for monitoring the degradation of metallic coating under atmosphericenvironments. # 1999 Elsevier Science Ltd. All rights reserved.
Keywords: Metal coatings; Zinc; EIS; XRD; Atmospheric corrosion
0010-938X/00/$ - see front matter # 1999 Elsevier Science Ltd. All rights reserved.
PII: S0010 -938X(99)00057 -8
Corrosion Science 42 (2000) 183±194
1 Permanent address: Chemistry Department, Faculty of Science, Helwan University, Ain-Helwan,
Cairo, Egypt.
* Corresponding author.
1. Introduction
The combination of corrosion resistance and low maintenance costs withsuperior mechanical properties has led to the widespread use of steels in a varietyof structural applications, including buildings and bridges. In recent years,stainless steels have been used for architectural applications such as building sidewalls, where the initial surface appearance must be maintained.
The good resistance of zinc and its relatively low price is the reason for itswidespread use as a coating for steel (galvanizing) in many applications likepiping, fencing, nails, etc. Zinc protects steels through original barrier layer actionof the coated steel, secondary barrier action of the corrosion product layer andgalvanic action of coating layer. One important aspect of zinc-coated steel is thatit is mostly used in atmospheric environments where corrosion occurs under a thinlayer of electrolyte during wetting-drying cycles [1]. The corrosion process ofmetals under a thin layer electrolyte is very di�erent from that in bulk solution[2]. The corrosion process of carbon steel under a thin layer has been found to becontrolled by the di�usion of oxygen to the metal surface in the early stage [3].
The development of new accelerated tests [4±7] for evaluating quantitativeatmospheric corrosion resistance is still under intensive study. ElectrochemicalImpedance Spectroscopy (EIS) is now established as a powerful technique [8±12]for investigating electrochemical and corrosion system. Also EIS is used widely tocharacterize the behavior of coated metals under di�erent conditions. Nishikata etal. [13±18] used the AC impedance method in studying the atmospheric corrosionof di�erent metals under thin layers and reported that the impedance behavior ofmetal covered with a thin electrolyte layer can be represented by a dimensionaldistributed constant-type (TML) equivalent circuit. Also they used the EIS toprovide the current distribution over a working electrode.
The aim of the present paper is to investigate the applicability of AC impedancemethod to corrosion monitoring of a galvanized steel under cyclic wet±dryenvironments, and to clarify the mechanism for describing the successive stages inthe atmospheric corrosion process of the galvanized steel.
2. Experimental
The specimen was prepared from a zinc-electroplated steel sheet by cuttingspecimen into a small plate with the dimension 14 � 14 � 0.2 mm. The thicknessof the zinc coating was approximately 3 mm. The specimen was cleaned withacetone for 2 min. One side of the metal was polished using emery paper beforeconnecting it with a lead wire using a silver paste. A schematic diagram of theelectrode cell was shown in Fig. 1. The connection of the plate and wire wascovered by quick drying epoxy after 15 min to ensure that the connection wassecured. Two metal plates were then placed in an epoxy resin holder in such away that 10 � 10 mm of each plate was exposed, 0.5 mm lower than the epoxy
G.A. El-Mahdy et al. / Corrosion Science 42 (2000) 183±194184
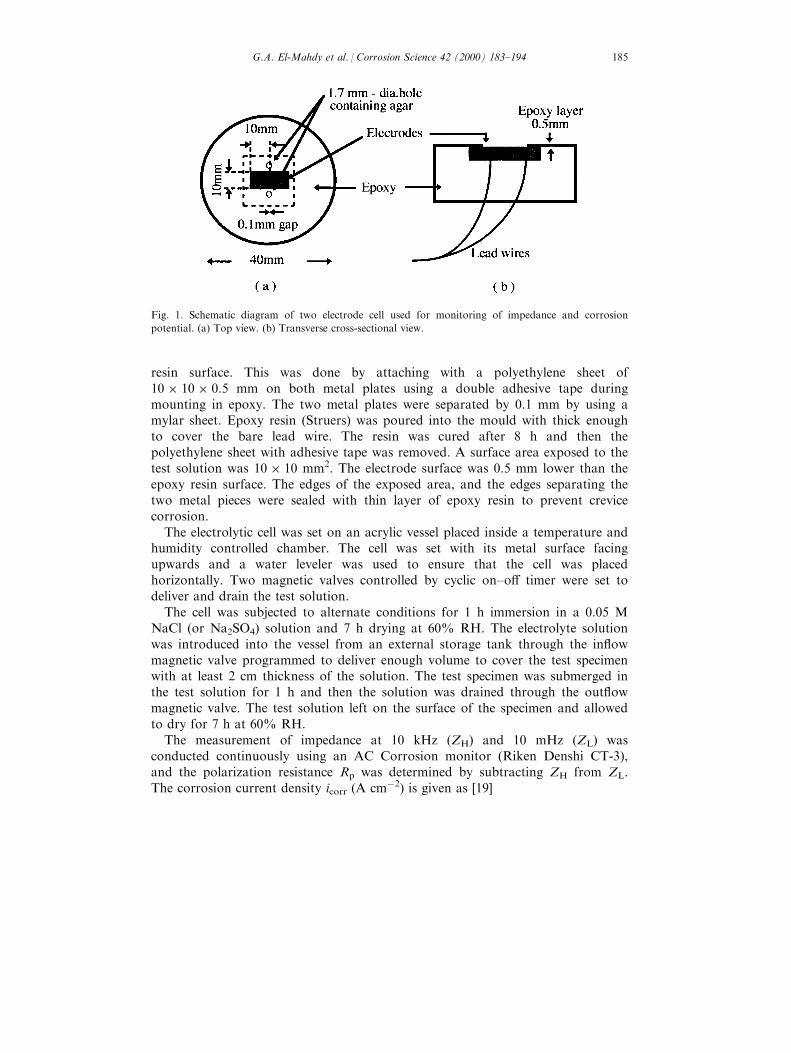
resin surface. This was done by attaching with a polyethylene sheet of10 � 10 � 0.5 mm on both metal plates using a double adhesive tape duringmounting in epoxy. The two metal plates were separated by 0.1 mm by using amylar sheet. Epoxy resin (Struers) was poured into the mould with thick enoughto cover the bare lead wire. The resin was cured after 8 h and then thepolyethylene sheet with adhesive tape was removed. A surface area exposed to thetest solution was 10 � 10 mm2. The electrode surface was 0.5 mm lower than theepoxy resin surface. The edges of the exposed area, and the edges separating thetwo metal pieces were sealed with thin layer of epoxy resin to prevent crevicecorrosion.
The electrolytic cell was set on an acrylic vessel placed inside a temperature andhumidity controlled chamber. The cell was set with its metal surface facingupwards and a water leveler was used to ensure that the cell was placedhorizontally. Two magnetic valves controlled by cyclic on±o� timer were set todeliver and drain the test solution.
The cell was subjected to alternate conditions for 1 h immersion in a 0.05 MNaCl (or Na2SO4) solution and 7 h drying at 60% RH. The electrolyte solutionwas introduced into the vessel from an external storage tank through the in¯owmagnetic valve programmed to deliver enough volume to cover the test specimenwith at least 2 cm thickness of the solution. The test specimen was submerged inthe test solution for 1 h and then the solution was drained through the out¯owmagnetic valve. The test solution left on the surface of the specimen and allowedto dry for 7 h at 60% RH.
The measurement of impedance at 10 kHz (ZH) and 10 mHz (ZL) wasconducted continuously using an AC Corrosion monitor (Riken Denshi CT-3),and the polarization resistance Rp was determined by subtracting ZH from ZL.The corrosion current density icorr (A cmÿ2) is given as [19]
Fig. 1. Schematic diagram of two electrode cell used for monitoring of impedance and corrosion
potential. (a) Top view. (b) Transverse cross-sectional view.
G.A. El-Mahdy et al. / Corrosion Science 42 (2000) 183±194 185

icorr � k=Rp �1�
k � ÿbabc=2:303 �ba ÿ bc� �2�where ba and bc are Tafel slopes of anodic and cathodic polarization curves,respectively. The ba and bc for zinc in neutral chloride solutions were reported tobe 0.035 and ÿ10 V, respectively [20]. Using these Tafel slopes, the value of k was®xed at 0.015 V in this study. Considering that exposure time of one cycleemployed in this study is 8 h (28800 N), the total corrosion mass loss DM (gcmÿ2) of zinc coating at the end of the nth cycle can be written as
DM � �MZn=2F ��tN0
icorrdt �3�
where MZn is atomic weight of zinc (=65.4 g molÿ1), F is Faraday constant (=96485 C molÿ1) and tN is exposure time (=28800 N).
Corrosion potential Ecorr was monitored only when the specimen wassubmerged for 1 h in each cycle using Silver±Silver chloride Electrode (SSE) as areference electrode. Two holes of 1.7 mm in diameter were drilled at the middle ofthe epoxy resin of both sides contained a salt bridge and acted as a Luggin probetip for corrosion potential measurements (Fig. 1). The same technique wasemployed recently elsewhere [21].
The corrosion products were examined after 15 cycles or 120 h of exposureusing X-Ray Di�raction (XRD, Shimadzu XD-3A) after separating the electrodefrom the epoxy holder.
3. Results and discussions
3.1. Monitoring of corrosion rates
The wet±dry cycle was carried out by exposure to alternate conditions of 1 h-immersion in 0.05 M NaCl solution and 7 h-drying at 60% RH at (a) 293 and (b)313 K. From the monitoring results of the high frequency impedance, whichcorresponds to the solution resistance of the electrolyte layer, it was found thatthe specimen surface dried up about 4 h after the onset of the drying period. Theresults of the Rÿ1p monitoring by AC impedance method are shown in Fig. 2. Themeasured Rp is given by a parallel combination of the Rp(Zn) for zinc coating andthe Rp(Fe) for underlying steel at defect sites. In the initial stage of corrosion,anodic dissolution of zinc and cathodic reduction of oxygen occur on the coatingsurface, meanwhile only oxygen reduction takes place on the defect sites. Since thedefect area is much smaller than the total coating surface area, the measured Rp
corresponds to the Rp(Zn) in the initial stage. The icorr was calculated from theRÿ1p using Eq. (1), assuming that the k value is 0.015 V.
Within each cycle, the icorr increased just after the specimen was submerged in
G.A. El-Mahdy et al. / Corrosion Science 42 (2000) 183±194186
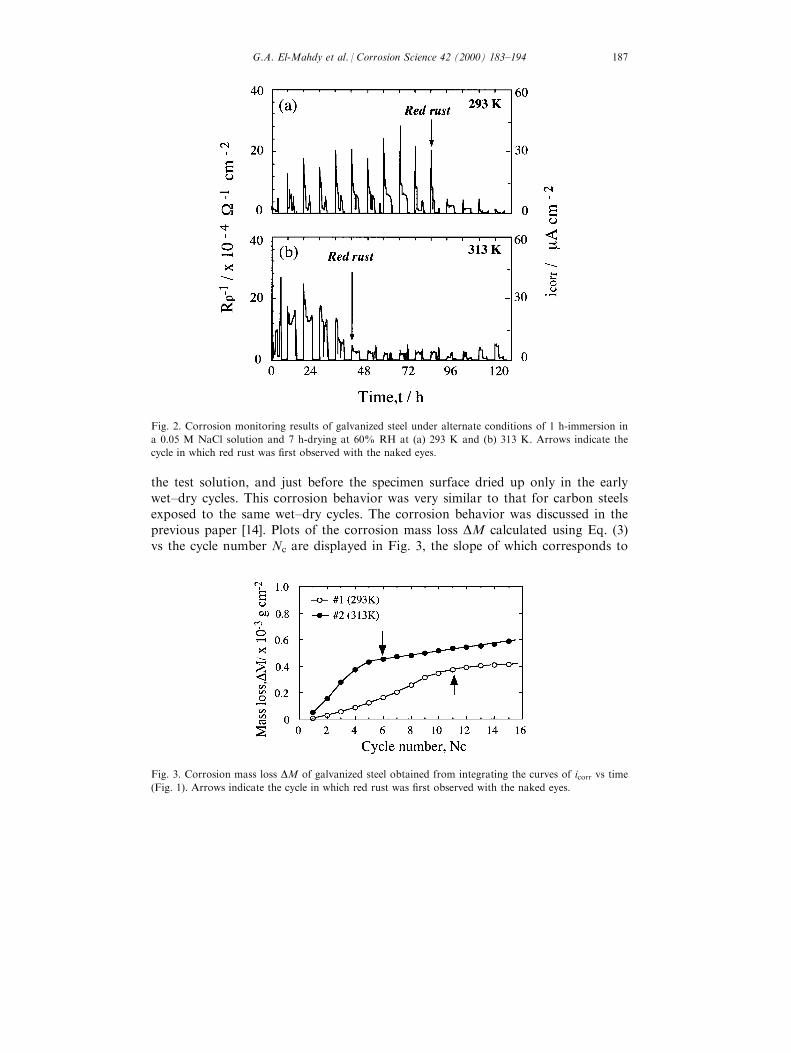
the test solution, and just before the specimen surface dried up only in the earlywet±dry cycles. This corrosion behavior was very similar to that for carbon steelsexposed to the same wet±dry cycles. The corrosion behavior was discussed in theprevious paper [14]. Plots of the corrosion mass loss DM calculated using Eq. (3)vs the cycle number Nc are displayed in Fig. 3, the slope of which corresponds to
Fig. 3. Corrosion mass loss DM of galvanized steel obtained from integrating the curves of icorr vs time
(Fig. 1). Arrows indicate the cycle in which red rust was ®rst observed with the naked eyes.
Fig. 2. Corrosion monitoring results of galvanized steel under alternate conditions of 1 h-immersion in
a 0.05 M NaCl solution and 7 h-drying at 60% RH at (a) 293 K and (b) 313 K. Arrows indicate the
cycle in which red rust was ®rst observed with the naked eyes.
G.A. El-Mahdy et al. / Corrosion Science 42 (2000) 183±194 187

the average corrosion rate per cycle vav. As can be seen in Fig. 3, the DM vs Nc
curve is divided into two di�erent regions. In the case for 293 K, the vav slightlyincreased until the 10th cycle and ®nally became a very small value after the 11thcycle. The red rust (FeOOH) appearance, indicating occurrence of the underlyingsteel corrosion, was observed with the naked eye in the 11th cycle for 293 K and6th cycle for 313 K, as indicated by the arrows in Fig. 3. From both themonitoring results and surface observation, it can be seen that the underlyingcorrosion commences just after the vav rapidly decreases. The average corrosionthickness loss DT was estimated to 0.7 mm at the 11th cycle for 293 K and 0.6 mmat the 6th cycle for 313 K, by dividing the DM by the density of zinc (7.14 gcmÿ3). After exposure of 15 cycles, the corrosion product was removed and thepresence of the zinc coating on the specimen surface was con®rmed. From theseresults, the relatively thick coating (2.3±2.4 mm) still remains when the underlyingsteel corrosion commences.
The Rÿ1p monitoring was carried out under 1 h-immersion in 0.05 M NaClsolutions and 7 h-drying at 303 K. The test solutions of pH 7 and pH 4 wereemployed, the pHs of which were adjusted by addition of small amount of HClsolution. The DM was estimated in the same manner as Fig. 3 and is plotted vsthe Nc in Fig. 4. The results indicated that lowering the pH of the solutionsomewhat enhanced the corrosion rate. The di�erence can be explained on thebasis of ®lm solubility in solution of lower pH value. The red rust was observed inthe 8th and 10th cycle for pH 4 and pH 7, respectively. In both cases, the coatingthickness was reduced by 0.7±0.8 mm to these cycles. As similar to Fig. 3, adecrease of the average corrosion rate vav leads to the commence of the underlyingsteel corrosion also under these environments.
Fig. 5 displays the DM vs Nc curves obtained from the Rÿ1p monitoring under1 h-immersion in a 0.05 M Na2SO4 solution and 7 h-drying at 303 K and RH
Fig. 4. Corrosion mass loss DM of galvanized steel under alternate conditions of 1 h-immersion in
0.05 M NaCl solutions of pH 4 and pH 7 and 7 h-drying at 60% RH at 303 K, which were obtained
by integrating the monitoring data of the icorr. Arrows indicate the cycle in which red rust was ®rst
observed with the naked eyes.
G.A. El-Mahdy et al. / Corrosion Science 42 (2000) 183±194188
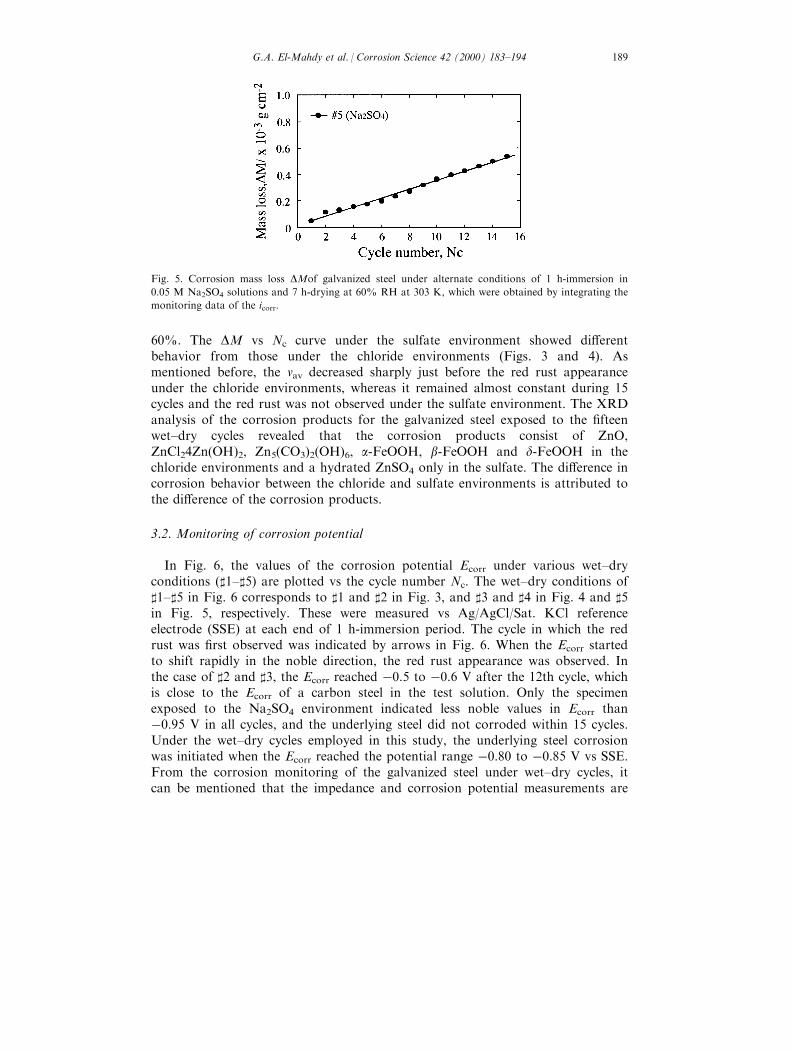
60%. The DM vs Nc curve under the sulfate environment showed di�erentbehavior from those under the chloride environments (Figs. 3 and 4). Asmentioned before, the vav decreased sharply just before the red rust appearanceunder the chloride environments, whereas it remained almost constant during 15cycles and the red rust was not observed under the sulfate environment. The XRDanalysis of the corrosion products for the galvanized steel exposed to the ®fteenwet±dry cycles revealed that the corrosion products consist of ZnO,ZnCl24Zn(OH)2, Zn5(CO3)2(OH)6, a-FeOOH, b-FeOOH and d-FeOOH in thechloride environments and a hydrated ZnSO4 only in the sulfate. The di�erence incorrosion behavior between the chloride and sulfate environments is attributed tothe di�erence of the corrosion products.
3.2. Monitoring of corrosion potential
In Fig. 6, the values of the corrosion potential Ecorr under various wet±dryconditions (]1±]5) are plotted vs the cycle number Nc. The wet±dry conditions of]1±]5 in Fig. 6 corresponds to ]1 and ]2 in Fig. 3, and ]3 and ]4 in Fig. 4 and ]5in Fig. 5, respectively. These were measured vs Ag/AgCl/Sat. KCl referenceelectrode (SSE) at each end of 1 h-immersion period. The cycle in which the redrust was ®rst observed was indicated by arrows in Fig. 6. When the Ecorr startedto shift rapidly in the noble direction, the red rust appearance was observed. Inthe case of ]2 and ]3, the Ecorr reached ÿ0.5 to ÿ0.6 V after the 12th cycle, whichis close to the Ecorr of a carbon steel in the test solution. Only the specimenexposed to the Na2SO4 environment indicated less noble values in Ecorr thanÿ0.95 V in all cycles, and the underlying steel did not corroded within 15 cycles.Under the wet±dry cycles employed in this study, the underlying steel corrosionwas initiated when the Ecorr reached the potential range ÿ0.80 to ÿ0.85 V vs SSE.From the corrosion monitoring of the galvanized steel under wet±dry cycles, itcan be mentioned that the impedance and corrosion potential measurements are
Fig. 5. Corrosion mass loss DMof galvanized steel under alternate conditions of 1 h-immersion in
0.05 M Na2SO4 solutions and 7 h-drying at 60% RH at 303 K, which were obtained by integrating the
monitoring data of the icorr.
G.A. El-Mahdy et al. / Corrosion Science 42 (2000) 183±194 189
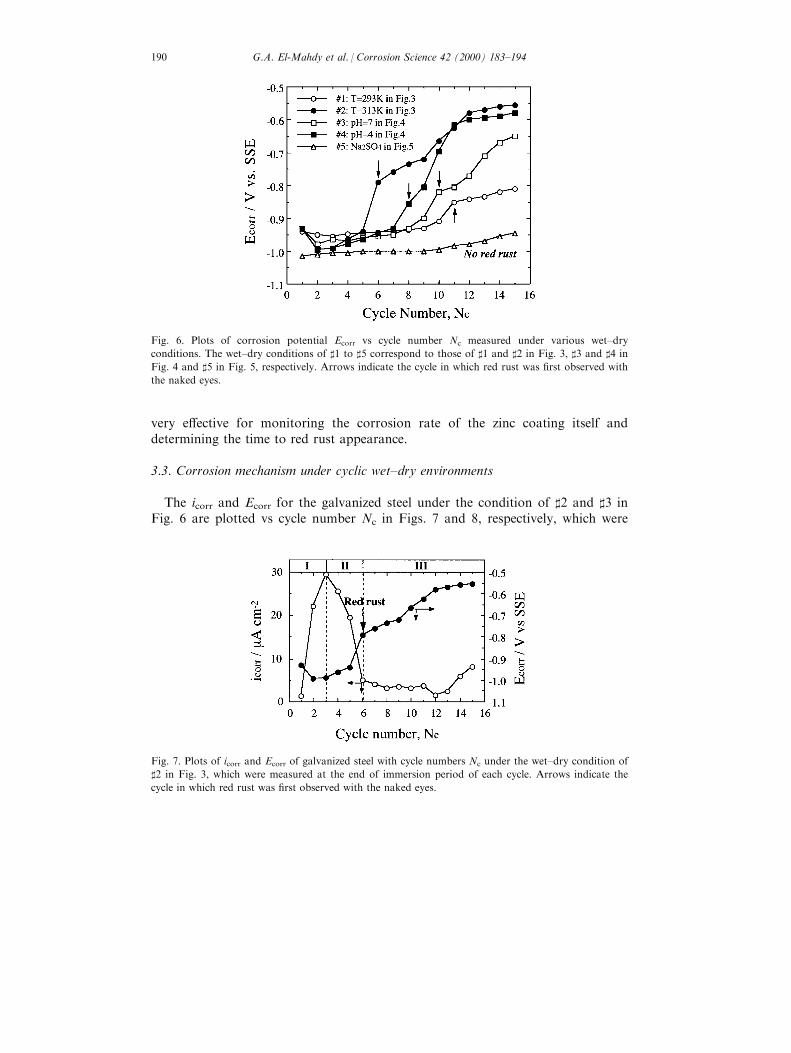
very e�ective for monitoring the corrosion rate of the zinc coating itself anddetermining the time to red rust appearance.
3.3. Corrosion mechanism under cyclic wet±dry environments
The icorr and Ecorr for the galvanized steel under the condition of ]2 and ]3 inFig. 6 are plotted vs cycle number Nc in Figs. 7 and 8, respectively, which were
Fig. 6. Plots of corrosion potential Ecorr vs cycle number Nc measured under various wet±dry
conditions. The wet±dry conditions of ]1 to ]5 correspond to those of ]1 and ]2 in Fig. 3, ]3 and ]4 in
Fig. 4 and ]5 in Fig. 5, respectively. Arrows indicate the cycle in which red rust was ®rst observed with
the naked eyes.
Fig. 7. Plots of icorr and Ecorr of galvanized steel with cycle numbers Nc under the wet±dry condition of
]2 in Fig. 3, which were measured at the end of immersion period of each cycle. Arrows indicate the
cycle in which red rust was ®rst observed with the naked eyes.
G.A. El-Mahdy et al. / Corrosion Science 42 (2000) 183±194190
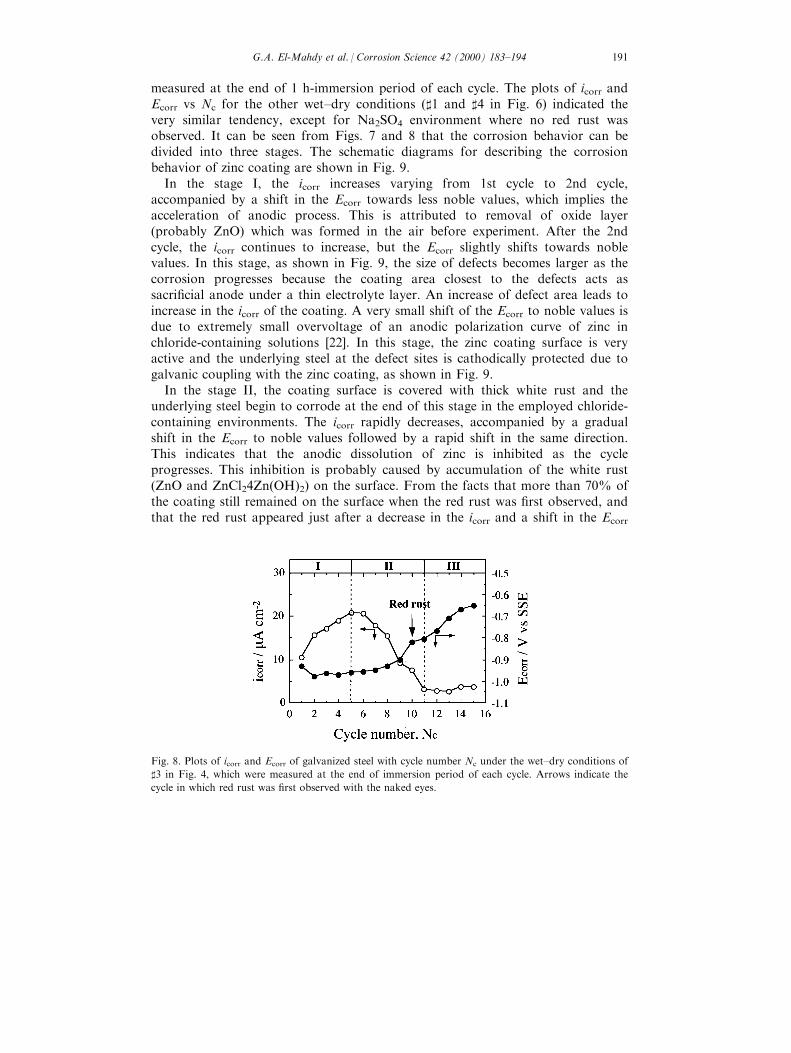
measured at the end of 1 h-immersion period of each cycle. The plots of icorr andEcorr vs Nc for the other wet±dry conditions (]1 and ]4 in Fig. 6) indicated thevery similar tendency, except for Na2SO4 environment where no red rust wasobserved. It can be seen from Figs. 7 and 8 that the corrosion behavior can bedivided into three stages. The schematic diagrams for describing the corrosionbehavior of zinc coating are shown in Fig. 9.
In the stage I, the icorr increases varying from 1st cycle to 2nd cycle,accompanied by a shift in the Ecorr towards less noble values, which implies theacceleration of anodic process. This is attributed to removal of oxide layer(probably ZnO) which was formed in the air before experiment. After the 2ndcycle, the icorr continues to increase, but the Ecorr slightly shifts towards noblevalues. In this stage, as shown in Fig. 9, the size of defects becomes larger as thecorrosion progresses because the coating area closest to the defects acts assacri®cial anode under a thin electrolyte layer. An increase of defect area leads toincrease in the icorr of the coating. A very small shift of the Ecorr to noble values isdue to extremely small overvoltage of an anodic polarization curve of zinc inchloride-containing solutions [22]. In this stage, the zinc coating surface is veryactive and the underlying steel at the defect sites is cathodically protected due togalvanic coupling with the zinc coating, as shown in Fig. 9.
In the stage II, the coating surface is covered with thick white rust and theunderlying steel begin to corrode at the end of this stage in the employed chloride-containing environments. The icorr rapidly decreases, accompanied by a gradualshift in the Ecorr to noble values followed by a rapid shift in the same direction.This indicates that the anodic dissolution of zinc is inhibited as the cycleprogresses. This inhibition is probably caused by accumulation of the white rust(ZnO and ZnCl24Zn(OH)2) on the surface. From the facts that more than 70% ofthe coating still remained on the surface when the red rust was ®rst observed, andthat the red rust appeared just after a decrease in the icorr and a shift in the Ecorr
Fig. 8. Plots of icorr and Ecorr of galvanized steel with cycle number Nc under the wet±dry conditions of
]3 in Fig. 4, which were measured at the end of immersion period of each cycle. Arrows indicate the
cycle in which red rust was ®rst observed with the naked eyes.
G.A. El-Mahdy et al. / Corrosion Science 42 (2000) 183±194 191
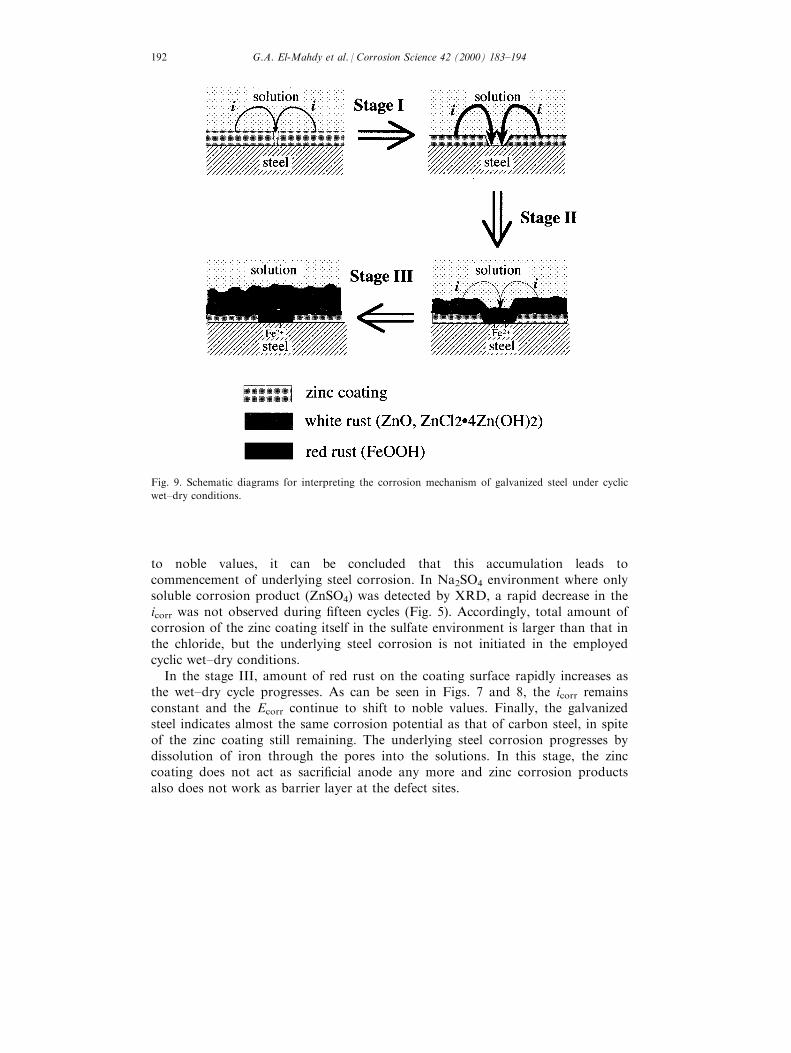
to noble values, it can be concluded that this accumulation leads tocommencement of underlying steel corrosion. In Na2SO4 environment where onlysoluble corrosion product (ZnSO4) was detected by XRD, a rapid decrease in theicorr was not observed during ®fteen cycles (Fig. 5). Accordingly, total amount ofcorrosion of the zinc coating itself in the sulfate environment is larger than that inthe chloride, but the underlying steel corrosion is not initiated in the employedcyclic wet±dry conditions.
In the stage III, amount of red rust on the coating surface rapidly increases asthe wet±dry cycle progresses. As can be seen in Figs. 7 and 8, the icorr remainsconstant and the Ecorr continue to shift to noble values. Finally, the galvanizedsteel indicates almost the same corrosion potential as that of carbon steel, in spiteof the zinc coating still remaining. The underlying steel corrosion progresses bydissolution of iron through the pores into the solutions. In this stage, the zinccoating does not act as sacri®cial anode any more and zinc corrosion productsalso does not work as barrier layer at the defect sites.
Fig. 9. Schematic diagrams for interpreting the corrosion mechanism of galvanized steel under cyclic
wet±dry conditions.
G.A. El-Mahdy et al. / Corrosion Science 42 (2000) 183±194192
4. Conclusions
The corrosion current density icorr and corrosion potential Ecorr of zinc coatedsteel (coating thickness: 3 mm) were monitored under various wet±dry conditions,the following conclusions were drawn.
1. Under the employed cyclic wet±dry environments containing chloride ions, thecorrosion of underlying steel commences, immediately after the averagecorrosion rate per cyclic rapidly decreases and the Ecorr measured in theimmersion period shifts in noble direction up to ÿ0.85 to ÿ0.80 V vs SSE.
2. In the commencement of the underlying steel corrosion, more than 70% of thecoating still remained on the surface. Inhibition of anodic dissolution of zincdue to accumulation of corrosion products on the surface leads to theunderlying steel corrosion which progresses at the defect sites on the zinccoating surface.
3. Monitoring of impedance and corrosion potential are very useful for estimatingtime to red rust appearance which indicates the commencement of theunderlying steel corrosion as well as the corrosion rate of coating materials.
Acknowledgements
The authors wish to thank Japan Society for the Promotion of Science (JSPS)for ®nancial support.
References
[1] H. Guttmann, Metal corrosion in the atmosphere, ASTM STP 435, American Society for Testing
and Materials, Philadelphia, 1968, p. 223.
[2] I.L. Rosenfel'd, in: Proceedings of the First International Congress on Metallic Corrosion,
London, April, 1961, p. 243.
[3] M. Stratmann, H. Streckel, Corros. Sci. 30 (1990) 697.
[4] H.L. Black, L.W. Lherbier, Metal corrosion in the atmosphere, ASTM STP 435, American
Society for Testing and Materials, Philadelphia, 1968, p. 3.
[5] E.A. Bakerand, T.S. Lee, Degradation of metal in the atmosphere, ASTM STP 965, American
Society for Testing and Materials, Philadelphia, 1988, p. 35.
[6] G.F. Bush, W.G. Garwood, B.E. Ti�any, Advances in the technology of stainless steels and re-
lated alloys, ASTM STP 965, American Society for Testing and Materials, Philadelphia, 1963, p.
209.
[7] S. Ito, M. Yabumoto, H. Omata, T. Murata, in: Passivity of Metal and Semiconductors, Elsevier,
Amsterdam, 1983, p. 637.
[8] C. Gabrielli, Identi®cation of electrochemical process by frequency response analysis, Solartron
Instruments Group, Solartron Electronic Schulmnerger, Solartron Electronic Group,
Farnborough, Hants UK, 1980.
[9] D.D. Macdonald, M.C.H. Kubre, Electrochemical techniques in corrosion science.
Electrochemical Corrosion Testing, STP 272, ASTM, Philadelphia, 1981.
G.A. El-Mahdy et al. / Corrosion Science 42 (2000) 183±194 193
[10] M.C.H. Kubre, D.D. Macdonald, in: J.O'.M Bockris, B.E. Conway, E. Yeager (Eds.), Electronic
Instrumentation for Electrochemical Studies in a Comprehensive Treatise of Electrochemistry,
Plenum Press, New York, 1977.
[11] D.D. Macdonald, Transient Techniques in Electrochemistry, Plenum Press, New York, 1977.
[12] M. Sluyters-Rehbach, J.H. Sluyters, in: A.J. Bard (Ed.), Electroanalyticalchemistry, vol. 4, Marcel
Dekker, New York, 1970.
[13] A. Nishikata, T. Takahashi, B. Hou, T. Tsuru, Corrosion Engineering 43 (1994) 225.
[14] A. Nishikata, S. Kumagai, T. Tsuru, Corrosion Engineering 43 (1994) 109.
[15] A. Nishikata, Y. Ichihara, T. Tsuru, Electrochim. Acta 41 (1996) 1057.
[16] A. Nishikata, Y. Ichihara, T. Tsuru, Corrosion Sci. 37 (1995) 897.
[17] A. Nishikata, Y. Yamashita, H. Katayama, T. Tsuru, A. Usami, T. Tanabe, H. Mabuci,
Corrosion Sci. 37 (1995) 2059.
[18] Cruz R.P. Vera, A. Nishikata, T. Tsuru, Corros. Sci. 38 (1996) 1397.
[19] M. Stern, A.L. Geary, J. Electrochem. Soc. 104 (1957) 56.
[20] W. Walter, Corros. Sci. 32 (1991) 1331.
[21] Cruz R.P. Vera, A. Nishikata, T. Tsuru, Corros. Sci. 40 (1998) 125.
[22] H. Katayama, Y.C. Tay, A.S. Viloria, A. Nishikata, T. Tsuru, Material Transaction JIM 38
(1998) 1089.
G.A. El-Mahdy et al. / Corrosion Science 42 (2000) 183±194194