serological diagnosis of influenza by ... diagnosis of influenza by microneutralization assay 6...
TRANSCRIPT
.
SEROLOGICAL DIAGNOSIS OF INFLUENZA BY MICRONEUTRALIZATION ASSAY
6 December 2010 Serological methods rarely yield an early diagnosis of acute influenza virus infection. However, the demonstration of a significant increase in antibody titres (greater than or equal to 4‐fold) between acute‐phase and convalescent‐phase sera may establish the diagnosis of a recent influenza infection even when attempts to detect the virus are negative. Apart from their retrospective diagnostic value, serological methods such as virus neutralization and haemagglutination inhibition are the fundamental tools in epidemiological and immunological studies, as well as in the evaluation of vaccine immunogenicity. The microneutralization assay is a highly sensitive and specific assay for detecting virus‐specific neutralizing antibodies to influenza viruses in human and animal sera, potentially including the detection of human antibodies to avian subtypes. Virus neutralization gives the most precise answer to the question of whether or not an individual has antibodies that can neutralize the infectivity of a given virus strain. The assay has several additional advantages in detecting antibodies to influenza virus. First, it primarily detects antibodies to the influenza viral HA protein and thus can identify functional strain‐specific antibodies in human and animal sera. Second, since infectious virus is used, the assay can be carried out quickly once the emergence of a novel virus is recognized. Although conventional neutralization tests for influenza viruses (based on the inhibition of cytopathogenic effect formation in MDCK cell culture) are laborious and rather slow, a microneutralization assay using microtitre plates in combination with an ELISA to detect virus‐infected cells can yield results within two days. The protocol here was provided by WHO Collaborating Center for Surveillance, Epidemiology and Control of Influenza, Centers for Disease Control and Prevention, Atlanta, USA. On day 1, the following two‐step procedure is performed: 1. a virus‐antibody reaction step, in which the virus is mixed with dilutions of serum
and time allowed for any antibodies to react; and 2. an inoculation step, in which the mixture is inoculated into the appropriate host
system – MDCK cells in the case of the following assay.
Page 1 of 25
.
On day 2, an ELISA is then performed to detect virus‐infected cells. The absence of infectivity constitutes a positive neutralization reaction and indicates the presence of virus‐specific antibodies in the serum sample. In cases of influenza‐like illness, paired acute and convalescent serum samples are preferred. An acute sample should be collected within seven days of symptom onset and the convalescent sample collected at least 14 days after the acute sample, and ideally within 1–2 months of the onset of illness. A 4‐fold or great rise in antibody titre demonstrates a seroconversion and is considered to be diagnostic. With single‐serum samples, care must be taken in interpreting low titres such as 20 and 40. Generally, knowledge of the antibody titres in an age‐matched control population is needed to determine the minimum titre that is indicative of a specific antibody response to the virus used in the assay. The influenza virus microneutralization assay presented below is based on the assumption that serum‐neutralizing antibodies to influenza viral HA will inhibit the infection of MDCK cells with virus. Serially diluted sera should be pre‐incubated with a standardized amount of virus before the addition of MDCK cells. After overnight incubation, the cells are fixed and the presence of influenza A virus nucleoprotein (NP) protein in infected cells is detected by ELISA. The microneutralization protocol is therefore divided into three parts: Part I: Determination of the tissue culture infectious dose (TCID). Part II: Virus microneutralization assay. Part III: ELISA. An overview of the microneutralization assay is shown in FIGURE 1 and an assay process sheet is provided in ANNEX I.
Page 2 of 25

.
FIGURE 1: Overview of the microneutralization assay
Materials required
Equipment
Water‐bath (37 °C) Water‐bath (56 °C)
Automatic ELISA reader with 490 nm filter Incubator (humidified, 37 °C; 5% CO2)
Automatic plate washer (not essential but would be optimal)
Microscope (inverted or standard)
Centrifuge (low speed; benchtop; preferably with refrigeration)
Page 3 of 25

.
Sorvall – cat. no. 75006434
Supplies
Cell culture flasks (162 cm2, sterile, vented) Corning Life Sciences – cat. no. 3151
Cryovials (2 ml, sterile) Wheaton Science – cat. no. 985731
96‐well microtitre plates (flat‐bottom, Immulon‐2HB plates) Thermo – cat. no. 3455
Pipettes (assorted sizes, sterile)
Haemacytometer (double rule “bright line”) Reichert – cat. no. 1490
Haemacytometer coverslips Reichert – cat. no. 1492
Cell counter (2‐unit counter) Fisher Scientific – cat. no. 02‐670‐12
Tips for Pipetman (sterile) Rainin – cat. no. RT‐20
Multichannel pipetter Rainin – cat. no. L12‐200
Tips for multichannel pipetter Rainin – cat. no. RT‐L200F
Pipetman (1–200 µl) Rainin – cat. no. P‐200
Cells, media and buffers
MDCK cell culture monolayer – low passage (<25–30 passages) at low crowding (70–95% confluence)
MDCK sterile cell culture maintenance medium (see below)
D‐MEM high glucose (1x) liquid, with L‐glutamine and without sodium pyruvate Invitrogen – cat. no. 11965‐092
HEPES buffer (1 M stock solution) Invitrogen – cat. no. 15630‐080
Antibody diluents (see below) Wash buffer (see below)
0.01 M PBS (pH 7.2) Invitrogen – cat. no. 20012‐043
Citrate buffer capsules (optional) Sigma – cat. no. P4922
Water (distilled and deionized)
Reagents
Penicillin‐streptomycin (stock solution contains 10 000 U/ml penicillin; and 10 000 µg/ml streptomycin sulfate) Invitrogen – cat. no. 15140‐122
Fetal bovine serum (FBS) Hyclone – cat. no. SH30070.03
Page 4 of 25

.
200 mM L‐glutamine Invitrogen – cat. no. 25030‐081
Bovine albumin fraction V (prepared as a 10% solution in water) Roche – cat. no. 03117332001
Trypsin‐EDTA (0.05% trypsin; 0.53 mM EDTA ∙ 4Na) Invitrogen – cat. no. 25300‐054
Non‐fat dry milk Fisher Scientific – cat. no. 15260‐037
Tween 20 Sigma – cat. no. P1379
Ethanol (70%) Fisher Scientific – cat. no. S71822
Trypsin – TPCK‐treated (type XIII from bovine pancreas) Sigma – cat. no. T1426
Trypan blue stain (0.4%) Invitrogen – cat. no. 15250‐061
o‐phenylenediamine dihydrochloride (OPD) Sigma – cat. no. P8287
Acetone Fisher Scientific – cat. no. A18‐500
Virus diluent (see below) Fixative (see below)
Stop solution (see below)
Antibodies
Anti‐influenza A NP mouse monoclonal antibody United States Centers for Disease Control and Prevention – cat. no. VS2208
Goat anti‐mouse IgG conjugated to horseradish peroxidase (HRP), lyophilized Kirkegaard and Perry Laboratories Inc. – cat. no. 074‐1802
Preparation of media and solutions
MDCK sterile cell culture maintenance medium a. To 500 ml D‐MEM, add 5.5 ml 100x antibiotics. b. Add 5.5 ml 200 mM L‐glutamine. c. Add 50 ml FBS that has been heat‐inactivated at 56 °C for 30 minutes.
Virus diluent (make fresh) a. To 500 ml D‐MEM, add 58 ml of bovine albumin fraction V (10%). b. Add 6 ml 100x antibiotics. c. Add 12.5 ml of 1 M HEPES.
Fixative (make fresh and chill to ‐20 °C before use)
Page 5 of 25

.
a. To 100 ml 0.01 M PBS (pH 7.2) add 400 ml acetone. b. Store at ‐20 °C until just before use.
PBS (0.01 M, pH 7.2) a. In 800 ml of distilled deionized water, dissolve: 8.0 g sodium chloride (NaCl); 0.20 g potassium chloride (KCl); 1.15 g dibasic anhydrous sodium phosphate (Na2HPO4); and 0.21 g monobasic anhydrous potassium phosphate (KH2PO4).
b. Adjust pH to 7.2 with HCl and bring volume up to 1 litre with distilled deionized water.
c. Sterilize by autoclaving.
Wash buffer To 1 litre PBS add 3 ml Tween 20 using a 3 ml or 5 ml syringe with an attached wide‐bore blunt‐end needle. Wipe the outside of the needle, submerge the tip of the needle, and dispense directly into the PBS while it is vigorously being stirred with a stir bar. Prepare fresh each day.
Antibody diluent To 1 litre of wash buffer add 50 g non‐fat dry milk. Mix using a stir bar for at least 30
minutes before use.
Substrate a. Prepare a citrate buffer by adding 1 citrate buffer capsule to 100 ml of distilled
water. b. Alternatively, prepare a citrate buffer by adding 29.41 g trisodium citric acid
dihydrate (formula weight = 294.10) to 1 litre of distilled water (final concentration = 0.1 M). Adjust pH to 5.0 with HCl. Add 10 µl 30% hydrogen peroxide (0.015% H2O2) to each 20 ml of substrate just before use.
c. To 20 ml of either of the above citrate buffers, add 1 OPD tablet (10 mg) just before use.
Stop solution
To 972 ml of distilled water, add 28 ml of stock sulphuric acid (95–98%).
Dye (for determination of cell viability)
Page 6 of 25

.
Use 0.4% trypan blue stain.
Preparation of antibodies
Primary antibodies Anti‐influenza A NP mouse monoclonal antibody – dilute 1:1000 (or at an optimal concentration determined through testing by the user) in antibody diluent.
Secondary antibody Goat anti‐mouse IgG conjugated to HRP – dilute 1:2000 (or at an optimal concentration determined through testing by the user) in antibody diluent.
Preparation of negative and positive serum controls If control sera are to be tested repeatedly, it is better to make several aliquots and store them at ‐20 °C to ‐70 °C. Both animal and human negative and positive serum controls should be included for each virus used in the assay. Sera should not be repeatedly freeze–thawed. Human sera need to be heat inactivated at 56 °C for 30 minutes and animal sera require treatment with receptor destroying enzyme (RDE) before use.
Negative (normal) serum control This is included to determine whether the virus is nonspecifically inactivated by serum components. The negative serum control must be used at the same dilutions as the matching viral antiserum.
For animal sera, wherever possible use normal serum from the same animal species that is being tested. The best results will be obtained if animal control sera are treated with RDE before use in the assay.
For human sera, use age‐matched normal serum from a population not exposed to the particular virus subtype in question. Human sera must be inactivated at 56 °C for 30 minutes before use in the assay.
Positive (infected or immunized) serum controls
Include antisera to known viruses as positive controls.
Page 7 of 25

.
For animal sera, use sera raised in infected ferrets or other immunized animals (sheep, goat, rabbit or mouse). The best results will be obtained if animal control sera are treated with RDE before use in the assay.
For human sera, optimal positive controls would be acute‐phase and convalescent‐phase serum samples. Human sera must be inactivated at 56 °C for 30 minutes before use in the assay.
Preparation of virus and cell controls Viruses in allantoic fluid need to be stored at ‐70 °C. Determine the virus working dilution before use. Never use any freeze–thawed virus other than the initial freeze–thawed aliquot required to prepare the assay. Include a virus back titration, virus controls (VCs) and cell controls (CCs) with each assay as follows.
Virus titration check (back titration) 1. Add 50 µl of virus diluent to each of the wells A11–H11. 2. Add 50 µl of the working dilution of virus, containing 100x TCID, to well A11. Titrate
in 2‐fold serial dilutions down the plate (i.e. the 8 wells A11– H11) discarding the last 50 µl from H11. To avoid virus carry‐over, change pipette tips between each well.
3. Add an additional 50 µl of virus diluent to the virus titration wells (A11–H11). 4. Incubate for 1 hour at 37 °C in 5% CO2. 5. Add 100 µl MDCK cells (1.5 x 10⁴/well) and then incubate for 18–20 hours (at 37 °C
in 5% CO2) with the rest of the assay.
Positive virus controls (VCs) and negative cell controls (CCs) Set up 4 wells as positive VCs (50 µl medium + 50 µl working dilution of virus + 100 µl MDCK cells) and 4 wells as negative CCs (100 µl virus diluent + 100 µl MDCK cells) and assay in parallel with the neutralization test. These controls must be included on each plate for analysis of the data on that plate.
Part I: Virus titration and determination of tissue culture infectious dose (TCID) for microneutralization assay
Generation of stock virus
1. Grow virus to a high titre in the allantoic cavity of 10‐day‐old embryonated hens’
eggs (see SECTION 2.D for more details on the growing of viruses in eggs).
Page 8 of 25

.
Alternatively, virus can be grown in MDCK cells. Several different dilutions of virus should be inoculated to determine the maximum HA titre.
2. Aliquot virus immediately in multiple ampoules (of approximately 1 ml) and freeze at ‐70 °C. Viruses should never be thawed and refrozen.
Virus titration 1. For optimal infectivity, thaw an ampoule of virus just prior to use. 2. Perform titration of virus in quadruplicate. 3. Test at four starting dilutions (10‐2, 10‐3, 10‐4 and 10‐5) of virus in virus diluent (e.g.
100 µl virus + 9.9 ml virus diluent for the 10‐2 dilution). 4. Add 100 µl virus diluent with or without TPCK‐trypsin1 (1–2 µg/ml) to all wells,
except column 1 of a 96‐well microtitre plate. 5. Add 146 µl of virus of 1:100 virus starting dilution to the first wells in column 1 (A1–
H1). Perform ½ log10 dilutions of the virus. 6. Transfer 46 µl serially from column 1 (i.e. A1 to A2; A2 to A3; etc. up until A11).
Change pipette tips between each well. Discard the 46 µl after the last dilution in column 11. Dilutions will then be 10‐2, 10–2.5, 10‐3 and so on to 10‐7.
7. In a similar way, serially dilute the other virus starting dilutions. 8. Column 12 contains virus diluents only and is the cell control (CC). 9. Place plate(s) in a 37 °C 5% CO2 incubator for 1 hour. This replicates the conditions
of the microneutralization assay.
Preparation of MDCK cells Note: all cell culture passage work must be performed in a class‐II biosafety cabinet to prevent the contamination of cells. In addition, for safety reasons, seasonal and low pathogenic avian viruses, and human serum samples, should be handled in a class‐II biosafety cabinet, while highly pathogenic avian influenza microneutralization assays should additionally be performed only in BSL‐3+ laboratories. 1. Check the MDCK cell monolayer (which should be 70–95% confluent; see FIGURE 2.G‐
2). Do not allow the cells to overgrow. Typically, a confluent 162 cm2 flask (approximately 2 x 10⁷ cells/flask) should yield enough cells to seed 4–6 96‐well microtitre plates. Split the confluent monolayer 1:10 two days before use for optimum yield and growth. Note: cells must be in log‐phase growth for maximum virus sensitivity.
2. Remove and discard the culture medium from cell monolayer. 3. Gently rinse the cell monolayer with 5 ml trypsin‐EDTA and remove with a pipette.
1 When determining the TCID of new test viruses, it is best to perform the titration with and without trypsin to determine the optimal conditions for each virus.
Page 9 of 25
.
4. Add 5 ml trypsin‐EDTA to cover the monolayer. 5. Lie the flask flat and incubate at 37 °C until the monolayer detaches (approximately
3–10 minutes). 6. Check flask for dislodgement of the cell monolayer. As soon as most of the
monolayer has been dislodged from the bottom of the flask, the remaining cells can be dislodged by gently tapping the sides of the flask.
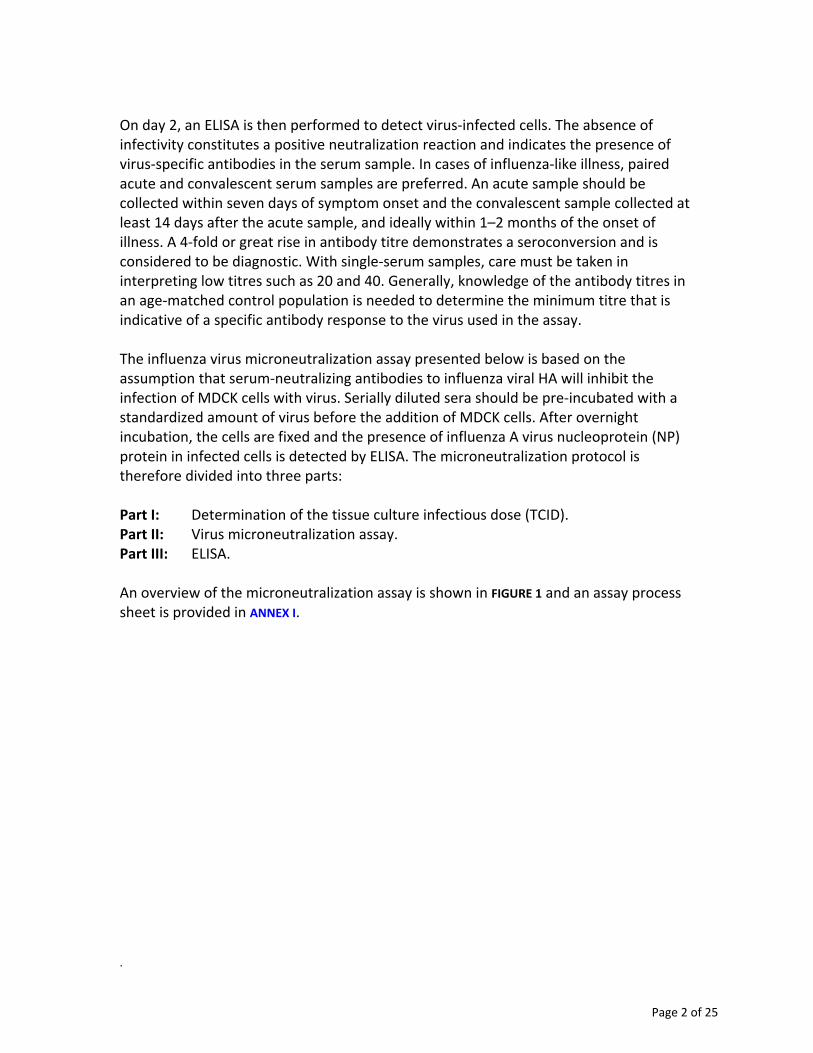
7. Add 15 ml MDCK sterile cell culture maintenance medium to each flask. 8. Label and fill new 162 cm2 cell culture flasks with 50 ml MDCK medium. 9. Depending upon when the cells are to be used in the microneutralization assay, cells
should be diluted as shown in TABLE 1 in the 50 ml MDCK medium in the new 162 cm2 cell culture flasks. Note: the dilutions are based upon optimal growth conditions though some variations may exist.
FIGURE 2. : Madin‐Darby canine kidney cell monolayer confluencies
Undergrown cells Crowded square cells Good concentration for use
TABLE 1: Dilutions of cell suspensions for passage in 162 cm2 flasks
Preparation of MDCK cells for use in microneutralization assay
Dilution Volume of cells to add to new flask
When confluent
1:5 (4 ml of the 20 ml) 4 ml Approximately 1 day
1:10 (2 ml of the 20 ml) 2 ml Approximately 2 days
1:20 (1 ml of the 20 ml) 1 ml Approximately 3 days
Page 10 of 25

.
1. When ready to perform the assay, wash 70–95% confluent cells with PBS to remove FBS.
2. Add 7 ml trypsin‐EDTA to cover the cell monolayer. 3. Lie flask flat and incubate at 37 °C in until monolayer detaches (approximately 8–10
minutes). 4. Add 7 ml of virus diluent to each flask. 5. Wash cells twice with virus diluent to remove FBS. gently mix to resuspend and break up clumps of cells; fill tube to 50 ml with virus diluent; pellet cells by centrifugation at 485x g for 5 minutes; decant supernatant; and perform one repeat of the previous 4 steps.
6. Resuspend cells in virus diluent (10 ml per trypsinized flask) and count cells with a haemacytometer as described below in Part III, Determination of cell count and viability.
7. Adjust cell concentration to 1.5 x 10⁵ cells/ml with virus diluent. 8. Add 100 µl diluted cells to each well of the microtitre plate. 9. Incubate cells for 18–20 hours at 37 °C in 5% CO2.
Determination of cell count and maintenance of MDCK cells Although estimates can be made of the stage of growth of a cell culture based on its appearance under the microscope, proper quantitative experiments, especially the microneutralization assay, are difficult to assess unless the cells are counted. One of the most critical aspects of the assay is the target cell. Along with the virus infectious dose, the condition and preparation of MDCK cells are the most common causes of assay failure. Optimal growth conditions and appropriate cell concentrations are imperative if the assay is to function properly. The concentration of cells can be determined by dislodging the adherent cells from the cell culture flask, obtaining a cell suspension, adding an appropriate dye (e.g. trypan blue stain) to distinguish viable from nonviable cells and counting the viable cells on a haemacytometer. The cell number within a defined area of known depth is counted and the concentration is derived from the count.
Fixation of cells 1. Remove medium from microtitre plate. 2. Wash each well with 200 µl PBS. 3. Remove PBS (do not allow wells to dry out) and add 100 µl/well of cold fixative. 4. Cover with lid and incubate at room temperature for 10–12 minutes. 5. Remove fixative and let the plate air dry.
Page 11 of 25
.
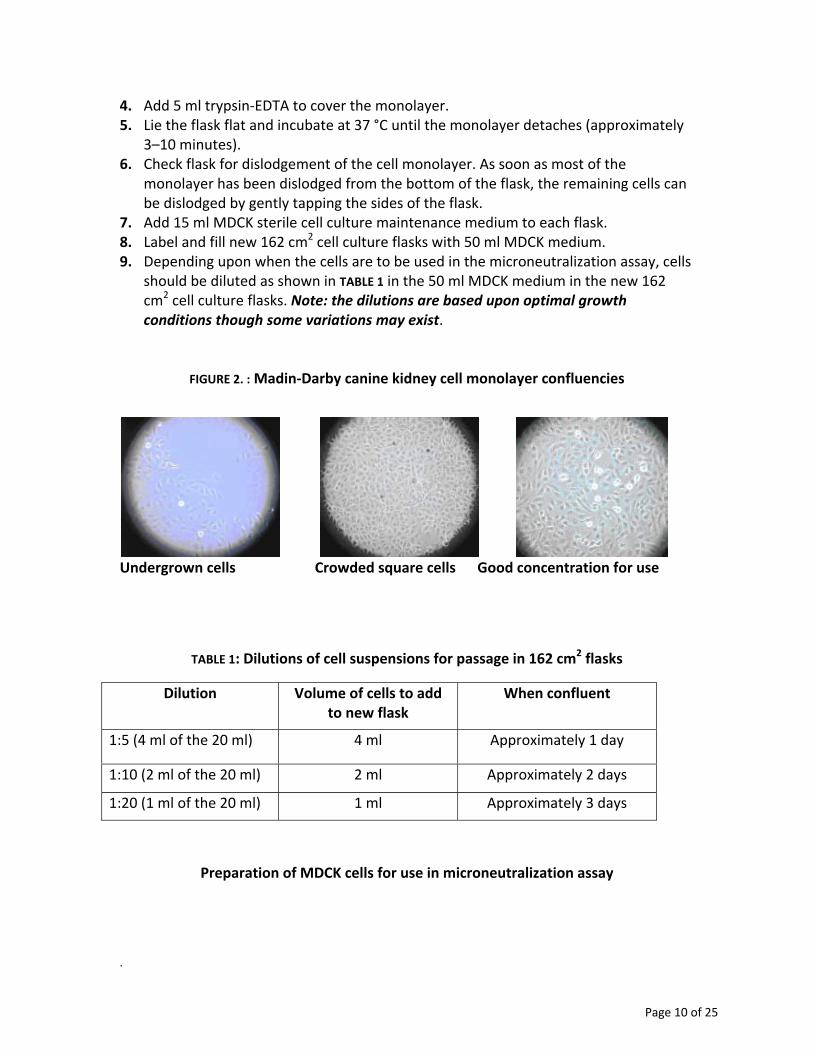
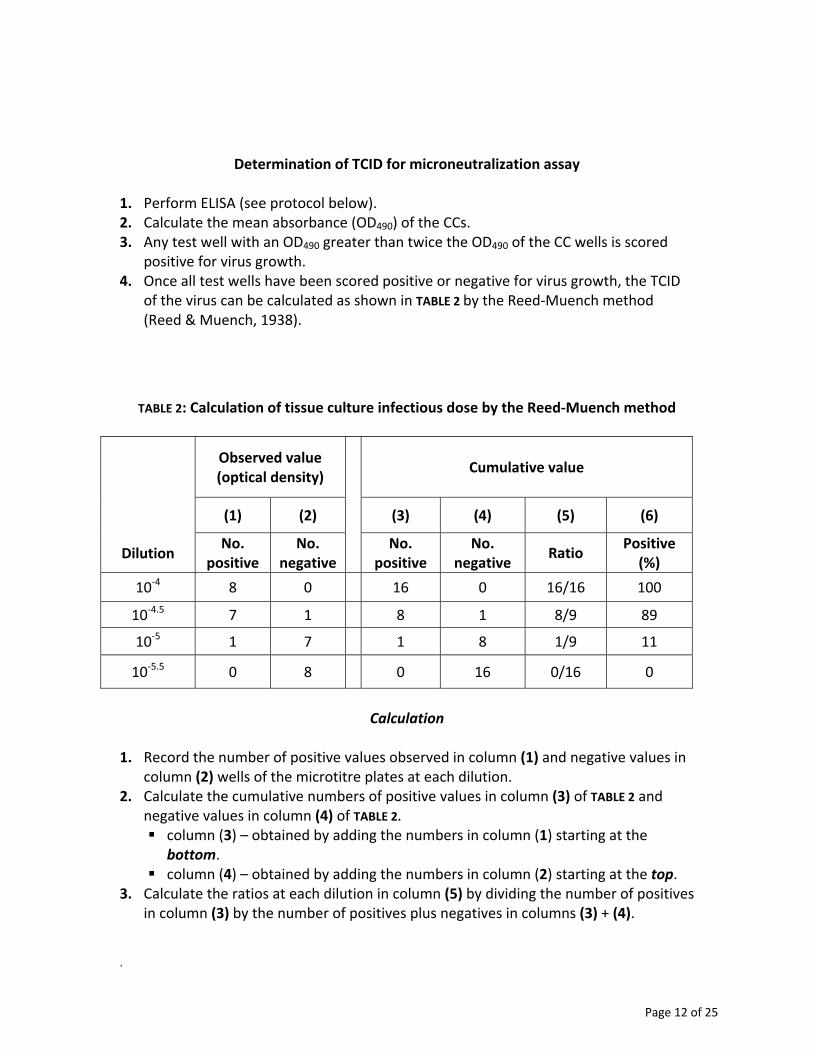
Determination of TCID for microneutralization assay 1. Perform ELISA (see protocol below). 2. Calculate the mean absorbance (OD490) of the CCs. 3. Any test well with an OD490 greater than twice the OD490 of the CC wells is scored
positive for virus growth. 4. Once all test wells have been scored positive or negative for virus growth, the TCID
of the virus can be calculated as shown in TABLE 2 by the Reed‐Muench method (Reed & Muench, 1938).
TABLE 2: Calculation of tissue culture infectious dose by the Reed‐Muench method
Observed value (optical density)
Cumulative value
(1) (2) (3) (4) (5) (6)
Dilution No.
positive No.
negative No.
positive No.
negative Ratio
Positive (%)
10‐4 8 0 16 0 16/16 100
10‐4.5 7 1 8 1 8/9 89
10‐5 1 7 1 8 1/9 11
10‐5.5 0 8 0 16 0/16 0
Calculation
1. Record the number of positive values observed in column (1) and negative values in
column (2) wells of the microtitre plates at each dilution. 2. Calculate the cumulative numbers of positive values in column (3) of TABLE 2 and
negative values in column (4) of TABLE 2. column (3) – obtained by adding the numbers in column (1) starting at the
bottom. column (4) – obtained by adding the numbers in column (2) starting at the top.
3. Calculate the ratios at each dilution in column (5) by dividing the number of positives in column (3) by the number of positives plus negatives in columns (3) + (4).
Page 12 of 25

.
4. Calculate the percentage of positive wells in column (6) by converting each of the ratios in column (5) to percentages.
5. Calculate the proportional distance between the dilution showing >50% positives in column (6) and the dilution showing <50% positives in column (6) as follows:
% positive value above 50% ‐ 50 x 0.5 (correction factor) % positive value above 50% ‐ % positive value below 50%
= 89 ‐ 50 x 0.5 = 0.5 x 0.5 = 0.25 89 ‐ 11
6. The virus working dilution is 200 times the log10 virus dilution at the cut‐off point
determined by the Reed‐Muench method. 200x the virus dilution at the cut‐off point yields a virus that contains 100x TCID in 50 µl.
7. Calculate the microneutralization TCID by adding the proportional distance to the dilution showing >50% positive. In the above example, add 0.25 to 4.5 to obtain 10‐4.75. The virus working dilution that is 200x the cut‐off dilution is 10‐4.75 x 200 = 10‐4.75 + 102.30 = 10‐2.45 = 1/10 2.45 = 1:282. This dilution will give 100x TCID per 50 µl. The virus dilution that is 400x the cut‐off is 1:141. This dilution will give 200x TCID per 50 µl.
If other dilution series are used, other correction factors must be used. For example, in this case, the correction factor for a 2‐fold dilution series would be 0.3; for a ½ log10 dilution series it would be 0.5; for a 5‐fold dilution series it would be 0.7; and for a 10‐fold dilution series it would be 1.0 (TABLE 3).
TABLE 3: Dilution series and correction factors
Dilution series Correction factor Example of dilutions
log2 (2‐fold dilutions) 0.3 2‐1, 2‐2, 2‐3, 2‐4, etc.
½ log10 (½ log dilutions) 0.5 10‐2, 10‐2.5, 10‐3, 10‐3.5, etc.
log5 (5‐fold dilutions) 0.7 5‐1, 5‐2, 5‐3, 5‐4, etc.
log10 (10‐fold dilutions) 1.0 10‐1, 10‐2, 10‐3, 10‐4, etc.
Page 13 of 25
.
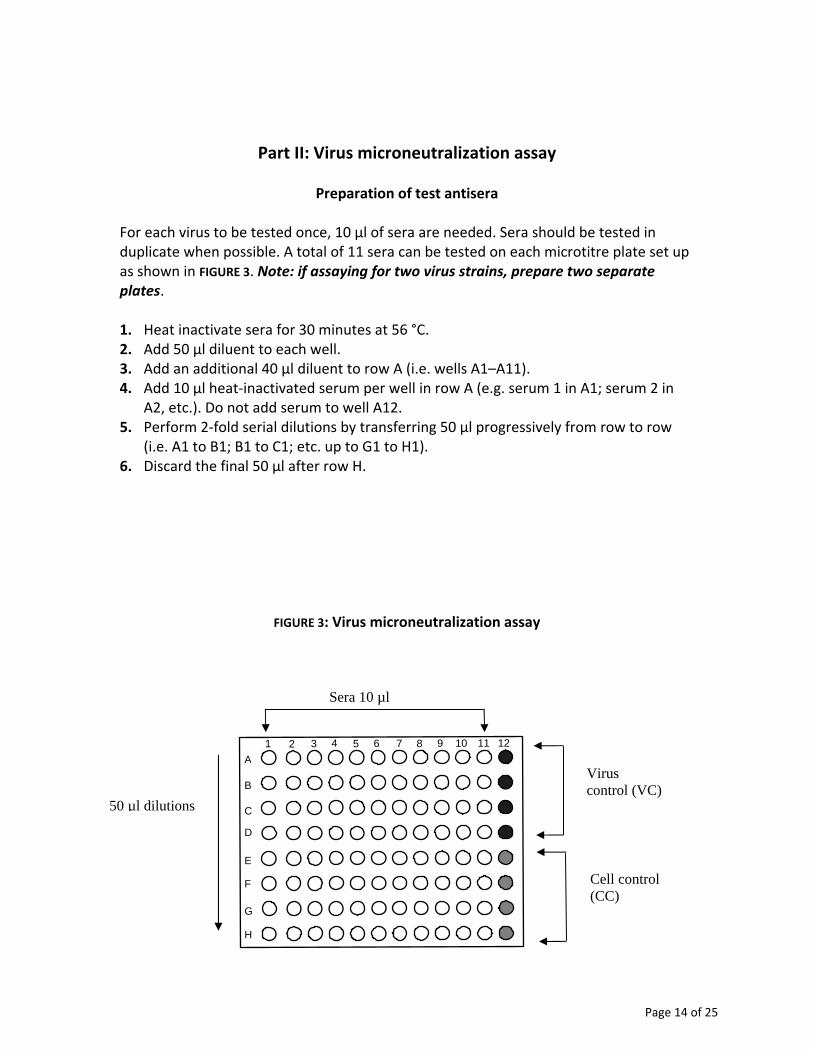
Part II: Virus microneutralization assay
Preparation of test antisera For each virus to be tested once, 10 µl of sera are needed. Sera should be tested in duplicate when possible. A total of 11 sera can be tested on each microtitre plate set up as shown in FIGURE 3. Note: if assaying for two virus strains, prepare two separate plates. 1. Heat inactivate sera for 30 minutes at 56 °C. 2. Add 50 µl diluent to each well. 3. Add an additional 40 µl diluent to row A (i.e. wells A1–A11). 4. Add 10 µl heat‐inactivated serum per well in row A (e.g. serum 1 in A1; serum 2 in
A2, etc.). Do not add serum to well A12. 5. Perform 2‐fold serial dilutions by transferring 50 µl progressively from row to row
(i.e. A1 to B1; B1 to C1; etc. up to G1 to H1). 6. Discard the final 50 µl after row H.
FIGURE 3: Virus microneutralization assay
Sera 10 µl
A
B
C
D
E
F
G
H
1 2 3 4 5 6 7 8 9 10 11 123
Virus control (VC)
Cell control (CC)
50 µl dilutions
Page 14 of 25
.
Addition of virus 1. Dilute the virus suspension in virus diluent (± TPCK‐trypsin2) so that 50 µl contains
100x TCID. Approximately 5 ml/plate is needed. Initial virus titration will determine if the addition of TPCK‐trypsin to the diluent is optimal for virus infection of MDCK cells.
2. Add 50 µl diluted virus to all wells (except CC wells E12, F12, G12 and H12). 3. Add 50 µl virus diluent to CC wells. 4. Set up back titration – start with the virus working dilution,100x TCID in 50 µl, and
prepare an additional serial 2‐fold dilution with diluent. After dilution, add 50 µl of diluent to each well for a final volume of 100 µl.
5. Incubate the virus‐serum mixtures and the virus back titration for 1 hour at 37 °C in 5% CO2.
Addition of MDCK cells
1. Prepare the cells as described above in Part I. 2. Add 100 µl cells (1.5 x 10⁵ cells/ml) to each well (i.e. 1.5 x 10⁴ cells/well). 3. Incubate the plates for 18–20 hours at 37 °C in 5% CO2. To ensure the even
distribution of heat and CO2, only stack plates 4–5 high in the incubator.
Fixation of plate(s) Fix the plates as described in Part I.
Part III: ELISA
Addition of primary antibody 1. After fixation of the plates, wash them 3 times with wash buffer. Fill the wells
completely with the wash buffer for each wash (approximately 300 µl per well). 2. Dilute antibodies (anti‐influenza A NP monoclonal) 1:1000 or at optimal
concentration (determined by earlier testing) in antibody diluent. 3. Add diluted antibody to each well (100 µl/well). 4. Cover plate(s) and incubate for 1 hour at room temperature.
2 When determining the TCID of new test viruses, it is best to perform the titration with and without trypsin to determine the optimal conditions for each virus.
Page 15 of 25

.
Addition of secondary antibody 1. Wash plate(s) 3 times with wash buffer. 2. Dilute antibody (goat anti‐mouse IgG; HRP‐conjugated) 1:2000 or at optimal
concentration (determined by earlier testing) in antibody diluent. 3. Add diluted antibody to each well (100 µl/well). 4. Cover plate(s) and incubate for 1 hour at room temperature.
Addition of substrate 1. Wash plate(s) 5 times with wash buffer. 2. Add freshly prepared substrate (10 mg OPD to each 20 ml citrate buffer + H2O2) to
each well (100 µl/well). 3. Incubate for 5–10 minutes (or until colour change in VC is intense and before CC
begins to change colour) at room temperature. Incubation time will vary between viruses.
4. Add stop solution (100 µl/well) to all wells. 5. Read the absorbance of the wells at 490 nm (OD490).
Data analysis 1. Calculations are determined for each plate individually. 2. Determine the virus neutralization antibody 50% titre of each serum using the
following equation:
x = (average OD of VC wells) ‐ (average OD of CC wells) 2
where x is the OD value at which 50% of the MDCK cells were infected. All values below or equal to x are positive for neutralization activity. The reciprocal serum dilution corresponding to that well is the 50% neutralization antibody titre for that serum sample. Serum dilutions are: well A 1:10; well B 1:20; well C 1:40; well D 1:80; well E 1:160; well F 1:320; well G 1:640; and well H 1:1280.
3. The cell control should have an OD490<0.2. The virus control should have an
OD490>0.8. 4. The virus test dose (100x TCID) is confirmed by virus back titration. In most cases,
the test dose of virus is acceptable if the back titration is positive in the 5–7 wells containing the lowest dilutions of test virus.
5. The serum positive controls should give titres within 2‐fold of the values obtained in previous tests. The OD490 of the negative serum control should be similar to that observed for the virus control.
Page 16 of 25

.
Occasionally, the microneutralization test may be difficult to interpret. In such cases, consider the factors presented in TABLE 4.
TABLE 4: Problems associated with interpretation of the microneutralization test
Problem Possible cause(s) Solution(s)
Problem with ELISA:
a. Wrong antibodies or substrate used
a. Check antibodies and substrate
b. Buffer solutions incorrect b. Prepare fresh buffers
c. Test dose of virus too weak or no virus added to virus control wells
c. Re‐determine virus TCID or adjust the dilution of virus used, ensuring virus is added to virus control cells
d. Virus inactivated during virus‐serum incubation step
d. Check incubator temperature and CO2 level
Weak or no colour in virus control wells
e. MDCK cells not optimal – e.g. too old (>30 passages); not in log‐phase growth; or contaminated
e. Thaw a new vial of cells; do not allow cells to enter stationary phase
a. Test dose of virus too strong
a. Re‐determine virus TCID or adjust the dilution of virus used
b. Serum deteriorated b. Obtain new antisera; and check storage conditions
Weak or no neutralization by
positive control sera c. Cells not in optimal
condition or passage level too high
c. Thaw a new vial of cells; do not allow cells to enter stationary phase
Page 17 of 25

.
a. Nonspecific reaction or cross‐reactivity
a. Heat‐inactivate serum (56 °C for 30 minutes); check RDE treatment of animal serum; check samples for cross‐reactive antibodies by testing against different subtypes; and try alternative serum treatment such as trypsin‐heat‐periodate
Neutralization by negative control sera
b. Test dose of virus too weak
b. Re‐determine virus TCID or adjust the dilution of virus used
Nonspecific virus inactivation
a. Serum not heat inactivated or contains nonspecific viral inhibitors
a. Heat‐inactivate human serum (56 °C for 30 minutes) – treat animal serum with RDE
Monolayer toxicity
a. Serum not heat inactivated or is toxic to cells
a. Heat‐inactivate serum – run serum toxicity check on MDCK cells and check microscopically for toxicity
Determination of cell count and viability 1. Trypsinize MDCK cells (as described above in Part I, Preparation of MDCK cells for
use in microneutralization assay). Wash cells in PBS and resuspend in a small volume of media diluent (approximately 3–5 ml per flask) using a pipette.
2. Clean the haemacytometer thoroughly with 70% ethanol and dry with a lens tissue or soft lint‐free cloth. Clean and dry the coverslip in the same way and press it gently on to the haemacytometer so that it adheres to and covers the counting area.
3. Place 100 µl of the cell suspension in one well of a 96‐well microtitre plate. 4. Add 180 µl PBS to adjacent wells (2–3 wells will be sufficient). 5. Add 20 µl of trypan blue stain to an adjacent well. 6. Perform 10‐fold serial dilutions with the cell suspension (from step 1) until no
cloudiness can be seen: mix the cell suspension thoroughly with the Pipetman and transfer 20 µl to the
well containing 180 µl diluent; and perform 10‐fold serial dilutions by transferring 20 µl suspension to 180 µl diluent.
Mix 20 µl of diluted sample with 20 µl trypan blue stain and add mixture to the counting chamber of the haemacytometer. This is done by loading the Pipetman with the suspension (approximately 10 µl) and bringing it to the edge of the
Page 18 of 25
.
space immediately beneath the coverslip and injecting the mixture slowly until the chamber is full (do not overfill).
7. Count the cells immediately under the 10x objective of the microscope. Trypan blue will be absorbed by dead cells but not by viable cells – dead cells stain blue; viable cells are clear. Count the cells in each of the large corner quadrants (each quadrant consists of the 16 smaller squares)
8. After counting, rinse chamber and coverslip with 70% ethanol and dry. 9. Calculate the percentage viable cell concentration using the formula C = n x v‐1
where: C = the number of cells/ml; n = the total number of viable cells counted; and v‐1 = volume (in ml) in each quadrant counted (v‐1 = 0.1 mm depth x 1 mm2 area
= 0.1 mm3 or 1 x 10‐4 ml). For an example of how to determine this percentage see BOX 1.
Page 19 of 25

.
BOX 1: Example of determining the percentage cell viability in a cell suspension diluted 1:10 in PBS and 1:2 in trypan blue stain 1. Count the number of viable and nonviable cells in each corner quadrant as in the
example below:
Corner quadrant No. of viable cells No. of nonviable cells (stained with trypan blue)
1 106 0
2 88 2
3 99 0
4 115 1
Total 408 3
2. The average viable cell count (since 4 quadrants were counted) is 102 (408 divided
by 4). 3. The volume of cell suspension counted is 0.1 mm3. Therefore, the concentration of
cells in the suspension counted is:
102 = 102 = (102 x 104)/ml = 1.02 x 10⁶ cells/ml 0.1 mm3 10‐4 ml
4. As the suspension was diluted from the original material 10‐fold and diluted 2‐fold in
dye, the above result must be multiplied by 20 (i.e. 101 and 2) as follows: 1.02 x 106 x 101 x 2 = 2.04 x10⁷ cells/ml
5. The condensed version of the derivation of the equation is:
viable cell count x 101 x 2 x (1x104) = number of viable cells/ml 4
4 = the number of quadrants counted 101 = the dilution factor for PBS – if multiple 10‐fold dilutions were made
adjust accordingly 2 = the dilution factor for stain 1 x 104 = the volume counted per quadrant (per ml)
6. Percentage cell viability is then determined by the following equation:
cell viability (%) = number of viable cells counted x 100% total number of cells counted
Page 20 of 25

.
In this example, cell viability = 408 x 100% = 99.2% 411
ANNEX I: MICRONEUTRALIZATION ASSAY PROCESS SHEET
Experiment Name: Experiment Number:
Investigators (List Names):
Investigators (List Names):
Part 1: Neutralization
A. Serum evaluation: Note haemolysis or lipaemia. Use Attachment 1: Sera Condition Comments below if needed.
B. Virus diluent buffer:
Component Supplier Cat. # Lot # Expiration
Date
Dulbecco’s Modified Eagle Medium (D‐MEM) Invitrogen 11965‐092
10 000 U/ml penicillin; 10 000ug/ml streptomycin
Invitrogen 15140‐122
Bovine Serum Albumin (BSA) Roche 03117332001
Hepes Buffer Solution (1M) Invitrogen 15630‐080
Prepared by (Initials): Date:
C. Sera + Virus incubation: Record virus incubation elapsed time. Elapsed Time: (1h ± 5 min) √ if 1h ± 5 min
Other: (Record)
D. MDCK cells – Trypsin incubation:
Component Supplier Cat. # Lot # Expiration
Date
Trypsin‐EDTA Invitrogen 25300‐054
Elapsed Time: (8–10 min) √ if 8–10 min
Other: (Record)
Page 21 of 25

.
E. MDCK cells – count:
Passage Cell Viability Initial Conc. of Cells Final Vol. VD Final Conc.
~1.5 X10
5cells/ml
% cells/ml ml
#_________ Note: Passage # must be less than
26. Method used (Check):
Cell Counter
Haemacytometer
F. Sera + Virus + MDCK cell incubation start time:
G. Initials of testing operators at Day 1:
Part 2: ELISA
A. MDCK cell incubation stop time:
Stop Time:
Elapsed Time: (18–20h) √ if 18–20h
Record if Other:
B. Fixation of plates incubation: Elapsed Time: (10‐12 min) √ if 10‐12 min Other: (Record)
Check cell monolayer. Record any problem wells on Attachment 2: Cell Confluence Table below if needed.
C. 1° Antibody (Anti‐NP mouse monoclonal Ab):
1° Antibody Supplier and Cat. # 1° Antibody Lot # Working Dilution 1° Antibody
Expiration Date
Millipore Cat. # MAB8257 Pool Millipore Cat. # MAB8258
NA
Elapsed Time: (1h ± 5 min) √ if 1h ± 5 min Other: (Record)
D. 2o Antibody (Anti‐mouse IgG HRP labeled) incubation:
2° Antibody Supplier and Cat. # 2° Antibody Lot # Working Dilution 2° Antibody
Expiration Date
KPL Cat. # 074‐1802
Elapsed Time: (1h ± 5 min) √ if 1h ± 5 min Other: (Record)
Start Time:
Investigator Initials: Date:
Investigator Initials: Date:
Investigator Initials: Date:
Page 22 of 25

.
E. Substrate: Lot#: Lot # Citrate Buffer
(Sigma‐Aldrich Cat. # P4922) Exp. Date:
OPD (Sigma‐Aldrich Cat. # P8287) Exp. Date:
F. Initials of testing operators at Day 2:
Part 3: Components
A. Microtitre plates Component Supplier Cat. Part # Lot # Expiration Date
Microtitre plates Thermo Scientific 3455
B. PBS
Phosphate Buffered Saline Lot # Expiration Date
CDC SRP Cat. # CP0549 CDC Cat. # 4550C Other:
Part 4: Final Review
Reviewer Signature:
Date:
Investigator Initials: Date:
Investigator Initials: Date:
Investigator Initials: Date:
Page 23 of 25
.
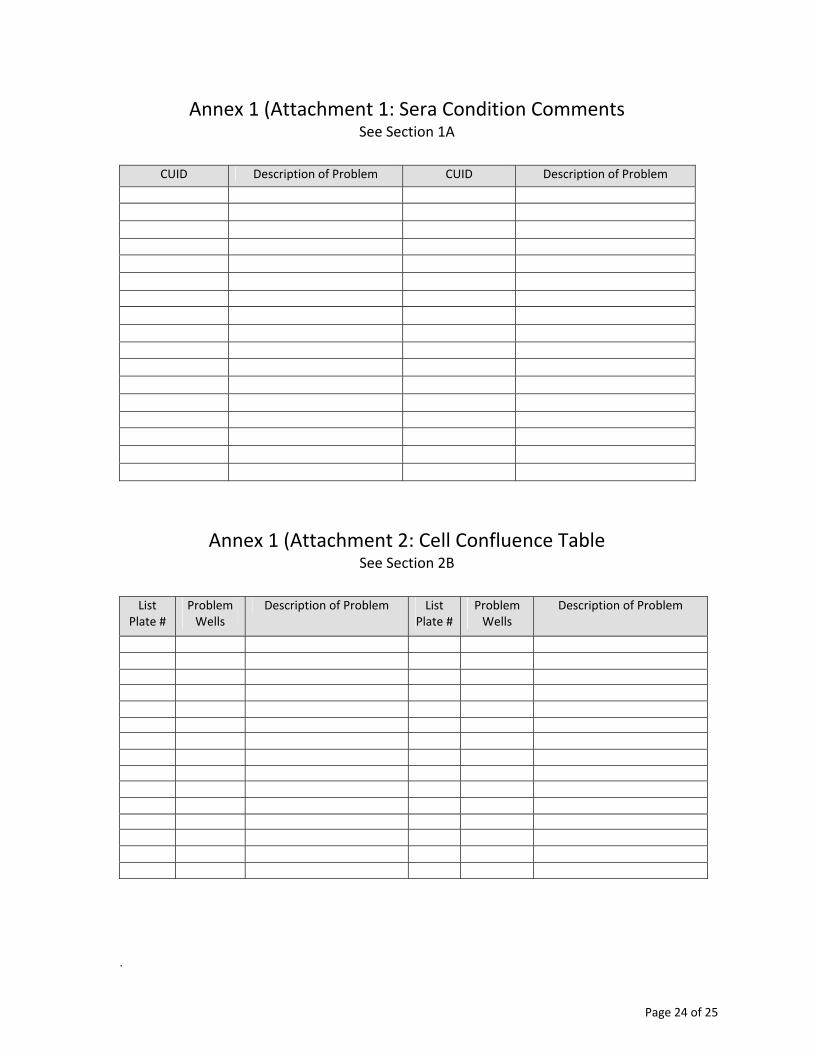
Annex 1 (Attachment 1: Sera Condition Comments See Section 1A
Annex 1 (Attachment 2: Cell Confluence Table See Section 2B
CUID Description of Problem CUID Description of Problem
List Plate #
Problem Wells
Description of Problem List Plate #
Problem Wells
Description of Problem
Page 24 of 25
.
Comments:
Initial here only if Attachment 1 or 2 is used (see Section 1A or 2B). Investigator initials/date:
Investigator initials/date:
Page 25 of 25