sezen 2008
TRANSCRIPT
7/23/2019 Sezen 2008
http://slidepdf.com/reader/full/sezen-2008 1/10
Engineering Structures 30 (2008) 794–803
www.elsevier.com/locate/engstruct
Dynamic analysis and seismic performance evaluation of above-groundliquid-containing tanks
Halil Sezena,∗, Ramazan Livaoglu b, Adem Dogangunc
a Department of Civil and Environmental Engineering and Geodetic Science, The Ohio State University, 470 Hitchcock Hall, 2070 Neil Ave., Columbus, OH
43210-1275, United Statesb Department of Civil Engineering, Karadeniz Technical University, G ¨ um¨ ushane, Turkey
c Department of Civil Engineering, Karadeniz Technical University, Trabzon, Turkey
Received 27 December 2006; received in revised form 30 April 2007; accepted 1 May 2007
Available online 2 July 2007
Abstract
A large number of industrial facilities were damaged during the 1999 M w7.4 Kocaeli, Turkey earthquake. One of those industrial facilities,
Habas plant located within 10 km of the fault trace, provides liquefied gases to commercial plants and medical facilities. Two of the three tanks
at the Habas facility collapsed during the earthquake. The main objectives of this paper were to evaluate the seismic performance of tanks and
investigate the parameters influencing the dynamic behaviour. Simplified and finite element dynamic analyses of the tanks are carried out including
the effect of liquefied gas–structure interaction using a ground motion recorded at a nearby site. The vulnerabilities of the structural system, the
observed performance, and damage pattern are discussed by comparing the dynamic analysis results with the strength and deformation capacity
of the support columns. The dynamic analysis results from a simplified three-mass model and a finite element model confirmed that the axial
and lateral strength of the columns supporting the two nearly full tanks were not sufficient to resist the demand imposed during the earthquake.
Consistent with the observed structural performance, an elastic response is predicted for the columns supporting the undamaged 25% full identical
tank.c 2008 Published by Elsevier Ltd
Keywords: Above-ground tanks; Liquefied gas–structure interaction; Sloshing effect; Column failure; Earthquake damage
1. Introduction
The 7.4 magnitude earthquake that struck northwestern
Turkey on August 17, 1999 caused extensive damage to res-
idential, commercial, and industrial facilities. Approximately
40% of the heavy industry in Turkey was located in the epi-
central region and included oil refineries, pharmaceutical and
petrochemical plants, power plants, car assembly and tyre man-ufacturing facilities, cement production and steel fabrication
plants, and other industries. The majority of the affected indus-
trial facilities were located a short distance from the North Ana-
tolian fault that ruptured during the earthquake. Several post-
earthquake reconnaissance teams visited the industrial facili-
ties and reported the damages (e.g. Johnson et al. [8]; Rahnama
∗ Corresponding author. E-mail addresses: [email protected] (H. Sezen), [email protected]
(R. Livaoglu), [email protected] (A. Dogangun).
and Morrow [13]; Sezen et al., [14,16]). Structural and non-
structural damage to these facilities were summarized and seis-
mic performances were reported using a damage classification
scheme by Sezen and Whittaker [15].
The reconnaissance efforts and research studies investigating
the performance evaluation of industrial structures during the
1999 Turkey earthquake, for the most part, concentrated on
the collapse of a 115 m-high reinforced concrete chimney orheater stack located at the largest oil refinery in Turkey (e.g.
Kilic and Sozen [10], and Huang et al. [9]). Seismic analysis
and observed behaviour of other industrial structures such as
those investigated in this paper provide valuable information
in improving the design guidelines for similar new structures
as well as performance evaluation of existing structures. The
results of this study are particularly important as it evaluates
the performance of three identical liquid-containing structures,
two of which collapsed while the third one suffered virtually
no damage during the earthquake. The only difference between
0141-0296/$ - see front matter c 2008 Published by Elsevier Ltd
doi:10.1016/j.engstruct.2007.05.002
7/23/2019 Sezen 2008
http://slidepdf.com/reader/full/sezen-2008 2/10
H. Sezen et al. / Engineering Structures 30 (200 8) 794–803 795
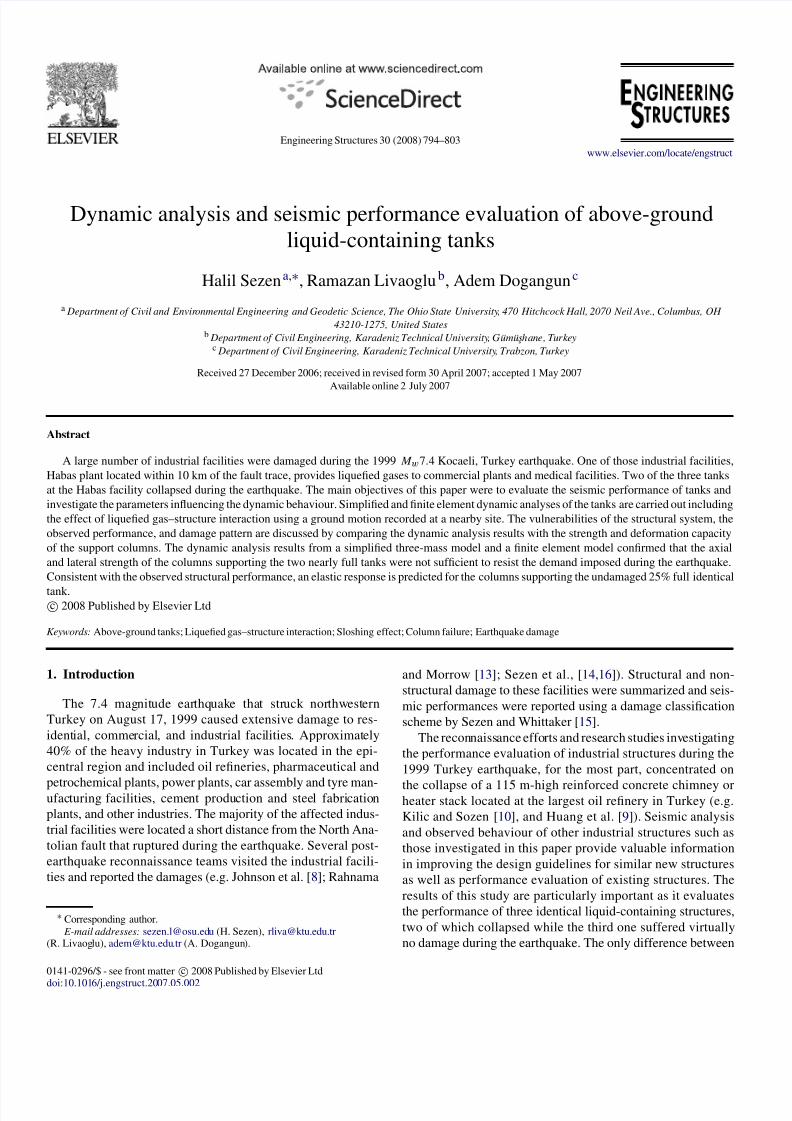
Fig. 1. Elastic ground motion response spectra and design response spectra [15].
Table 1
Recorded peak ground accelerations from stations in epicentral region
Station Distancea (km) Site class Peak ground acceleration
N-S (%g) E-W (%g) Vertical (%g)
Duzce (DZC) 14 Soft soil 37 32 36
Sakarya (SKR) 3 Stiff soil NA 41 26
Izmit (IZT) 8 Rock 17 22 15
Yarimca (YPT) 4 Soft soil 32 23 24
Gebze (GBZ) 17 Stiff soil 26 14 20
Fatih (FAT) 65 Soft soil 18 16 13
Ambarli (ATS) 79 Soft soil 25 18 8
a Distance from rupture plane.
the collapsed and undamaged structures was the amount of the liquefied gas contained inside the tanks. In addition to the
obvious effect of increased mass on the dynamic response, the
effects of liquefied gas sloshing and liquefied gas–structureinteraction are also investigated in this paper.
Modern structural engineering practices aim to prevent shearfailure in columns which is brittle and frequently leads to
partial or total collapse of the structure. In order to achieve
a ductile column response, the shear force, V p required todevelop maximum flexural moment capacity, M p must be
smaller than the shear strength, V n of the column. For columns
bending in double curvature, as in the tanks in this study,V p = 2 M p/ L, where L is the total column height and M p is
calculated from moment–curvature analysis using a fiber modelfor the cross section. The maximum column axial load, bendingmoment, and shear force demands are calculated from dynamic
time history analysis of the empty tank and tanks containing
liquefied oxygen and nitrogen. These predicted demands arethen compared with the axial load, moment, and shear strength
or capacity of the columns.
2. Recorded ground motions and design spectra
The seven strong motion stations that recorded earthquakemotions with peak ground accelerations larger than 0.14g dur-
ing the Kocaeli earthquake are listed in Table 1. The closest dis-
tance to the fault rupture plane and site classifications are also
listed in the table. The elastic response spectra with five-percentdamping ratio and the corresponding median spectrum for the
13 horizontal acceleration histories from the seven recording
stations are presented in Fig. 1(a). The figure also presents the
elastic design spectra calculated using the provisions of the
Turkish Seismic Code [18] and the 1997 Uniform Building
Code [19] for rock and soft soil sites. The UBC spectra were
constructed assuming a near-field amplification factor of 1.0
and soil type S E (soft soil). Fig. 1(a) can be used to compare
the spectral demands from the 13 recorded horizontal ground
motions with the elastic demands of the Turkish and US build-
ing standards in use at the time of the Kocaeli earthquake. Also
shown in the figure is the median spectrum of the 13 horizontal
components of ground shaking identified in Table 1.Two current specifications that can be used for the design
of industrial facilities are the ASCE Guidelines for Seismic
Evaluation and Design of Petrochemical Facilities [2] and
FEMA 368 NEHRP recommended provisions for seismic
regulations for new buildings and other structures [6]. Fig. 1(b)
presents the 5% damped ASCE and FEMA 368 elastic spectra
and the median spectrum of Fig. 1(a). Based on these data, the
earthquake shaking recorded in the epicentral region could be
considered as representative of design-basis shaking.
During the 1999 Kocaeli earthquake, Yarimca (YPT) and
Izmit (IZT) stations listed in Table 1 were the closest strong
motion stations to the Habas plant where the liquefied gas

7/23/2019 Sezen 2008
http://slidepdf.com/reader/full/sezen-2008 3/10
796 H. Sezen et al. / Engineering Structures 30 (2008) 794–803
Fig. 2. Ground motions recorded at the YPT station during the 1999 Kocaeli earthquake.
Fig. 3. Two damaged liquefied oxygen tanks (LOXT) and the undamaged liquefied nitrogen tank (LNT, on the right) at the Habas facility.
storage tanks were located. Considering that the site class for
Habas was not rock (IZT station was on rock), the earthquake
motions recorded at the Yarimca site are used in this paper
to analyze the tanks with similar site characteristics. The
horizontal (YPT-NS (North–South) and YPT-EW (East–West))
and vertical (YPT-UP) acceleration histories recorded at theYPT station are shown in Fig. 2. The peak horizontal ground
acceleration at the YPT station was 0.32g. In this study, the
North–South component of the YPT record is used in the
dynamic analysis of the tanks.
3. Description of tanks
The three identical liquefied gas storage tanks at the
Habas facility in the Uzunciftlik area of Izmit, Turkey were
built in 1995 (Fig. 3). These tanks, in a sense, are unique
structures because they have tall cylindrical vessels supported
by relatively short reinforced concrete columns. In traditional
elevated tanks or water towers, the vessel is supported by
a relatively tall support structure whose dynamic flexural
behaviour dominates the overall response. The cylindrical tanks
considered herein have geometrical properties similar to those
of ground-level tanks, yet their dynamic response is rather
different because the total response appears to be largelyaffected by the dynamic behaviour of support columns.
The two damaged tanks on the left in Fig. 3 contained
liquefied oxygen while the undamaged tank on the right had
liquefied nitrogen. Habas representatives on site reported that
the liquefied oxygen tanks (LOXT) were 85% full and the
liquefied nitrogen tank (LNT) was about 25% full immediately
before the earthquake. Each tank consisted of two concentric
stainless steel shells, one with an outside diameter of 14.6 m and
the other with an outside diameter of 12.8 m. The gap between
the inner and outer shells was filled with perlite which is a form
of natural glass (foam) and a lightweight insulating material.
The clear height of the tanks between the bottom slab and top
7/23/2019 Sezen 2008
http://slidepdf.com/reader/full/sezen-2008 4/10
H. Sezen et al. / Engineering Structures 30 (200 8) 794–803 797
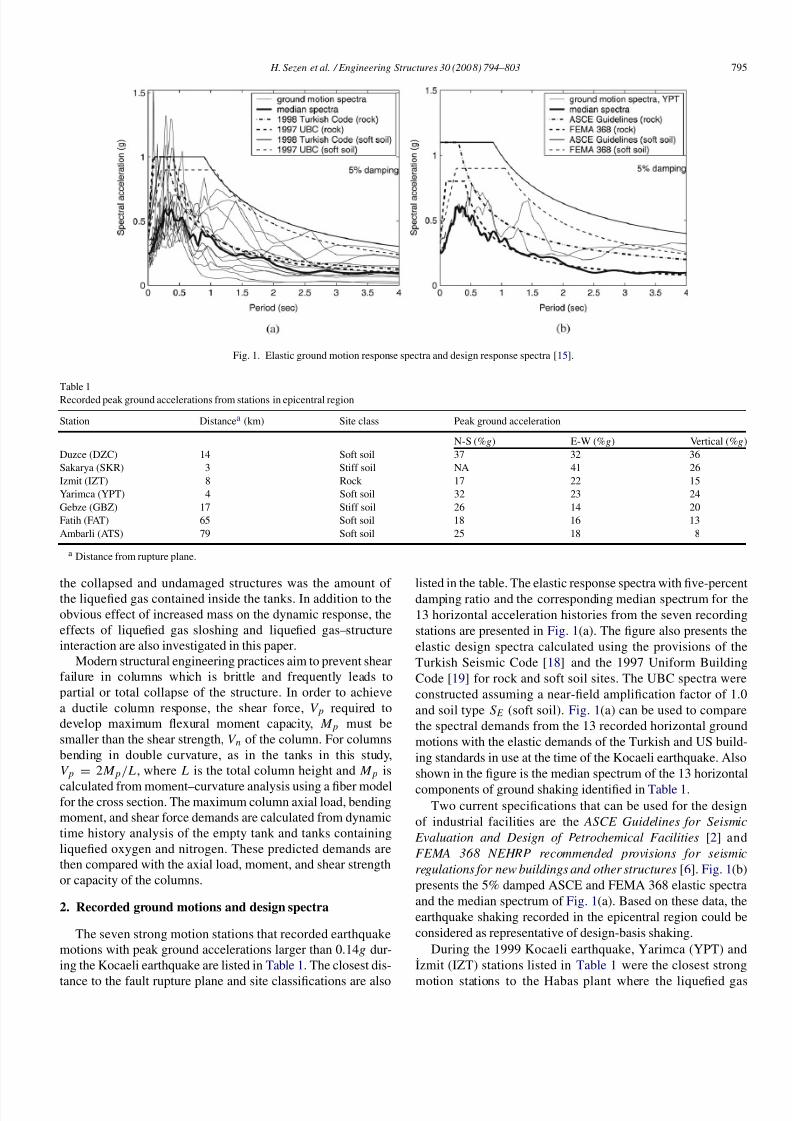
Fig. 4. Collapsed circular columns under one of the liquefied oxygen tanks.
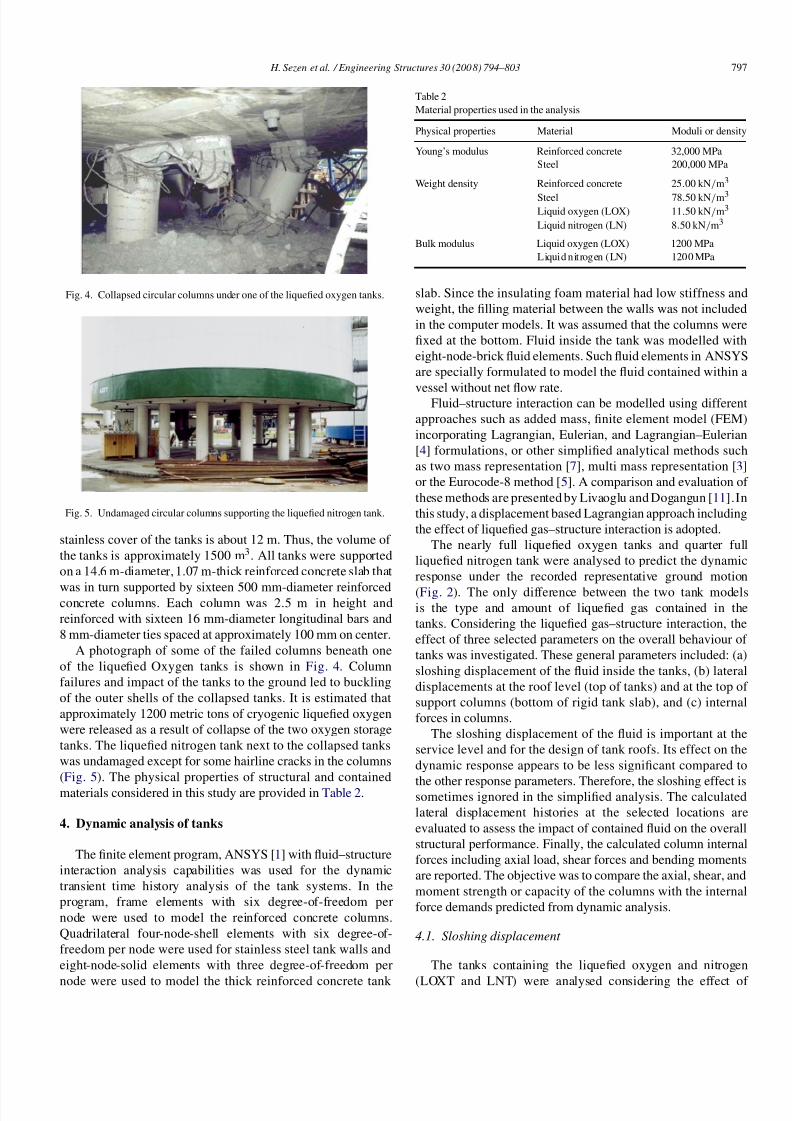
Fig. 5. Undamaged circular columns supporting the liquefied nitrogen tank.
stainless cover of the tanks is about 12 m. Thus, the volume of
the tanks is approximately 1500 m3. All tanks were supported
on a 14.6 m-diameter, 1.07 m-thick reinforced concrete slab that
was in turn supported by sixteen 500 mm-diameter reinforcedconcrete columns. Each column was 2.5 m in height and
reinforced with sixteen 16 mm-diameter longitudinal bars and
8 mm-diameter ties spaced at approximately 100 mm on center.
A photograph of some of the failed columns beneath one
of the liquefied Oxygen tanks is shown in Fig. 4. Column
failures and impact of the tanks to the ground led to buckling
of the outer shells of the collapsed tanks. It is estimated that
approximately 1200 metric tons of cryogenic liquefied oxygen
were released as a result of collapse of the two oxygen storage
tanks. The liquefied nitrogen tank next to the collapsed tanks
was undamaged except for some hairline cracks in the columns
(Fig. 5). The physical properties of structural and contained
materials considered in this study are provided in Table 2.
4. Dynamic analysis of tanks
The finite element program, ANSYS [1] with fluid–structure
interaction analysis capabilities was used for the dynamic
transient time history analysis of the tank systems. In the
program, frame elements with six degree-of-freedom per
node were used to model the reinforced concrete columns.
Quadrilateral four-node-shell elements with six degree-of-
freedom per node were used for stainless steel tank walls and
eight-node-solid elements with three degree-of-freedom per
node were used to model the thick reinforced concrete tank
Table 2
Material properties used in the analysis
Physical properties Material Moduli or density
Young’s modulus Reinforced concrete 32,000 MPa
Steel 200,000 MPa
Weight density Reinforced concrete 25.00 kN/m3
Steel 78.50 kN/m3
Liquid oxygen (LOX) 11.50 kN/m3
Liquid nitrogen (LN) 8.50 kN/m3
Bulk modulus Liquid oxygen (LOX) 1200 MPa
Liquid nitrogen (LN) 1200 MPa
slab. Since the insulating foam material had low stiffness and
weight, the filling material between the walls was not included
in the computer models. It was assumed that the columns were
fixed at the bottom. Fluid inside the tank was modelled with
eight-node-brick fluid elements. Such fluid elements in ANSYS
are specially formulated to model the fluid contained within a
vessel without net flow rate.Fluid–structure interaction can be modelled using different
approaches such as added mass, finite element model (FEM)
incorporating Lagrangian, Eulerian, and Lagrangian–Eulerian
[4] formulations, or other simplified analytical methods such
as two mass representation [7], multi mass representation [3]
or the Eurocode-8 method [5]. A comparison and evaluation of
these methods are presented by Livaoglu and Dogangun [11].In
this study, a displacement based Lagrangian approach including
the effect of liquefied gas–structure interaction is adopted.
The nearly full liquefied oxygen tanks and quarter full
liquefied nitrogen tank were analysed to predict the dynamic
response under the recorded representative ground motion
(Fig. 2). The only difference between the two tank modelsis the type and amount of liquefied gas contained in the
tanks. Considering the liquefied gas–structure interaction, the
effect of three selected parameters on the overall behaviour of
tanks was investigated. These general parameters included: (a)
sloshing displacement of the fluid inside the tanks, (b) lateral
displacements at the roof level (top of tanks) and at the top of
support columns (bottom of rigid tank slab), and (c) internal
forces in columns.
The sloshing displacement of the fluid is important at the
service level and for the design of tank roofs. Its effect on the
dynamic response appears to be less significant compared to
the other response parameters. Therefore, the sloshing effect issometimes ignored in the simplified analysis. The calculated
lateral displacement histories at the selected locations are
evaluated to assess the impact of contained fluid on the overall
structural performance. Finally, the calculated column internal
forces including axial load, shear forces and bending moments
are reported. The objective was to compare the axial, shear, and
moment strength or capacity of the columns with the internal
force demands predicted from dynamic analysis.
4.1. Sloshing displacement
The tanks containing the liquefied oxygen and nitrogen
(LOXT and LNT) were analysed considering the effect of
7/23/2019 Sezen 2008
http://slidepdf.com/reader/full/sezen-2008 5/10
798 H. Sezen et al. / Engineering Structures 30 (2008) 794–803
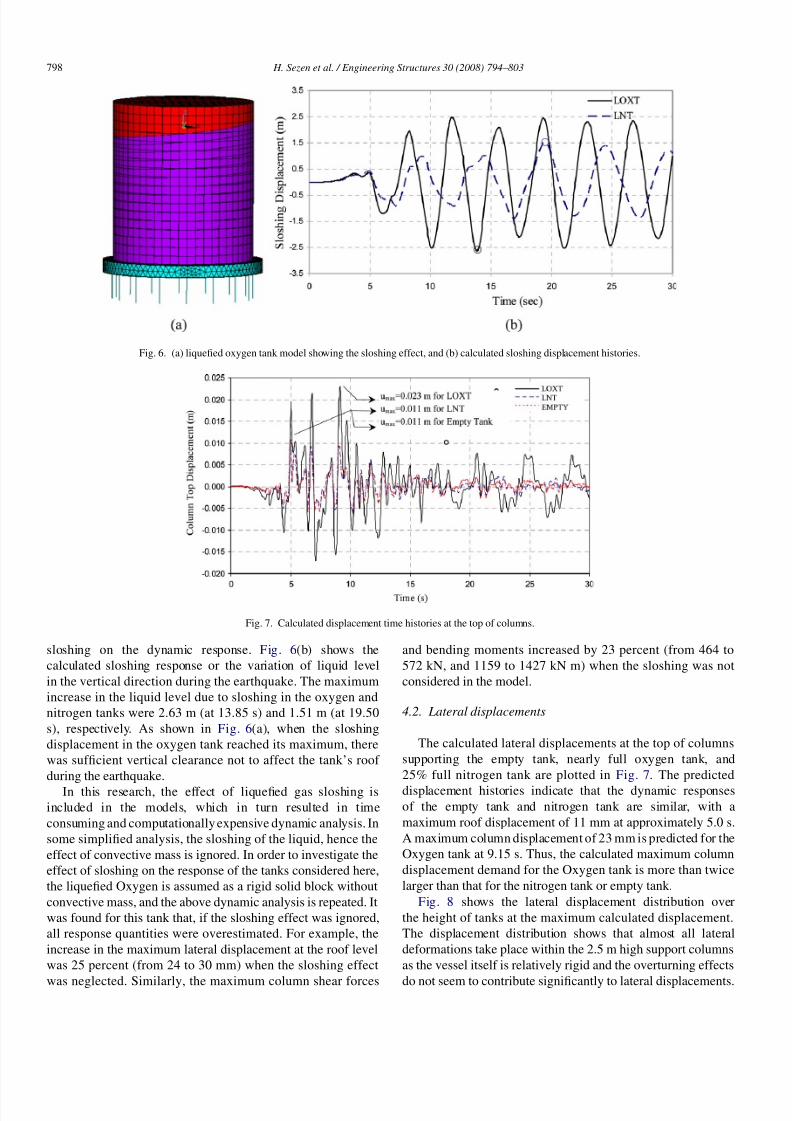
Fig. 6. (a) liquefied oxygen tank model showing the sloshing effect, and (b) calculated sloshing displacement histories.
Fig. 7. Calculated displacement time histories at the top of columns.
sloshing on the dynamic response. Fig. 6(b) shows the
calculated sloshing response or the variation of liquid level
in the vertical direction during the earthquake. The maximum
increase in the liquid level due to sloshing in the oxygen and
nitrogen tanks were 2.63 m (at 13.85 s) and 1.51 m (at 19.50
s), respectively. As shown in Fig. 6(a), when the sloshing
displacement in the oxygen tank reached its maximum, there
was sufficient vertical clearance not to affect the tank’s roof
during the earthquake.
In this research, the effect of liquefied gas sloshing is
included in the models, which in turn resulted in time
consuming and computationally expensive dynamic analysis. In
some simplified analysis, the sloshing of the liquid, hence the
effect of convective mass is ignored. In order to investigate the
effect of sloshing on the response of the tanks considered here,
the liquefied Oxygen is assumed as a rigid solid block without
convective mass, and the above dynamic analysis is repeated. It
was found for this tank that, if the sloshing effect was ignored,
all response quantities were overestimated. For example, the
increase in the maximum lateral displacement at the roof level
was 25 percent (from 24 to 30 mm) when the sloshing effect
was neglected. Similarly, the maximum column shear forces
and bending moments increased by 23 percent (from 464 to
572 kN, and 1159 to 1427 kN m) when the sloshing was not
considered in the model.
4.2. Lateral displacements
The calculated lateral displacements at the top of columns
supporting the empty tank, nearly full oxygen tank, and
25% full nitrogen tank are plotted in Fig. 7. The predicted
displacement histories indicate that the dynamic responsesof the empty tank and nitrogen tank are similar, with a
maximum roof displacement of 11 mm at approximately 5.0 s.
A maximum column displacement of 23 mm is predicted for the
Oxygen tank at 9.15 s. Thus, the calculated maximum column
displacement demand for the Oxygen tank is more than twice
larger than that for the nitrogen tank or empty tank.
Fig. 8 shows the lateral displacement distribution over
the height of tanks at the maximum calculated displacement.
The displacement distribution shows that almost all lateral
deformations take place within the 2.5 m high support columns
as the vessel itself is relatively rigid and the overturning effects
do not seem to contribute significantly to lateral displacements.

7/23/2019 Sezen 2008
http://slidepdf.com/reader/full/sezen-2008 6/10
H. Sezen et al. / Engineering Structures 30 (200 8) 794–803 799
Fig. 8. Lateral displacement distribution over the height of liquefied oxygen
tank, LOXT (at 9.15 s) and liquefied nitrogen tank, LNT (at 5.0 s).
The lateral drift demands for the columns supporting the
oxygen and nitrogen tanks are then approximately 1.0% and
0.4%, respectively. Consistent with the conclusions drawn from
the maximum displacement distributions presented in Fig. 8,
the entire time histories of calculated roof displacements for
the three tanks were very similar to those shown in Fig. 7. The
maximum dynamic roof displacements for the empty tank and
tanks containing liquefied nitrogen and oxygen were 11, 11, and
24 mm, respectively.
4.3. Internal forces
The flexural, shear and deformation capacity and the failure
mode (ductile or brittle) of a column is associated with the
magnitude of the applied axial load and its variation during an
earthquake. Failure of one or few columns may lead to partial
or total collapse of the structure, as experienced by the liquefied
oxygen tanks at the Habas facility. The calculated dynamic
axial load histories are presented for the oxygen, nitrogen and
empty tanks in Fig. 9. The magnitude of static axial load or
the initial gravity load on each column supporting the liquefied
oxygen, nitrogen and empty tanks was 1761, 842, and 680 kN,
respectively. The maximum axial loads obtained from dynamic
analysis including the sloshing and overturning effects are
2648, 1028, and 888 kN as shown in Fig. 9. These maximumdynamic loads represent 50% and 18% increase over the static
axial loads in columns supporting the liquefied oxygen and
nitrogen tanks.
The flexural demand imposed on the columns is another
critical parameter for determining the failure mode and the
likely reason for the failure of columns supporting the tanks
containing liquefied Oxygen. The calculated dynamic time
history of moment demands are shown in Fig. 10. The
maximum moment was reached at approximately 9.50 s in
columns under each tank. The maximum moment in columns
supporting the liquefied oxygen tank is about twice as large as
that in other columns.
Some of the collapsed columns at Habas showed signs of apparent shear distress at failure (Fig. 4). When column failures
occur under seismic loading, it is imperative to compare the
estimated shear force demands with the column shear strength.
The predicted dynamic column shear forces or demands are
shown in Fig. 11 for the column subjected to maximum shear
forces. It appears that the maximum column shear force for the
liquefied Oxygen tank is approximately two times larger than
that for the empty and liquefied nitrogen tanks.
5. Strength and displacement capacity of columns and
comparison with observed response
To better evaluate the seismic performance of the columns
supporting the tanks, shear strength and flexural deformation
capacities of a sample column are calculated. According to
Turkish Standard Code, TS 500 [17], the nominal shear strength
of a column can be calculated from
V n,TS500 = V c + V s = 0.8
0.65 f ct d Ag
1 + 0.007
P
Ag
+ Av f y d
s(1)
Fig. 9. Calculated time histories of column axial loads for the three tanks analysed.

7/23/2019 Sezen 2008
http://slidepdf.com/reader/full/sezen-2008 7/10
800 H. Sezen et al. / Engineering Structures 30 (2008) 794–803
Fig. 10. Calculated time histories of maximum column moments for the three tanks analysed.
Fig. 11. Calculated time histories of column shear forces for the three tanks analysed
where Ag = gross area of column cross-section, f ct d = designtensile strength of concrete, P = axial load, Av = transverse
reinforcement area within a spacing of s, d = effective depth of
section, and f y = yield strength of transverse reinforcement.
It should be noted that mm, N, and MPa units are used in
Eq. (1). For a typical 500 mm diameter tank column, Ag =
196, 350 mm2, the maximum axial load calculated from time
history analysis, P = 2.648 × 10⁶ N, f ct d = 1.35 MPa,
f c = 28 MPa, Av = 100.5 mm2, d = 450 mm, s = 100 mm,
and f y = 365 MPa. Then, the shear strength calculated from
Eq. (1) is 316 kN. The maximum dynamic column shear forces
(234 and 250 kN) for the empty and liquefied nitrogen tanks
were less than the code design shear strength. However, the
maximum seismic column shear force for the liquefied oxygen
tank (464 kN) is larger than the shear capacity of columns
calculated from TS500, indicating that the observed column
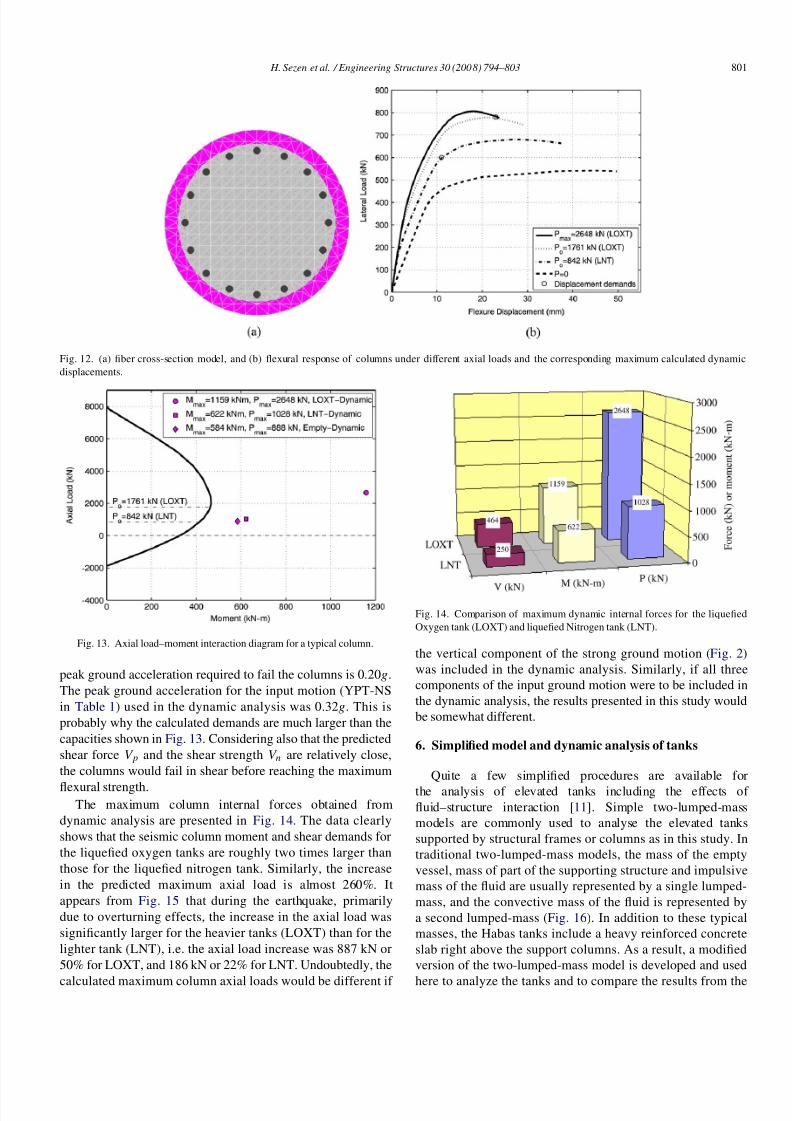
failures may be due to insufficient shear strength.Fig. 12 shows a discretized column cross-section and the
lateral load–flexural displacement response calculated using the
sectional moment–curvature relations. The axial load–moment
interaction diagram for a typical column is presented in Fig. 13.
For the moment–curvature and axial load–moment interaction
curve calculations, an estimated concrete compressive strength,
f c of 28 MPa is used for the unconfined concrete representing
cover concrete. Per Mander et al. [12], a confined concrete
strength of 35 MPa is used for concrete confined by column ties.
The yield and tensile strengths of the longitudinal steel wereestimated to be 414 MPa and 620 MPa, respectively. Fig. 12
shows that, with increasing axial load, the flexural strength and
stiffness increases, and deformation capacity decreases. The
maximum displacement demands shown in the same figure,
i.e., 23 and 11 mm for the oxygen and nitrogen tanks (from
Fig. 7), indicate that the columns supporting the oxygen tanks
do not seem to have sufficient deformation capacity under the
maximum axial load of 2648 kN.The comparison of maximum predicted seismic axial
load–moment pairs (from Figs. 9 and 10) with the combined
axial load and moment capacity indicate that force demands
on the columns supporting the liquefied oxygen tanks were
extremely large (Fig. 13). The axial load–moment demand
pairs shown in Fig. 13 occur at distinct instants of time
for the Nitrogen and empty tanks even though they are
plotted as simultaneous pairs. Considering that these maximum
demands were imposed on the columns only a few times and
instantaneously during the earthquake, the demands on the
empty and nitrogen tank columns are probably close to the
limits of the capacity curve. As shown in Fig. 13, the maximum
moment, M p corresponding to the initial gravity load of 1761
kN is 451 kN m. Assuming fixity at the top and bottom of
the column, the corresponding shear force V p is 361 kN or
20% of the supported weight. Assuming that the fluid in the
85% full liquefied oxygen tank was 100% reactive, then the
7/23/2019 Sezen 2008
http://slidepdf.com/reader/full/sezen-2008 8/10
H. Sezen et al. / Engineering Structures 30 (200 8) 794–803 801
Fig. 12. (a) fiber cross-section model, and (b) flexural response of columns under different axial loads and the corresponding maximum calculated dynamic
displacements.
Fig. 13. Axial load–moment interaction diagram for a typical column.
peak ground acceleration required to fail the columns is 0.20g.
The peak ground acceleration for the input motion (YPT-NS
in Table 1) used in the dynamic analysis was 0.32g. This is
probably why the calculated demands are much larger than the
capacities shown in Fig. 13. Considering also that the predicted
shear force V p and the shear strength V n are relatively close,
the columns would fail in shear before reaching the maximum
flexural strength.The maximum column internal forces obtained from
dynamic analysis are presented in Fig. 14. The data clearly
shows that the seismic column moment and shear demands for
the liquefied oxygen tanks are roughly two times larger than
those for the liquefied nitrogen tank. Similarly, the increase
in the predicted maximum axial load is almost 260%. It
appears from Fig. 15 that during the earthquake, primarily
due to overturning effects, the increase in the axial load was
significantly larger for the heavier tanks (LOXT) than for the
lighter tank (LNT), i.e. the axial load increase was 887 kN or
50% for LOXT, and 186 kN or 22% for LNT. Undoubtedly, the
calculated maximum column axial loads would be different if
Fig. 14. Comparison of maximum dynamic internal forces for the liquefied
Oxygen tank (LOXT) and liquefied Nitrogen tank (LNT).
the vertical component of the strong ground motion (Fig. 2)
was included in the dynamic analysis. Similarly, if all three
components of the input ground motion were to be included in
the dynamic analysis, the results presented in this study would
be somewhat different.
6. Simplified model and dynamic analysis of tanks
Quite a few simplified procedures are available for
the analysis of elevated tanks including the effects of
fluid–structure interaction [11]. Simple two-lumped-mass
models are commonly used to analyse the elevated tanks
supported by structural frames or columns as in this study. In
traditional two-lumped-mass models, the mass of the empty
vessel, mass of part of the supporting structure and impulsive
mass of the fluid are usually represented by a single lumped-
mass, and the convective mass of the fluid is represented by
a second lumped-mass (Fig. 16). In addition to these typical
masses, the Habas tanks include a heavy reinforced concrete
slab right above the support columns. As a result, a modified
version of the two-lumped-mass model is developed and used
here to analyze the tanks and to compare the results from the

7/23/2019 Sezen 2008
http://slidepdf.com/reader/full/sezen-2008 9/10
802 H. Sezen et al. / Engineering Structures 30 (2008) 794–803
Fig. 15. Comparison of maximum seismic internal forces and initial axial load for: (a) liquefied Oxygen tank (LOXT), and (b) liquefied Nitrogen tank (LNT).
(a) Finite element model. (b) Mechanical model. (c) Simplified model.
Fig. 16. Finite element model and simplified three-lumped-mass model for LOXT.
finite element dynamic analyses discussed above. The proposed
simplified three-lumped-mass model is shown in Fig. 16(c).
In this model, m1 is the sum of the masses of rigid concrete
slab and support columns; m2 is the sum of the masses of
empty vessel and impulsive mass of the liquefied gas; and m 2
is equal to convective mass of the liquefied gas. k 1 and k 2 are
the flexural stiffness of the columns and stiffness of convective
mass. It is assumed that the concrete slab and impulsive mass
are rigidly connected. Additional information and definition of
these parameters are provided in Livaoglu and Dogangun [11].
The shear force time history of a column supporting theliquefied oxygen tank is calculated using the simplified three-
lumped-mass model (Fig. 17). The maximum shear force
predicted from the simplified model is 650 kN, which is larger
than the shear force of 464 kN calculated using the finite
element model of the same tank. These results suggest that such
a simplified model can be used conservatively in preliminary
design or analysis of this type of tanks.
7. Conclusions
During the 1999 Kocaeli, Turkey earthquake, two of the
three above-ground tanks located at the Habas plant collapsed
as a result of failure of reinforced concrete columns supporting
the tanks. The collapsed tanks contained liquefied oxygen
and were 85% full, and the undamaged liquefied nitrogen
tank was 25% full at the time of the earthquake. The main
objective of this study was to analyse the tanks using a finite
element model including liquefied gas–structure interaction and
a simplified model, and to compare the calculated response with
the observed performance. A ground acceleration record from
a nearby site, with a peak ground acceleration of 0 .32g (YPT-
NS), is used as an input motion for the dynamic analysis. The
demands calculated from dynamic analyses are compared with
the predicted capacities of the support columns. The followingare the key conclusions.
The vertical gap between the tank roof and the top level of
liquefied Oxygen was sufficiently large such that the sloshing
fluid did not affect the roof during the earthquake. When the
effect of liquefied gas sloshing is ignored, i.e. if the fluid is
modelled as a single rigid mass, the lateral deformations and
column internal forces including shear and bending moments
are overestimated.
The lateral displacements calculated from dynamic analysis
of tanks showed that almost all lateral deformations take place
within the 2.5 m high support columns as the tank itself is
relatively rigid. If an elevated tank is desired in a seismic

7/23/2019 Sezen 2008
http://slidepdf.com/reader/full/sezen-2008 10/10
H. Sezen et al. / Engineering Structures 30 (200 8) 794–803 803
Fig. 17. Dynamic column shear force history calculated using the simplified model for LOXT.
region, the strength and deformation capacity or length of the
columns should be increased significantly, or an alternative
support structure should be used. The comparison of maximum
displacement demands and deformation capacities indicatedthat the columns supporting the oxygen tanks did not seem
to have sufficient deformation capacity under the maximum
potential axial load.
The predicted maximum dynamic force demands, including
axial load, shear and moments, in columns supporting the
collapsed liquefied oxygen tanks were almost two times larger
than those in columns of empty and liquefied nitrogen tanks.
The estimated shear capacities were larger than the maximum
dynamic shear forces in columns supporting the empty and
liquefied nitrogen tanks, whereas the column shear strengths
were smaller than the maximum dynamic shear demands for
the liquefied oxygen tanks, indicating that the observed columnfailures were also due to insufficient shear strength.
Dynamic analysis of the tanks is repeated using a simplified
three-lumped-mass model. The simplified model overestimated
the response.
References
[1] ANSYS. V. 10.0. Swanson analysis systems Inc. Houston (Pennsylvania,
USA); 2006.
[2] ASCE. Guidelines for seismic evaluation and design of petrochemical
facilities. Task committee on seismic evaluation and design of
petrochemical facilities. Reston (Virginia): American Society of Civil
Engineers; 1997.
[3] Bauer HF. Fluid oscillations in the containers of a space vehicle and theirinfluence upon stability. NASA TRR 187; 1964.
[4] Dogangun A, Livaoglu R. Hydrodynamic pressures acting on the walls of
rectangular fluid containers. Structural Engineering and Mechanics 2004;
17(2):203–14.
[5] Eurocode-8. Design of structures for earthquake resistance — Part 4:
Silos, tanks, and pipelines. Final PT Draft. European Committee for
Standardization; 2003.
[6] FEMA 368. NEHRP Recommended provisions for seismic regulations
for new buildings and other structures. Federal emergency management
agency; 2001.
[7] Housner GW. Dynamic behavior of water tanks. Bulletin of Seismological
Society of the America 1963;53:381–7.
[8] Johnson GH, Aschheim M, Sezen H. Industrial facilities. Kocaeli, Turkey
earthquake of August 17, 1999 reconnaissance report, earthquake spectra,
supplement A to 16; 2000. p. 311–50.
[9] Huang W, Gould PL, Martinez R, Johnson GS. Non-linear analysis of
a collapsed reinforced concrete chimney. Earthquake Engineering and
Strucural Dynamics 2004;33:485–98.
[10] Kilic AS, Sozen MA. Evaluation of effect of August 17, 1999, Marmara
earthquake on two tall reinforced concrete chimneys. ACI Structural
Journal 2003;100(3):357–64.
[11] Livaoglu R, Dogangun A. Simplified seismic analysis procedures for
elevated tanks considering fluid–structure-soil interaction. Journal of
Fluids and Structures 2006;22(3):421–39.
[12] Mander JB, Priestley MJN, Park R. Theoretical stress–strain model for
confined concrete. ASCE Journal of Structural Engineering 1988;114(8):
241–69.[13] Rahnama M, Morrow G. Performance of industrial facilities in the August
17, 1999, Izmit earthquake. In: Proc., 12th world conf. on earthquake
engineering; 2000.
[14] Sezen H, Elwood KJ, Whittaker AS, Mosalam KM, Wallace JW,
Stanton JF. Structural engineering reconnaissance of the August 17,
1999 Kocaeli (Izmit), Turkey Earthquake. PEER rep. no. 2000/09. Pacific
Earthquake Engineering Research Center, University of California; 2000.
http://nisee.berkeley.edu/turkey/ .
[15] Sezen H, Whittaker AS. Seismic performance of industrial facilities
affected by the 1999 Turkey earthquake. ASCE Journal of Performance
of Constructed Facilities 2006;20(1):28–36.
[16] Sezen H, Whittaker AS, Elwood KJ, Mosalam KM. Performance of
reinforced concrete and wall buildings during the August 17, 1999
Kocaeli, Turkey earthquake, and seismic design and construction practice
in Turkey. Engineering Structures 2003;25(1):103–14.[17] TS 500. Requirements for design and construction of reinforced concrete
structures. Ankara: Turkish Standards Institute; 2000.
[18] Turkish Seismic Code. Specification for structures to be built in disaster
areas; Part III–Earthquake disaster prevention. Ministry of Public Works
and Settlement, Government of the Republic of Turkey; 1998.
[19] UBC. International conference of building officials. Uniform building
code, vol. 2: Structural engineering design provisions. Whittier
(California); 1997.