simo saarakkala pre-clinical ultrasound diagnostics of articular cartilage … · 2007-06-11 ·...
TRANSCRIPT
SIMO SAARAKKALA
Pre-Clinical Ultrasound Diagnostics ofArticular Cartilage and Subchondral Bone
JOKAKUOPIO 2007
KUOPION YLIOPISTON JULKAISUJA C. LUONNONTIETEET JA YMPÄRISTÖTIETEET 205KUOPIO UNIVERSITY PUBLICATIONS C. NATURAL AND ENVIRONMENTAL SCIENCES 205
Doctoral dissertation
To be presented by permission of the Faculty of Natural and Environmental Sciences
of the University of Kuopio for public examination in Auditorium L21,
Snellmania building, University of Kuopio,
on Friday 2nd February 2007, at 12 noon
Department of Physics, University of KuopioDepartment of Anatomy, University of Kuopio
Department of Clinical Physiology and Nuclear Medicine,Kuopio University Hospital and University of Kuopio
Distributor : Kuopio University LibraryP.O. Box 1627FI-70211 KUOPIOFINLANDTel. +358 17 163 430Fax +358 17 163 410http://www.uku.fi/kirjasto/julkaisutoiminta/julkmyyn.html
Series Editors: Professor Pertti Pasanen, Ph.D.Department of Environmental Sciences
Professor Jari Kaipio, Ph.D.Department of Physics
Author’s address: Department of Clinical RadiologyKuopio University HospitalP.O. Box 1777FI-70211 KUOPIOFINLANDTel. +358 44 717 4390Fax +358 17 173 341E-mail : [email protected]
Supervisors: Professor Jukka Jurvelin, Ph.D.Department of PhysicsUniversity of Kuopio
Docent Juha Töyräs, Ph.D.Department of Clinical NeurophysiologyKuopio University Hospital
Professor Heikki Helminen, M.D., Ph.D.Department of AnatomyUniversity of Kuopio
Reviewers: Professor Pascal Laugier, Ph.D.Laboratoire d’Imagerie ParametriqueUniversity of Paris
Associate Professor Yongping Zheng, Ph.D.Department of Health Technology and InformaticsThe Hong Kong Polytechnic University
Opponent: Professor Timo Jämsä, Ph.D.Department of Medical TechnologyUniversity of Oulu
ISBN 978-951-27-0683-9ISBN 978-951-27-0458-3 (PDF)ISSN 1235-0486
KopijyväKuopio 2007Finland
Saarakkala, Simo. Pre-Clinical Ultrasound Diagnostics of Articular Cartilage and SubchondralBone. Kuopio University Publications C. Natural and Environmental Sciences 205. 2007. 96 p.ISBN 978-951-27-0683-9ISBN 978-951-27-0458-3 (PDF)ISSN 1235-0486
ABSTRACT
In the modern society, osteoarthrosis (OA) is the most common joint disease with significantsociological and economical impact. OA is characterized by the progressive degeneration of thestructure and function of articular cartilage and subchondral bone. Current diagnostic techniquesof OA can only detect late-stage changes. The rapid progress in surgical techniques to repair localcartilage lesions has also augmented the need for accurate monitoring of cartilage healing.
Quantitative ultrasound techniques have been developed to permit a characterization of articu-lar cartilage. Previously, an ultrasound indentation instrument was shown to be able to distinguishin vitro normal tissue from enzymatically degraded cartilage tissue. Subsequently, quantitativeultrasound imaging (QUI) was demonstrated to be suitable for diagnosing the cartilage surfacedegeneration as well as the parallel changes in the cartilage-bone interface.
In the present thesis work, the ability of an ultrasound indentation instrument to distinguishdifferent histological degenerative grades of bovine articular cartilage during a spontaneous de-generation process was investigated in vitro. Furthermore, the suitability of QUI for detectingmechanically induced, enzymatically induced, or spontaneously developing degenerative changeswas investigated. Ultrasound reflection from the articular surface as well as from the cartilage-boneinterface were quantified and compared with the histological, biomechanical and biochemical refer-ence measurements. Furthermore, a novel approach for quantifying the cartilage surface roughnessfrom 2D ultrasound images was devised in this thesis work.
A significant linear correlation (r = 0.883) was observed between the dynamic modulus, mea-sured with the ultrasound indentation instrument, and the reference modulus from bovine articularcartilage (n = 70). Furthermore, the instrument sensitively distinguished histologically normal car-tilage from spontaneously degenerated tissue. QUI detected sensitively experimentally induced orspontaneously developing degenerative changes before these characteristic OA alterations could bevisualized. The ultrasound roughness index (URI) was demonstrated to be sensitive and specificfor histologically confirmed surface fibrillation of articular cartilage tissue. Ultrasound reflectionfrom the cartilage-bone interface increased statistically significantly during the progression of tissuedegeneration. All quantitative ultrasound parameters exhibited moderate or good reproducibilities.
These present results indicate that quantitative mechano-acoustic measurements are a feasi-ble way to sensitively characterize articular cartilage. The ultrasound indentation technique wascapable of determining short-term mechanical properties of cartilage. The instrument has nowbeen validated; the next stage will be its further development for clinical use. One major ben-efit of QUI, as compared to more localized measurement techniques, is the possibility to obtaininformation rapidly from larger areas of articular surfaces as well as from underneath the carti-lage surface. QUI techniques could be applied in vivo by developing an arthroscopic imaging probe.
Universal Decimal Classification: 534-8, 534.7, 534.8, 681.88National Library of Medicine Classification: QT 34, QT 36, WE 26, WE 300, WE 348, WN 208Medical Subject Headings: osteoarthritis/diagnosis; cartilage; cartilage, articular/ultrasonography;collagen; proteoglycans; biomechanics; acoustics; ultrasonics; ultrasonography; numerical analysis,computer-assisted


To my love, Kirsi

ACKNOWLEDGMENTS
This study was carried out during the years 2001-2006 in the Departments ofAnatomy and Physics, University of Kuopio, in the Department of Clinical Physi-ology and Nuclear Medicine, Kuopio University Hospital, and in the Department ofNuclear Medicine, Mikkeli Central Hospital.
I owe my deepest gratitude to my principal supervisor, Professor Jukka Jurvelin,Ph.D., for his professional and inspiring guidance during the whole project. Accom-plishing this thesis in the Biophysics of Bone and Cartilage (BBC) -group under hiscontinuous support, optimism and constructive criticism has been a privilege to me.
I express my sincere thanks to my other supervisor, Docent Juha Toyras, Ph.D.,for his extensive collaboration, practical supervision and criticism. His exhaustiveenthusiasm and true devotion to science have influenced me much.
I am very grateful to my third supervisor, Professor Heikki Helminen, M.D.,Ph.D., for giving me ”fatherly” guidance during the project. Besides supervision,he has placed the resources of the Department of Anatomy at my disposal in thebeginning of this project.
I am grateful to official reviewers, Professor Pascal Laugier, Ph.D., and AssociateProfessor Yongping Zheng, Ph.D., for their constructive criticism to improve thisthesis. I give my cordial thanks to Ewen Macdonald, Department of Pharmacologyand Toxicology, for revising the language of the thesis.
I send many thanks to all members of the BBC-group for their friendly, helpfuland cheerful attitude. Especially, I am deeply indebted to Mikko Laasanen, Ph.D.,for his co-operation since the very beginning of our research projects. It has reallybeen a pleasure to work with him - his sense of humour encountered mine evenafter long measurement days. Further, Jani Hirvonen, B.Eng., M.Sc., is cordiallyacknowledged for extensive LabVIEW software programming for my studies. I wantto express my special thanks also to Rami Korhonen, Ph.D., for conducting nu-merical analysis and introducing me the ”world of cartilage modeling”. I want tothank Jarno Rieppo, M.D., for the FT-IRIS and histological analyses and valuablediscussions. I give thanks to Heikki Nieminen, M.Sc., for constructive criticismand fruitful discussions of ultrasonics during the project. I thank Docent MiikaNieminen, Ph.D., Mikko Hakulinen, Ph.D., and Mikko Nissi, M.Sc., for valuablediscussions and support.
I express my gratitude to all of the personnel of the Department of Anatomy.Especially, Mrs. Eija Rahunen, Mrs. Elma Sorsa and Mr. Kari Kotikumpu areacknowledged for their help with the sample processing and laboratory techniques.I want to thank Docent Mikko Lammi, Ph.D., and Kari Torronen, M.Sc., for con-ducting the biochemical analyses. Alpo Pelttari, M.Sc., is warmly acknowledgedfor his technical assistance in SEM imaging. My thanks belong also to Mrs. ArjaHoffren and Mrs. Irma Paakkonen for the help with the university administration.
I wish to thank the whole personnel of the Department of Physics. My specialthanks go to the head of the Department, Professor Jari Kaipio, Ph.D., for valuablediscussions and follow-up during my thesis work. Professor Reijo Lappalainen, Ph.D.is acknowledged for collaboration, constructive criticism and discussions.
I wish to thank many members of the personnel of Mikkeli Central Hospital. Iam especially grateful to Docent Jari Heikkinen, Ph.D., for giving me the possibilityto conduct the thesis work during my hospital specialization period. I also thankJuhani Koski, M.D., Ph.D., for valuable discussions and co-operation in osteoarthitisresearch.
I want to thank Atria Lihakunta Oyj, Kuopio, and its personnel for the contin-uous possibility to use bovine knee joints as our research material.
I send my dearest thanks to my parents, Liisa and Lasse Saarakkala, and mybrother, Seppo Saarakkala, for their endless encouragement and support during myall studies and whole life.
Finally, I want to express my deepest and dearest thanks to my beloved wife,Kirsi, for her unconditional love and support. Together, we have learnt a lot aboutthe true meaning of life. Her support and understanding have made this thesispossible.
This thesis work was financially supported by several Finnish institutions: theNational Technology Agency (TEKES projects 40714/01 and 70061/02), KuopioUniversity Hospital (EVO grants 5173, 5203 and 5224), the Academy of Finland(projects 47471 and 205886), Etela-Savo Hospital District (TEVO grant) and Na-tional Graduate School of Musculoskeletal Diseases in Finland (TULES). The NorthSavo Fund of the Finnish Cultural Foundation, The South Savo Fund of the FinnishCultural Foundation, High Technology Foundation of Eastern Finland, RadiologicalSociety of Finland and Emil Aaltonen Foundation are acknowledged for their highlyvaluable personal grants.
Kuopio, February 2007
Simo Saarakkala
ABBREVIATIONS
1D One-dimensional2D Two-dimensionalACR American College of RheumatologyB-scan 2D ultrasound imageCC Amide I absorption (collagen content)COX Cyclo-oxygenaseCV Coefficient of variationdGEMRIC Gadolinium Enhanced T1 MRI mapping of cartilageFE Finite elementFFT Fast Fourier TransformFMC Medial femoral condyleFT-IRIS Fourier transform infrared spectroscopyGAG GlycosaminoglycanLPG Lateral patello-femoral grooveMankin score Cartilage tissue histological degenerative gradeMS Mankin scoreMTP Medial tibial plateauMRI Magnetic resonance imagingNSAID Non-steroidal anti-inflammatory drugOA OsteoarthrosisOCT Optical coherence tomographyPAT Patella (lateral upper quadrant)PBS Phosphate-buffered salineRho Intraclass correlation coefficientRMS Root mean squaresCV Standardized coefficient of variationSEM Scanning electron microscopySD Standard deviationX-ray Radiographic imaging

SYMBOLS
A Area of the surface or amplitude of the ultrasound signalA0(z, f) Frequency and depth-dependent attenuation functiona Radius of the indenter (or ultrasound transducer)α Attenuation coefficientc Speed of soundC ComplianceCijkl Elastic stiffness matrixd Distance∆f Frequency bandwidthE Young’s (elastic) modulusE(f) Acoustoelectric transfer functionEdyn Dynamic modulusEDynRef Reference dynamic modulusǫ Strainǫkl Strain tensorF Forcef FrequencyG(f) Acquisition system transfer functionHa Aggregate modulusHs(z, f)2 Surface-integrated diffraction functionH2O Water contenth Cartilage thicknessI Intensity of the ultrasound signalIRC Integrated reflection coefficient (for the cartilage surface)IRCbone Integrated reflection coefficient (for the cartilage-bone interface)J(t) Creep compliancek Permeability or wave numberkcreep Creep rateκ(a/h, ν) Theoretical scaling factor (indentation geometry)L Thickness or measurement lengthλ Wavelengthm Number of 1D ultrasound scan linesn Number of samples or data pointsν Poisson’s ratioω Angular temporal frequencyP Ultrasound signal powerp Statistical significance or acoustic pressureQg Ultrasound signal amplifying-correction factorR Ultrasound reflection coefficient (for the cartilage surface)
Rbone Ultrasound reflection coefficient (for the cartilage-bone interface)Ra Average surface roughnessRq RMS surface roughnessRc Ultrasound reflection coefficient for the cartilage surface
in the time domainRdB
c (f) Energy reflection coefficient for the cartilage surfacein the frequency domain
r Pearson’s correlation coefficientrs Spearman’s correlation coefficientρ DensityS0 Unprocessed ultrasound signalSH Hamming windowed ultrasound signalSc(z, f) Frequency domain ultrasound signal from the cartilage surfaceSr(z, f) Frequency domain ultrasound signal from the perfect reflectorσ Stressσij Stress tensorT Ultrasound transmission coefficient or length of time windowt Timeu Particle displacementURI Ultrasound roughness index (for the cartilage surface)v Ultrasonic wave velocityx Distancey(x) 1D surface profileZ Acoustic impedancez Distance or depth〈...〉 Spatial average
LIST OF ORIGINAL PUBLICATIONS
This thesis is based on the following original articles, which are referred to in thetext by their Roman numerals (I-V):
I Saarakkala S, Laasanen MS, Jurvelin JS, Torronen K, Lammi MJ, LappalainenR, Toyras J. Ultrasound indentation of normal and spontaneously degeneratedbovine articular cartilage.Osteoarthritis and Cartilage 11: 697-705, 2003.
II Saarakkala S, Korhonen RK, Laasanen MS, Toyras J, Rieppo J, Jurvelin JS.Mechano-acoustic determination of Young’s modulus of articular cartilage.Biorheology 41: 167-179, 2004.
III Saarakkala S, Toyras J, Hirvonen J, Laasanen MS, Lappalainen R, JurvelinJS. Ultrasonic quantitation of superficial degradation of articular cartilage.Ultrasound in Medicine and Biology 30: 783-792, 2004.
IV Laasanen MS, Saarakkala S, Toyras J, Rieppo J, Jurvelin JS. Site-specificultrasound reflection properties and superficial collagen content of bovine kneearticular cartilage.Physics in Medicine and Biology 50: 3221-3233, 2005.
V Saarakkala S, Laasanen MS, Jurvelin JS, Toyras J. Quantitative ultrasoundimaging detects degenerative changes in articular cartilage surface and sub-chondral bone.Physics in Medicine and Biology 51: 5333-5346, 2006.
The original articles have been reproduced with permission of the copyright holders.

Contents
1 Introduction 13
2 Structure and composition of articular cartilage 17
3 Osteoarthrosis 193.1 Background . . . . . . . . . . . . . . . . . . . . . . . . . . . . . . . . . . . . . . . . 193.2 Progress of osteoarthrosis . . . . . . . . . . . . . . . . . . . . . . . . . . . . . . . . 203.3 Treatment of osteoarthrosis . . . . . . . . . . . . . . . . . . . . . . . . . . . . . . . 213.4 Diagnostics of osteoarthrosis . . . . . . . . . . . . . . . . . . . . . . . . . . . . . . . 23
3.4.1 Clinical diagnostic techniques . . . . . . . . . . . . . . . . . . . . . . . . . . 233.4.2 Pre-clinical diagnostic techniques . . . . . . . . . . . . . . . . . . . . . . . . 24
4 Mechanical characteristics of articular cartilage 294.1 Background . . . . . . . . . . . . . . . . . . . . . . . . . . . . . . . . . . . . . . . . 294.2 Measurement techniques . . . . . . . . . . . . . . . . . . . . . . . . . . . . . . . . . 294.3 Theoretical models for mechanical behaviour of articular cartilage . . . . . . . . . 32
4.3.1 Single phasic elastic model . . . . . . . . . . . . . . . . . . . . . . . . . . . 324.3.2 Biphasic model . . . . . . . . . . . . . . . . . . . . . . . . . . . . . . . . . . 324.3.3 Extensions of biphasic model . . . . . . . . . . . . . . . . . . . . . . . . . . 33
5 Basic physics of ultrasound 355.1 Ultrasonic waves . . . . . . . . . . . . . . . . . . . . . . . . . . . . . . . . . . . . . 355.2 Generation of medical ultrasonic images . . . . . . . . . . . . . . . . . . . . . . . . 38
6 Ultrasonics of articular cartilage 416.1 Ultrasound measurement techniques . . . . . . . . . . . . . . . . . . . . . . . . . . 416.2 Ultrasound reflection from the cartilage surface . . . . . . . . . . . . . . . . . . . . 426.3 Acoustic properties of articular cartilage . . . . . . . . . . . . . . . . . . . . . . . . 45
7 Surface roughness of articular cartilage 497.1 Surface roughness parameters . . . . . . . . . . . . . . . . . . . . . . . . . . . . . . 497.2 Ultrasound determination of articular surface roughness . . . . . . . . . . . . . . . 507.3 Values of articular surface roughness . . . . . . . . . . . . . . . . . . . . . . . . . . 51
8 Aims of the present study 53
9 Materials and Methods 559.1 Articular cartilage samples and processing protocols . . . . . . . . . . . . . . . . . 55
9.1.1 Enzymatically degraded samples . . . . . . . . . . . . . . . . . . . . . . . . 569.1.2 Mechanically degraded samples . . . . . . . . . . . . . . . . . . . . . . . . . 579.1.3 Spontaneously degenerated samples . . . . . . . . . . . . . . . . . . . . . . 589.1.4 Intact samples from bovine knee joint . . . . . . . . . . . . . . . . . . . . . 58
9.2 Ultrasound indentation instrument . . . . . . . . . . . . . . . . . . . . . . . . . . . 599.2.1 Experimental measurements . . . . . . . . . . . . . . . . . . . . . . . . . . . 599.2.2 Finite element modeling . . . . . . . . . . . . . . . . . . . . . . . . . . . . . 60
9.3 Quantitative ultrasound imaging . . . . . . . . . . . . . . . . . . . . . . . . . . . . 609.3.1 Ultrasound reflection parameters . . . . . . . . . . . . . . . . . . . . . . . . 619.3.2 Ultrasound Roughness Index . . . . . . . . . . . . . . . . . . . . . . . . . . 62
9.4 Reference methods . . . . . . . . . . . . . . . . . . . . . . . . . . . . . . . . . . . . 63
12
9.4.1 Mechano-acoustic measurements . . . . . . . . . . . . . . . . . . . . . . . . 639.4.2 Histological and biochemical analyses . . . . . . . . . . . . . . . . . . . . . 649.4.3 Scanning electron microscopy (SEM) . . . . . . . . . . . . . . . . . . . . . . 649.4.4 Fourier transform infrared spectroscopy (FT-IRIS) . . . . . . . . . . . . . . 65
9.5 Statistical analyses . . . . . . . . . . . . . . . . . . . . . . . . . . . . . . . . . . . . 65
10 Results 6710.1 Ultrasound indentation instrument . . . . . . . . . . . . . . . . . . . . . . . . . . . 67
10.1.1 Experimental measurements . . . . . . . . . . . . . . . . . . . . . . . . . . . 6710.1.2 Finite element modeling . . . . . . . . . . . . . . . . . . . . . . . . . . . . . 69
10.2 Relation between cartilage mechanical and acoustic properties . . . . . . . . . . . . 7010.3 Quantitative ultrasound imaging . . . . . . . . . . . . . . . . . . . . . . . . . . . . 70
10.3.1 Enzymatically degraded samples . . . . . . . . . . . . . . . . . . . . . . . . 7010.3.2 Mechanically degraded samples . . . . . . . . . . . . . . . . . . . . . . . . . 7110.3.3 Spontaneously degenerated samples . . . . . . . . . . . . . . . . . . . . . . 7210.3.4 Intact samples from bovine knee joint . . . . . . . . . . . . . . . . . . . . . 74
11 Discussion 7711.1 Ultrasound indentation instrument . . . . . . . . . . . . . . . . . . . . . . . . . . . 7711.2 Relation between cartilage mechanical and acoustic properties . . . . . . . . . . . . 7911.3 Quantitative ultrasound imaging . . . . . . . . . . . . . . . . . . . . . . . . . . . . 7911.4 Diagnostic potential of quantitative ultrasound techniques . . . . . . . . . . . . . . 82
12 Summary and conclusions 85
References 87
Appendix: Original publications
Chapter I
Introduction
Articular cartilage is specialized connective tissue that covers the ends of the bonesin the diarthrodial joints. The main functions of articular cartilage are to dissipatecontact stresses during joint loading, to contribute to lubrication mechanisms inthe joint, and to provide an almost frictionless articulation in a diarthrodial joint[90, 104]. In order to accomplish these tasks, articular cartilage has unique mechan-ical properties: the tissue is a biphasic material with an anisotropic, unhomogenousand nonlinear behaviour. This complex mechanical behaviour is a result of the spe-cialized composition and structural organization of the tissue. Articular cartilageconsists of one cell type, the chondrocyte, and of an extracellular matrix. The inter-stitial water contributes 70-80 % to the wet weight of cartilage, while the structuralmacromolecules, i.e. collagens, proteoglycans and noncollagenous proteins, makeup the remaining 20-30 % [90, 93]. It is widely accepted that collagen fibrils aremainly responsible for the cartilage tensile stiffness and the dynamic compressivestiffness, while proteoglycans are primarily responsible for the time-dependent andequilibrium properties during compression [13, 64, 71].
Osteoarthrosis (OA) is a very common and severe joint disease causing sufferingto the patients and a high economical burden to society [37, 132]. OA is char-acterized by the progressive degeneration of the articular cartilage along with theabnormal growth of the subchondral bone [21, 31]. Specific OA changes in thecartilage tissue include the progressive disruption of the collagen network and pro-teoglycans and an increased water content [21]. Previous studies have indicatedthat the superficial tissue layer in particular contributes significantly to the normalmechanical behaviour of the cartilage [43, 66] and, therefore, degenerative changesin this layer are believed to be highly deleterious to the joint function. In additionto changes in the cartilage tissue, thickening of the subchondral bone, i.e. sclerosis,and ostephyte formation are involved in OA [21, 31]. These degenerative changeslead to a decrease in cartilage stiffness [8, 59] impairing the mechanical function ofcartilage in the joint. The clinical symptoms of OA include pain, limited mobility
13
14 1. Introduction
and joint deformity.Currently, OA is diagnosed with radiography (X-ray), followed by magnetic reso-
nance imaging (MRI) or arthroscopy when necessary. Unfortunately, these diagnos-tic techniques can only detect major OA changes i.e. typically near the endpoint ofthe disease. Visual evaluation and subjective palpation of articular surface duringarthroscopy have also been claimed to be unsuitable indicators of early degenera-tion [8, 30]. Today, there is increased interest in surgical cartilage repair after localcartilage injuries but these techniques need more sensitive evaluation methods ofcartilage properties [73].
During the past few years, numerous quantitative techniques have been intro-duced for the diagnosis of cartilage quality [7, 22, 28, 30, 34, 41, 45, 47, 81, 95, 121].Most of these techniques are still in the preclinical stage. Clinically, it is importantthat a diagnostic technique is able to differentiate between the different stages ofdegeneration but it also needs to be simple to perform and to give reproducibleresults.
In a recent study, the prototype of an ultrasound indentation instrument wasintroduced for the diagnosis of cartilage degeneration [70]. The instrument dis-tinguished sensitively between normal and enzymatically degraded cartilage in vitro
[70], and detected site-dependant variation of cartilage properties in the bovine kneejoint in situ [69]. In spontaneously degenerating cartilage, however, tissue changesare not as specific as those seen after enzymatic degradation, thus the instrumentneeds to be capable of detecting these natural degenerative alterations. In this thesis(Study I), the ability of an ultrasound indentation instrument to distinguish differ-ent histological degenerative stages of bovine articular cartilage during spontaneousdegeneration process was investigated in vitro. Furthermore, the results of earlierstudies [69, 70] were combined (Study II) with the results of obtained in Study I.The ability of the ultrasound indentation instrument for detecting dynamic stiffnessaccurately in heterogenous sample population was investigated.
Quantitative ultrasound measurements have been demonstrated to be suitablefor the diagnostics of cartilage surface degeneration [28, 34, 45, 61, 72, 73, 114, 119].Furthermore, it has been proposed that ultrasound reflection from the subchondralbone would increase in OA due to bone sclerosis [50, 114]. In this thesis work,the suitability of quantitative 2D ultrasound imaging was investigated to detectmechanically induced, enzymatically induced, or spontaneously developed degener-ative changes (Studies III-V). Ultrasound reflections from the articular surface, aswell as from the cartilage-bone interface, were quantified and related to histological,biomechanical and biochemical reference measurements.
In addition to ultrasound reflection from the cartilage surface, cartilage surfaceroughness can also serve as an index of cartilage degeneration [4, 27, 38, 48]. Unfor-tunately, most of the cited methods are applicable only under laboratory conditions,and no quantitative technique capable of measuring the articular surface roughness

15
in vivo has been described. This study attempted to investigate a novel approachfor quantifying the cartilage surface roughness from 2D ultrasound images (StudyIII). The new method was tested with normal, mechanically, enzymatically or spon-taneously degenerated cartilage samples (Studies III-V). The main goal is to devisea roughness parameter which can also be used in vivo.

16 1. Introduction
Chapter II
Structure and composition of articular cartilage
”Articular cartilage was made for the purpose of providing a cushion between hard
bone and the soft members, so that the latter should not be injured when exposed
to a blow or fall, or compression... In the case of joints, it prevents the tissues
from being torn by the hard bone.” [16]. This citation from the Persian physicianAvicenna (980-1037) reveals that the main function of the articular cartilage in thejoint was, in general terms, recognized over a thousand years ago. In this chapter,the current knowledge of the cartilage composition and structure is briefly reviewed.
Articular cartilage is composed of two distinct phases. Solid phase (or solidmatrix) of the cartilage tissue consists of collagen fibrils, negatively charged pro-teoglycans and cells, i.e. chondrocytes. Articular cartilage is relatively acellulartissue as, in adult tissue, only 2 % of the total cartilage volume is occupied by thechondrocytes. Collagen molecules constitute 60-80 % of the cartilage dry weight orapproximately 20 % of the wet weight. The collagen molecules assemble to formsmall fibrils and larger fibers that vary in organization and dimensions as a functionof cartilage depth. The diameter of the cartilage collagen fibrils is approximately20 nm in the superficial zone and 70-120 nm in the deep zone. The collagen fibrilsof the cartilage tissue consist mainly of type II collagen which, by definition, helpsmake tissue a hyaline cartilage. In contrast to the hyaline cartilage, fibrocartilage,e.g., meniscal cartilage, contains mainly type I collagen. In addition to collagenfibrils, proteoglycan macromolecules constitute 20-40 % of the cartilage dry weightor approximately 5-10 % of the wet weight. The proteoglycan aggrecan is composedof a protein core and numerous glycosaminoglycan (GAG) chains attached to thecore. Many aggrecan molecules are further bound to a single hyaluronan chain toform a proteoglycan aggregate. [89, 90, 93, 104]
Fluid phase of the cartilage tissue consists of interstitial water and mobile ions.The water phase constitutes 70-80 % of the cartilage total weight and is an importantdeterminant of the physical properties of the tissue. [12, 90, 93]
The typical thickness of human articular cartilage is only a few millimeters, and
17
18 2. Structure and composition of articular cartilage
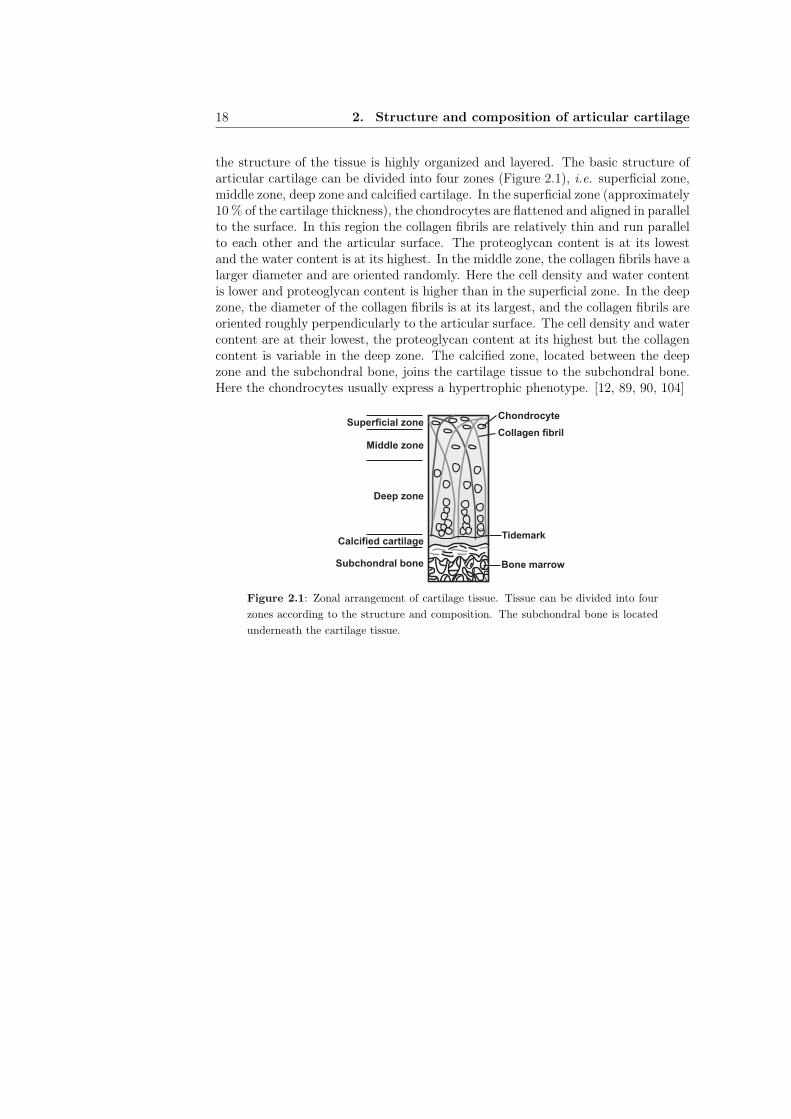
the structure of the tissue is highly organized and layered. The basic structure ofarticular cartilage can be divided into four zones (Figure 2.1), i.e. superficial zone,middle zone, deep zone and calcified cartilage. In the superficial zone (approximately10 % of the cartilage thickness), the chondrocytes are flattened and aligned in parallelto the surface. In this region the collagen fibrils are relatively thin and run parallelto each other and the articular surface. The proteoglycan content is at its lowestand the water content is at its highest. In the middle zone, the collagen fibrils have alarger diameter and are oriented randomly. Here the cell density and water contentis lower and proteoglycan content is higher than in the superficial zone. In the deepzone, the diameter of the collagen fibrils is at its largest, and the collagen fibrils areoriented roughly perpendicularly to the articular surface. The cell density and watercontent are at their lowest, the proteoglycan content at its highest but the collagencontent is variable in the deep zone. The calcified zone, located between the deepzone and the subchondral bone, joins the cartilage tissue to the subchondral bone.Here the chondrocytes usually express a hypertrophic phenotype. [12, 89, 90, 104]
Superficial zone
Middle zone
Deep zone
Calcified cartilage
Subchondral bone
Chondrocyte
Collagen fibril
Tidemark
Bone marrow
Figure 2.1: Zonal arrangement of cartilage tissue. Tissue can be divided into four
zones according to the structure and composition. The subchondral bone is located
underneath the cartilage tissue.
Chapter III
Osteoarthrosis
3.1 Background
Osteoarthrosis (OA), also referred to as degenerative joint disease, degenerativeosteoarthritis, osteoarthritis or hypertrophic osteoarthritis, is the most common jointdisease and it has significant health, sociological and economical impact [132]. It hasbeen estimated that approximately 59 million people will be affected by degenerativejoint diseases by the year 2020 in the United States [37].
OA can be regarded as a physiologic imbalance, i.e. a ”joint failure” similar to”heart failure”, in which mechanical factors play a role [110]. Age is the greatest riskfactor for OA and, consequently, OA is typically a disorder of elderly people. OAoccurs normally in the foot, knee, hip, spine and hand joints. Clinical symptoms ofOA include pain, restriction of motion, crepitation with motion, joint effusions anddeformity [21]. Inflammatory episodes are frequently encountered in OA and, there-fore, the disease is often called osteoarthritis. However, primary OA can developwithout any known cause. Secondary OA can develop, e.g., after joint or ligamentinjury, after infection or in a variety of hereditary, metabolic and neurological dis-orders [21].
It is known that collagen damage, leading to fibrillation of the articular surface,is more harmful to the tissue than the proteoglycan depletion since in mature hu-man cartilage, the turnover time of collagen has been estimated to be more than onehundred years [125]. These degenerative changes lead to a decrease in cartilage stiff-ness, impairing the ability of the tissue to cope with the high mechanical demandsplaced on the joint [8, 59]. In addition to changes in the cartilage tissue, specificosteoarthrotic alterations in the subchondral bone include remodeling, thickening(sclerosis), cyst formation and osteophyte formation [21, 31].
It was suggested as early as the 1960’s that changes in bone remodeling couldprecipitate degeneration of cartilage tissue [14]. In 1986, Radin et al. proposed thatalterations of the subchondral bone, i.e. increased bone mass and sclerosis, would
19
20 3. Osteoarthrosis
occur before deterioration of cartilage structure and properties [110]. The assump-tion behind the hypothesis was that the mechanical progression of cartilage lesionsrequires, initially, a stiffening of the subchondral bone. In such situations, transversestresses at the base of the articular cartilage could cause deep horizontal splits in thetissue [110]. Today it is still not known whether changes in the subchondral boneprecede cartilage degeneration or vice versa. However, it has become clear that sub-chondral bone and articular cartilage comprise a unique functional unit and that theoperation of this unit is disturbed in OA. Therefore, it is important that diagnosticsand treatment methods of OA should not concentrate solely on the cartilage tissue,but also on the subchondral bone [14].
Unfortunately, no cure for OA exists although much effort has been devoted tothis research all over the world. In the following sections, the progression of OA aswell as the current treatment and diagnostic options are briefly reviewed.
3.2 Progress of osteoarthrosis
According to Buckwalter and Mankin (1997), the progression of OA can be dividedinto three phases [21]:
1. Early degeneration: There is an increase in the cartilage water content [85]and a decline in proteoglycan aggregation. Simultaneously, alterations in thecollagen fibril network, i.e. changes in the relative amounts of the minorcollagens and the collagen fibrils, can be observed. These changes weaken theintegrity of the collagen network matrix and, consequently, lead to cartilageswelling and increased water content. Hence, tissue permeability increases,allowing free water flow in and out of the tissue. All of these changes togetherdebilitate the mechanical performance of articular cartilage by decreasing itsmechanical stiffness. It is noteworthy that in this stage, the cartilage surfaceis frequently still glossy, and no visible surface fibrillation can be seen. In thesubchondral bone, an increased density, cyst-like bone cavities or thickeningcan be observed.
2. Advanced degeneration: This stage begins when tissue chondrocytes detect thetissue damage or changes in osmolarity and charge. After the detection of thedamage, mediators are released into the tissue by chondrocytes, initiating thecartilage repair process. The repair process involves an increased synthesisof matrix macromolecules and cell proliferation and can last for years. Inthis stage, the cartilage surface loses its visually glossy appearance and maybecome discoloured. Furthermore, surface fibrillation and superficial or deepdefects reaching the subchondral bone can be observed. Subchondral bonethickening continues and bone cavities are more frequent at this stage.
3.3 Treatment of osteoarthrosis 21
3. Late degeneration: The final stage of OA begins when the chondrocytic re-sponse fails to restore cartilage and, consequently, cartilage tissue can be al-most completely worn out. The loss of articular cartilage causes severe painand the other typical clinical symptoms of OA. In this stage, the subchondralbone can be vastly thickened and very dense. The shape of the articulatingbone ends may change due to the abrasion induced by the loss of the overlyingarticular cartilage.
3.3 Treatment of osteoarthrosis
Non-invasive treatmentThe clinical conservative treatment is mainly focused on pain reduction, maintainingor improving joint mobility and limiting functional impairment. The recommenda-tions, published by the American College of Rheumatology (ACR), state that thenon-pharmacologic treatment (including patient education, physical therapy, weightloss, exercise or assisting devices) should be the initial choice, followed by oral med-ication for pain relief, if needed [1, 101]. The oral medications initially includesnon-steroidal anti-inflammatory drugs (NSAIDs, e.g. ibuprofen) and, subsequently,if their response is inadequate, cyclo-oxygenase (COX)-2-selective inhibitors [1, 101].However, it has been demonstrated that NSAIDs as well as COX-2-inhibitors mayhave serious adverse effects, especially with long-term use and this must be balancedagainst the benefits of these oral medications [101].
It has been proposed that glucosamine sulfate could be a safer and more effectiveoral medication for treatment of OA [51]. Glucosamine sulfate is a slow-acting drug,as compared to traditional NSAIDs, and it is usually delivered orally. Glucosamineis believed to play a part in the repair and maintenance of cartilage tissue. It stim-ulates cartilage cells to produce GAGs and proteoglycans and, thus, helps tissue torecover from the proteoglycan depletion occuring in OA [51]. In 2001, James et al.performed a large literature review of clinical studies that focused on the efficacyof glucosamine sulfate in the treatment of OA [51]. A significant reduction in kneepain, an improved range of motion and a decreased swelling were reported whenglucosamine sulfate was compared to placebo. From these data, James et al. (2001)concluded that [51]: ”Glucosamine sulfate appears to slow the process of articular
degeneration and facilitate the recovery of normal joint mobility.” However, con-flicting results have been also published. Lammi et al. (2004) and Qu et al. (2006)concluded, based on biochemical in vitro experiments with bovine normal and os-teoarthritic cartilage tissue, that glucosamine sulphate did not increase proteoglycansynthesis in bovine primary chondrocytes [76, 107]. ”Our results raise questions how
orally administered glucosamine can manifest its suggested effects on articular carti-
lage.” [107]. Thus, an unequivocal assessment of the benefits of glucosamine sulfateremains to be done.

22 3. Osteoarthrosis
Several available treatment methods concentrate exclusively on the cartilage tis-sue. Very recently, calcitonin has been introduced for the treatment of OA [57].Calcitonin has long been known to inhibit bone resorption but now it has also beenhypothesized, based on in vitro and in vivo results, to have a direct chondropro-tective effect on the cartilage [57]. As described earlier, subchondral bone and ar-ticular cartilage comprise a unique functional unit and, therefore, this kind of drugmay represent an effective treatment attacking both cartilage and subchondral bonemetabolic imbalances [57]. However, more randomized clinical studies are neededto support that hypothesis.
Invasive treatmentOne potential minimally invasive treatment option is an intra-articular hyaluronaninjection. The hyaluronan is a typical polysaccharide found normally in the ex-tracellular matrix in soft connective tissues [101]. In knee OA, both synovial fluidviscosity and hyaluronan concentration are reduced, and hyaluronan injections havebeen thought to act as fluid replacement [101]. Clinically, a significant reduction ofpain and improvement in joint function with few adverse effects have been reportedfor knee OA. Recently, ACR guidelines were also updated to include hyaluronaninjections as an option for OA treatment [1, 101].
Traditional, and probably the most common, invasive methods for treating painfuljoint conditions in OA are lavage and debridement [49]. Both methods can be con-ducted during arthroscopy. In lavage, a solution of sodium chloride is injected intothe patient’s joint. Over 10 liters of fluid can be used in the procedure [88]. Indebridement, the rough articular surfaces are shaved, loose debris is removed, alltorn or degenerated meniscal fragments are trimmed, and the remaining meniscusis smoothed to a firm and stable rim [88]. In clinical studies, approximately 50 %of treated patients report relief from pain after these arthroscopic procedures [88].However, there is still much doubt about the true efficacy of these methods [32]. Ithas been even reported that pain relief in knee OA is no better after arthroscopiclavage or arthroscopic debridement than after a placebo procedure [88]. This is aninteresting result since in the United States, the annual cost of these arthroscopicprocedures amounts to approximately 3.25 billion dollars [88]. Nonetheless, it wasclaimed in a very recent study that carefully selected patients may still benefit forarthroscopic debridement [120].
When OA reaches the end-stage, the most common treatment is the installationof an endoprosthesis. When cartilage defects are confined to a small localized area,surgical cartilage repair techniques may offer treatment approach. Usually, theselocalized cartilage injuries occur after joint trauma. Cartilage repair techniques canbe divided into two types: intrinsic and extrinsic [49]. In the intrinsic type, thecartilage tissue is stimulated to heal via its own spontaneous repair mechanisms. Inthe extrinsic techniques, active biological compounds are installed in the cartilage
3.4 Diagnostics of osteoarthrosis 23
defect in order to induce tissue regeneration. Mosaicplasy and autologous chon-drocyte transplantation are the most common extrinsic cartilage repair techniques[49]. For a more detailed description of the current status and prospects of cartilagerepair techniques, the reader is recommended to read the review by Hunziker (2002)[49].
3.4 Diagnostics of osteoarthrosis
3.4.1 Clinical diagnostic techniques
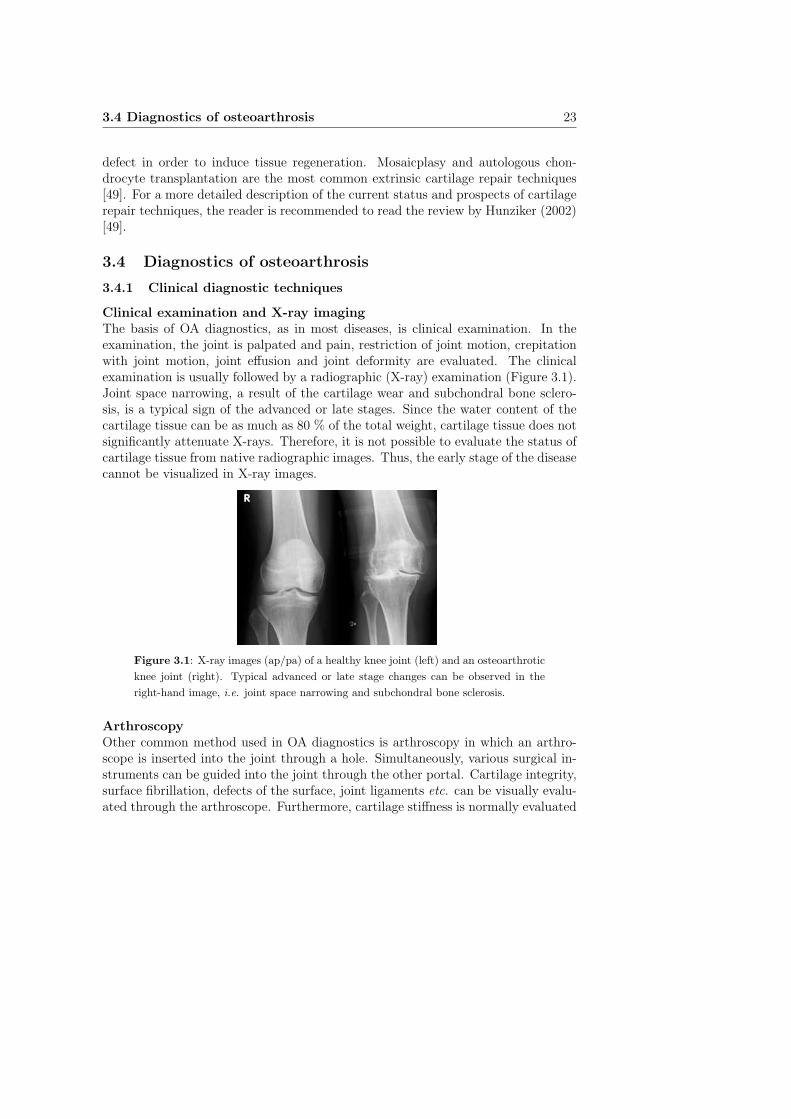
Clinical examination and X-ray imagingThe basis of OA diagnostics, as in most diseases, is clinical examination. In theexamination, the joint is palpated and pain, restriction of joint motion, crepitationwith joint motion, joint effusion and joint deformity are evaluated. The clinicalexamination is usually followed by a radiographic (X-ray) examination (Figure 3.1).Joint space narrowing, a result of the cartilage wear and subchondral bone sclero-sis, is a typical sign of the advanced or late stages. Since the water content of thecartilage tissue can be as much as 80 % of the total weight, cartilage tissue does notsignificantly attenuate X-rays. Therefore, it is not possible to evaluate the status ofcartilage tissue from native radiographic images. Thus, the early stage of the diseasecannot be visualized in X-ray images.
Figure 3.1: X-ray images (ap/pa) of a healthy knee joint (left) and an osteoarthrotic
knee joint (right). Typical advanced or late stage changes can be observed in the
right-hand image, i.e. joint space narrowing and subchondral bone sclerosis.
ArthroscopyOther common method used in OA diagnostics is arthroscopy in which an arthro-scope is inserted into the joint through a hole. Simultaneously, various surgical in-struments can be guided into the joint through the other portal. Cartilage integrity,surface fibrillation, defects of the surface, joint ligaments etc. can be visually evalu-ated through the arthroscope. Furthermore, cartilage stiffness is normally evaluated
24 3. Osteoarthrosis
by manually palpating the articular surface with a blunt probe. Currently, it is notpossible to evaluate the cartilage internal structure and the subchondral bone dur-ing routine arthroscopy. Despite being current clinical practice, visual evaluationand subjective palpation of the articular surface during arthroscopy are claimed tobe insufficient indicators of early degeneration [8, 30]. Clearly, these methods aresubjective and significantly dependent on the evaluator [20].
MRI imagingMagnetic resonance imaging (MRI) is the most promising non-invasive method forOA diagnostics [22]. In routine MRI, thinning and irregularity of cartilage tissue,as well as subchondral bone changes, can be qualitatively evaluated during OA.Recently, Gadolinium enhanced T1 MRI mapping of the cartilage (dGEMRIC) hasbeen suggested to be able to detect the cartilage proteoglycan concentration and dis-tribution [22, 23, 98], also in vivo [15]. T2 mapping with MRI has been suggested tobe a sensitive way to measure the cartilage tissue collagen content, the orientationof the collagen fibrils as well as the collagen integrity [22, 99, 100, 130]. Recently,it has been reported that both dGEMRIC and T2 mapping predict indirectly me-chanical stiffness of the human cartilage in vitro [67, 115]. It has also been proposedthat the relationship between T2 values and cartilage dynamic stiffness is significantat the clinical field strength (1.5 T) [75]. However, it was alleged in a very recentstudy that clinical use of T2 mapping is not possible due to many competing factorsaffecting T2 measurements [23]. The main weakness of MRI imaging is its limitedresolution and only the moderate relation between cartilage mechanical stiffness andMRI parameters. Thus, MRI evaluates the tissue microstructure and compositionbut does not directly measure the mechanical competence of the articular cartilage.
3.4.2 Pre-clinical diagnostic techniques
Indentation measurementsTraditionally, the mechanical performance of the articular cartilage has been quanti-fied with indentation measurements. In this technique, the cartilage surface is com-pressed with a cylindrical or spherical indenter to a predefined strain. Consequently,the force by which the cartilage resists the induced deformation is measured and usedas an indicator of cartilage stiffness. Several indentation instruments have been in-troduced for arthroscopic measurements of cartilage stiffness [7, 10, 30, 81, 95].With these instruments, however, it is not possible to determine tissue thicknessand this is a factor that affects the indentation results, especially with thin cartilage[46, 83, 133].
3.4 Diagnostics of osteoarthrosis 25
Ultrasound indentationTo overcome the limitation of unknown cartilage thickness, a technique called ultra-
sound indentation has been introduced for the determination of cartilage mechanicalproperties. In this technique, the cartilage tissue is compressed with an ultrasoundtransducer and, simultaneously, the thickness and deformation are calculated fromthe ultrasound signal reflected from the cartilage-bone interface [58, 70, 121, 134].Consequently, the material stiffness of tissue can be calculated from the measure-ments, provided that a realistic mechanical model for cartilage is in use.
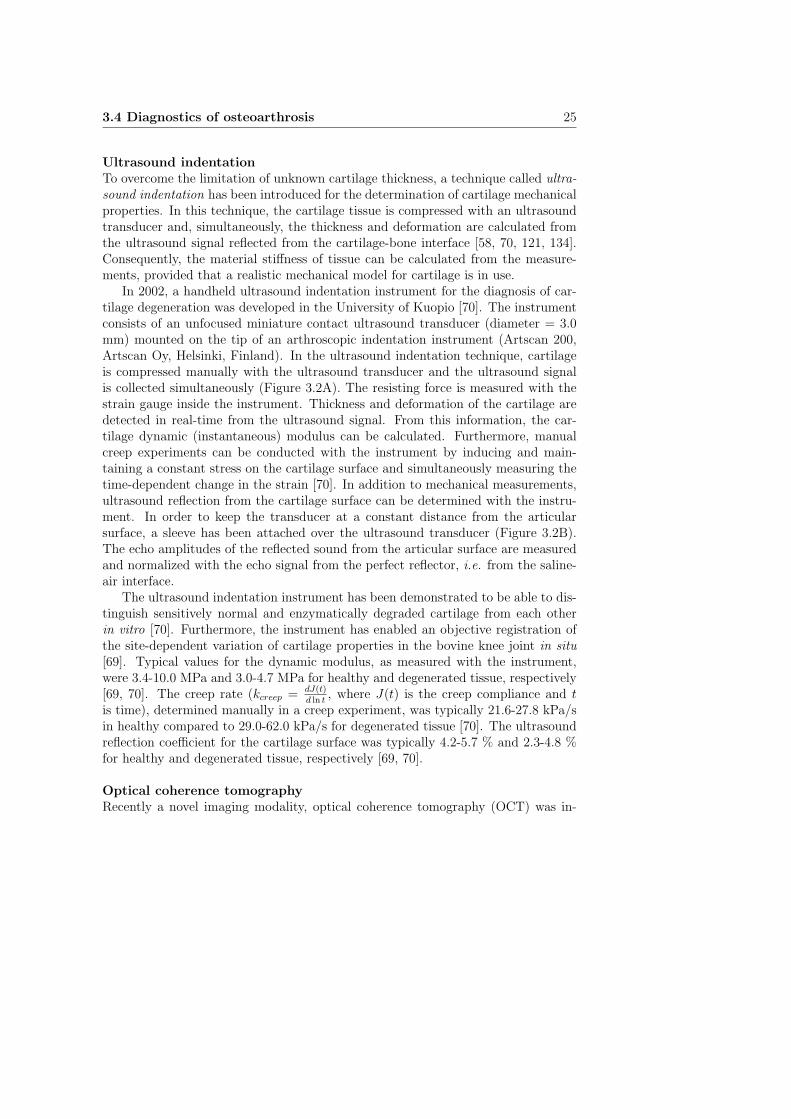
In 2002, a handheld ultrasound indentation instrument for the diagnosis of car-tilage degeneration was developed in the University of Kuopio [70]. The instrumentconsists of an unfocused miniature contact ultrasound transducer (diameter = 3.0mm) mounted on the tip of an arthroscopic indentation instrument (Artscan 200,Artscan Oy, Helsinki, Finland). In the ultrasound indentation technique, cartilageis compressed manually with the ultrasound transducer and the ultrasound signalis collected simultaneously (Figure 3.2A). The resisting force is measured with thestrain gauge inside the instrument. Thickness and deformation of the cartilage aredetected in real-time from the ultrasound signal. From this information, the car-tilage dynamic (instantaneous) modulus can be calculated. Furthermore, manualcreep experiments can be conducted with the instrument by inducing and main-taining a constant stress on the cartilage surface and simultaneously measuring thetime-dependent change in the strain [70]. In addition to mechanical measurements,ultrasound reflection from the cartilage surface can be determined with the instru-ment. In order to keep the transducer at a constant distance from the articularsurface, a sleeve has been attached over the ultrasound transducer (Figure 3.2B).The echo amplitudes of the reflected sound from the articular surface are measuredand normalized with the echo signal from the perfect reflector, i.e. from the saline-air interface.
The ultrasound indentation instrument has been demonstrated to be able to dis-tinguish sensitively normal and enzymatically degraded cartilage from each otherin vitro [70]. Furthermore, the instrument has enabled an objective registration ofthe site-dependent variation of cartilage properties in the bovine knee joint in situ
[69]. Typical values for the dynamic modulus, as measured with the instrument,were 3.4-10.0 MPa and 3.0-4.7 MPa for healthy and degenerated tissue, respectively[69, 70]. The creep rate (kcreep = dJ(t)
d ln t, where J(t) is the creep compliance and t
is time), determined manually in a creep experiment, was typically 21.6-27.8 kPa/sin healthy compared to 29.0-62.0 kPa/s for degenerated tissue [70]. The ultrasoundreflection coefficient for the cartilage surface was typically 4.2-5.7 % and 2.3-4.8 %for healthy and degenerated tissue, respectively [69, 70].
Optical coherence tomographyRecently a novel imaging modality, optical coherence tomography (OCT) was in-
26 3. Osteoarthrosis
HandleRod
Ultrasound transducerdiameter = 3 mm
height = 3 mmExternal sleeve
height = 6.5 mm
A) B)
Figure 3.2: A) Schematic presentation of the indentation geometry of the ultrasound
indentation instrument [70]. B) Ultrasound reflection from the cartilage surface is
also quantified with the instrument by attaching a plastic sleeve over the ultrasound
transducer.
troduced for the assessment of articular cartilage microstructure [47]. The physicalbackground of OCT is somewhat analogous to ultrasound - OCT measures reflectionof infrared light instead of sound. The resolution of OCT is very high, being typi-cally in the range of 10-20 micrometers [102]. OCT imaging has been demonstratedto be capable of measuring cartilage thickness [112], collagen network organization[35] as well as other histologically confirmed structural changes [3, 80]. In additionto in vitro studies, OCT has been tested arthroscopically in vivo with porcine [102]and rat [3] articular cartilage, and with human cartilage during open knee surgery[80]. There is one main limitation of cartilage OCT imaging, and in that way it issimilar to MRI, i.e. it provides information on tissue microstructure but not directlyon the cartilage mechanical properties. Furthermore, the penetration of light in thecartilage is limited.
Electromechanical measurementsNovel electromechanical diagnostic methods have been tested in pre-clinical inves-tigations [41, 79, 108, 113]. In these techniques, electromechanical properties, suchas streaming potentials, of cartilage tissue are measured, in unconfined compressionor in indentation geometry, with a mechanical tester coupled with a microelec-trode. The technique has been reported to be especially sensitive for detecting thedegradation of cartilage proteoglycans [79]. Electromechanical measurements do notprovide information about tissue thickness, which could possibly affect the deter-mination of cartilage electromechanical properties. Furthermore, electromechanicalmeasurements do not permit acquisition of high resolution images of the tissue.
3.4 Diagnostics of osteoarthrosis 27
High-frequency ultrasound analysisVarious studies have been published to test the suitability of using high-frequency ul-trasound in the detection of cartilage degeneration [2, 5, 28, 29, 34, 45, 50, 61, 72, 73,78, 103, 106, 114, 119, 123, 124]. In this technique, an ultrasound wave pulse is trans-mitted through the cartilage tissue, and the reflection or backscattering of sound ismeasured. The ultrasound technique has been demonstrated to be especially sen-sitive for superficial collagen degeneration. Furthermore, ultrasound measurementsoffer great potential for direct determination of cartilage surface roughness.
Ultrasound imaging has theoretically greater potential, compared to other tech-niques, for providing direct information about the mechanical performance of car-tilage since the ultrasound is a mechanical wave motion. The main weakness ofthe ultrasound technique is that it requires at least a minimally invasive approachin clinical use. Some kind of non-invasive ultrasound imaging of articular cartilagecould also be an option, although the ultrasound penetration would then be limitedto small areas in the joint. More detailed information of the ultrasound techniquefor the characterizing acoustic properties of cartilage can be found in the chapter”Ultrasonics of articular cartilage”.

28 3. Osteoarthrosis
Chapter IV
Mechanical characteristics of articular cartilage
4.1 Background
In order to accomplish the demanding task of minimizing and dissipating largestresses in the joints, articular cartilage has unique mechanical properties. Carti-lage tissue is an inhomogeneous, layered poroelastic material with nonlinear andanisotropic mechanical properties [126]. When an external load is applied onto thejoint, cartilage deforms to increase the contact area and to enhance joint congruence.Consequently, a combination of compressive, tensile and shear stresses is generatedin cartilage. The response of the tissue can be significantly different for each of thesestress types. It is known that the collagen network is mainly responsible for the dy-namic compressive and tensile response of the cartilage tissue whereas proteoglycansare mainly responsible for the static compressive stiffness of cartilage [64].
4.2 Measurement techniques
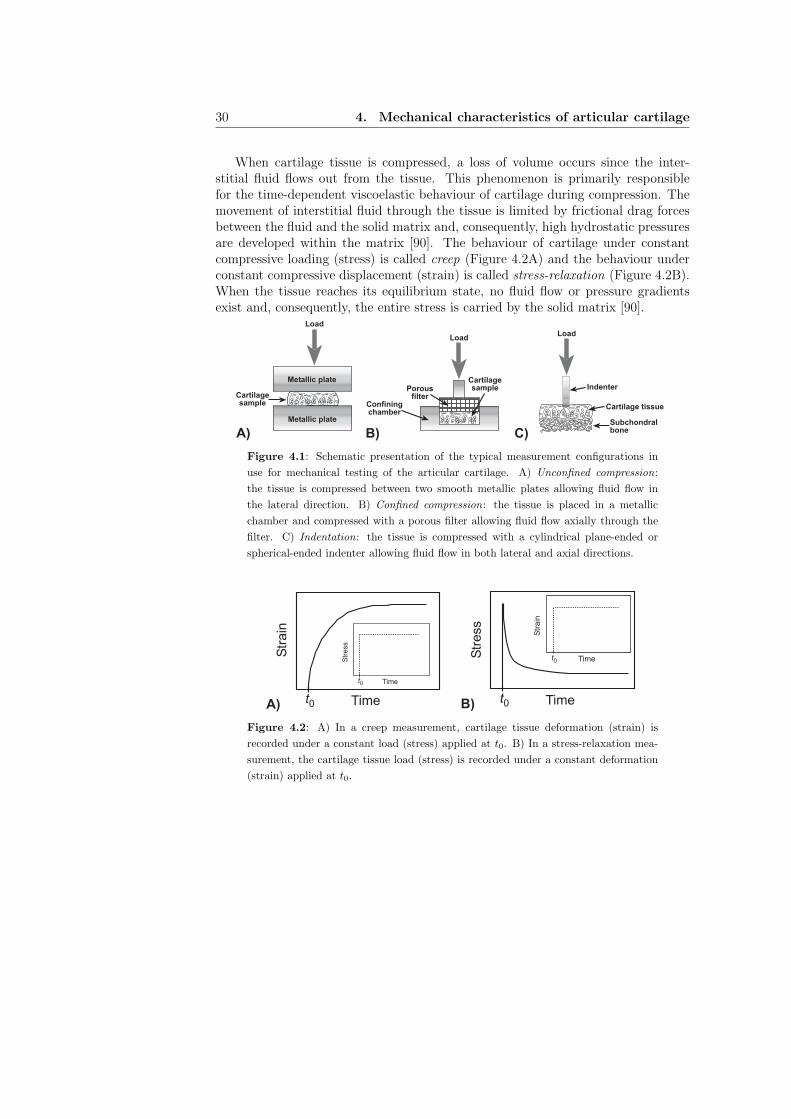
Traditionally, cartilage mechanical properties have been measured in three differ-ent measurement configurations [90]: unconfined compression, confined compression
and indentation. In unconfined compression, cartilage tissue (without the subchon-dral bone) is compressed between two smooth metallic plates, allowing the fluidflow only in the lateral direction (Figure 4.1A). In confined compression, a carti-lage sample, with or without the subchondral bone, is placed in a chamber and,subsequently, compressed with a porous filter (Figure 4.1B). In this approach thefluid can only flow axially through the tissue surface into the filter. In indentation,cartilage is typically compressed with a cylindrical plane-ended or spherical-endedindenter (Figure 4.1C). Fluid flow outside the indenter-cartilage contact is possiblein both the lateral and axial directions. As the cartilage tissue is naturally attachedto the subchondral bone, indentation measurements can be performed in vivo whilethe other configurations are limited to in vitro studies.
29
30 4. Mechanical characteristics of articular cartilage
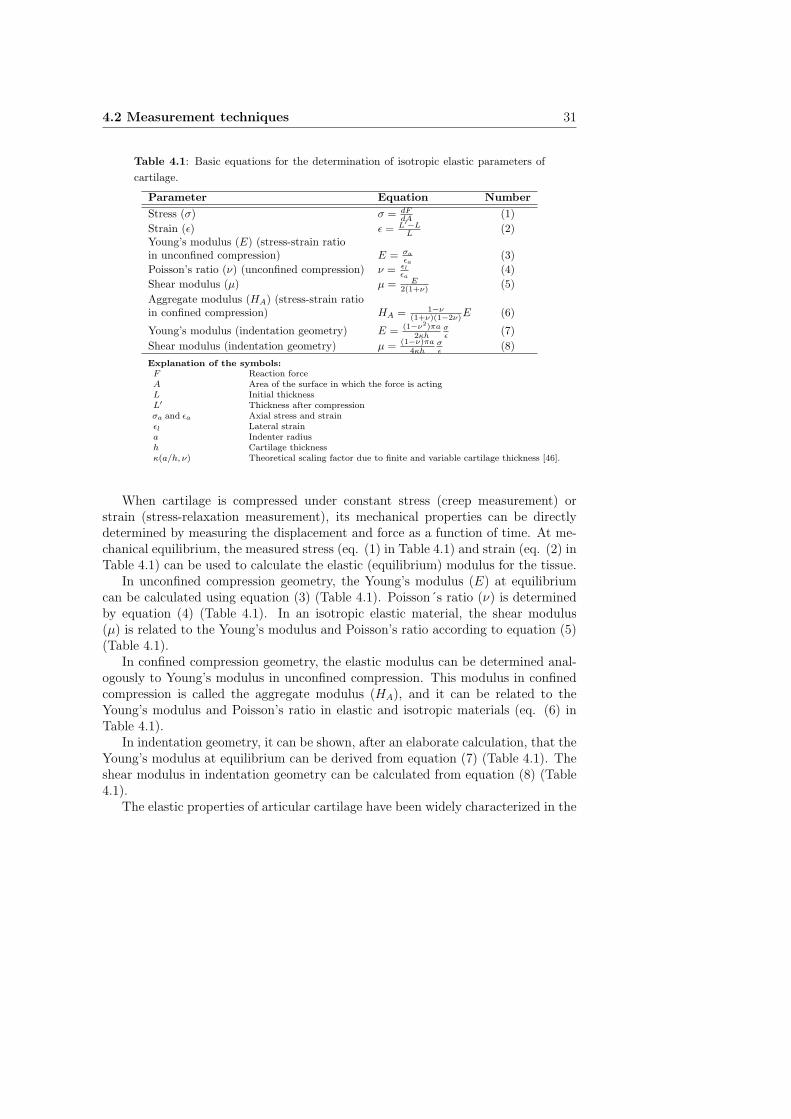
When cartilage tissue is compressed, a loss of volume occurs since the inter-stitial fluid flows out from the tissue. This phenomenon is primarily responsiblefor the time-dependent viscoelastic behaviour of cartilage during compression. Themovement of interstitial fluid through the tissue is limited by frictional drag forcesbetween the fluid and the solid matrix and, consequently, high hydrostatic pressuresare developed within the matrix [90]. The behaviour of cartilage under constantcompressive loading (stress) is called creep (Figure 4.2A) and the behaviour underconstant compressive displacement (strain) is called stress-relaxation (Figure 4.2B).When the tissue reaches its equilibrium state, no fluid flow or pressure gradientsexist and, consequently, the entire stress is carried by the solid matrix [90].
Metallic plate
Metallic plate
Cartilagesample Confining
chamber
Porousfilter
Cartilagesample Indenter
Cartilage tissue
Subchondralbone
Load
LoadLoad
A) B) C)
Figure 4.1: Schematic presentation of the typical measurement configurations in
use for mechanical testing of the articular cartilage. A) Unconfined compression:
the tissue is compressed between two smooth metallic plates allowing fluid flow in
the lateral direction. B) Confined compression: the tissue is placed in a metallic
chamber and compressed with a porous filter allowing fluid flow axially through the
filter. C) Indentation: the tissue is compressed with a cylindrical plane-ended or
spherical-ended indenter allowing fluid flow in both lateral and axial directions.
Time
Str
ain
t0
Time
Str
ess
t0
Time
Str
ess
t0
Time
Str
ain
t0
A) B)
Figure 4.2: A) In a creep measurement, cartilage tissue deformation (strain) is
recorded under a constant load (stress) applied at t0. B) In a stress-relaxation mea-
surement, the cartilage tissue load (stress) is recorded under a constant deformation
(strain) applied at t0.
4.2 Measurement techniques 31
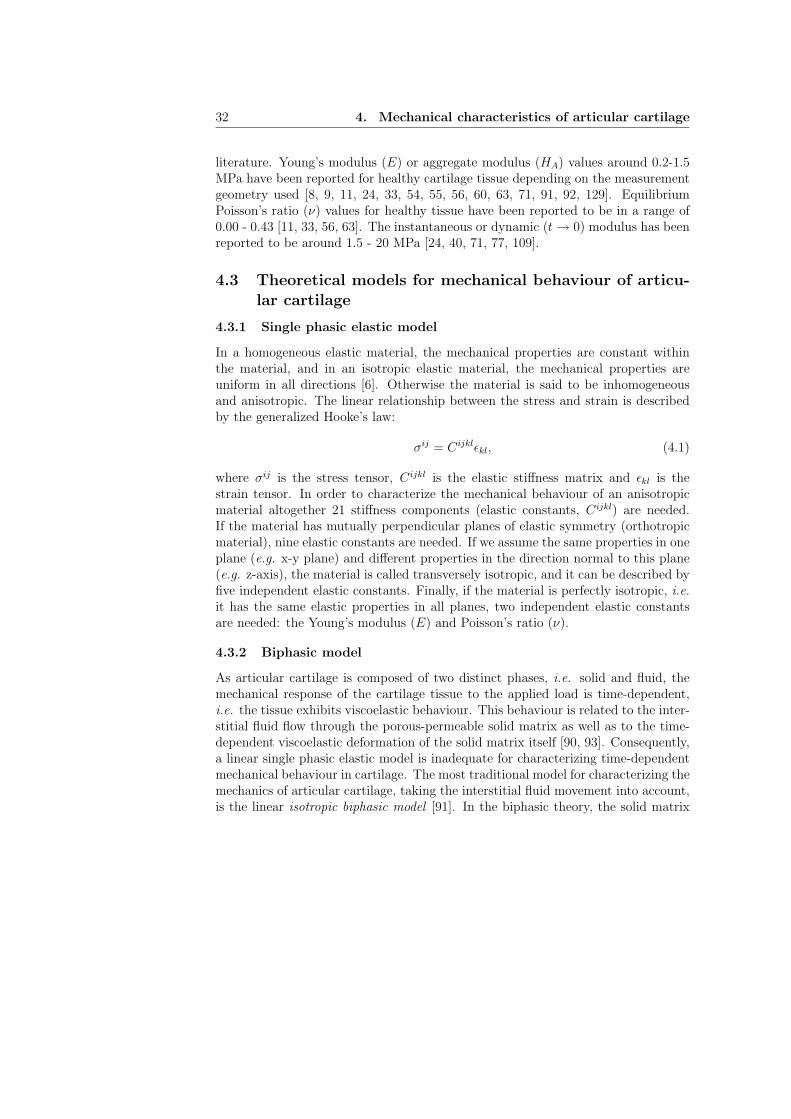
Table 4.1: Basic equations for the determination of isotropic elastic parameters of
cartilage.
Parameter Equation Number
Stress (σ) σ = dFdA
(1)
Strain (ǫ) ǫ = L′−LL
(2)Young’s modulus (E) (stress-strain ratioin unconfined compression) E = σa
ǫa
(3)
Poisson’s ratio (ν) (unconfined compression) ν = ǫl
ǫa
(4)
Shear modulus (µ) µ = E2(1+ν) (5)
Aggregate modulus (HA) (stress-strain ratioin confined compression) HA = 1−ν
(1+ν)(1−2ν)E (6)
Young’s modulus (indentation geometry) E = (1−ν2)πa
2κhσǫ
(7)
Shear modulus (indentation geometry) µ = (1−ν)πa
4κhσǫ
(8)
Explanation of the symbols:F Reaction forceA Area of the surface in which the force is actingL Initial thicknessL′ Thickness after compressionσa and ǫa Axial stress and strainǫl Lateral straina Indenter radiush Cartilage thicknessκ(a/h, ν) Theoretical scaling factor due to finite and variable cartilage thickness [46].
When cartilage is compressed under constant stress (creep measurement) orstrain (stress-relaxation measurement), its mechanical properties can be directlydetermined by measuring the displacement and force as a function of time. At me-chanical equilibrium, the measured stress (eq. (1) in Table 4.1) and strain (eq. (2) inTable 4.1) can be used to calculate the elastic (equilibrium) modulus for the tissue.
In unconfined compression geometry, the Young’s modulus (E) at equilibriumcan be calculated using equation (3) (Table 4.1). Poisson´s ratio (ν) is determinedby equation (4) (Table 4.1). In an isotropic elastic material, the shear modulus(µ) is related to the Young’s modulus and Poisson’s ratio according to equation (5)(Table 4.1).
In confined compression geometry, the elastic modulus can be determined anal-ogously to Young’s modulus in unconfined compression. This modulus in confinedcompression is called the aggregate modulus (HA), and it can be related to theYoung’s modulus and Poisson’s ratio in elastic and isotropic materials (eq. (6) inTable 4.1).
In indentation geometry, it can be shown, after an elaborate calculation, that theYoung’s modulus at equilibrium can be derived from equation (7) (Table 4.1). Theshear modulus in indentation geometry can be calculated from equation (8) (Table4.1).
The elastic properties of articular cartilage have been widely characterized in the
32 4. Mechanical characteristics of articular cartilage
literature. Young’s modulus (E) or aggregate modulus (HA) values around 0.2-1.5MPa have been reported for healthy cartilage tissue depending on the measurementgeometry used [8, 9, 11, 24, 33, 54, 55, 56, 60, 63, 71, 91, 92, 129]. EquilibriumPoisson’s ratio (ν) values for healthy tissue have been reported to be in a range of0.00 - 0.43 [11, 33, 56, 63]. The instantaneous or dynamic (t → 0) modulus has beenreported to be around 1.5 - 20 MPa [24, 40, 71, 77, 109].
4.3 Theoretical models for mechanical behaviour of articu-lar cartilage
4.3.1 Single phasic elastic model
In a homogeneous elastic material, the mechanical properties are constant withinthe material, and in an isotropic elastic material, the mechanical properties areuniform in all directions [6]. Otherwise the material is said to be inhomogeneousand anisotropic. The linear relationship between the stress and strain is describedby the generalized Hooke’s law:
σij = Cijklǫkl, (4.1)
where σij is the stress tensor, Cijkl is the elastic stiffness matrix and ǫkl is thestrain tensor. In order to characterize the mechanical behaviour of an anisotropicmaterial altogether 21 stiffness components (elastic constants, Cijkl) are needed.If the material has mutually perpendicular planes of elastic symmetry (orthotropicmaterial), nine elastic constants are needed. If we assume the same properties in oneplane (e.g. x-y plane) and different properties in the direction normal to this plane(e.g. z-axis), the material is called transversely isotropic, and it can be described byfive independent elastic constants. Finally, if the material is perfectly isotropic, i.e.
it has the same elastic properties in all planes, two independent elastic constantsare needed: the Young’s modulus (E) and Poisson’s ratio (ν).
4.3.2 Biphasic model
As articular cartilage is composed of two distinct phases, i.e. solid and fluid, themechanical response of the cartilage tissue to the applied load is time-dependent,i.e. the tissue exhibits viscoelastic behaviour. This behaviour is related to the inter-stitial fluid flow through the porous-permeable solid matrix as well as to the time-dependent viscoelastic deformation of the solid matrix itself [90, 93]. Consequently,a linear single phasic elastic model is inadequate for characterizing time-dependentmechanical behaviour in cartilage. The most traditional model for characterizing themechanics of articular cartilage, taking the interstitial fluid movement into account,is the linear isotropic biphasic model [91]. In the biphasic theory, the solid matrix
4.3 Theoretical models for mechanical behaviour of articular cartilage 33
is assumed to be isotropic, linearly elastic and incompressible. The fluid phase isassumed to be incompressible and inviscid [91]. Consequently, in addition to elasticparameters which can be calculated from equation (4.1), a knowledge of the tissuepermeability (k) is needed for characterizing the time-dependent behaviour of thetissue.
The tissue permeability (k) can be determined direcly or indirectly. In the di-rect determination, the cartilage tissue specimen is positioned under the pressuregradient and the rate of fluid flow through the tissue is measured. In the indirecttechnique, experimental mechanical measurements are conducted and, subsequently,the theoretical model is fitted to the experimental data. The permeability of thenormal articular cartilage is in the order of 10−15 − 10−16 m4/Ns [90].
The biphasic model indicates that articular cartilage behaves like an equivalentincompressible (ν=0.5) single phasic elastic material during instantaneous loading(t → 0). In an equilibrium state, the Young’s modulus (E) (or the shear modulus(µ)) and the Poisson’s ratio of the true solid matrix can be determined [83].
4.3.3 Extensions of biphasic model
Cartilage tissue is known to exhibit different responses during compression and ten-sion experiments. Therefore, neither the single phasic elastic theory nor the isotropicbiphasic theory provides a comprehensive characterization of cartilage mechanics.Consequently, several more advanced models have been introduced. The most im-portant ones of these models are listed below [128]:
Transversely isotropic modelTransversely isotropic model has six material parameters: Young’s modulus (E1)and Poisson’s ratio (ν12) in the transverse plane (parallel to the articular surface),Out-of-plane Young’s modulus (E3) and Poisson’s ratio (ν31), Out-of-plane shearmodulus (µ13) and permeability (k). Typical values for material parameters are[65]: E1 = 1-19 MPa, E3 = 0.46 MPa, ν12 = 0.5, ν31 = 0, µ13 = 0.4-6.3 MPa,k = 0.2− 5.0× 10⁻¹⁵ m4/Ns. The most crucial advantage obtained with this model,as compared to elastic isotropic models, is the inclusion of the response of thosecollagen fibrils oriented parallel to the surface in the superficial cartilage layer. Thisis important as it has been demonstrated that the superficial layer significantly con-tributes to the stiffness of articular cartilage measured in indentation geometry [66].However, this model still fails to predict the compression-tension nonlinearity of thetissue.
Fibril reinforced modelIn the fibril reinforced model, the compression-tension nonlinearity is taken into ac-count by inclusion of the collagen fibril network, running in three mutually orthog-
34 4. Mechanical characteristics of articular cartilage
onal directions. The collagen network is simulated with the elastic or viscoelasticsprings embedded in the isotropic matrix. The material parameters of the fibrilreinforced model are Young’s modulus (Em) and Poisson’s ratio (νm) of the drainedporous matrix, permeability (k), and the Young’s modulus of the fibril network(Ef = Eǫ
fǫf + E0f , where ǫf is tensile srain). Typical values for material parameters
are [64]: Em = 0.10 - 0.34 MPa, νm = 0.42, Eǫf = 20 - 190 MPa, E0
f = 0.10 - 1.00 MPaand k = 0.6 − 4.0 × 10⁻¹⁵ m4/Ns. The advantage of the fibril reinforced model, ascompared to the transversely isotropic model, is that the fibrils resist only tension.Thus, the compression-tension nonlinearity can be characterized with this model.Furthermore, time-dependent deformation related to intrinsic matrix viscoelasticitycan be taken into account [82].
Triphasic theoryTriphasic theory is an extension of the biphasic model but incorporates three phases:an incompressible solid, an incompressible fluid and a monovalent ionic phase [74,122]. The model assumes that the total stress of the tissue is composed of the fluidstress, solid stress and chemical potentials. This model can be used to faithfullyinclude the effect of cartilage tissue swelling. However, the model, in its currentformulation, fails to predict the compression-tension nonlinearity as well as the re-sponse of those collagen fibrils oriented parallel to the surface in the superficialcartilage layer.
Chapter V
Basic physics of ultrasound
5.1 Ultrasonic waves
Waves in One DimensionIn the following presentation, it is assumed that the material in which the ultrasonicwave is propagating is homogenous, linear and isotropic.
In the ultrasonics of materials, two distinct types of plane waves can be gen-erated: transverse and longitudinal. In the transverse wave type, a particle movesperpendicularly to the direction of wave propagation. Since the particle motion intransverse waves is associated with shear stress, the transverse wave type is oftencalled a shear wave. Shear waves cannot be generated in low-viscosity fluids such aswater or air. In the longitudinal wave type, a particle moves parallel to the direc-tion of wave propagation. This wave type is often called a pressure wave or P-wavesince the stress of the periodic compression and tension of the particles is along thedirection of propagation. [36, 118, 127]
The single particle displacement (u) in a material, in which the ultrasonic waveis propagating, is a function of distance (x) and time (t), i.e. u = u(x, t). It can beshown that the particle displacement satisfies the linear wave equation [118]:
∂2u
∂x2− 1
v2
∂2u
∂t2= 0, (5.1)
where v is the phase (wave) velocity. The common solitary wave function satisfyingthe wave equation is of the following type [118]:
u(x, t) = u0ej(ωt−kx), (5.2)
where ω is the angular temporal frequency (ω = 2πf , f=frequency) and k is thewavenumber (k = 2π
λ, λ=wavelength).
In longitudinal type waves, compressive stress (σ) is associated with the wavemotion [118]. In a long, thin rod, the phase velocity of the longitudinal wave in
35
36 5. Basic physics of ultrasound
a homogenous isotropic medium (vl) is related to the Young’s modulus (E) andmaterial density (ρ) (eq. (1) in Table 5.1).
In transverse type waves, shear stress is associated with the wave motion [118].As with longitudinal type waves, it can be presumed that the phase velocity of thetransverse wave (vt) is related to the elastic shear modulus (µ) and material density(ρ) (eq. (2) in Table 5.1).
It can be derived that the acoustic pressure (p), driving the traveling longitudi-nal type wave in linear elastic material, is related to the Young’s modulus and theparticle displacement (∂u
∂x) (eq. (3) in Table 5.1). [118]
Waves in Three Dimensions (bulk waves)If one assumes that bulk waves travel as a planar wave front in isotropic, homoge-nous material, the major difference between bulk waves and one dimensional waveswill be in the Poisson’s effect, i.e. the medium is compressed in one direction andsimultaneously expanded in other directions. In this kind of situation, the phasevelocity of the 3D longitudinal type wave (vl) can be presented as a function ofYoung’s modulus (E), material density (ρ) and Poisson’s ratio (ν) (eq. (4) in Table5.1). [36, 118, 127]
In contrast to 3D longitudinal type waves, the shear deformation in bulk mate-rial causes no new elastic effects, and so the volume does not change. This meansthat the phase velocity of 3D transverse type waves (vt) is the same as in the 1Dsituation (eq. (2) in Table 5.1). [36, 118, 127]
Acoustic impedance and intensityThe acoustic impedance can be shown to be linearly related to the density of thematerial (ρ) and the longitudinal wave velocity (vl) (eq. (5) in Table 5.1). Amore generalized form of the specific acoustic impedance includes absorption andanisotropic material effects. In this kind of situation, the acoustic impedance canbe mathematically expressed as complex variable, Z = R + iX (where R is thereal resistive component, X is the reactive component related to absorption andi =
√−1). At a boundary, the difference in acoustic impedances between two mate-
rials defines the amount of ultrasound energy reflected from, or transmitted through,the boundary. [36, 118, 127]
The energy intensity (energy per unit time per unit area) of a longitudinal typewave is proportional to the acoustic pressure and acoustic impedance, as seen inequation (6) (Table 5.1). Hence, for a given acoustic energy, the pressure can bequite large in a material with high acoustic impedance. In experimental ultrason-ics, it is often necessary to compare measured ultrasonic signal intensity or pressureamplitude with the reference intensity or amplitude. These differences in intensities(∆I) or amplitudes (∆A) are conveniently expressed in a decibel (dB) scale (eqs.(7) and (8) in Table 5.1). [36, 118, 127]
5.1 Ultrasonic waves 37
Ultrasonic reflection and refractionUltrasonic reflection and refraction deal with the situation when a propagating planewave arrives at the interface between two materials, e.g., from water to air. If a wavearrives in normal incidence, i.e. perpendicular to the interface, from material one tomaterial two, part of the wave is reflected back and part of the wave is transmittedthrough the interface. This ratio of the incident (i) wave pressure amplitude andreflected (r) or transmitted (t) wave pressure amplitude is characterized by the re-flection (R) or transmission (T ) coefficients (eqs. (9) and (10) in Table 5.1). It canbe shown that the the reflection (R) or transmission (T ) coefficients in an isotropic,homogenous medium are dependent on the acoustic impedances around the inter-face (eqs. (9) and (10) in Table 5.1).
If a wave arrives at an oblique incidence from material 1 to material 2, the trans-mitted (t) wave is also refracted at the interface according to Snell’s law (eq. (11)in Table 5.1). After geometrical calculations, one can derive the pressure reflectionand transmission coefficients in that kind of situation (eqs. (12) and (13) in Table5.1). Equation (9) (Table 5.1) is especially suitable in diagnostic ultrasound whenreflected (pr) and incident (pi) ultrasound signal pressure amplitudes are measured,and the acoustic impedance of the first medium is known. In that kind of situation,the calculated reflection coefficient is related to the acoustic impedance of the secondmaterial and, therefore, also to the mechanical properties of the second material.[36, 118, 127]
Ultrasound attenuationIn an ideal material, the acoustic pressure of a traveling ultrasonic wave remainsconstant and, hence, the energy is conserved. However, in real materials, the acous-tic energy of a traveling wave does not remain constant, i.e. an attenuation phe-nomenon takes place. The attenuation process can be divided into three components:absorption, scattering and beam spreading. In absorption, the energy of motion isconverted into heat energy. In scattering, the energy of motion is diverted from the”main” wave into waves traveling at different directions. In beam spreading, theenergy is redistributed over a different area but remains still part of a single wave.Mathematically, attenuation by absorption or scattering of an ultrasonic wave canbe represented as a decaying exponential (eq. (14) in Table 5.1). Furthermore,the ultrasound signal attenuation coefficient (α) is significantly dependent on thefrequency (α = bfd, where f is the frequency and b and d are experimentally deter-mined coefficients). [36, 118, 127]
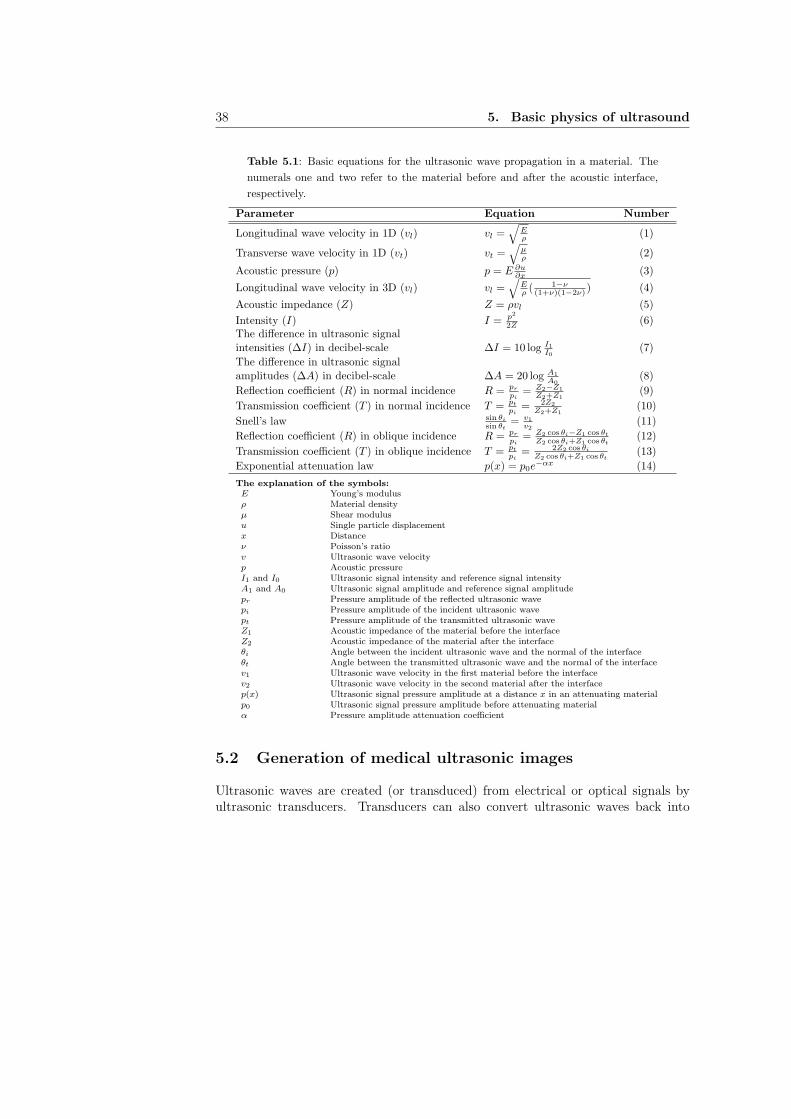
38 5. Basic physics of ultrasound
Table 5.1: Basic equations for the ultrasonic wave propagation in a material. The
numerals one and two refer to the material before and after the acoustic interface,
respectively.
Parameter Equation Number
Longitudinal wave velocity in 1D (vl) vl =√
Eρ
(1)
Transverse wave velocity in 1D (vt) vt =√
µρ
(2)
Acoustic pressure (p) p = E ∂u∂x
(3)
Longitudinal wave velocity in 3D (vl) vl =√
Eρ( 1−ν(1+ν)(1−2ν) ) (4)
Acoustic impedance (Z) Z = ρvl (5)
Intensity (I) I = p2
2Z(6)
The difference in ultrasonic signalintensities (∆I) in decibel-scale ∆I = 10 log I1
I0
(7)
The difference in ultrasonic signalamplitudes (∆A) in decibel-scale ∆A = 20 log A1
A0
(8)
Reflection coefficient (R) in normal incidence R = pr
pi
= Z2−Z1
Z2+Z1
(9)
Transmission coefficient (T ) in normal incidence T = pt
pi
= 2Z2
Z2+Z1
(10)
Snell’s law sin θi
sin θt
= v1
v2
(11)
Reflection coefficient (R) in oblique incidence R = pr
pi
= Z2 cos θi−Z1 cos θt
Z2 cos θi+Z1 cos θt
(12)
Transmission coefficient (T ) in oblique incidence T = pt
pi
= 2Z2 cos θi
Z2 cos θi+Z1 cos θt
(13)
Exponential attenuation law p(x) = p0e−αx (14)
The explanation of the symbols:E Young’s modulusρ Material densityµ Shear modulusu Single particle displacementx Distanceν Poisson’s ratiov Ultrasonic wave velocityp Acoustic pressureI1 and I0 Ultrasonic signal intensity and reference signal intensityA1 and A0 Ultrasonic signal amplitude and reference signal amplitudepr Pressure amplitude of the reflected ultrasonic wavepi Pressure amplitude of the incident ultrasonic wavept Pressure amplitude of the transmitted ultrasonic waveZ1 Acoustic impedance of the material before the interfaceZ2 Acoustic impedance of the material after the interfaceθi Angle between the incident ultrasonic wave and the normal of the interfaceθt Angle between the transmitted ultrasonic wave and the normal of the interfacev1 Ultrasonic wave velocity in the first material before the interfacev2 Ultrasonic wave velocity in the second material after the interfacep(x) Ultrasonic signal pressure amplitude at a distance x in an attenuating materialp0 Ultrasonic signal pressure amplitude before attenuating materialα Pressure amplitude attenuation coefficient
5.2 Generation of medical ultrasonic images
Ultrasonic waves are created (or transduced) from electrical or optical signals byultrasonic transducers. Transducers can also convert ultrasonic waves back into
5.2 Generation of medical ultrasonic images 39
electrical or optical signals. The most common transducer type is the piezoelectric
transducer. The principle of this transducer is based on the direct piezoelectric
effect in which a piezoelectric material responds to a mechanical deformation bydeveloping a charge on its surface. The applied mechanical stress is related to theoutput voltage (or current). The reverse phenomenon, the indirect piezoelectric effect
produces a mechanical deformation when the piezoelectric material is subjected toan electric field. Hence, the desired ultrasound pulse can be produced by applying analternating voltage pulse to the faces of the piezoelectric material. Conversely, if anultrasonic wave passes through the piezoelectric material, the material contracts andexpands producing an alternating electric field, i.e. voltage, across the measuringelectrodes. More details of the generation of the ultrasound transducers is in theliterature, e.g., by Shull and Tittmann (2002) [118].
The most common configuration for transmitting and receiving ultrasound sig-nals in medical ultrasonics is the pulse-echo method. In this method, a single trans-ducer acts as the transmitter and the receiver. This method is especially suitablefor analysis of materials with limited access to a single side. In most cases, this isthe situation in medical ultrasonics.
In medical ultrasonics, phased ultrasonic arrays are commonly used. Every singleultrasound transducer independently transmits and receives the ultrasound signal.The data from each scan line is collected, analyzed and some predetermined value(e.g. amplitude or time of flight) is calculated and plotted against position (ordepth). When this is repeated in all adjacent scan lines, a 2D ultrasound image isgenerated. Thus, the typical medical ultrasound 2D image (B-scan) contains thelocation in a lateral direction plotted in the x-axis, and the location in the axialdirection (depth) plotted in the y-axis. In medical devices, the depth of differenttissues is determined by measuring the exact time of flight of the ultrasound signaltravelling from the transducer to the acoustic interface. The speed of sound isassumed to be constant in human tissues and, subsequently, the depth correspondingto the time of flight can be calculated. It is also possible to generate an ultrasound2D image by using a single transducer which is moved mechanically by a motor ina lateral direction.
The frequency range of an ultrasound transducer specifies the resolution in theaxial direction, i.e. a better resolution is achieved with a higher ultrasound fre-quency. However, tissues attenuate higher frequencies more than lower frequencieslimiting the possible scan depth in the tissue. Consequently, in medical ultrasonics,the optimal frequency range depends on the depth of the tissue to be investigated,and it is always a compromise between the axial resolution and scan depth. Forinstance, a center frequency of 3.5 MHz is used in the abdomenal area, a centerfrequency of 7 MHz is used for breast imaging, whereas frequencies as high as 30MHz can be used for skin imaging.

40 5. Basic physics of ultrasound
Chapter VI
Ultrasonics of articular cartilage
6.1 Ultrasound measurement techniques
Contact techniqueIn the contact technique, cartilage tissue is often detached from the subchondralbone and, subsequently, installed between an ultrasound transducer and a metal-lic plate. Thus, the transducer is in direct contact with the cartilage surface. Anultrasound wave is transmitted through the cartilage and the echoes from the inter-face between cartilage and metallic plate are recorded. An ultrasound transducermay also be connected to the high-resolution material testing device allowing si-multaneous mechanical measurements in unconfined compression geometry (see e.g.
[96]). Hence, the cartilage sample can be compressed to a predefined strain and theforce by which the tissue resists deformation can be measured simultaneously as theultrasound signal is collected. This configuration is designed for in vitro testing.With this set up, the speed of sound and attenuation in the tissue with or withoutmechanical testing can be determined [96, 123].
The contact technique may also be applied without detaching cartilage from thesubchondral bone. In this case, the echoes from the interface between cartilage andsubchondral bone are recorded. With this set up, it is possible to determine a valuefor the ultrasound reflection coefficient for the cartilage-bone interface. Further-more, the cartilage thickness can be determined by calculating the time of flightand assuming a constant speed of sound. This technique is suitable for in vivo
testing, and it is applied in ultrasound indentation measurements [58, 70, 121, 134]enabling the determination of mechanical and acoustic properties of tissue.
Non-contact techniqueIn the non-contact technique, an ultrasound transducer is immersed in a couplingmedium, e.g., water or saline solution, and set at a constant distance from the car-tilage surface. Thus, an ultrasound wave arrives first at the interface between the
41
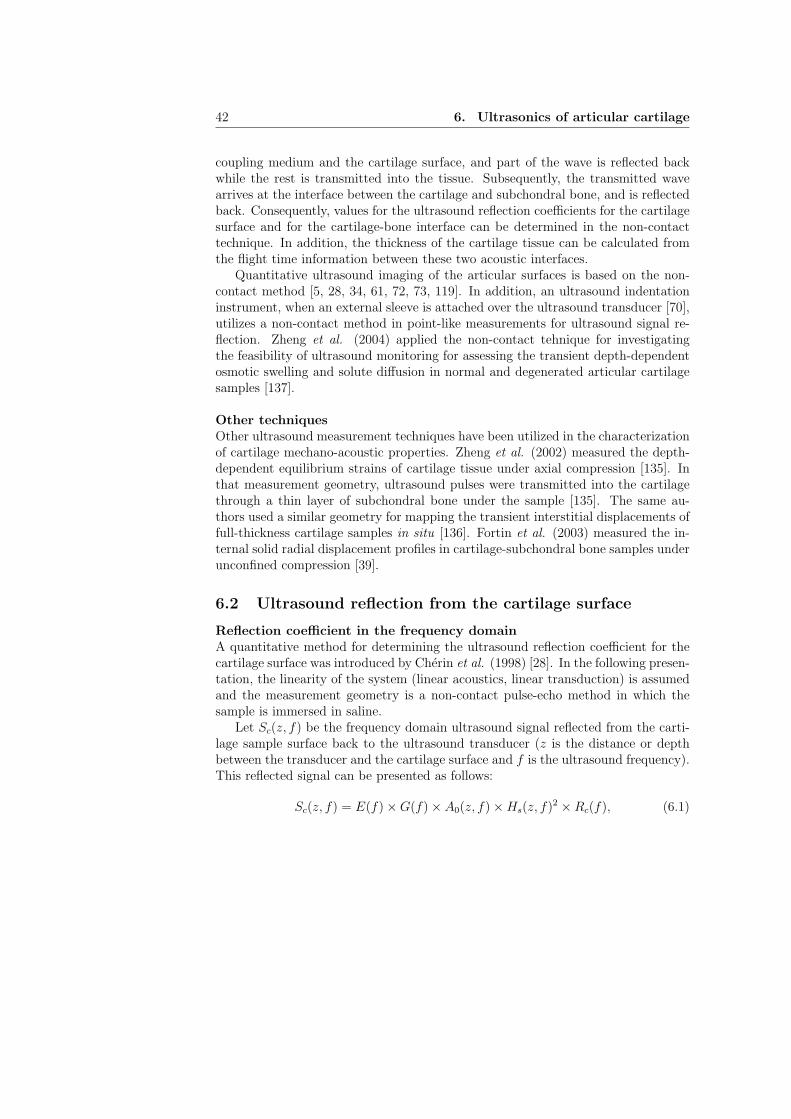
42 6. Ultrasonics of articular cartilage
coupling medium and the cartilage surface, and part of the wave is reflected backwhile the rest is transmitted into the tissue. Subsequently, the transmitted wavearrives at the interface between the cartilage and subchondral bone, and is reflectedback. Consequently, values for the ultrasound reflection coefficients for the cartilagesurface and for the cartilage-bone interface can be determined in the non-contacttechnique. In addition, the thickness of the cartilage tissue can be calculated fromthe flight time information between these two acoustic interfaces.
Quantitative ultrasound imaging of the articular surfaces is based on the non-contact method [5, 28, 34, 61, 72, 73, 119]. In addition, an ultrasound indentationinstrument, when an external sleeve is attached over the ultrasound transducer [70],utilizes a non-contact method in point-like measurements for ultrasound signal re-flection. Zheng et al. (2004) applied the non-contact tehnique for investigatingthe feasibility of ultrasound monitoring for assessing the transient depth-dependentosmotic swelling and solute diffusion in normal and degenerated articular cartilagesamples [137].
Other techniquesOther ultrasound measurement techniques have been utilized in the characterizationof cartilage mechano-acoustic properties. Zheng et al. (2002) measured the depth-dependent equilibrium strains of cartilage tissue under axial compression [135]. Inthat measurement geometry, ultrasound pulses were transmitted into the cartilagethrough a thin layer of subchondral bone under the sample [135]. The same au-thors used a similar geometry for mapping the transient interstitial displacements offull-thickness cartilage samples in situ [136]. Fortin et al. (2003) measured the in-ternal solid radial displacement profiles in cartilage-subchondral bone samples underunconfined compression [39].
6.2 Ultrasound reflection from the cartilage surface
Reflection coefficient in the frequency domainA quantitative method for determining the ultrasound reflection coefficient for thecartilage surface was introduced by Cherin et al. (1998) [28]. In the following presen-tation, the linearity of the system (linear acoustics, linear transduction) is assumedand the measurement geometry is a non-contact pulse-echo method in which thesample is immersed in saline.
Let Sc(z, f) be the frequency domain ultrasound signal reflected from the carti-lage sample surface back to the ultrasound transducer (z is the distance or depthbetween the transducer and the cartilage surface and f is the ultrasound frequency).This reflected signal can be presented as follows:
Sc(z, f) = E(f) × G(f) × A0(z, f) × Hs(z, f)2 × Rc(f), (6.1)
6.2 Ultrasound reflection from the cartilage surface 43
where E(f) is the acoustoelectric transfer function, G(f) is the acquisition sys-tem transfer function, A0(z, f) is the frequency and depth-dependent attenuationfunction in saline, Hs(z, f)2 is the surface-integrated diffraction function (in thepulse-echo method) and Rc(f) is the ultrasound reflection coefficient for the carti-lage surface. The following assumptions are included in the equation (6.1):
1. The sample surface is uniform, i.e. the reflection coefficient is constant all overthe surface.
2. The sample surface is perpendicular to the incident ultrasound signal and thereis no curvature of the surface.
3. The distance between the transducer and each surface point (z) is large enoughin comparison with the transducer dimensions. Thus, attenuation and diffrac-tion functions can be separated.
4. The dimensions of the cartilage surface are small as compared to the distancebetween the transducer and surface (z). Thus, the attenuation term is constantacross the surface and Hs(z, f)2 can be defined by integration of the transducerdiffraction function over this insonated surface.
In order to calculate the ultrasound reflection coefficient for the cartilage surface(Rc(f) in eq. (6.1)), the attenuation function, the surface-integrated diffractionfunction and the characteristics of the acquisition system need to be known.
By assuming that the acquisition system is the same as in the cartilage samplemeasurements, the frequency domain ultrasound signal reflected back from the per-fect reflector (Sr(z, f)), immersed in saline at the same distance z, can be presentedas follows:
Sr(z, f) = E(f) × G(f) × A0(z, f) × Hs(z, f)2 × Rr(f), (6.2)
where the reflection coefficient of the perfect reflector (Rr(f), e.g., from the water-air interface [127]) is assumed to be independent of the frequency and equal to 1.Rc(f) from equation (6.1) can be presented as follows:
Rc(f) =Sc(z, f)
E(f) × G(f) × A0(z, f) × Hs(z, f)2. (6.3)
By combining equations (6.2) and (6.3) we obtain:
Rc(f) =Sc(z, f)
Sr(z, f). (6.4)
With this method, one can eliminate the effects of the attenuation function as well asthe surface-integrated diffraction function and the characteristics of the acquisition
44 6. Ultrasonics of articular cartilage
system. In principle, the ultrasound reflection coefficient for the cartilage surfacecan be quantified by measuring the ultrasound reflection from both the cartilage sur-face and from the perfect reflector using any acquisition system and measurementgeometry. The frequency spectra, Sc(z, f) and Sr(z, f), are typically determinedwith the Fast Fourier Transform (FFT) method.
Before conducting FFT, the ultrasound signal is Hamming windowed to includeonly the reflection from the cartilage surface. Hamming window enhances the contri-bution of the specular reflection as compared to the scattering occurring beneath thesurface. Hamming window operation can be conducted, e.g., with the LabVIEW-software:
SH = So
[
0.54 − 0.46 cos2πi
n
]
, i = 0, 1, 2, ..., n − 1; (6.5)
where SH is the Hamming windowed signal, S0 is the original unprocessed signaland n is the amount of data (time) points in the window. The Hamming windowoperation is not needed with a reference signal from the perfect reflector since noscattering occurs in it. After the Hamming window operation, the length of boththe cartilage ultrasound signal and the reference signal is expanded with the zero-padding operation. With zero-padding, it is possible to increase the resolution ofthe frequency domain in FFT.
The energy reflection coefficient for the cartilage surface (RdBc (f)) can be deter-
mined as follows:
RdBc (f) = 10 × log10
⟨
|Rc(f)|2⟩
, (6.6)
where 〈...〉 indicates the spatial average over all scan lines within the 2D ultrasoundimage. Finally, the integrated reflection coefficient (IRC) is defined as follows:
IRC =1
∆f
∫
∆f
RdBc (f)df, (6.7)
where ∆f is the frequency bandwidth.
Reflection coefficient in the time domainThe ultrasound reflection coefficient can also be determined in the time domain. Themethod makes the same assumptions as in frequency domain analysis. Let Ac bethe maximum peak-to-peak amplitude of the time domain ultrasound signal Sc(z)reflected from the cartilage sample surface back to the ultrasound transducer at adistance z (Figure 6.1). Similarly, Ar is the maximum peak-to-peak amplitude for aperfect reflector signal at the same distance z. The ultrasound reflection coefficientfor the cartilage surface in the time domain (Rc) can be presented as follows:
Rc =Ac
Ar
· 100%. (6.8)
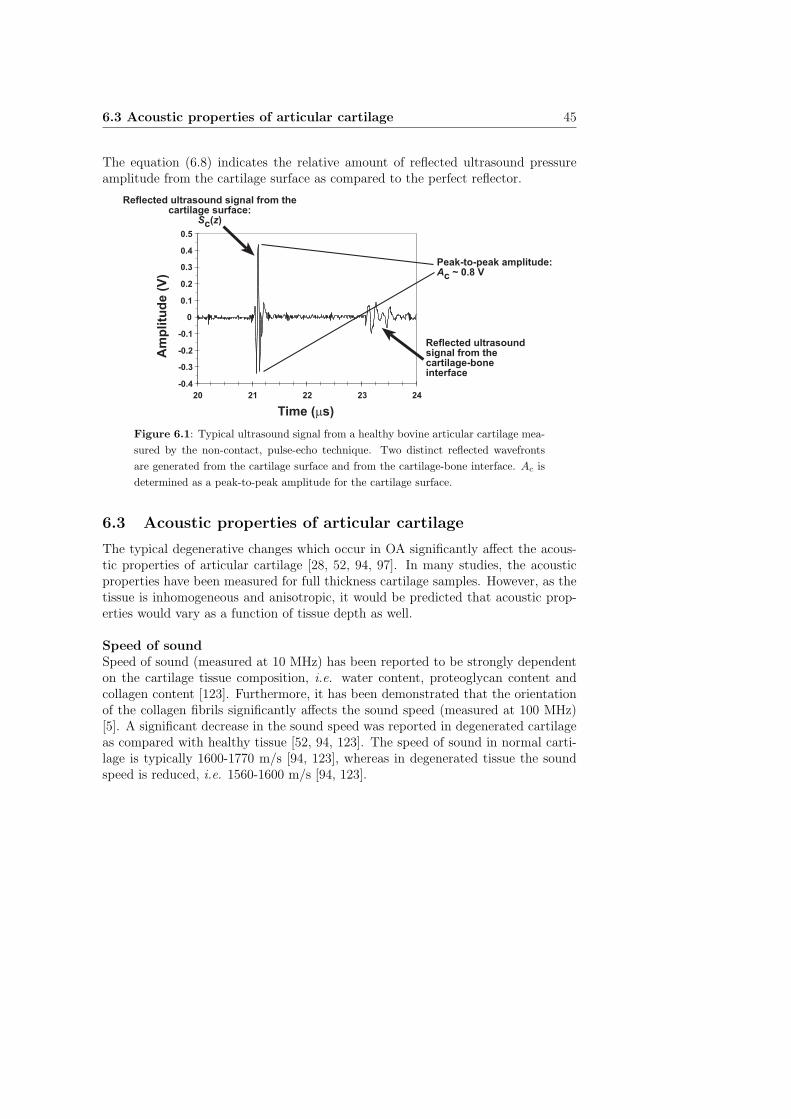
6.3 Acoustic properties of articular cartilage 45
The equation (6.8) indicates the relative amount of reflected ultrasound pressureamplitude from the cartilage surface as compared to the perfect reflector.
-0.4
-0.3
-0.2
-0.1
0
0.1
0.2
0.3
0.4
0.5
20 21 22 23 24
Time (ms)
Am
pli
tud
e (
V)
Reflected ultrasound signal from thecartilage surface:
Sc(z)
Reflected ultrasoundsignal from thecartilage-boneinterface
Peak-to-peak amplitude:Ac ~ 0.8 V
Figure 6.1: Typical ultrasound signal from a healthy bovine articular cartilage mea-
sured by the non-contact, pulse-echo technique. Two distinct reflected wavefronts
are generated from the cartilage surface and from the cartilage-bone interface. Ac is
determined as a peak-to-peak amplitude for the cartilage surface.
6.3 Acoustic properties of articular cartilage
The typical degenerative changes which occur in OA significantly affect the acous-tic properties of articular cartilage [28, 52, 94, 97]. In many studies, the acousticproperties have been measured for full thickness cartilage samples. However, as thetissue is inhomogeneous and anisotropic, it would be predicted that acoustic prop-erties would vary as a function of tissue depth as well.
Speed of soundSpeed of sound (measured at 10 MHz) has been reported to be strongly dependenton the cartilage tissue composition, i.e. water content, proteoglycan content andcollagen content [123]. Furthermore, it has been demonstrated that the orientationof the collagen fibrils significantly affects the sound speed (measured at 100 MHz)[5]. A significant decrease in the sound speed was reported in degenerated cartilageas compared with healthy tissue [52, 94, 123]. The speed of sound in normal carti-lage is typically 1600-1770 m/s [94, 123], whereas in degenerated tissue the soundspeed is reduced, i.e. 1560-1600 m/s [94, 123].
46 6. Ultrasonics of articular cartilage
Ultrasound attenuationIn 1990, Agemura et al. demonstrated that ultrasound attenuation in cartilage tissue(measured at 100 MHz) is significantly dependent on the integrity of the cross-linksin the collagen fibres [5]. In that study, proteoglycan depletion had no effect onthe attenuation and speed [5]. However, it was proposed later that attenuation issignificantly related to both collagen and proteoglycan contents [96]. Ultrasoundattenuation for bovine cartilage tissue has been reported to be 1.8-2.7 dB/mm [96],2.8-6.5 dB/mm [116] and 92-147 dB/mm [5] at frequency ranges of 5-9 MHz, 10-40 MHz and 100 MHz, respectively. For human articular cartilage, attenuation is6.2-7.1 dB/mm at the frequency of 30 MHz [52]. Based on these results, it is clearthat ultrasound attenuation in cartilage tissue is highly dependent on the frequencyused, i.e. attenuation increases at higher frequencies.
Ultrasonically determined cartilage thicknessAn increase in tissue thickness, measured with ultrasound, has been reported fordegenerated cartilage samples compared with intact specimens [28, 78, 114]. Thick-ness measurements are typically based on the assumption of constant sound speedin tissue and, thus, known variations in site- and depth-dependent composition andstructure of articular cartilage may cause uncertainty in the measured thickness val-ues.
Acoustic impedanceDensity of articular cartilage tissue is approximately 1050 kg/m3 [53]. Based onthe above results for the speed of sound, i.e. 1560-1770 m/s [94, 123], the acousticimpedance of cartilage tissue could be approximated to be 1.64−1.86×10⁶ kg/m2/s.
Ultrasound reflection from the cartilage surface and backscattering fromthe internal tissueUltrasound reflection from the cartilage surface (measured at 22-55 MHz) has beenproposed to be a sensitive indicator of the superficial cartilage degradation [28, 50,68, 97, 114, 119, 124], i.e. increased surface roughness and degeneration of super-ficial collagen fibrils taking place during early OA [86]. In contrast, depletion ofsuperficial proteoglycans has no significant effect on the ultrasound reflection coeffi-cient for the surface [70, 103]. The ultrasound reflection coefficient for the cartilagesurface in the time domain is approximately 2.6-5.7 % for intact bovine cartilagesamples [70, 97, 124]. In the frequency domain, the integrated reflection coefficient(IRC) for intact rat articular cartilage has been reported to be approximately 21-24dB lower (measured at 50-55 MHz) than the ultrasound reflection from the perfectreflector [28, 29, 103].
Ultrasound backscattering from the internal cartilage matrix has been investi-gated in rat cartilage tissue [28, 29, 103]. The results demonstrated that backscat-
6.3 Acoustic properties of articular cartilage 47
tering in intact bovine cartilage is approximately 38-52 dB lower (measured at 50-55MHz) than that determined from the perfect reflector [28, 29, 103]. Furthermore,both the ultrasound reflection coefficient for the cartilage surface as well as backscat-tering from the internal tissue depend on the maturation stage of the tissue [29, 103].
Based on the existing literature, it can be proposed that porcine [61] or rat[28, 29] internal cartilage tissue scatters ultrasound more effectively than bovine[70, 97] or human [94] tissue. Consequently, it can be hypothesized that quantita-tive measurement of ultrasound backscattering from the internal human tissue willbe quite complicated due to the potentially weak echo signal. However, it can beanticipated that backscattering from the internal tissue will be dependent on theultrasound frequency and that the backscattering will be probably more intensiveat high frequencies.
Ultrasound reflection from the cartilage-bone interfaceQuantitative ultrasound analysis of the cartilage-bone interface is challenging as theattenuation, due to both absorption and scattering, in the overlying cartilage tis-sue may significantly affect the results. It has been qualitatively evaluated that theechogenicity of the cartilage-bone interface increases during OA [34, 72, 73, 114, 119].Quantitatively, the frequency domain ultrasound reflection and backscattering coef-ficient for the cartilage-bone interface in intact rat cartilage tissue was reported tobe approximately 30-34 dB lower than the ultrasound reflection from the perfect re-flector [50]. It is noteworthy that the effect of attenuation in the overlying cartilagetissue was not taken into account in the study [50]. By assuming a constant atten-uation coefficient for cartilage, the reflection coefficient in time domain for intactporcine cartilage has been reported to be approximately 15 % [72].

48 6. Ultrasonics of articular cartilage
Chapter VII
Surface roughness of articular cartilage
7.1 Surface roughness parameters
The surface roughness of materials can be experimentally determined with severaltechniques. Typically, surface roughness is measured with a stylus profilometer inwhich the surface profile for a predefined measurement length is determined and,subsequently, a numerical parameter is calculated to indicate the surface rough-ness. The stylus profilometers set very high requirements for the apparatus andthe environmental conditions as even the slightest trembling induces uncertaintyinto the results. Furthermore, the mechanical profilometer requires direct contactwith the examined material, potentially damaging fragile samples such as biologicalmaterials.
Optical methods, e.g., laser profilometry, are also widely used for the characteri-zation of material surfaces. The benefit of optical devices, as compared to mechanicalprofilometers, is that they do not require direct contact with the material surface.In optical devices, the measurement is based on the backscattering of light from thesurface, this being detected with highly sensitive detectors.
When defining the statistical parameters for surface roughness it is assumedthat the baseline of the measured surface profile is perfectly straight. Then, one candefine the average roughness (Ra) and root mean square (RMS) roughness (Rq) asfollows:
Ra =1
L
∫ L
0
|y(x)| dx, (7.1)
Rq =
√
1
L
∫ L
0
y(x)2dx, (7.2)
where L is the measurement length on the surface and y(x) is the one-dimensionalsurface profile. The main difficulty in experimental situation is that the baselineor, more generally, the base surface is not an ideal straight line or plane. This
49
50 7. Surface roughness of articular cartilage
can be eliminated by conducting several measurements from different surface sitesto obtain a final roughness value as an average. There are also better alternativesavailable, e.g., a high-pass filtering may be applied to the measured surface profileby assuming that the variations in the low frequency range reflect only the contoursof the surface but not the true surface roughness. Another way to accomplish theelimination of the large surface contour is to fit a smoothing spline to the measuredsurface profile. After fitting, the smoothing spline is subtracted from the measuredprofile at every point.
7.2 Ultrasound determination of articular surface roughness
In principle, ultrasound measurements have a great potential for direct determina-tion of cartilage surface roughness. Saıed et al. (1997) proposed that defects of40-50 µm size could be detected on 50 MHz ultrasound 2D (B-scan) images [114].Moreover, mechanically created macroscopical superficial defects of the cartilage sur-face (2 to 12 mm in diameter) can be qualitatively detected and semi-quantitativelygraded even using a clinical ultrasound (5-12 MHz) instrument [34]. The ultrasoni-cally detected surface fibrillation is believed to originate from the disruption of thesubsurface collagen fibrils [28, 50, 97, 114, 124].
In the literature, one method has been described for the determination of car-tilage surface roughness using ultrasound [4, 27]. In that method, the amount ofbackscattered ultrasound energy is measured at different geometrical angles betweenthe ultrasound transducer and cartilage surface using the ultrasound signal (Sc(t),t = time) reflected and backscattered from the cartilage surface to the ultrasoundtransducer at an incident angle, i.e. the angle between the transducer and thesurface normal is 0◦. The ultrasound signal power (P0) is defined as follows:
P0 =
∫
T
[Qg(0◦)Sc(t)]
2 dt, (7.3)
where T is the length of the time window and Qg(0◦) is the signal amplifying-
correction factor at the incident angle. The normalized power at the oblique angle(P (θ)) is defined as follows:
P (θ) =1
P0
∫
T
[Qg(θ)Sc(θ, t)]2dt, (7.4)
where Qg(θ) is the amplifying-correction factor at the angle θ and Sc(θ, t) is theultrasound signal reflected and backscattered from the cartilage surface to the ul-trasound transducer at the angle θ. The signal power (dB) is smaller than zero atevery angle θ 6= 0. The rationale for using the amplifying-correction factor is tocompensate for the possible change in an electric amplifying at different angles.

7.3 Values of articular surface roughness 51
According to the acoustic theory, the intensity of backscattered ultrasound froma rough surface can be divided into the coherent and incoherent components [26].With flat or smooth surfaces, ultrasound backscattering is mainly coherent andspecular. In rough surfaces, ultrasound backscattering is mainly incoherent. Whenmeasuring the backscattered ultrasound signal for small values of θ, the coherentcomponent dominates the signal intensity. When measuring the backscattered ul-trasound signal for larger values of θ, the incoherent component dominates and,therefore, changes in surface roughness can be detected with higher accuracy. As theultrasound backscattering is measured in the time domain at angles of 25◦−40◦ [27],backscattering values for different angles are averaged. The final mean backscatter-ing value is related to the roughness of the surface. However, this technique providesno direct measure of roughness. Moreover, this method is suitable only under lab-oratory conditions. At present, no quantitative technique capable of measuring thesurface roughness of articular cartilage in vivo has been described.
7.3 Values of articular surface roughness
In the literature, there are only a few studies devoted to the quantitative determina-tion of cartilage surface roughness [4, 27, 38, 48]. In the work of Forster et al. (1996)a contact stylus profilometer and a non-contact laser profilometer were employed fordetermining the surface roughness of bovine articular cartilage (n=8 for stylus andn=1 for laser, respectively) [38]. The average roughness (Ra) for healthy tissue was0.8 µm and 1.6 µm as determined with the laser profilometer and stylus profilometer,respectively [38]. In the work of Hu et al. (2001) atomic force microscopy was usedto determine the surface roughness of healthy rabbit articular cartilage (n=18) [48].The average roughness (Ra) was 0.16-0.32 µm [48]. In the work of Chiang et al.
(1997) laser confocal microscopy was used for the determination of surface rough-ness of human cartilage tissue in healthy (n=2) and osteoarthritic (n=4) samples[27]. In that study, the RMS roughness (Rq) was determined and values in a rangebetween 5.4-99.2 µm were reported [27].

52 7. Surface roughness of articular cartilage
Chapter VIII
Aims of the present study
Previous studies have indicated that mechano-acoustic methods do provide infor-mation on the structure, composition and functional properties of normal and de-generated articular cartilage. The main aims of the present study were:
1. To investigate the sensitivity of a recently developed ultrasound indentationinstrument to detect and distinguish different spontaneous degenerative stagesin bovine articular cartilage.
2. To investigate the relationship between the mechanical and acoustic propertiesof cartilage.
3. To investigate the sensitivity of quantitative 2D ultrasound imaging for detec-tion of superficial changes after mechanical, enzymatic or spontaneous degen-eration of bovine articular cartilage.
4. To develop a novel methodology for quantification of cartilage surface rough-ness in ultrasound 2D images.
5. To characterize the ability of quantitative 2D ultrasound imaging for detectionof site-dependent variation of the acoustic parameters and collagen content inthe bovine knee. The roles of cartilage surface roughness and the collagencontent as determinants of ultrasound reflection from the articular surfacewere also clarified.
6. To investigate the sensitivity of 2D ultrasound imaging to quantitatively detectosteoarthrotic changes occuring in the subchondral bone.
53

54 8. Aims of the present study
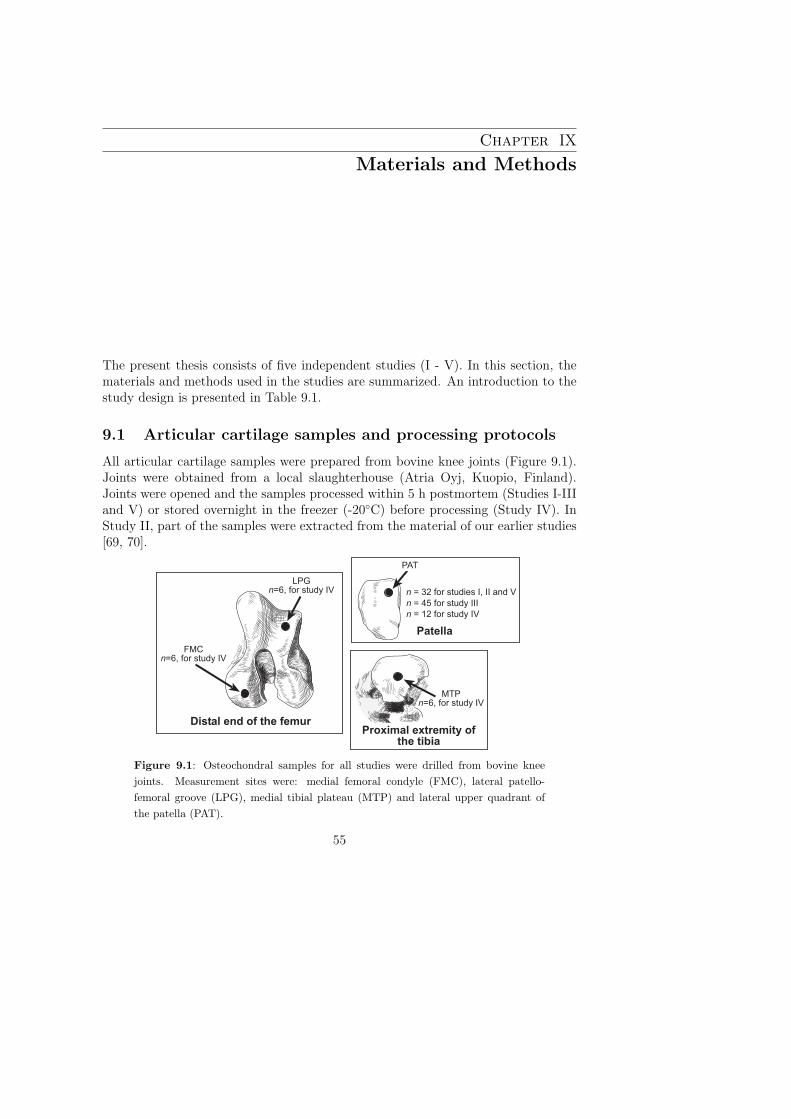
Chapter IX
Materials and Methods
The present thesis consists of five independent studies (I - V). In this section, thematerials and methods used in the studies are summarized. An introduction to thestudy design is presented in Table 9.1.
9.1 Articular cartilage samples and processing protocols
All articular cartilage samples were prepared from bovine knee joints (Figure 9.1).Joints were obtained from a local slaughterhouse (Atria Oyj, Kuopio, Finland).Joints were opened and the samples processed within 5 h postmortem (Studies I-IIIand V) or stored overnight in the freezer (-20◦C) before processing (Study IV). InStudy II, part of the samples were extracted from the material of our earlier studies[69, 70].
LPGn=6, for study IV
FMCn=6, for study IV
MTPn=6, for study IV
PAT
n = 32 for studies I, II and V
n = 45 for study III
n = 12 for study IV
Distal end of the femurProximal extremity of
the tibia
Patella
Figure 9.1: Osteochondral samples for all studies were drilled from bovine knee
joints. Measurement sites were: medial femoral condyle (FMC), lateral patello-
femoral groove (LPG), medial tibial plateau (MTP) and lateral upper quadrant of
the patella (PAT).
55
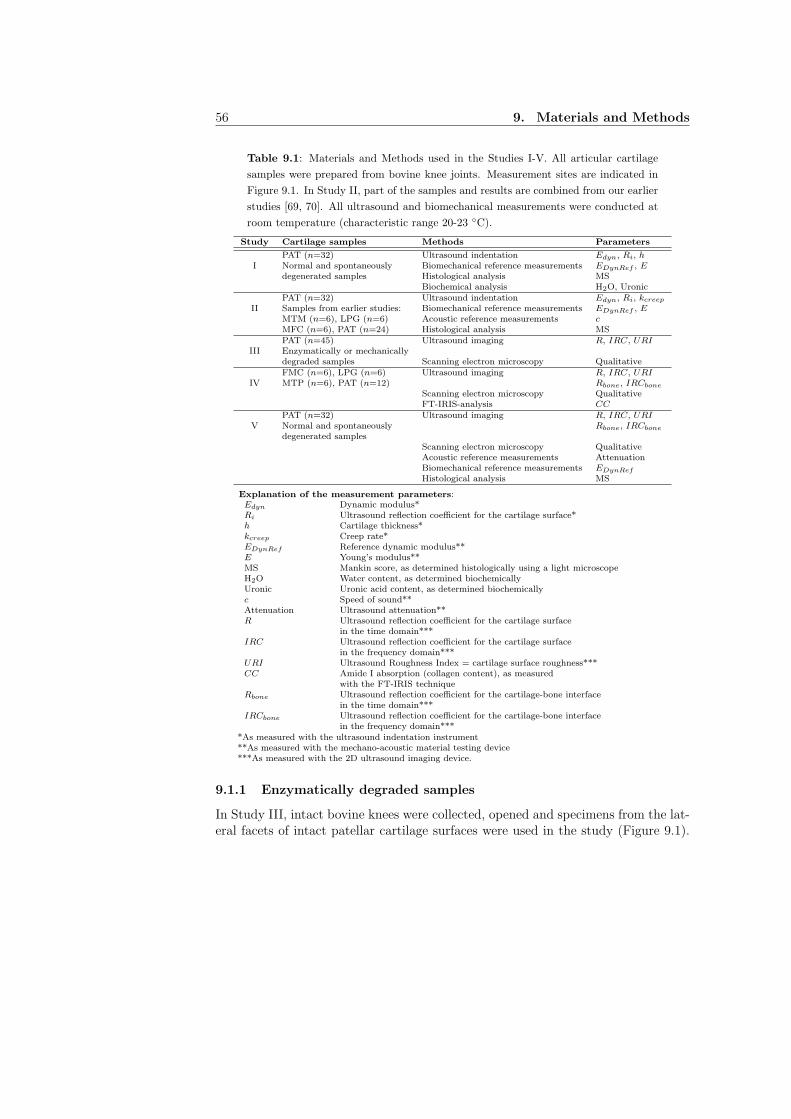
56 9. Materials and Methods
Table 9.1: Materials and Methods used in the Studies I-V. All articular cartilage
samples were prepared from bovine knee joints. Measurement sites are indicated in
Figure 9.1. In Study II, part of the samples and results are combined from our earlier
studies [69, 70]. All ultrasound and biomechanical measurements were conducted at
room temperature (characteristic range 20-23 ◦C).
Study Cartilage samples Methods Parameters
PAT (n=32) Ultrasound indentation Edyn, Ri, hI Normal and spontaneously Biomechanical reference measurements EDynRef , E
degenerated samples Histological analysis MSBiochemical analysis H2O, Uronic
PAT (n=32) Ultrasound indentation Edyn, Ri, kcreep
II Samples from earlier studies: Biomechanical reference measurements EDynRef , EMTM (n=6), LPG (n=6) Acoustic reference measurements cMFC (n=6), PAT (n=24) Histological analysis MSPAT (n=45) Ultrasound imaging R, IRC, URI
III Enzymatically or mechanicallydegraded samples Scanning electron microscopy QualitativeFMC (n=6), LPG (n=6) Ultrasound imaging R, IRC, URI
IV MTP (n=6), PAT (n=12) Rbone, IRCbone
Scanning electron microscopy QualitativeFT-IRIS-analysis CC
PAT (n=32) Ultrasound imaging R, IRC, URIV Normal and spontaneously Rbone, IRCbone
degenerated samplesScanning electron microscopy QualitativeAcoustic reference measurements AttenuationBiomechanical reference measurements EDynRef
Histological analysis MS
Explanation of the measurement parameters:Edyn Dynamic modulus*Ri Ultrasound reflection coefficient for the cartilage surface*h Cartilage thickness*kcreep Creep rate*EDynRef Reference dynamic modulus**E Young’s modulus**MS Mankin score, as determined histologically using a light microscopeH2O Water content, as determined biochemicallyUronic Uronic acid content, as determined biochemicallyc Speed of sound**Attenuation Ultrasound attenuation**R Ultrasound reflection coefficient for the cartilage surface
in the time domain***IRC Ultrasound reflection coefficient for the cartilage surface
in the frequency domain***URI Ultrasound Roughness Index = cartilage surface roughness***CC Amide I absorption (collagen content), as measured
with the FT-IRIS techniqueRbone Ultrasound reflection coefficient for the cartilage-bone interface
in the time domain***IRCbone Ultrasound reflection coefficient for the cartilage-bone interface
in the frequency domain****As measured with the ultrasound indentation instrument**As measured with the mechano-acoustic material testing device***As measured with the 2D ultrasound imaging device.
9.1.1 Enzymatically degraded samples
In Study III, intact bovine knees were collected, opened and specimens from the lat-eral facets of intact patellar cartilage surfaces were used in the study (Figure 9.1).
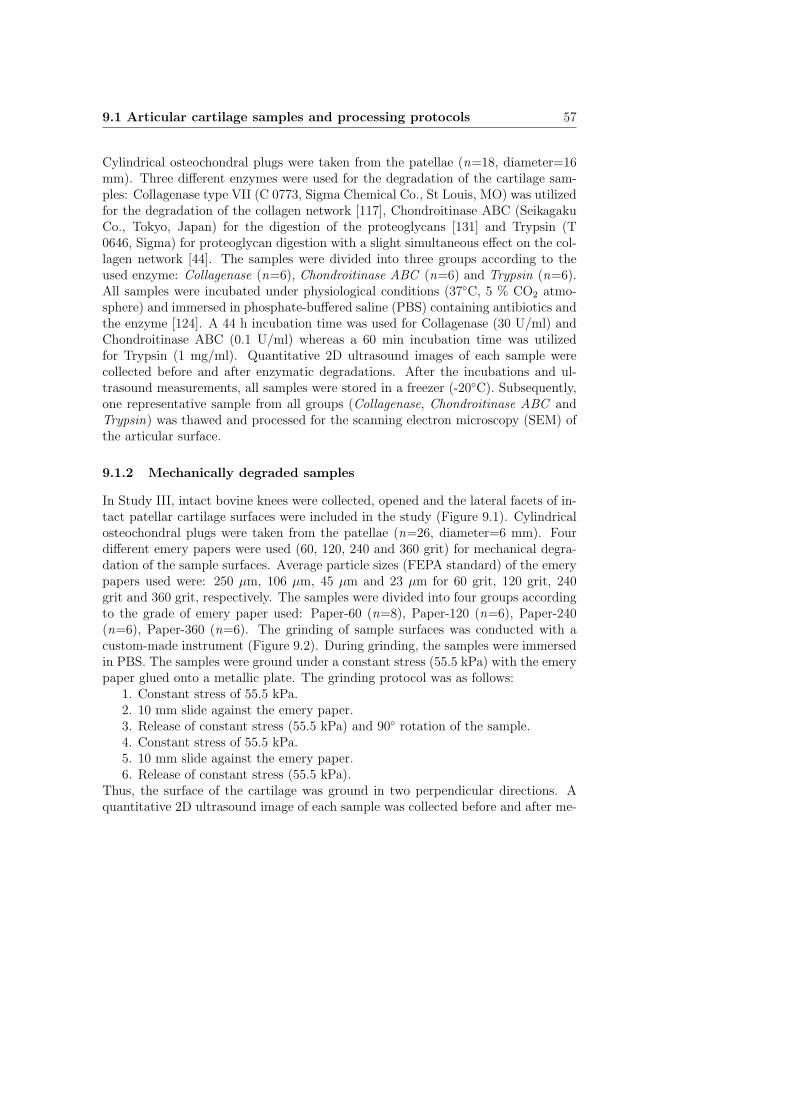
9.1 Articular cartilage samples and processing protocols 57
Cylindrical osteochondral plugs were taken from the patellae (n=18, diameter=16mm). Three different enzymes were used for the degradation of the cartilage sam-ples: Collagenase type VII (C 0773, Sigma Chemical Co., St Louis, MO) was utilizedfor the degradation of the collagen network [117], Chondroitinase ABC (SeikagakuCo., Tokyo, Japan) for the digestion of the proteoglycans [131] and Trypsin (T0646, Sigma) for proteoglycan digestion with a slight simultaneous effect on the col-lagen network [44]. The samples were divided into three groups according to theused enzyme: Collagenase (n=6), Chondroitinase ABC (n=6) and Trypsin (n=6).All samples were incubated under physiological conditions (37◦C, 5 % CO2 atmo-sphere) and immersed in phosphate-buffered saline (PBS) containing antibiotics andthe enzyme [124]. A 44 h incubation time was used for Collagenase (30 U/ml) andChondroitinase ABC (0.1 U/ml) whereas a 60 min incubation time was utilizedfor Trypsin (1 mg/ml). Quantitative 2D ultrasound images of each sample werecollected before and after enzymatic degradations. After the incubations and ul-trasound measurements, all samples were stored in a freezer (-20◦C). Subsequently,one representative sample from all groups (Collagenase, Chondroitinase ABC andTrypsin) was thawed and processed for the scanning electron microscopy (SEM) ofthe articular surface.
9.1.2 Mechanically degraded samples
In Study III, intact bovine knees were collected, opened and the lateral facets of in-tact patellar cartilage surfaces were included in the study (Figure 9.1). Cylindricalosteochondral plugs were taken from the patellae (n=26, diameter=6 mm). Fourdifferent emery papers were used (60, 120, 240 and 360 grit) for mechanical degra-dation of the sample surfaces. Average particle sizes (FEPA standard) of the emerypapers used were: 250 µm, 106 µm, 45 µm and 23 µm for 60 grit, 120 grit, 240grit and 360 grit, respectively. The samples were divided into four groups accordingto the grade of emery paper used: Paper-60 (n=8), Paper-120 (n=6), Paper-240(n=6), Paper-360 (n=6). The grinding of sample surfaces was conducted with acustom-made instrument (Figure 9.2). During grinding, the samples were immersedin PBS. The samples were ground under a constant stress (55.5 kPa) with the emerypaper glued onto a metallic plate. The grinding protocol was as follows:
1. Constant stress of 55.5 kPa.2. 10 mm slide against the emery paper.3. Release of constant stress (55.5 kPa) and 90◦ rotation of the sample.4. Constant stress of 55.5 kPa.5. 10 mm slide against the emery paper.6. Release of constant stress (55.5 kPa).
Thus, the surface of the cartilage was ground in two perpendicular directions. Aquantitative 2D ultrasound image of each sample was collected before and after me-
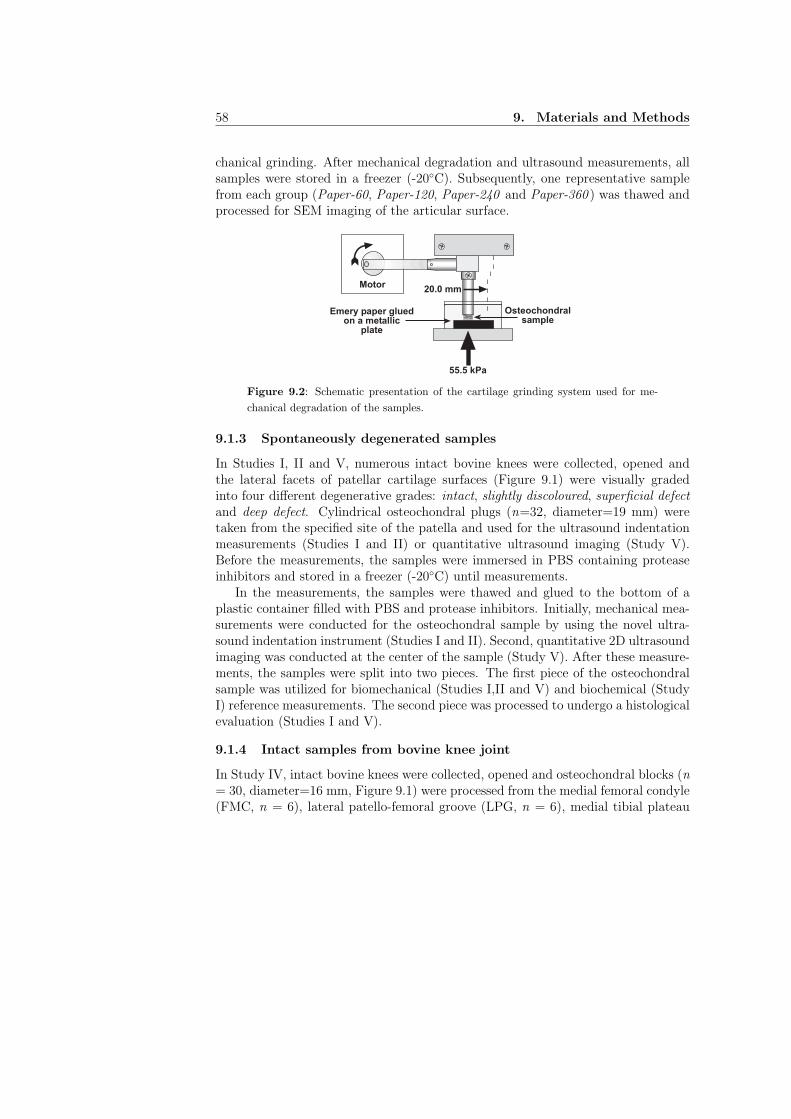
58 9. Materials and Methods
chanical grinding. After mechanical degradation and ultrasound measurements, allsamples were stored in a freezer (-20◦C). Subsequently, one representative samplefrom each group (Paper-60, Paper-120, Paper-240 and Paper-360 ) was thawed andprocessed for SEM imaging of the articular surface.
Motor20.0 mm
Emery paper gluedon a metallic
plate
55.5 kPa
Osteochondralsample
Figure 9.2: Schematic presentation of the cartilage grinding system used for me-
chanical degradation of the samples.
9.1.3 Spontaneously degenerated samples
In Studies I, II and V, numerous intact bovine knees were collected, opened andthe lateral facets of patellar cartilage surfaces (Figure 9.1) were visually gradedinto four different degenerative grades: intact, slightly discoloured, superficial defect
and deep defect. Cylindrical osteochondral plugs (n=32, diameter=19 mm) weretaken from the specified site of the patella and used for the ultrasound indentationmeasurements (Studies I and II) or quantitative ultrasound imaging (Study V).Before the measurements, the samples were immersed in PBS containing proteaseinhibitors and stored in a freezer (-20◦C) until measurements.
In the measurements, the samples were thawed and glued to the bottom of aplastic container filled with PBS and protease inhibitors. Initially, mechanical mea-surements were conducted for the osteochondral sample by using the novel ultra-sound indentation instrument (Studies I and II). Second, quantitative 2D ultrasoundimaging was conducted at the center of the sample (Study V). After these measure-ments, the samples were split into two pieces. The first piece of the osteochondralsample was utilized for biomechanical (Studies I,II and V) and biochemical (StudyI) reference measurements. The second piece was processed to undergo a histologicalevaluation (Studies I and V).
9.1.4 Intact samples from bovine knee joint
In Study IV, intact bovine knees were collected, opened and osteochondral blocks (n= 30, diameter=16 mm, Figure 9.1) were processed from the medial femoral condyle(FMC, n = 6), lateral patello-femoral groove (LPG, n = 6), medial tibial plateau
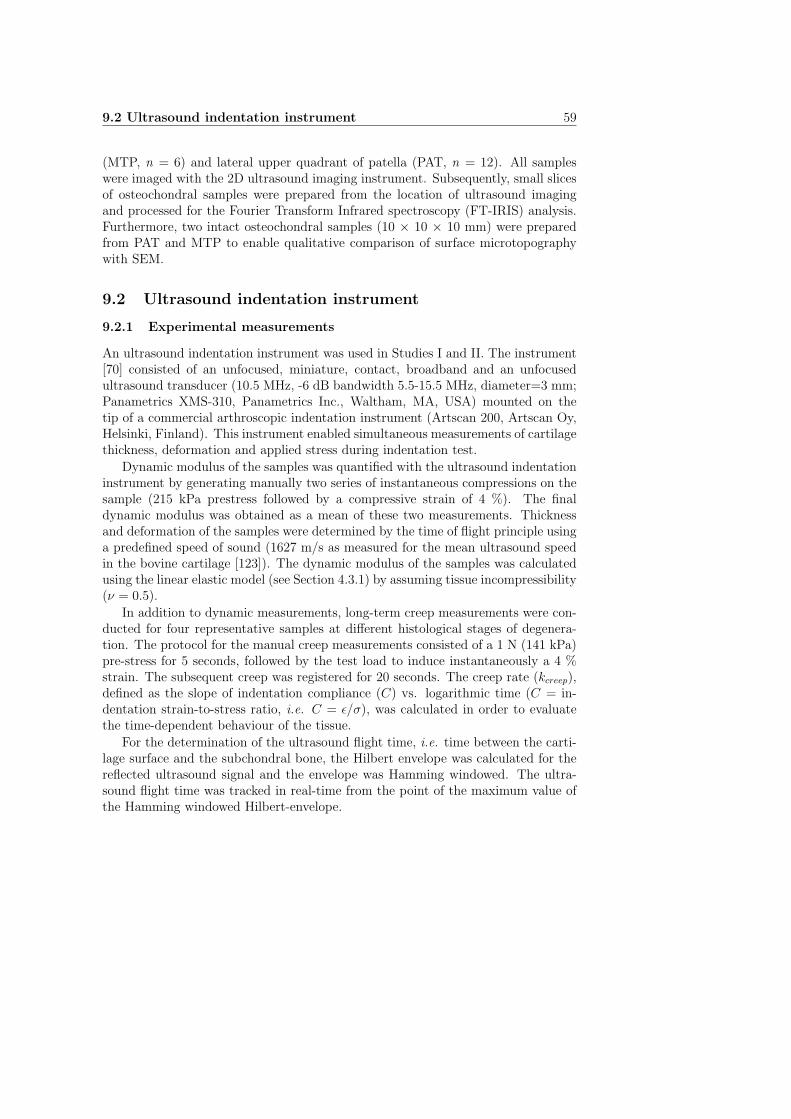
9.2 Ultrasound indentation instrument 59
(MTP, n = 6) and lateral upper quadrant of patella (PAT, n = 12). All sampleswere imaged with the 2D ultrasound imaging instrument. Subsequently, small slicesof osteochondral samples were prepared from the location of ultrasound imagingand processed for the Fourier Transform Infrared spectroscopy (FT-IRIS) analysis.Furthermore, two intact osteochondral samples (10 × 10 × 10 mm) were preparedfrom PAT and MTP to enable qualitative comparison of surface microtopographywith SEM.
9.2 Ultrasound indentation instrument
9.2.1 Experimental measurements
An ultrasound indentation instrument was used in Studies I and II. The instrument[70] consisted of an unfocused, miniature, contact, broadband and an unfocusedultrasound transducer (10.5 MHz, -6 dB bandwidth 5.5-15.5 MHz, diameter=3 mm;Panametrics XMS-310, Panametrics Inc., Waltham, MA, USA) mounted on thetip of a commercial arthroscopic indentation instrument (Artscan 200, Artscan Oy,Helsinki, Finland). This instrument enabled simultaneous measurements of cartilagethickness, deformation and applied stress during indentation test.
Dynamic modulus of the samples was quantified with the ultrasound indentationinstrument by generating manually two series of instantaneous compressions on thesample (215 kPa prestress followed by a compressive strain of 4 %). The finaldynamic modulus was obtained as a mean of these two measurements. Thicknessand deformation of the samples were determined by the time of flight principle usinga predefined speed of sound (1627 m/s as measured for the mean ultrasound speedin the bovine cartilage [123]). The dynamic modulus of the samples was calculatedusing the linear elastic model (see Section 4.3.1) by assuming tissue incompressibility(ν = 0.5).
In addition to dynamic measurements, long-term creep measurements were con-ducted for four representative samples at different histological stages of degenera-tion. The protocol for the manual creep measurements consisted of a 1 N (141 kPa)pre-stress for 5 seconds, followed by the test load to induce instantaneously a 4 %strain. The subsequent creep was registered for 20 seconds. The creep rate (kcreep),defined as the slope of indentation compliance (C) vs. logarithmic time (C = in-dentation strain-to-stress ratio, i.e. C = ǫ/σ), was calculated in order to evaluatethe time-dependent behaviour of the tissue.
For the determination of the ultrasound flight time, i.e. time between the carti-lage surface and the subchondral bone, the Hilbert envelope was calculated for thereflected ultrasound signal and the envelope was Hamming windowed. The ultra-sound flight time was tracked in real-time from the point of the maximum value ofthe Hamming windowed Hilbert-envelope.
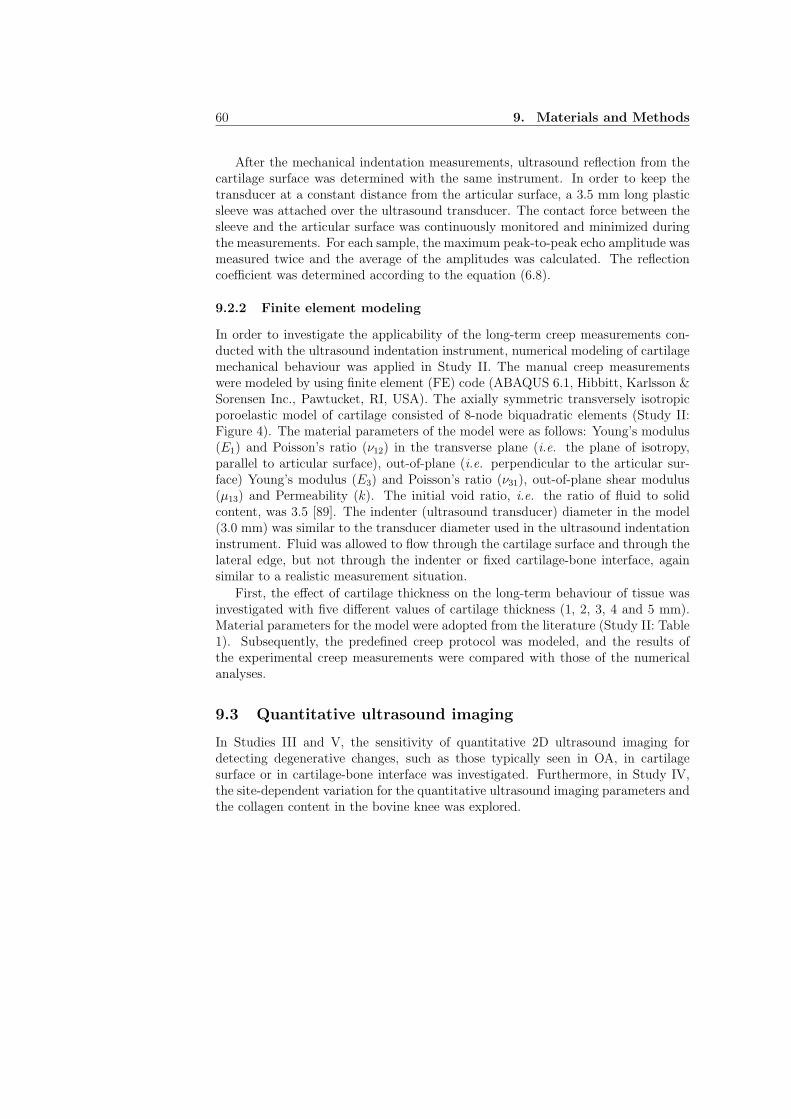
60 9. Materials and Methods
After the mechanical indentation measurements, ultrasound reflection from thecartilage surface was determined with the same instrument. In order to keep thetransducer at a constant distance from the articular surface, a 3.5 mm long plasticsleeve was attached over the ultrasound transducer. The contact force between thesleeve and the articular surface was continuously monitored and minimized duringthe measurements. For each sample, the maximum peak-to-peak echo amplitude wasmeasured twice and the average of the amplitudes was calculated. The reflectioncoefficient was determined according to the equation (6.8).
9.2.2 Finite element modeling
In order to investigate the applicability of the long-term creep measurements con-ducted with the ultrasound indentation instrument, numerical modeling of cartilagemechanical behaviour was applied in Study II. The manual creep measurementswere modeled by using finite element (FE) code (ABAQUS 6.1, Hibbitt, Karlsson &Sorensen Inc., Pawtucket, RI, USA). The axially symmetric transversely isotropicporoelastic model of cartilage consisted of 8-node biquadratic elements (Study II:Figure 4). The material parameters of the model were as follows: Young’s modulus(E1) and Poisson’s ratio (ν12) in the transverse plane (i.e. the plane of isotropy,parallel to articular surface), out-of-plane (i.e. perpendicular to the articular sur-face) Young’s modulus (E3) and Poisson’s ratio (ν31), out-of-plane shear modulus(µ13) and Permeability (k). The initial void ratio, i.e. the ratio of fluid to solidcontent, was 3.5 [89]. The indenter (ultrasound transducer) diameter in the model(3.0 mm) was similar to the transducer diameter used in the ultrasound indentationinstrument. Fluid was allowed to flow through the cartilage surface and through thelateral edge, but not through the indenter or fixed cartilage-bone interface, againsimilar to a realistic measurement situation.
First, the effect of cartilage thickness on the long-term behaviour of tissue wasinvestigated with five different values of cartilage thickness (1, 2, 3, 4 and 5 mm).Material parameters for the model were adopted from the literature (Study II: Table1). Subsequently, the predefined creep protocol was modeled, and the results ofthe experimental creep measurements were compared with those of the numericalanalyses.
9.3 Quantitative ultrasound imaging
In Studies III and V, the sensitivity of quantitative 2D ultrasound imaging fordetecting degenerative changes, such as those typically seen in OA, in cartilagesurface or in cartilage-bone interface was investigated. Furthermore, in Study IV,the site-dependent variation for the quantitative ultrasound imaging parameters andthe collagen content in the bovine knee was explored.
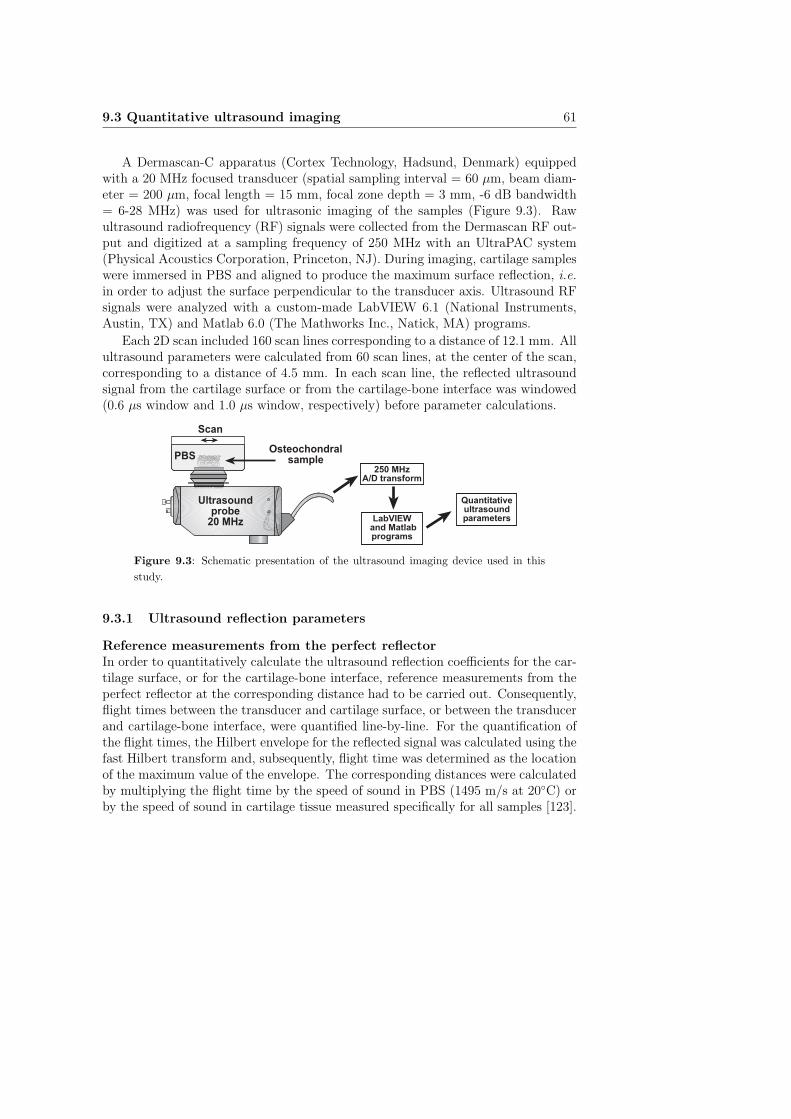
9.3 Quantitative ultrasound imaging 61
A Dermascan-C apparatus (Cortex Technology, Hadsund, Denmark) equippedwith a 20 MHz focused transducer (spatial sampling interval = 60 µm, beam diam-eter = 200 µm, focal length = 15 mm, focal zone depth = 3 mm, -6 dB bandwidth= 6-28 MHz) was used for ultrasonic imaging of the samples (Figure 9.3). Rawultrasound radiofrequency (RF) signals were collected from the Dermascan RF out-put and digitized at a sampling frequency of 250 MHz with an UltraPAC system(Physical Acoustics Corporation, Princeton, NJ). During imaging, cartilage sampleswere immersed in PBS and aligned to produce the maximum surface reflection, i.e.
in order to adjust the surface perpendicular to the transducer axis. Ultrasound RFsignals were analyzed with a custom-made LabVIEW 6.1 (National Instruments,Austin, TX) and Matlab 6.0 (The Mathworks Inc., Natick, MA) programs.
Each 2D scan included 160 scan lines corresponding to a distance of 12.1 mm. Allultrasound parameters were calculated from 60 scan lines, at the center of the scan,corresponding to a distance of 4.5 mm. In each scan line, the reflected ultrasoundsignal from the cartilage surface or from the cartilage-bone interface was windowed(0.6 µs window and 1.0 µs window, respectively) before parameter calculations.
Ultrasoundprobe
20 MHz
PBSOsteochondral
sample
Scan
250 MHzA/D transform
LabVIEW and Matlabprograms
Quantitativeultrasoundparameters
Figure 9.3: Schematic presentation of the ultrasound imaging device used in this
study.
9.3.1 Ultrasound reflection parameters
Reference measurements from the perfect reflectorIn order to quantitatively calculate the ultrasound reflection coefficients for the car-tilage surface, or for the cartilage-bone interface, reference measurements from theperfect reflector at the corresponding distance had to be carried out. Consequently,flight times between the transducer and cartilage surface, or between the transducerand cartilage-bone interface, were quantified line-by-line. For the quantification ofthe flight times, the Hilbert envelope for the reflected signal was calculated using thefast Hilbert transform and, subsequently, flight time was determined as the locationof the maximum value of the envelope. The corresponding distances were calculatedby multiplying the flight time by the speed of sound in PBS (1495 m/s at 20◦C) orby the speed of sound in cartilage tissue measured specifically for all samples [123].
62 9. Materials and Methods
Subsequently, these distance data were used for the normalization with the referencemeasurement from the PBS-air interface at the same distance.
Measurements of the reflected amplitude and amplitude spectrum from the PBS-air interface were conducted at 10 different distances covering the whole distancerange of the cartilage measurements. The measured reference signals were processedboth in the time domain and in the frequency domain. At first, peak-to-peak ampli-tudes of the reflected signal were calculated for all 10 distances, and an exponentialfunction was fitted to the measured amplitude-distance data. Consequently, theamplitude at any arbitrary distance could be determined from the exponential fit.The amplitude spectra of the reflected signals from the PBS-air interfaces (at 10distances) were obtained as absolute values of FFT. Furthermore, spline interpola-tion, included in LabVIEW software, was applied for the determination of amplitudespectra at any arbitrary transducer-cartilage distance. These reference data wereused in the calculation of ultrasound reflection parameters for the cartilage surfaceor for the cartilage-bone interface.
Ultrasound reflection coefficientsTime domain ultrasound reflection coefficients for the cartilage surface (R, %) andfor the cartilage-bone interface (Rbone, %) were calculated as follows (compare withequation (6.8)):
Rx =1
m
m∑
i=1
Ai
Arefi
· 100%, (9.1)
where m is the number of scan lines (m = 60), Ai is the reflected peak-to-peakamplitude from the PBS-cartilage or the cartilage-bone interface in scan line i andAref
i is the reference peak-to-peak amplitude measured from the PBS-air interface(i.e. the perfect reflector) at the same distance as Ai.
The integrated frequency domain reflection coefficients for the cartilage surface(IRC, dB) and for the cartilage-bone interface (IRCbone, dB) were calculated ac-cording to equation 6.7, in which ∆f is 8-20 MHz and 5-12 MHz for PBS-cartilage in-terface and cartilage-bone interface, respectively. The lower bandwidth for IRCbone
is due to the increased attenuation effect for higher frequencies by the overlyingcartilage layer.
In the determination of ultrasound reflection coefficients for the cartilage-boneinterface (Rbone and IRCbone), sample specific sound reflection at the cartilage surface(R and IRC) and ultrasound attenuation in the overlying cartilage, measured in anearlier study with the same samples [96], were taken into account.
9.3.2 Ultrasound Roughness Index
The microtopography of the cartilage surface was quantified by introducing a novelultrasound parameter, Ultrasound Roughness Index (URI, µm). URI was deter-
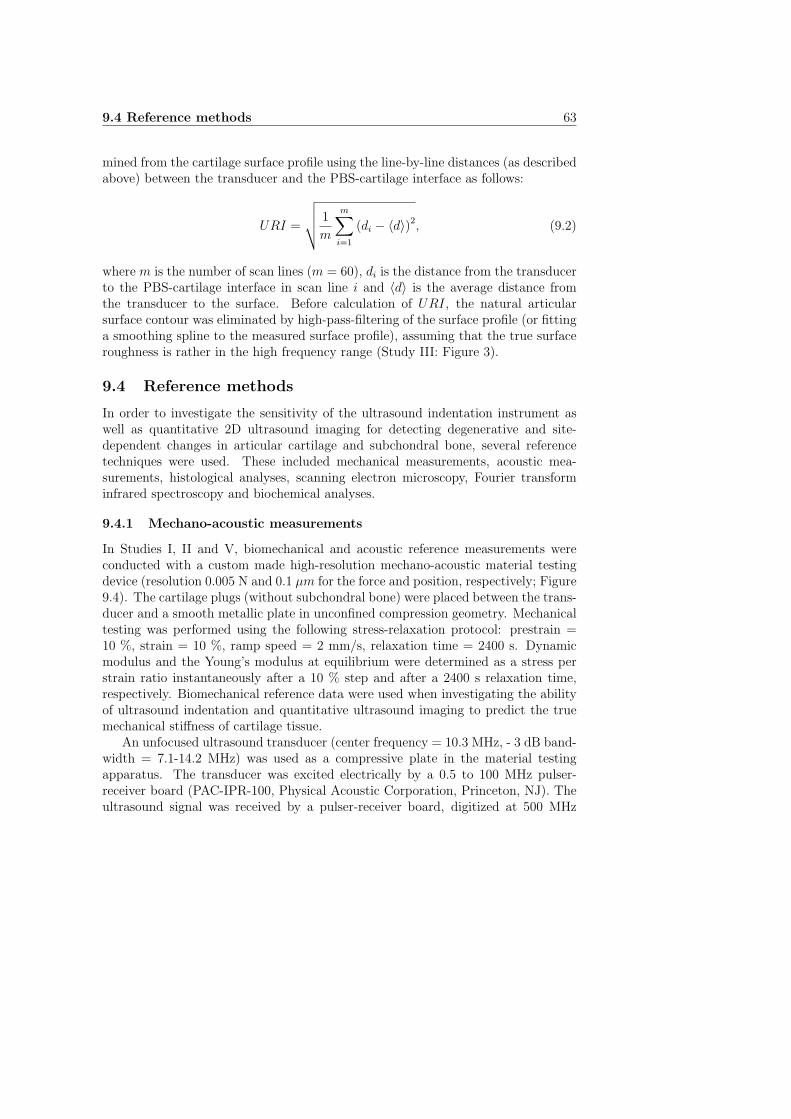
9.4 Reference methods 63
mined from the cartilage surface profile using the line-by-line distances (as describedabove) between the transducer and the PBS-cartilage interface as follows:
URI =
√
√
√
√
1
m
m∑
i=1
(di − 〈d〉)2, (9.2)
where m is the number of scan lines (m = 60), di is the distance from the transducerto the PBS-cartilage interface in scan line i and 〈d〉 is the average distance fromthe transducer to the surface. Before calculation of URI, the natural articularsurface contour was eliminated by high-pass-filtering of the surface profile (or fittinga smoothing spline to the measured surface profile), assuming that the true surfaceroughness is rather in the high frequency range (Study III: Figure 3).
9.4 Reference methods
In order to investigate the sensitivity of the ultrasound indentation instrument aswell as quantitative 2D ultrasound imaging for detecting degenerative and site-dependent changes in articular cartilage and subchondral bone, several referencetechniques were used. These included mechanical measurements, acoustic mea-surements, histological analyses, scanning electron microscopy, Fourier transforminfrared spectroscopy and biochemical analyses.
9.4.1 Mechano-acoustic measurements
In Studies I, II and V, biomechanical and acoustic reference measurements wereconducted with a custom made high-resolution mechano-acoustic material testingdevice (resolution 0.005 N and 0.1 µm for the force and position, respectively; Figure9.4). The cartilage plugs (without subchondral bone) were placed between the trans-ducer and a smooth metallic plate in unconfined compression geometry. Mechanicaltesting was performed using the following stress-relaxation protocol: prestrain =10 %, strain = 10 %, ramp speed = 2 mm/s, relaxation time = 2400 s. Dynamicmodulus and the Young’s modulus at equilibrium were determined as a stress perstrain ratio instantaneously after a 10 % step and after a 2400 s relaxation time,respectively. Biomechanical reference data were used when investigating the abilityof ultrasound indentation and quantitative ultrasound imaging to predict the truemechanical stiffness of cartilage tissue.
An unfocused ultrasound transducer (center frequency = 10.3 MHz, - 3 dB band-width = 7.1-14.2 MHz) was used as a compressive plate in the material testingapparatus. The transducer was excited electrically by a 0.5 to 100 MHz pulser-receiver board (PAC-IPR-100, Physical Acoustic Corporation, Princeton, NJ). Theultrasound signal was received by a pulser-receiver board, digitized at 500 MHz
64 9. Materials and Methods
by an 8-bit A/D-board (PAC-AD-500, Physical Acoustic Corporation) and storedfor later analysis. Acoustic reference measurements included the determination ofattenuation and speed of sound [96, 123] in cartilage tissue.
Cartilagesample
Saline solution
High-precisionactuator (0.1 mm)
High-precisionload-cell (0.005 N)
Ultrasoundtransducer
Figure 9.4: Schematic presentation of the high-resolution material testing device
equipped with the ultrasound transducer. The transducer is in direct contact with the
cartilage sample without the subchondral bone. The cartilage sample is compressed
to a predefined strain and the force by which the tissue resists the deformation is
measured simultaneously as the ultrasound signal is collected. With this configura-
tion, in addition to the mechanical parameters, the speed of sound and attenuation
in the tissue can be determined.
9.4.2 Histological and biochemical analyses
In Studies I, II and V, the histological degenerative grade of the samples was obtainedwith a semi-quantitative histological-histochemical grading system, i.e. Mankinscoring system [84]. Using the Mankin score, it is possible to identify different stagesof cartilage degeneration by evaluating cartilage structure, cell alterations, safranin-O staining (glycosaminoglycan content) and tidemark integrity (Study I: Table 1).Before evaluation, the samples were randomized and blind-coded. Evaluation wasconducted by three investigators and the final Mankin score was obtained as a meanvalue. In Study V, after histological evaluation, the samples were divided into twogroups according to their Mankin score: intact (Mankin score = 0, n = 11) anddegenerated (Mankin score = 1-10, n = 21).
Biochemical analyses, i.e. water content and uronic acid content, of the cartilagesamples were conducted as described in Study I. The uronic acid content is anindicator of the tissue proteoglycan content [19].
9.4.3 Scanning electron microscopy (SEM)
In Studies III, IV and V, scanning electron microscopy (Philips XL30 ESEM, FeiCo., Eindhoven, Netherlands) was conducted in order to qualitatively visualize thesurface structure of normal and degenerated cartilage tissue, and to compare SEM
9.5 Statistical analyses 65
results to those obtained with quantitative ultrasound imaging.In Study III, a qualitative comparison of normal and mechanically or enzymat-
ically degraded samples (n=8) was conducted with SEM. One sample was selectedfrom each group (i.e., paper-60, paper-120, paper-240, paper-360, collagenase, trypsin
and chondroitinase ABC ). Furthermore, one intact (control) sample without any ex-perimental treatment was selected for SEM evaluation. In Study III, SEM imagesof articular surface were obtained at a magnification of ×100.
In Study IV, SEM imaging was conducted to visualize the site-specific differencesin the structure of the cartilage surface at medial tibial plateau (MTP) and lateralupper quadrant of patella (PAT). In Study IV, SEM images of articular surface wereobtained at a magnification of ×1000.
In Study V, SEM imaging of articular surface was conducted for two represen-tative samples. The main aim was to visualize the difference in cartilage surfaceroughness between a histologically normal sample (Mankin score = 0) and a sampleshowing histological signs of early degeneration (Mankin score = 2). From the clin-ical point of view, there is no difference in surface roughness of these samples whichcan be visually observed, e.g., during arthroscopic examination, but a differencemay be determined with SEM or ultrasound imaging.
9.4.4 Fourier transform infrared spectroscopy (FT-IRIS)
In Study IV, the superficial collagen content of the cartilage samples was determinedby using the FT-IRIS technique (Perkin Elmer Spotlight 300, Perkin Elmer, Shel-ton, CO, USA) [25, 105, 111]. After the sample processing (see Study IV for moredetails) for FT-IRIS measurements, proteoglycans were removed from the sampleswith hyaluronidase treatment. Subsequently, three sections per sample were trans-ferred onto 2 mm thick ZnSe windows and the FT-IRIS-analyses were conducted asa mean of these three sections. The analysis was limited to the first 100 µm layerof the cartilage surface and the area of the amide I absorption peak (wavenumbers1710-1610 cm−1 with a resolution of 8 cm−1) was used to indicate the collagen con-tent of the sample. In the lateral direction, the mean (±SD) analysis length was2347 (±443) µm per sample.
9.5 Statistical analyses
The intention of statistical correlation analyses was to reveal the linear relation-ships between measured variables. In all studies, Spearman’s correlation coefficient(rs) was calculated for the comparison of non-continuous variables (Mankin score),whereas Pearson’s correlation coefficient (r) was determined when comparing contin-uous parameters. The statistical difference between two correlation coefficients wastested by calculating the Fisher Z-transform for both coefficients and, subsequently,evaluating the difference between transformed, normally distributed coefficients.
66 9. Materials and Methods
In Study I, the non-parametric Kruskall-Wallis H and post-hoc tests were usedto reveal whether ultrasound indentation measurements could discern between thevisually different degenerative grades.
In Study II, the interoperator reproducibility test for the ultrasound indentationinstrument was conducted by three investigators. Intraclass correlation coefficients(Rho and 95 % confidence interval) were calculated for the ultrasound indentationparameters (h, Edyn and R). Visually healthy bovine patellar cartilage samples (n =8) were used for the interoperator reproducibility measurements. The reproducibilityof the instrument was investigated by calculating the coefficient of variation (CV )and the standardized coefficient of variation (sCV ) [17, 42].
In Study III, the non-parametric Wilcoxon signed rank test was applied whenevaluating the statistical significance of the difference in ultrasound parameters mea-sured before and after enzymatic or mechanical degradation. The reproducibility(CV and sCV ) of the quantitative 2D ultrasound imaging parameters was deter-mined by repeating the same measurement three times on eight control samples withrepositioning between successive measurements.
In Study IV, the non-parametric Kruskall-Wallis H test was applied when test-ing the site-dependent variation of the superficial collagen content and ultrasoundimaging parameters of the cartilage surface and of the cartilage-bone interface. TheKruskall-Wallis post-hoc test was used for comparison of the differences in parame-ters between the individual measurement sites.
In Study V, the non-parametric Mann-Whitney U test was used for the evalua-tion of statistical differences between the two sample groups.
In all studies, SPSS 8.0-11.5 (SPSS Inc., Chicago, IL, USA) or Matlab 6.0 (TheMathworks Inc., Natick, MA) software was used for statistical analyses.
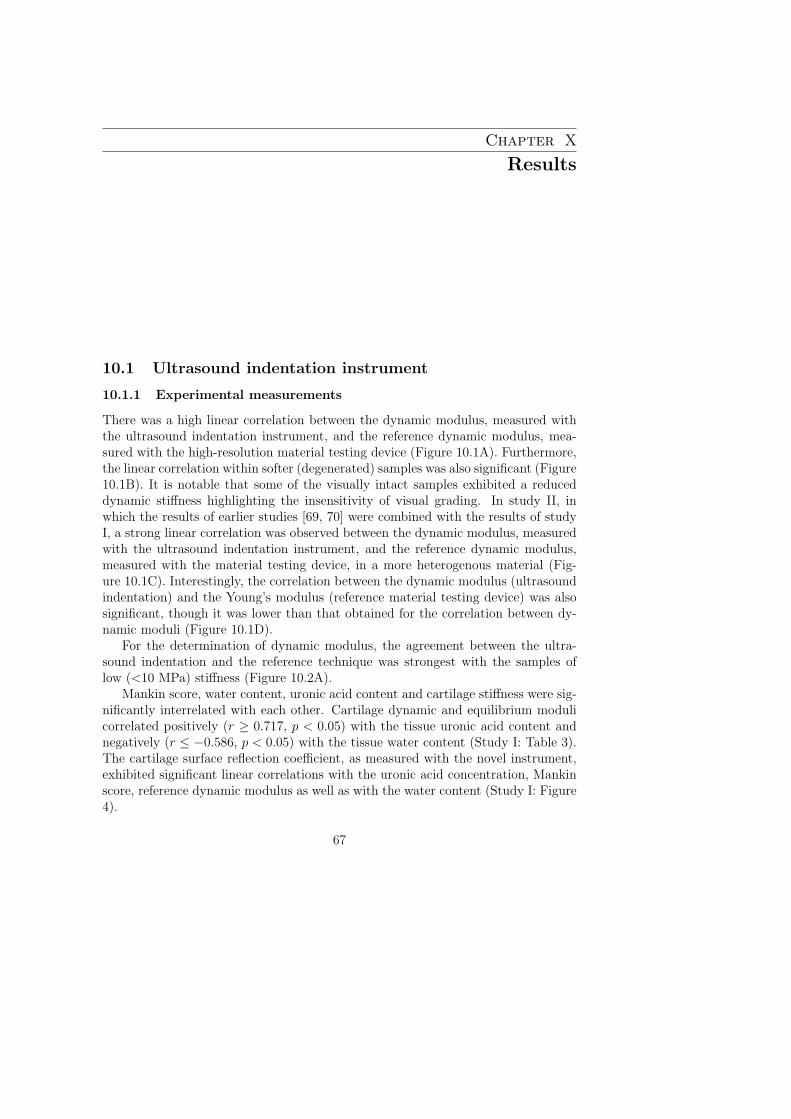
Chapter X
Results
10.1 Ultrasound indentation instrument
10.1.1 Experimental measurements
There was a high linear correlation between the dynamic modulus, measured withthe ultrasound indentation instrument, and the reference dynamic modulus, mea-sured with the high-resolution material testing device (Figure 10.1A). Furthermore,the linear correlation within softer (degenerated) samples was also significant (Figure10.1B). It is notable that some of the visually intact samples exhibited a reduceddynamic stiffness highlighting the insensitivity of visual grading. In study II, inwhich the results of earlier studies [69, 70] were combined with the results of studyI, a strong linear correlation was observed between the dynamic modulus, measuredwith the ultrasound indentation instrument, and the reference dynamic modulus,measured with the material testing device, in a more heterogenous material (Fig-ure 10.1C). Interestingly, the correlation between the dynamic modulus (ultrasoundindentation) and the Young’s modulus (reference material testing device) was alsosignificant, though it was lower than that obtained for the correlation between dy-namic moduli (Figure 10.1D).
For the determination of dynamic modulus, the agreement between the ultra-sound indentation and the reference technique was strongest with the samples oflow (<10 MPa) stiffness (Figure 10.2A).
Mankin score, water content, uronic acid content and cartilage stiffness were sig-nificantly interrelated with each other. Cartilage dynamic and equilibrium modulicorrelated positively (r ≥ 0.717, p < 0.05) with the tissue uronic acid content andnegatively (r ≤ −0.586, p < 0.05) with the tissue water content (Study I: Table 3).The cartilage surface reflection coefficient, as measured with the novel instrument,exhibited significant linear correlations with the uronic acid concentration, Mankinscore, reference dynamic modulus as well as with the water content (Study I: Figure4).
67
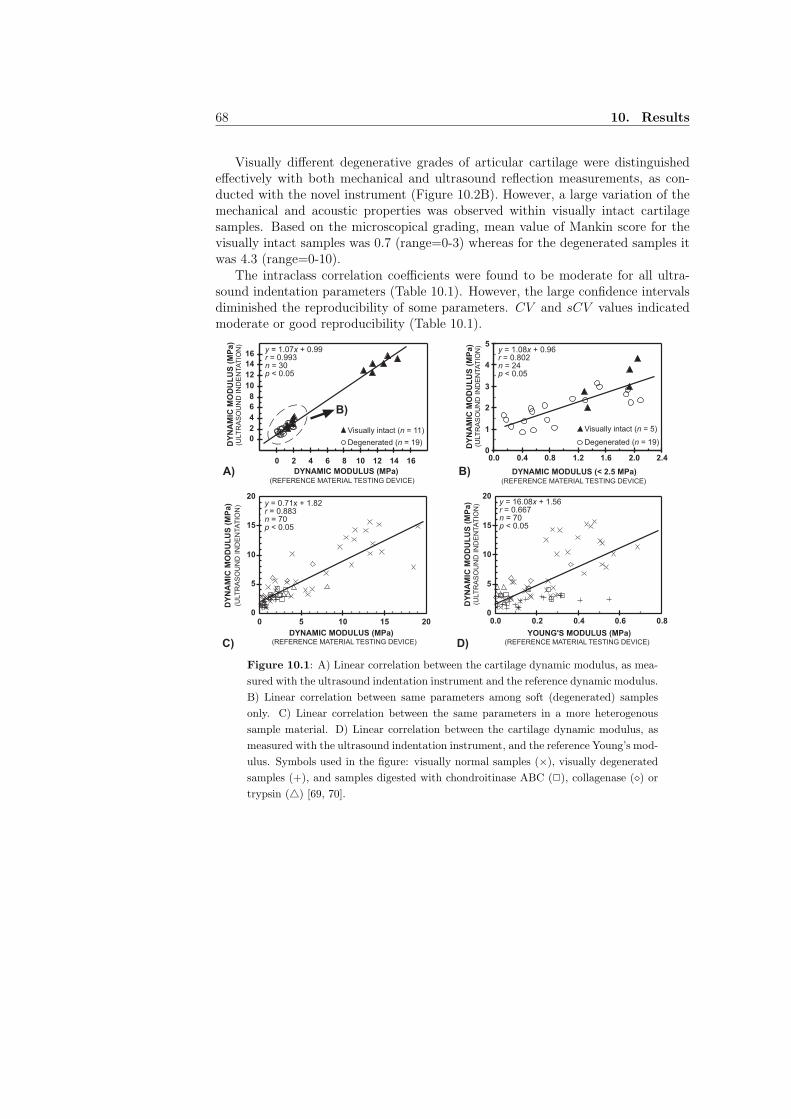
68 10. Results
Visually different degenerative grades of articular cartilage were distinguishedeffectively with both mechanical and ultrasound reflection measurements, as con-ducted with the novel instrument (Figure 10.2B). However, a large variation of themechanical and acoustic properties was observed within visually intact cartilagesamples. Based on the microscopical grading, mean value of Mankin score for thevisually intact samples was 0.7 (range=0-3) whereas for the degenerated samples itwas 4.3 (range=0-10).
The intraclass correlation coefficients were found to be moderate for all ultra-sound indentation parameters (Table 10.1). However, the large confidence intervalsdiminished the reproducibility of some parameters. CV and sCV values indicatedmoderate or good reproducibility (Table 10.1).
2
0
A) B)
0
2
4
6
8
10
12
14
16
0 2 4 6 8 10 12 14 16
DYNAMIC MODULUS (MPa)(REFERENCE MATERIAL TESTING DEVICE)
1
3
4
5
0.0 0.4 0.8 1.2 1.6 2.0 2.4
DYNAMIC MODULUS (< 2.5 MPa)(REFERENCE MATERIAL TESTING DEVICE)
DY
NA
MIC
MO
DU
LU
S (
MP
a)
(ULT
RA
SO
UN
D IN
DE
NTA
TIO
N)
DY
NA
MIC
MO
DU
LU
S (
MP
a)
(ULT
RA
SO
UN
D IN
DE
NTA
TIO
N)
Visually intact (n = 11)
Degenerated (n = 19)
Visually intact (n = 5)
Degenerated (n = 19)
B)
DYNAMIC MODULUS (MPa)(REFERENCE MATERIAL TESTING DEVICE)
DY
NA
MIC
MO
DU
LU
S (
MP
a)
(ULT
RA
SO
UN
D I
ND
EN
TA
TIO
N)
YOUNG'S MODULUS (MPa)(REFERENCE MATERIAL TESTING DEVICE)
DY
NA
MIC
MO
DU
LU
S (
MP
a)
(ULT
RA
SO
UN
D I
ND
EN
TA
TIO
N)
C) D)
0
5
10
15
20
0 5 10 15 200
5
10
15
20
0.0 0.2 0.4 0.6 0.8
y = 1.07x + 0.99r = 0.993n = 30p < 0.05
y = 1.08x + 0.96r = 0.802n = 24p < 0.05
y = 0.71x + 1.82r = 0.883n = 70p < 0.05
y = 16.08x + 1.56r = 0.667n = 70p < 0.05
Figure 10.1: A) Linear correlation between the cartilage dynamic modulus, as mea-
sured with the ultrasound indentation instrument and the reference dynamic modulus.
B) Linear correlation between same parameters among soft (degenerated) samples
only. C) Linear correlation between the same parameters in a more heterogenous
sample material. D) Linear correlation between the cartilage dynamic modulus, as
measured with the ultrasound indentation instrument, and the reference Young’s mod-
ulus. Symbols used in the figure: visually normal samples (×), visually degenerated
samples (+), and samples digested with chondroitinase ABC (2), collagenase (⋄) or
trypsin (△) [69, 70].
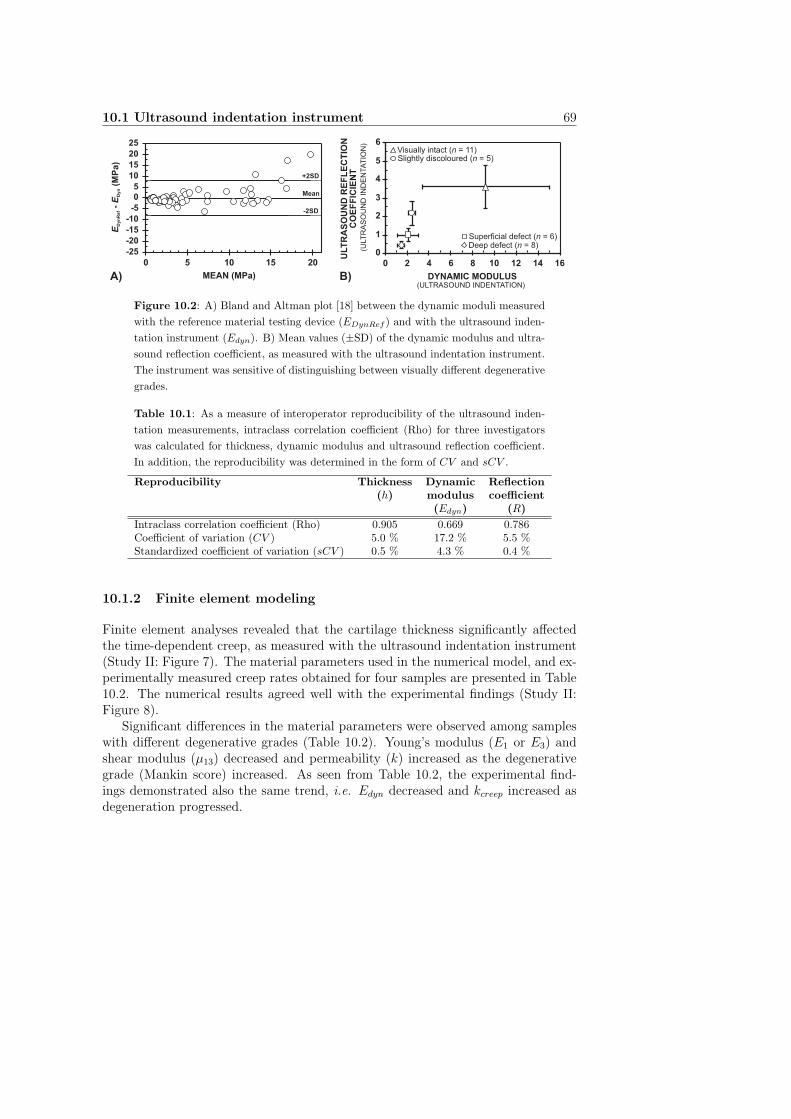
10.1 Ultrasound indentation instrument 69
0
1
2
3
4
5
6
0 2 4 6 8 10 12 14 16
DYNAMIC MODULUS(ULTRASOUND INDENTATION)
(ULT
RA
SO
UN
D IN
DE
NTA
TIO
N)
ULT
RA
SO
UN
D R
EF
LE
CT
ION
CO
EF
FIC
IEN
T
Visually intact (n = 11)Slightly discoloured (n = 5)
Superficial defect (n = 6)Deep defect (n = 8)
A) B)
-25
-20
-15
-10
-5
0
5
10
15
20
25
0 5 10 15 20
MEAN (MPa)
ED
yn
Ref -
ED
yn (
MP
a)
-2SD
Mean
+2SD
Figure 10.2: A) Bland and Altman plot [18] between the dynamic moduli measured
with the reference material testing device (EDynRef ) and with the ultrasound inden-
tation instrument (Edyn). B) Mean values (±SD) of the dynamic modulus and ultra-
sound reflection coefficient, as measured with the ultrasound indentation instrument.
The instrument was sensitive of distinguishing between visually different degenerative
grades.
Table 10.1: As a measure of interoperator reproducibility of the ultrasound inden-
tation measurements, intraclass correlation coefficient (Rho) for three investigators
was calculated for thickness, dynamic modulus and ultrasound reflection coefficient.
In addition, the reproducibility was determined in the form of CV and sCV .
Reproducibility Thickness Dynamic Reflection(h) modulus coefficient
(Edyn) (R)
Intraclass correlation coefficient (Rho) 0.905 0.669 0.786Coefficient of variation (CV ) 5.0 % 17.2 % 5.5 %Standardized coefficient of variation (sCV ) 0.5 % 4.3 % 0.4 %
10.1.2 Finite element modeling
Finite element analyses revealed that the cartilage thickness significantly affectedthe time-dependent creep, as measured with the ultrasound indentation instrument(Study II: Figure 7). The material parameters used in the numerical model, and ex-perimentally measured creep rates obtained for four samples are presented in Table10.2. The numerical results agreed well with the experimental findings (Study II:Figure 8).
Significant differences in the material parameters were observed among sampleswith different degenerative grades (Table 10.2). Young’s modulus (E1 or E3) andshear modulus (µ13) decreased and permeability (k) increased as the degenerativegrade (Mankin score) increased. As seen from Table 10.2, the experimental find-ings demonstrated also the same trend, i.e. Edyn decreased and kcreep increased asdegeneration progressed.
70 10. Results
Table 10.2: Material parameters for the transversely isotropic poroelastic finite ele-
ment model of articular cartilage and experimentally determined parameters. Numer.
and Experim. refer to numerical and experimental results, respectively.
Numer. Numer. Numer. Numer. Numer. Numer. Experim. Experim. Experim.
E1 E3 ν31 ν12 µ13 k × 10−15 Edyn kcreep MS(MPa) (MPa) (MPa) (m4/Ns) (MPa) (1/kPa)
Sample 1 16.0 0.44 0.0 0.5 3.20 1.2 15.23 11 0Sample 2 5.5 0.28 0.0 0.5 1.10 1.8 2.36 18 2Sample 3 3.1 0.27 0.0 0.5 0.62 5.1 4.32 32 5Sample 4 0.5 0.03 0.0 0.5 0.10 15.0 1.41 95 10
The explanation of the symbols:E1 and ν12 In-plane Young’s modulus and Poisson’s ratioE3 and ν31 Out-of-plane Young’s modulus and Poisson’s ratioµ13 Shear modulusk PermeabilityEdyn Dynamic modulus measured with the ultrasound indentation instrumentkcreep Creep rate measured with the ultrasound indentation instrumentMS Histological degenerative grade (Mankin score).
10.2 Relation between cartilage mechanical and acousticproperties
In study II, the relationship between the acoustic and mechanical parameters wasinvestigated in a heterogenous sample material. Significant linear correlations wereestablished between the ultrasound parameters (speed of sound and time domainultrasound reflection coefficient for the surface) and the cartilage reference mechani-cal properties (dynamic modulus and Young’s modulus) (Figure 10.3). The speed ofsound predicted cartilage equilibrium modulus more accurately than the ultrasoundsurface reflection (correlation coefficients was statistically different, p < 0.05). Im-proved correlation was also observed between the speed of sound and the dynamicmodulus (r = 0.730), as compared to that between the ultrasound reflection co-efficient and the dynamic modulus (r = 0.562), although the limit of statisticalsignificance was not reached (p = 0.09).
10.3 Quantitative ultrasound imaging
10.3.1 Enzymatically degraded samples
In enzymatically degraded samples, the values of ultrasound reflection coefficients (Rand IRC) diminished statistically significantly (p < 0.05) after collagenase digestion(Study III: Table 1). Similarly, cartilage surface roughness (URI) increased aftercollagenase digestion (p < 0.05). After chondroitinase ABC or trypsin treatment, nosignificant changes were seen in the ultrasound imaging parameters (Study III: Table1). Typical ultrasound image and ultrasonically determined surface profile beforeand after collagenase digestion are presented in Figure 10.4A. It is notable that,
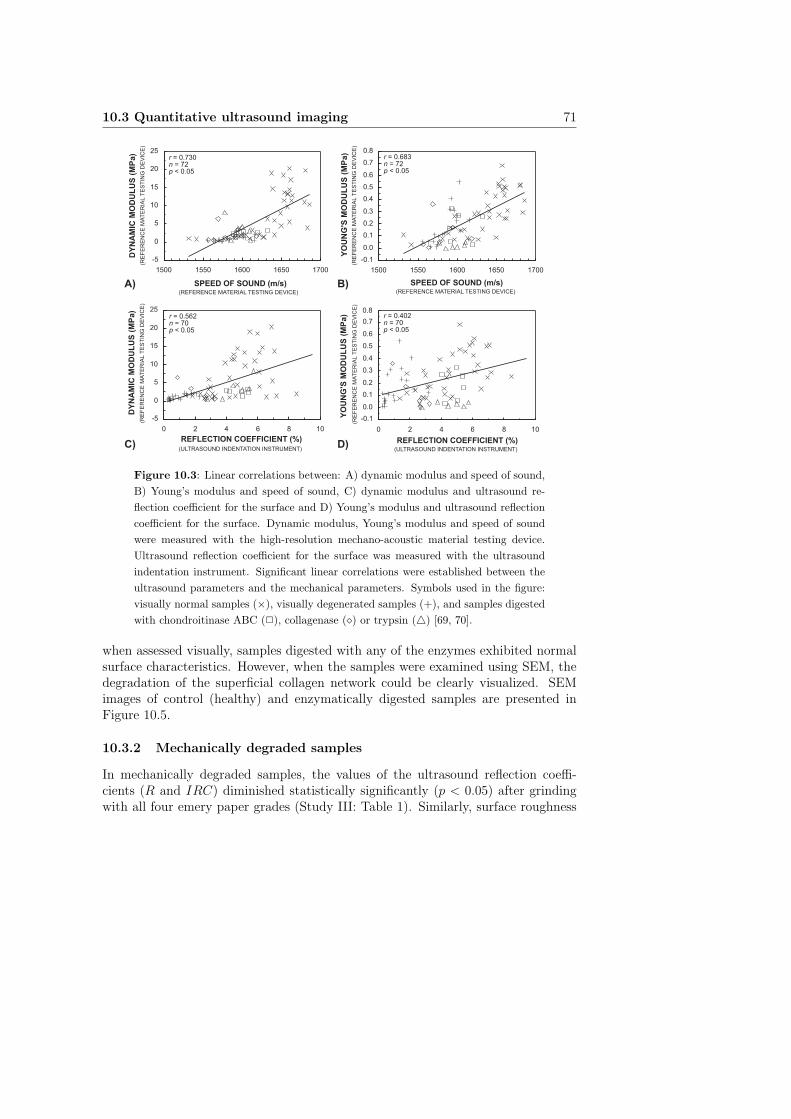
10.3 Quantitative ultrasound imaging 71
A) B)
C) D)
SPEED OF SOUND (m/s)
YO
UN
G'S
MO
DU
LU
S (
MP
a)
DY
NA
MIC
MO
DU
LU
S (
MP
a)
REFLECTION COEFFICIENT (%)
YO
UN
G'S
MO
DU
LU
S (
MP
a)
SPEED OF SOUND (m/s)
DY
NA
MIC
MO
DU
LU
S (
MP
a)
REFLECTION COEFFICIENT (%)
(ULTRASOUND INDENTATION INSTRUMENT)(ULTRASOUND INDENTATION INSTRUMENT)
(REFERENCE MATERIAL TESTING DEVICE)(REFERENCE MATERIAL TESTING DEVICE)
(RE
FE
RE
NC
E M
AT
ER
IAL T
ES
TIN
G D
EV
ICE
)(R
EF
ER
EN
CE
MA
TE
RIA
L T
ES
TIN
G D
EV
ICE
)
(RE
FE
RE
NC
E M
AT
ER
IAL T
ES
TIN
G D
EV
ICE
)(R
EF
ER
EN
CE
MA
TE
RIA
L T
ES
TIN
G D
EV
ICE
)
-0.1
0.0
0.1
0.2
0.3
0.4
0.5
0.6
0.7
0.8
1500 1550 1600 1650 1700
-5
0
5
10
15
20
25
1500 1550 1600 1650 1700
0.0
0.1
0.2
0.3
0.4
0.5
0.6
0.7
0 2 4 6 8 10
0.8
-0.1-5
0
5
10
15
20
25
0 2 4 6 8 10
r = 0.730n = 72p < 0.05
r = 0.683n = 72p < 0.05
r = 0.562n = 70p < 0.05
r = 0.402n = 70p < 0.05
Figure 10.3: Linear correlations between: A) dynamic modulus and speed of sound,
B) Young’s modulus and speed of sound, C) dynamic modulus and ultrasound re-
flection coefficient for the surface and D) Young’s modulus and ultrasound reflection
coefficient for the surface. Dynamic modulus, Young’s modulus and speed of sound
were measured with the high-resolution mechano-acoustic material testing device.
Ultrasound reflection coefficient for the surface was measured with the ultrasound
indentation instrument. Significant linear correlations were established between the
ultrasound parameters and the mechanical parameters. Symbols used in the figure:
visually normal samples (×), visually degenerated samples (+), and samples digested
with chondroitinase ABC (2), collagenase (⋄) or trypsin (△) [69, 70].
when assessed visually, samples digested with any of the enzymes exhibited normalsurface characteristics. However, when the samples were examined using SEM, thedegradation of the superficial collagen network could be clearly visualized. SEMimages of control (healthy) and enzymatically digested samples are presented inFigure 10.5.
10.3.2 Mechanically degraded samples
In mechanically degraded samples, the values of the ultrasound reflection coeffi-cients (R and IRC) diminished statistically significantly (p < 0.05) after grindingwith all four emery paper grades (Study III: Table 1). Similarly, surface roughness
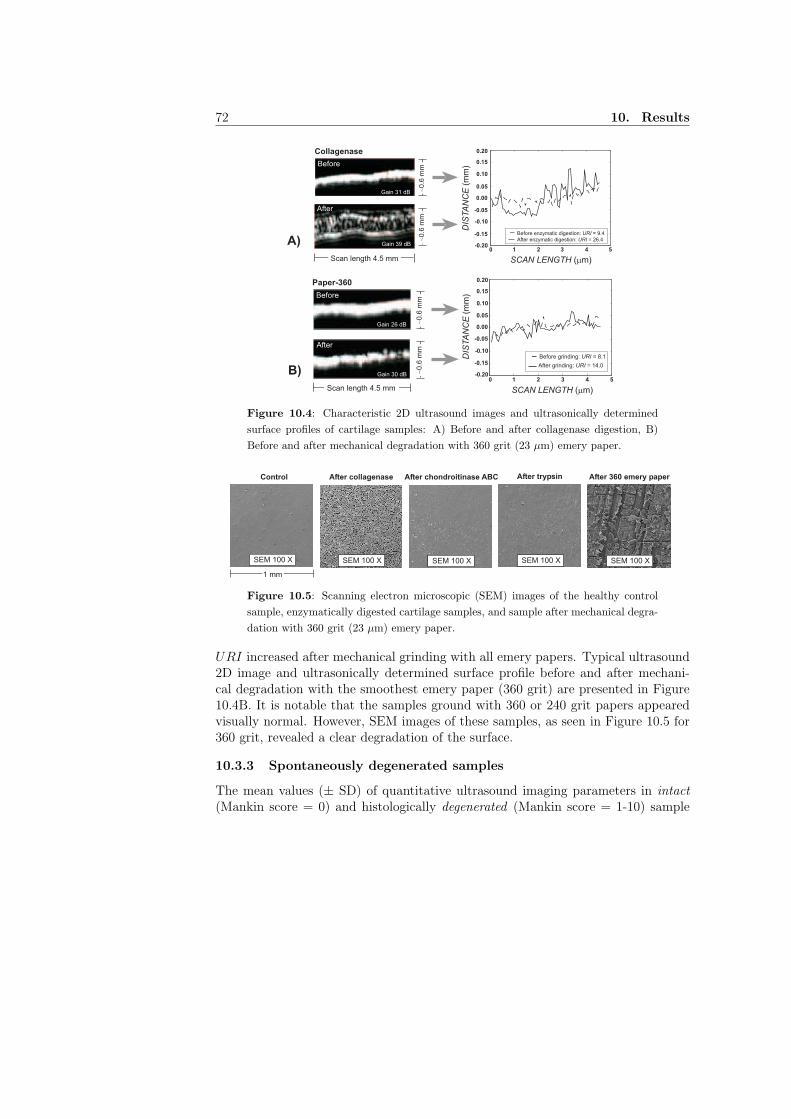
72 10. Results
Collagenase
0 1 2 3 4 5-0.20
-0.15
-0.10
-0.05
0.00
0.05
0.10
0.15
0.20
Before enzymatic digestion: URI = 9.4
After enzymatic digestion: URI = 26.4
Gain 31 dB
Gain 39 dB
~0
.6 m
m~0
.6 m
m
Scan length 4.5 mm
Before
After
SCAN LENGTH (mm)
DIS
TA
NC
E (
mm
)
0 1 2 3 4 5
Paper-360
-0.20
-0.15
-0.10
-0.05
0.00
0.05
0.10
0.15
0.20
Before grinding: URI = 8.1
After grinding: URI = 14.0
Gain 26 dB
Gain 30 dB
~0.6
mm
~0.6
mm
Scan length 4.5 mm
Before
After
SCAN LENGTH (mm)
DIS
TA
NC
E (
mm
)
A)
B)
Figure 10.4: Characteristic 2D ultrasound images and ultrasonically determined
surface profiles of cartilage samples: A) Before and after collagenase digestion, B)
Before and after mechanical degradation with 360 grit (23 µm) emery paper.
Control
1 mm
After collagenase
SEM 100 X SEM 100 X
After chondroitinase ABC
SEM 100 X
After trypsin
SEM 100 X
After 360 emery paper
SEM 100 X
Figure 10.5: Scanning electron microscopic (SEM) images of the healthy control
sample, enzymatically digested cartilage samples, and sample after mechanical degra-
dation with 360 grit (23 µm) emery paper.
URI increased after mechanical grinding with all emery papers. Typical ultrasound2D image and ultrasonically determined surface profile before and after mechani-cal degradation with the smoothest emery paper (360 grit) are presented in Figure10.4B. It is notable that the samples ground with 360 or 240 grit papers appearedvisually normal. However, SEM images of these samples, as seen in Figure 10.5 for360 grit, revealed a clear degradation of the surface.
10.3.3 Spontaneously degenerated samples
The mean values (± SD) of quantitative ultrasound imaging parameters in intact
(Mankin score = 0) and histologically degenerated (Mankin score = 1-10) sample
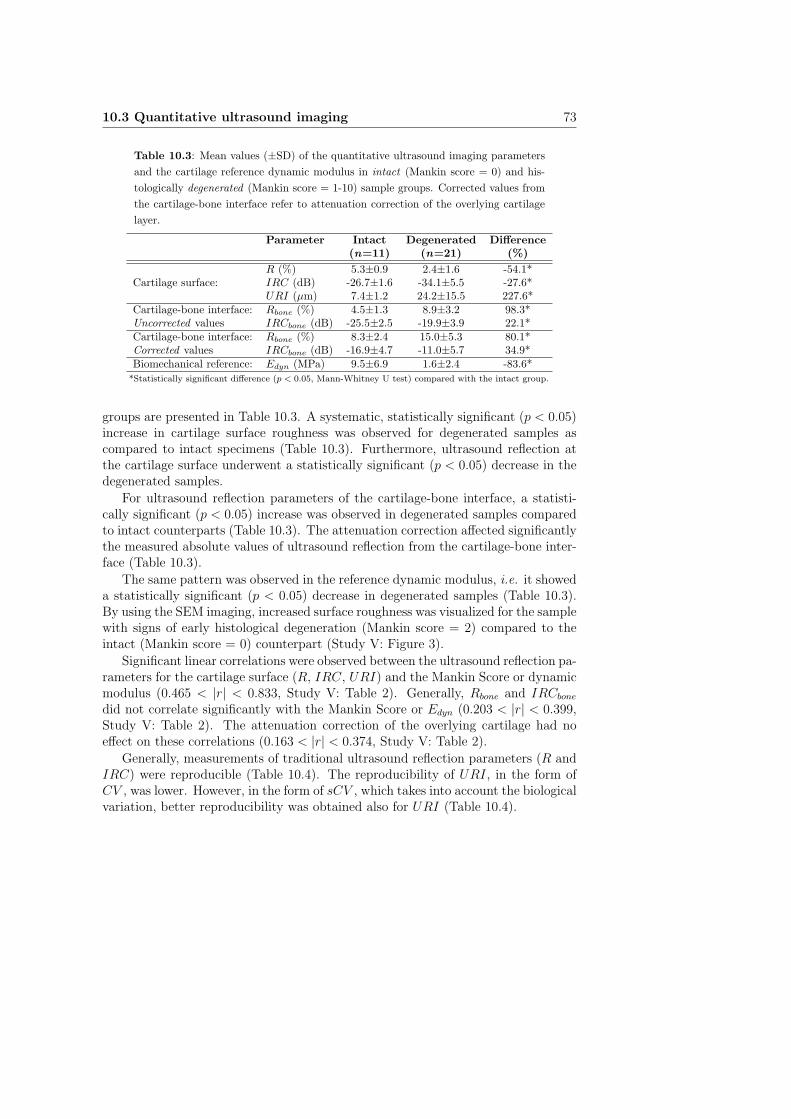
10.3 Quantitative ultrasound imaging 73
Table 10.3: Mean values (±SD) of the quantitative ultrasound imaging parameters
and the cartilage reference dynamic modulus in intact (Mankin score = 0) and his-
tologically degenerated (Mankin score = 1-10) sample groups. Corrected values from
the cartilage-bone interface refer to attenuation correction of the overlying cartilage
layer.
Parameter Intact Degenerated Difference(n=11) (n=21) (%)
R (%) 5.3±0.9 2.4±1.6 -54.1*Cartilage surface: IRC (dB) -26.7±1.6 -34.1±5.5 -27.6*
URI (µm) 7.4±1.2 24.2±15.5 227.6*Cartilage-bone interface: Rbone (%) 4.5±1.3 8.9±3.2 98.3*Uncorrected values IRCbone (dB) -25.5±2.5 -19.9±3.9 22.1*Cartilage-bone interface: Rbone (%) 8.3±2.4 15.0±5.3 80.1*Corrected values IRCbone (dB) -16.9±4.7 -11.0±5.7 34.9*Biomechanical reference: Edyn (MPa) 9.5±6.9 1.6±2.4 -83.6*
*Statistically significant difference (p < 0.05, Mann-Whitney U test) compared with the intact group.
groups are presented in Table 10.3. A systematic, statistically significant (p < 0.05)increase in cartilage surface roughness was observed for degenerated samples ascompared to intact specimens (Table 10.3). Furthermore, ultrasound reflection atthe cartilage surface underwent a statistically significant (p < 0.05) decrease in thedegenerated samples.
For ultrasound reflection parameters of the cartilage-bone interface, a statisti-cally significant (p < 0.05) increase was observed in degenerated samples comparedto intact counterparts (Table 10.3). The attenuation correction affected significantlythe measured absolute values of ultrasound reflection from the cartilage-bone inter-face (Table 10.3).
The same pattern was observed in the reference dynamic modulus, i.e. it showeda statistically significant (p < 0.05) decrease in degenerated samples (Table 10.3).By using the SEM imaging, increased surface roughness was visualized for the samplewith signs of early histological degeneration (Mankin score = 2) compared to theintact (Mankin score = 0) counterpart (Study V: Figure 3).
Significant linear correlations were observed between the ultrasound reflection pa-rameters for the cartilage surface (R, IRC, URI) and the Mankin Score or dynamicmodulus (0.465 < |r| < 0.833, Study V: Table 2). Generally, Rbone and IRCbone
did not correlate significantly with the Mankin Score or Edyn (0.203 < |r| < 0.399,Study V: Table 2). The attenuation correction of the overlying cartilage had noeffect on these correlations (0.163 < |r| < 0.374, Study V: Table 2).
Generally, measurements of traditional ultrasound reflection parameters (R andIRC) were reproducible (Table 10.4). The reproducibility of URI, in the form ofCV , was lower. However, in the form of sCV , which takes into account the biologicalvariation, better reproducibility was obtained also for URI (Table 10.4).
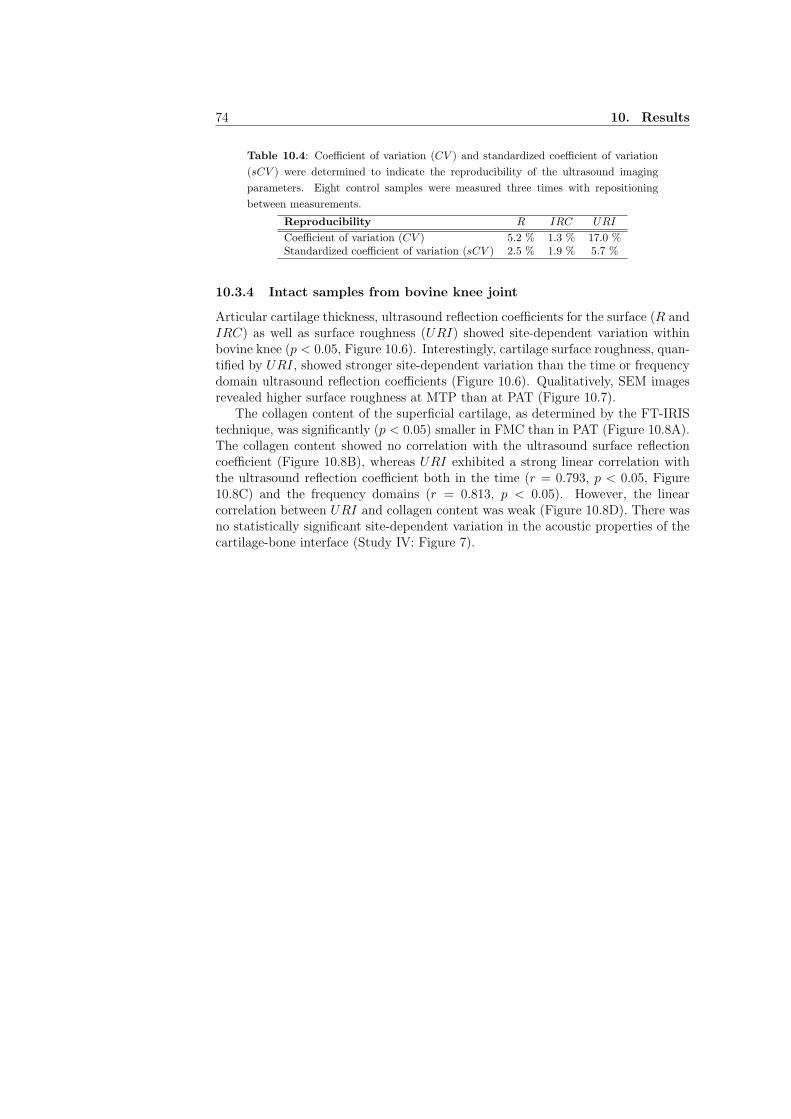
74 10. Results
Table 10.4: Coefficient of variation (CV ) and standardized coefficient of variation
(sCV ) were determined to indicate the reproducibility of the ultrasound imaging
parameters. Eight control samples were measured three times with repositioning
between measurements.
Reproducibility R IRC URI
Coefficient of variation (CV ) 5.2 % 1.3 % 17.0 %Standardized coefficient of variation (sCV ) 2.5 % 1.9 % 5.7 %
10.3.4 Intact samples from bovine knee joint
Articular cartilage thickness, ultrasound reflection coefficients for the surface (R andIRC) as well as surface roughness (URI) showed site-dependent variation withinbovine knee (p < 0.05, Figure 10.6). Interestingly, cartilage surface roughness, quan-tified by URI, showed stronger site-dependent variation than the time or frequencydomain ultrasound reflection coefficients (Figure 10.6). Qualitatively, SEM imagesrevealed higher surface roughness at MTP than at PAT (Figure 10.7).
The collagen content of the superficial cartilage, as determined by the FT-IRIStechnique, was significantly (p < 0.05) smaller in FMC than in PAT (Figure 10.8A).The collagen content showed no correlation with the ultrasound surface reflectioncoefficient (Figure 10.8B), whereas URI exhibited a strong linear correlation withthe ultrasound reflection coefficient both in the time (r = 0.793, p < 0.05, Figure10.8C) and the frequency domains (r = 0.813, p < 0.05). However, the linearcorrelation between URI and collagen content was weak (Figure 10.8D). There wasno statistically significant site-dependent variation in the acoustic properties of thecartilage-bone interface (Study IV: Figure 7).
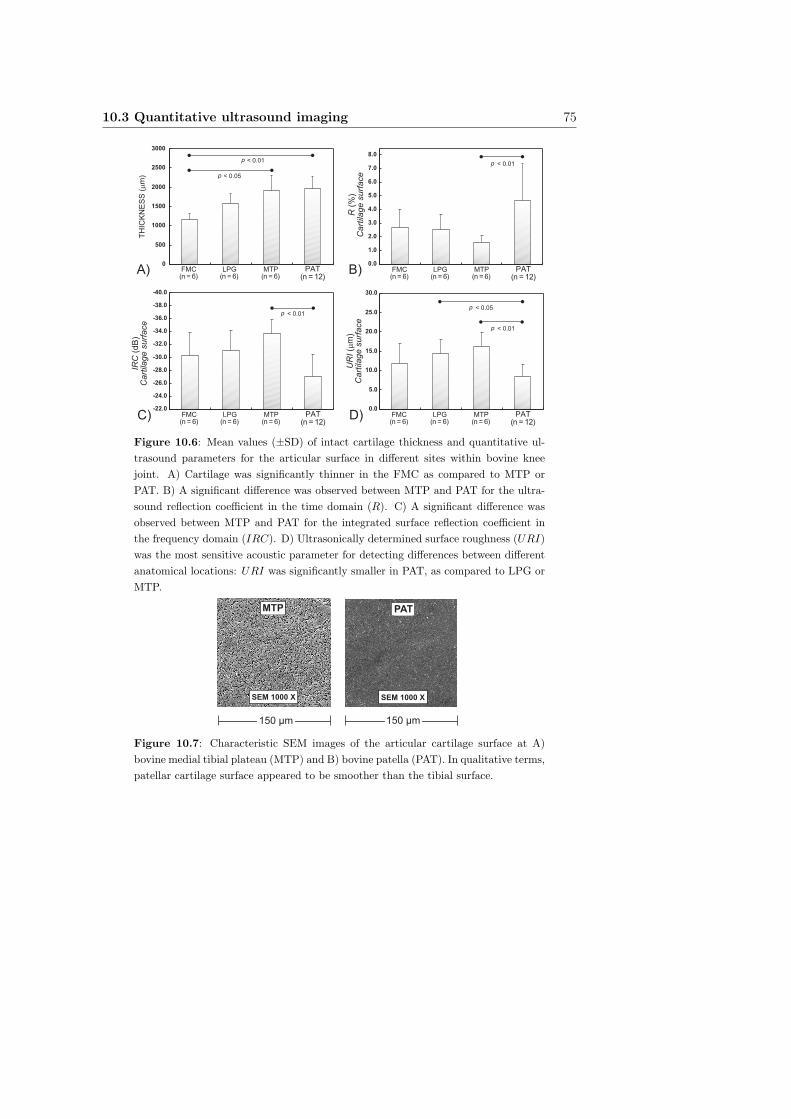
10.3 Quantitative ultrasound imaging 75
0
500
1000
1500
2000
2500
3000
FMC(n = 6)
LPG(n = 6)
MTP(n = 6)
PAT(n = 12)
TH
ICK
NE
SS
(m
m)
p < 0.01
-40.0
-38.0
-36.0
-34.0
-32.0
-30.0
-28.0
-26.0
-24.0
-22.0
p < 0.01
A) B)
C) D)
R (
%)
Cart
ilage s
urf
ace
0.0
5.0
10.0
15.0
20.0
25.0
30.0
0.0
1.0
2.0
3.0
4.0
5.0
6.0
7.0
8.0
p < 0.01
p < 0.01
p < 0.05
p < 0.05
FMC(n = 6)
LPG(n = 6)
MTP(n = 6)
PAT(n = 12)
FMC(n = 6)
LPG(n = 6)
MTP(n = 6)
PAT(n = 12)
FMC(n = 6)
LPG(n = 6)
MTP(n = 6)
PAT(n = 12)
IRC
(dB
)C
art
ilage s
urf
ace
UR
I (m
m)
Cart
ilage s
urf
ace
Figure 10.6: Mean values (±SD) of intact cartilage thickness and quantitative ul-
trasound parameters for the articular surface in different sites within bovine knee
joint. A) Cartilage was significantly thinner in the FMC as compared to MTP or
PAT. B) A significant difference was observed between MTP and PAT for the ultra-
sound reflection coefficient in the time domain (R). C) A significant difference was
observed between MTP and PAT for the integrated surface reflection coefficient in
the frequency domain (IRC). D) Ultrasonically determined surface roughness (URI)
was the most sensitive acoustic parameter for detecting differences between different
anatomical locations: URI was significantly smaller in PAT, as compared to LPG or
MTP.
150 µm
SEM 1000 X SEM 1000 X
PATMTP
150 µm
Figure 10.7: Characteristic SEM images of the articular cartilage surface at A)
bovine medial tibial plateau (MTP) and B) bovine patella (PAT). In qualitative terms,
patellar cartilage surface appeared to be smoother than the tibial surface.
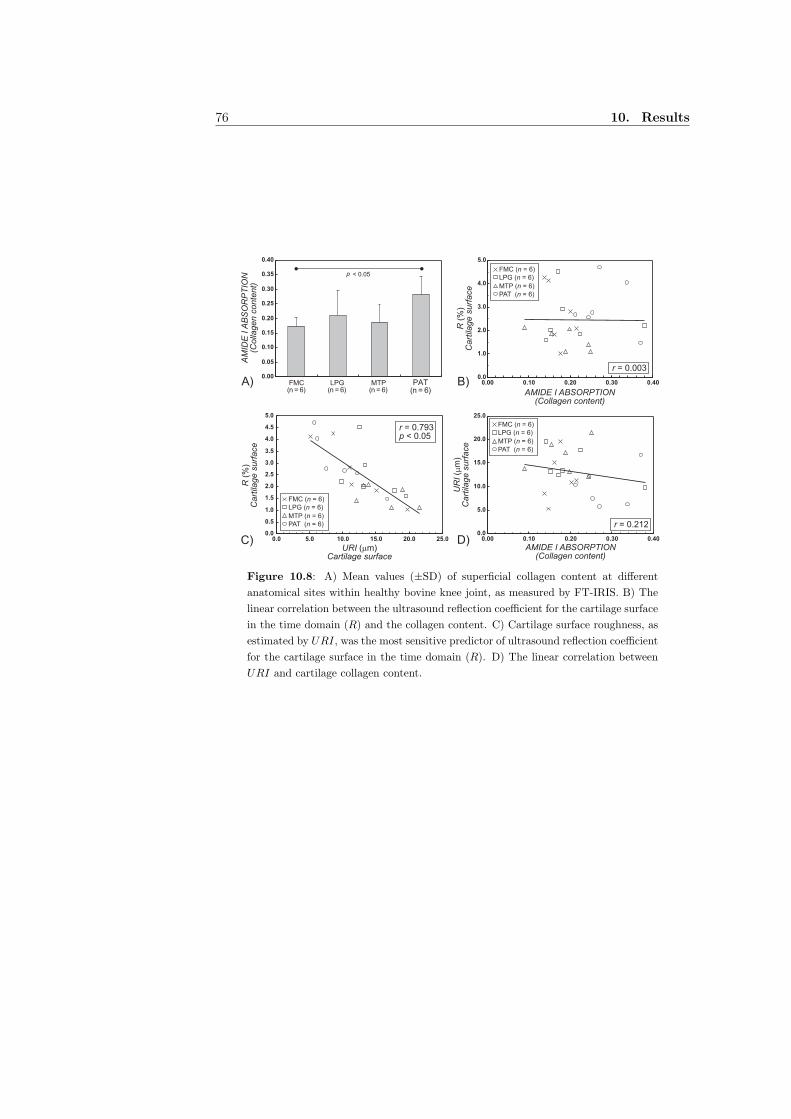
76 10. Results
0.00
0.05
0.10
0.15
0.20
0.25
0.30
0.35
0.40
B)A)
C) D)
0.0
1.0
2.0
3.0
4.0
5.0
0.00 0.10 0.20 0.30 0.40
FMC (n = 6)
LPG (n = 6)
MTP (n = 6)
PAT (n = 6)
p < 0.05
0.0
5.0
10.0
15.0
20.0
25.0
0.00 0.10 0.20 0.30 0.400.0
0.5
1.0
1.5
2.0
2.5
3.0
3.5
4.0
4.5
5.0
0.0 5.0 10.0 15.0 20.0 25.0
FMC(n = 6)
LPG(n = 6)
MTP(n = 6)
PAT(n = 6)
AM
IDE
I A
BS
OR
PT
ION
(Colla
gen c
onte
nt)
R (
%)
Cart
ilage s
urf
ace
r = 0.003
R (
%)
Cart
ilage s
urf
ace
URI (mm)Cartilage surface
UR
I (m
m)
Cart
ilage s
urf
ace
AMIDE I ABSORPTION(Collagen content)
FMC (n = 6)
LPG (n = 6)
MTP (n = 6)
PAT (n = 6)
r = 0.212
FMC (n = 6)
LPG (n = 6)
MTP (n = 6)
PAT (n = 6)
r = 0.793p < 0.05
AMIDE I ABSORPTION(Collagen content)
Figure 10.8: A) Mean values (±SD) of superficial collagen content at different
anatomical sites within healthy bovine knee joint, as measured by FT-IRIS. B) The
linear correlation between the ultrasound reflection coefficient for the cartilage surface
in the time domain (R) and the collagen content. C) Cartilage surface roughness, as
estimated by URI, was the most sensitive predictor of ultrasound reflection coefficient
for the cartilage surface in the time domain (R). D) The linear correlation between
URI and cartilage collagen content.
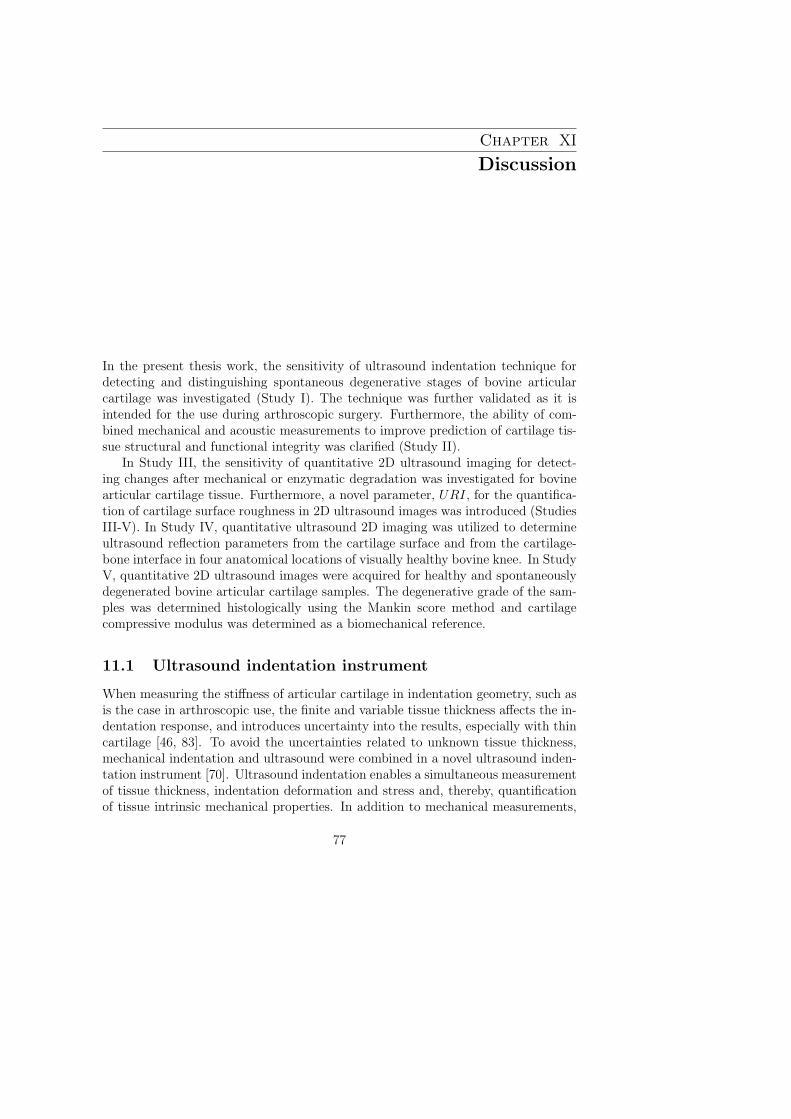
Chapter XI
Discussion
In the present thesis work, the sensitivity of ultrasound indentation technique fordetecting and distinguishing spontaneous degenerative stages of bovine articularcartilage was investigated (Study I). The technique was further validated as it isintended for the use during arthroscopic surgery. Furthermore, the ability of com-bined mechanical and acoustic measurements to improve prediction of cartilage tis-sue structural and functional integrity was clarified (Study II).
In Study III, the sensitivity of quantitative 2D ultrasound imaging for detect-ing changes after mechanical or enzymatic degradation was investigated for bovinearticular cartilage tissue. Furthermore, a novel parameter, URI, for the quantifica-tion of cartilage surface roughness in 2D ultrasound images was introduced (StudiesIII-V). In Study IV, quantitative ultrasound 2D imaging was utilized to determineultrasound reflection parameters from the cartilage surface and from the cartilage-bone interface in four anatomical locations of visually healthy bovine knee. In StudyV, quantitative 2D ultrasound images were acquired for healthy and spontaneouslydegenerated bovine articular cartilage samples. The degenerative grade of the sam-ples was determined histologically using the Mankin score method and cartilagecompressive modulus was determined as a biomechanical reference.
11.1 Ultrasound indentation instrument
When measuring the stiffness of articular cartilage in indentation geometry, such asis the case in arthroscopic use, the finite and variable tissue thickness affects the in-dentation response, and introduces uncertainty into the results, especially with thincartilage [46, 83]. To avoid the uncertainties related to unknown tissue thickness,mechanical indentation and ultrasound were combined in a novel ultrasound inden-tation instrument [70]. Ultrasound indentation enables a simultaneous measurementof tissue thickness, indentation deformation and stress and, thereby, quantificationof tissue intrinsic mechanical properties. In addition to mechanical measurements,
77
78 11. Discussion
ultrasound reflection from the cartilage surface can be determined with the instru-ment. In that way, the ultrasound reflection coefficient for the cartilage surface canbe locally quantified with this novel instrument [70].
In Study I, the dynamic modulus and ultrasound reflection coefficient, both de-termined with the same instrument, were significantly related to tissue water anduronic acid contents, evidence that the technique does provide information aboutthe cartilage composition. However, these associations are probably complex andfollow from the fact that cartilage degeneration is a process in which there are par-allel alterations in proteoglycans, collagen network and tissue water content.
Distinct differences between the visually variable degenerative stages could beobserved with the measurements of dynamic modulus and ultrasound reflection.The extensive variation of acoustic and mechanical properties within visually intactcartilage samples revealed the insensitivity of visual evaluation for assessing carti-lage integrity. This finding was also confirmed by the histological grading (Mankinscore) and the biomechanical reference measurements. Some of the visually intactsamples exhibited signs of early degeneration, such as depletion of proteoglycans inthe superficial tissue, as verified by histological and functional reference measure-ments. In contrast, the ultrasound indentation instrument distinguished the normaland histologically degenerated cartilage from each other. These results suggest thatvisual evaluation, conducted routinely during arthroscopy, is inexact and inadequatefor judging the functional performance of articular cartilage.
In an earlier study, manual creep measurements were conducted with the ul-trasound indentation instrument before and after enzymatic degradation of bovinecartilage samples [70]. It was concluded that the proteoglycan depletion of carti-lage could be determined with creep measurements. In Study II, the suitability ofcreep measurements was further investigated both experimentally and numerically.Poroelastic transversely isotropic FE-model revealed the strong effect of changes inthe values of Young’s moduli, shear modulus and permeability on the creep behav-ior. Importantly, this finding was consistent with the experimental measurementsrevealing a decrease of compressive modulus and an increase of creep rate as thehistological degenerative grade (Mankin score) increased. However, successful man-ual creep measurements with the present instrument require a significant amount ofoperator training. During arthroscopy, all measurements should be conducted withease and also quickly and reproducibly. Therefore, it might be necessary to developthe technique further to facilitate long-term creep measurements in the clinic.
In Study II, a strong linear correlation was observed between the dynamic mod-ulus, measured with the ultrasound indentation instrument, and the reference dy-namic modulus (measured with the high-resolution material testing device) in alarge material (n = 70). Furthermore, the interoperator reproducibility, as well asCV and sCV values, indicated moderate or good reproducibility of the ultrasoundindentation parameters. As the agreement between the ultrasound indentation and
11.2 Relation between cartilage mechanical and acoustic properties 79
the reference technique was best for the samples with low stiffness, the ultrasoundindentation instrument seems to sensitively diagnose early cartilage degeneration.
11.2 Relation between cartilage mechanical and acousticproperties
In Study II, mechano-acoustic techniques were used to characterize the elastic prop-erties of normal and degenerated cartilage in compression. The ability of the acousticparameters, i.e. sound speed and surface reflection, to predict the tissue Young’smodulus and dynamic modulus was experimentally studied. It was demonstratedthat the sound speed was significantly related to the compressive stiffness as well asthe integrity of the tissue. Again, part of these correlations may be secondary, re-flecting the complex degenerative process in cartilage tissue with alterations in tissueconstituents. In the clinical situation, however, designing a simple and easy-to-usetechnique for the thickness measurement, necessary for the determination of soundspeed, may be difficult and threaten successful diagnostic use. In the literature, onetechnique, in situ calibration method, has actually been introduced for this purpose[121]. However, the need for this kind of complex apparatus possibly will limit itswidespread clinical acceptance.
11.3 Quantitative ultrasound imaging
Ultrasound Roughness IndexIn Studies III-V, a novel parameter, ultrasound roughness index (URI), was in-troduced for direct determination of cartilage surface roughness from quantitativeultrasound images. The cartilage surface profile was measured ultrasonically andURI was calculated as the RMS average of deviations from the global surface pro-file. This method is commonly used in material sciences but has not been earlieradapted to the ultrasonic analysis of cartilage surface topography. The contributionof the global shape (contour) of the cartilage surface was eliminated by high-passfiltering or spline interpolation. In Study III, a significant increase in URI wasobtained after mechanical degradation or after collagenase digestion. In Study IV,a significant site-dependent variation was observed for URI within the bovine kneejoint. In Study V, URI was significantly higher in histologically degenerated sam-ples with inferior mechanical properties in comparison to intact specimens.
The calculation of URI from the ultrasound 2D image is based on the mea-surement of ultrasound flight time between the transducer and the PBS-cartilageinterface in each scan line. Due to its apparent simplicity, URI might well be ableto be incorporated into clinical ultrasound devices, and applied for roughness char-acterization of different acoustic interfaces within human tissue.
In contrast to traditional reflection parameters (R and IRC), ultrasound flight
80 11. Discussion
time does not directly depend on the perpendicularity between the ultrasound trans-ducer and the cartilage surface. This may be a major advantage of URI sinceachieving perfect perpendicularity is often challenging with naturally curved articu-lar surfaces. Therefore, URI might be easier to use even in arthroscopic ultrasoundprobes as its calculation requires only the determination of the ultrasound flighttime. However, more theoretical and experimental research is still needed: the ef-fects of ultrasound beam diameter, temporal and spatial sampling frequencies andthe surface inclination need to be investigated.
In a recent study, ultrasound indentation, ultrasound imaging and MRI resultswere compared for diagnosing the histological degenerative changes in bovine car-tilage tissue [62]. The diagnostic potential of URI was highlighted in that study.The combined sensitivity (0.91) and specificity (1.00) were greatest for URI overother novel diagnostic techniques, including MRI and ultrasound indentation withthe novel instrument [62]. The results of that study, along with the present results,suggest that URI, determined with instrumentation that has similar specificationsas the one used in the present study, represents a highly sensitive and promisingultrasound parameter for OA diagnostics.
Ultrasound reflection from the cartilage surfaceIt is generally accepted that ultrasound reflection from the cartilage surface providesan indication of the integrity of the collagen fibril network [28, 68, 97]. In parallelwith previous studies, it was found that ultrasound reflection from the tissue surfacedecreased significantly after collagenase digestion. In contrast to the importance ofthe collagen fibril network, it has been claimed that proteoglycans play a minorrole in ultrasound reflection from the articular surface [97, 103]. Again, this wasconfirmed in the present thesis work: proteoglycan depletion with chondroitinaseABC induced no significant changes in the ultrasound reflection (or URI) from thesurface. In Study V, when investigating ultrasound reflection from the cartilage sur-face in spontaneously degenerated samples, a statistically significant decrease wasobserved for R and IRC in degenerated samples compared to intact samples. Fur-thermore, the results suggest that ultrasound reflection from the cartilage surfacealso serves as a moderate predictor of cartilage true dynamic stiffness.
Ultrasound reflection from the cartilage-bone interfaceQuantitative ultrasound analysis of the cartilage-bone interface is challenging as theattenuation in the overlying cartilage tissue, as well as the reflection at the cartilagesurface, may significantly affect the results. In the published literature, ultrasoundreflection from the cartilage-bone interface has been quantitatively analyzed with-out compensating the attenuation effect of the overlying cartilage [50], or by usinga constant attenuation coefficient for cartilage [72]. In Study IV, the ultrasoundattenuation coefficient in the overlying cartilage was also assumed to be constant.
11.3 Quantitative ultrasound imaging 81
Consequently, only differences in attenuation due to variable cartilage thickness weretaken into account in the calculations of Rbone and IRCbone. However, in Study V,the true sample-specific ultrasound attenuation in the overlying cartilage was ac-tually measured, thus confirming its effect on the measured reflection parametersfor the cartilage-bone interface. Although the absolute values of Rbone and IRCbone
increased significantly after attenuation correction, linear correlations between Rbone
or IRCbone and Mankin score or dynamic modulus were not improved. These re-sults suggest that the changes in cartilage-bone interface, typical to early OA, canbe detected without attenuation information. However, in order to determine theabsolute values of the reflection coefficients, sound attenuation in the overlying car-tilage tissue needs to be known. When aiming at determining Rbone and IRCbone
arthroscopically in vivo, information on cartilage thickness is probably sufficient foracceptable correction of the ultrasound reflection measurements from the cartilage-bone interface.
The exact origin of the ultrasound signal reflecting from the cartilage-bone in-terface is still under discussion. In earlier studies, it has been hypothesized thatthis second ultrasound reflection would be generated from the interface betweenthe non-calcified and calcified cartilage, i.e. from the tidemark [87, 119]. However,Disler et al. (2000) suggested that this ultrasound reflection may be generated at theboundary between the cartilage and subchondral bone [34]. In the present study,no tidemark or calcified cartilage layer could be histologically verified. This maybe related to different species (rabbit vs. bovine) or different stages of maturationcompared to earlier studies. Consequently, we believe that the second ultrasoundreflection in the present samples was generated from the immediate boundary be-tween the cartilage and subchondral bone. Therefore, it reflects the integrity of thesubchondral bone. However, in adult human articular cartilage, tidemark and cal-cified cartilage layer may exist and, in that case, the specular ultrasound reflectionmay reflect more the integrity of calcified cartilage than that of subchondral bone.This issue needs to be confirmed with human articular cartilage samples.
Site-dependent variation within bovine knee jointA significant site-dependent variation was shown in quantitative ultrasound imag-ing parameters for the surface (R, IRC and URI) and for the superficial collagencontent. Ultrasound reflection at the cartilage-bone interface (Rbone and IRCbone)showed insignificant site-dependent variation. As compared to R and IRC, URIproved to be the most sensitive parameter in detecting differences between themeasurement sites. Interestingly, the ultrasound reflection parameters of the sur-face were not significantly related to superficial collagen content in healthy tissue,whereas there was a high correlation between R and URI. These results suggestthat ultrasound reflection from an intact cartilage surface is mainly dependent onthe cartilage surface roughness (controlling ultrasound scattering) and that the col-

82 11. Discussion
lagen content (controlling acoustic impedance) has a less significant role. However,it is probable that differences in superficial collagen content are relatively small indifferent sites within a healthy knee joint. Therefore, a much larger variation incollagen content can be expected for degenerated samples compared to healthy tis-sue and, in that kind of situation, ultrasound reflection from the tissue surface ispossibly related to the superficial collagen content. This issue will require furtherinvestigations.
11.4 Diagnostic potential of quantitative ultrasound tech-niques
Ultrasound indentation instrumentThe present results suggest that the ultrasound indentation technique would be ca-pable of determining short-term mechanical properties of cartilage also in vivo. Theinstrument provides direct information on cartilage mechanical function, sensitivelyimpaired in degenerative joint disease, and the in vivo measurements can be per-formed during routine arthroscopy. However, the final judgement of the instrumentperformance in vivo can be done only with human cartilage tissue, measured duringreal clinical situations. It is also notable that indentation serves as highly point-wise measurement and in vivo measurements of certain locations within the kneecan be challenging. At this stage, further technical developments of the prototypeinstrument are needed before it can be used in clinical practice.
Quantitative ultrasound imagingBased on the present results, quantitative 2D ultrasound imaging enables detectionof early experimentally induced or spontaneously developed degenerative changesbefore degeneration can be visually seen. Furthermore, changes in ultrasound re-flection from the cartilage-bone interface can be quantitatively determined with thepresent ultrasound imaging technique. The major benefit of ultrasound imaging, ascompared to more local or point-like measurement techniques, is the possibility toobtain extensive information from large areas of articular surfaces as well as fromunderneath the cartilage surface. Furthermore, no direct estimation of cartilage sur-face roughness is possible with the localized techniques.
Quantitative ultrasound imaging is not limited to 2D scans, but is also applicableto 3D measurements. This could be a significant advantage because large areas ofthe joint can be imaged and reflection or surface roughness values can be obtainedpixel-by-pixel in 3D, e.g., during open joint surgery. In principle, the clinical appli-cation of these techniques may be achieved by using a high-resolution microarrayprobe or by one moving (scanning) transducer. This kind of instrumentation setshigh demands for the development of an arthroscopic ultrasound imaging device aswell as for collection of reference values for ultrasound reflection and surface rough-

11.4 Diagnostic potential of quantitative ultrasound techniques 83
ness. At the moment, no prototype of the high-resolution in vivo imaging deviceexists. Therefore, development of the arthroscopic ultrasound imaging instrumentwill be essential for further clinical investigations.

84 11. Discussion
Chapter XII
Summary and conclusions
In this thesis work, the ultrasound indentation instrument was validated and qual-ified for further development towards its clinical use. Furthermore, quantitativeultrasound imaging was demonstrated to be a sensitive and specific method fordetecting the structural and functional properties of normal and osteoarthrotic ar-ticular cartilage tissue.
The main conclusions from the present study are summarized as follows:
1. Dynamic modulus and ultrasound reflection coefficient at the cartilage sur-face, both measured with the ultrasound indentation instrument, are sensitivefor detecting spontaneously developed degenerative histological, compositionaland biomechanical changes in bovine cartilage tissue.
2. Mechanical stiffness of cartilage tissue (dynamic modulus or Young’s modulus)is more closely related to the sound speed than to the ultrasound reflectionfrom the surface.
3. Quantitative ultrasound imaging parameters for the surface (R, IRC andURI) sensitively detected differences after mechanically or enzymatically (col-lagenase) degraded bovine cartilage tissue. Furthermore, R, IRC and URIwere able to discern histologically normal and degenerated cartilage tissue fromeach other during spontaneous cartilage degeneration process.
4. A novel parameter for quantification of cartilage surface roughness, URI, wasdemonstrated to be highly sensitive and specific for osteoarthrotic surface fib-rillation of bovine cartilage tissue.
5. R, IRC and URI showed topographical variation across bovine knee joint sur-faces, whereas the ultrasound reflection at the cartilage-bone interface (Rbone
and IRCbone) was not site-dependent. Ultrasound reflection parameters fromthe intact cartilage surface (R, IRC) were mainly dependent on the cartilage
85
86 12. Summary and conclusions
surface roughness (URI) with the collagen content having a less significantrole.
6. Ultrasound reflection at the cartilage-bone interface (Rbone and IRCbone) dif-ferentiated histologically normal and degenerated tissue from each other dur-ing spontaneous cartilage degeneration process. Furthermore, it was quan-titatively confirmed that true ultrasound attenuation in the overlying carti-lage significantly affects the measured ultrasound reflection values from thecartilage-bone interface.
7. The presented ultrasound indentation and imaging techniques are capable ofachieving highly promising results in laboratory measurements. In principle,they can also benefit in vivo diagnostics of OA and monitoring of cartilagerepair. However, several technical challenges must be solved before they canbe succesfully exploited in the clinic.
REFERENCES
[1] Recommendations for the medical management of osteoarthritis of the hip and knee:2000 update. American College of Rheumatology Subcommittee on OsteoarthritisGuidelines. Arthritis Rheum, 43(9):1905–15, 2000.
[2] Adam C, Eckstein F, Milz S, Schulte E, Becker C, and Putz R. The distributionof cartilage thickness in the knee-joints of old-aged individuals-measurement by A-mode ultrasound. Clin Biomech, 13(1):1–10, 1998.
[3] Adams J, S. B., Herz PR, Stamper DL, Roberts MJ, Bourquin S, Patel NA, Schnei-der K, Martin SD, Shortkroff S, Fujimoto JG, and Brezinski ME. High-resolutionimaging of progressive articular cartilage degeneration. J Orthop Res, 24(4):708–15,2006.
[4] Adler RS, Dedrick DK, Laing TJ, Chiang EH, Meyer CR, Bland PH, and Rubin JM.Quantitative assessment of cartilage surface roughness in osteoarthritis using highfrequency ultrasound. Ultrasound Med Biol, 18(1):51–8, 1992.
[5] Agemura DH, O’Brien (Jr) WD, Olerud JE, Chun LE, and Eyre DE. Ultra-sonic propagation properties of articular cartilage at 100 MHz. J Acoust Soc Am,87(4):1786–91, 1990.
[6] Amenzade Y. Theory of Elasticity. Mir Publishers, Moscow, 1979.[7] Appleyard RC, Swain MV, Khanna S, and Murrell GA. The accuracy and reliability
of a novel handheld dynamic indentation probe for analysing articular cartilage.Phys Med Biol, 46(2):541–50, 2001.
[8] Armstrong CG and Mow VC. Variations in the intrinsic mechanical properties ofhuman articular cartilage with age, degeneration, and water content. J Bone JointSurg Am, 64(1):88–94, 1982.
[9] Athanasiou KA, Agarwal A, and Dzida FJ. Comparative study of the intrinsicmechanical properties of the human acetabular and femoral head cartilage. J OrthopRes, 12(3):340–9., 1994.
[10] Athanasiou KA, Constantinides G, and Lanctot DR. Articular cartilage evaluatorand method for using the same. United States Patent 5673708, 1997.
[11] Athanasiou KA, Rosenwasser MP, Buckwalter JA, Malinin TI, and Mow VC. In-
87
88 References
terspecies comparisons of in situ intrinsic mechanical properties of distal femoralcartilage. J Orthop Res, 9(3):330–40, 1991.
[12] Athanasiou KA, Shah AR, Hernandez RJ, and LeBaron RG. Basic science of artic-ular cartilage repair. Clin Sports Med, 20(2):223–47, 2001.
[13] Bader DL and Kempson GE. The short-term compressive properties of adult humanarticular cartilage. Biomed Mater Eng, 4(3):245–56, 1994.
[14] Bailey AJ, Mansell JP, Sims TJ, and Banse X. Biochemical and mechanical prop-erties of subchondral bone in osteoarthritis. Biorheology, 41(3-4):349–58, 2004.
[15] Bashir A, Gray ML, Hartke J, and Burstein D. Nondestructive imaging of humancartilage glycosaminoglycan concentration by MRI. Magn Reson Med, 41(5):857–65,1999.
[16] Benedek TG. A history of the understanding of cartilage. Osteoarthritis Cartilage,14(3):203–9, 2006.
[17] Blake GM, Wahner HW, and Fogelman I. Assessment of instrument performance:Precision, installation of new equipment and radiation dose. In The evaluation ofosteoporosis: Dual energy X-ray absorptiometry and ultrasound in clinical practice,pages 147–157. Martin Dunitz Ltd, London, 2nd edition, 1999.
[18] Bland JM and Altman DG. Statistical methods for assessing agreement betweentwo methods of clinical measurement. Lancet, 1(8476):307–10, 1986.
[19] Blumenkrantz N and Asboe-Hansen G. New method for quantitative determinationof uronic acids. Anal Biochem, 54(2):484–9, 1973.
[20] Brismar BH, Wredmark T, Movin T, Leandersson J, and Svensson O. Observerreliability in the arthroscopic classification of osteoarthritis of the knee. J BoneJoint Surg Br, 84(1):42–7, 2002.
[21] Buckwalter J and Mankin H. Articular cartilage, part II: Degeneration and os-teoarthritis, repair, regeneration, and transplantation. J Bone Joint Surg Am,79(4):612–32, 1997.
[22] Burstein D and Gray M. New MRI techniques for imaging cartilage. J Bone JointSurg Am, 85-A Suppl 2:70–7, 2003.
[23] Burstein D and Gray ML. Is MRI fulfilling its promise for molecular imaging ofcartilage in arthritis? Osteoarthritis Cartilage, 2006.
[24] Buschmann MD, Soulhat J, Shirazi-Adl A, Jurvelin JS, and Hunziker EB. Confinedcompression of articular cartilage: linearity in ramp and sinusoidal tests and theimportance of interdigitation and incomplete confinement. J Biomech, 31(2):171–8., 1998.
[25] Camacho NP, West P, Torzilli PA, and Mendelsohn R. FTIR microscopic imagingof collagen and proteoglycan in bovine cartilage. Biopolymers, 62(1):1–8, 2001.
[26] Chiang EH, Adler RS, Meyer CR, Rubin JM, Dedrick DK, and Laing TJ. Quan-titative assessment of surface roughness using backscattered ultrasound: the effectsof finite surface curvature. Ultrasound Med Biol, 20(2):123–35, 1994.
[27] Chiang EH, Laing TJ, Meyer CR, Boes JL, Rubin JM, and Adler RS. Ultrasoniccharacterization of in vitro osteoarthritic articular cartilage with validation by con-focal microscopy. Ultrasound Med Biol, 23(2):205–13, 1997.
References 89
[28] Cherin E, Saıed A, Laugier P, Netter P, and Berger G. Evaluation of acousticalparameter sensitivity to age-related and osteoarthritic changes in articular cartilageusing 50 − MHz ultrasound. Ultrasound Med Biol, 24(3):341–54, 1998.
[29] Cherin E, Saıed A, Pellaumail B, Loeuille D, Laugier P, Gillet P, Netter P, andBerger G. Assessment of rat articular cartilage maturation using 50-MHz quantita-tive ultrasonography. Osteoarthritis Cartilage, 9(2):178–86, 2001.
[30] Dashefsky JH. Arthroscopic measurement of chondromalacia of patella cartilageusing a microminiature pressure transducer. Arthroscopy, 3(2):80–5, 1987.
[31] Day JS, Van Der Linden JC, Bank RA, Ding M, Hvid I, Sumner DR, and Weinans H.Adaptation of subchondral bone in osteoarthritis. Biorheology, 41(3-4):359–68, 2004.
[32] Dervin GF, Stiell IG, Rody K, and Grabowski J. Effect of arthroscopic debridementfor osteoarthritis of the knee on health-related quality of life. J Bone Joint SurgAm, 85-A(1):10–9, 2003.
[33] DiSilvestro MR and Suh JK. A cross-validation of the biphasic poroviscoelasticmodel of articular cartilage in unconfined compression, indentation, and confinedcompression. J Biomech, 34(4):519–25, 2001.
[34] Disler DG, Raymond E, May DA, Wayne JS, and McCauley TR. Articular cartilagedefects: In vitro evaluation of accuracy and interobserver reliability for detectionand grading with US. Radiology, 215(3):846–51, 2000.
[35] Drexler W, Stamper D, Jesser C, Li X, Pitris C, Saunders K, Martin S, Lodge MB,Fujimoto JG, and Brezinski ME. Correlation of collagen organization with polar-ization sensitive imaging of in vitro cartilage: implications for osteoarthritis. JRheumatol, 28(6):1311–8, 2001.
[36] Duck FA, Baker AC, and Starritt HC, editors. Ultrasound in medicine. MedicalScience Series. Institute of Physics Publishing, London, 1998.
[37] Elders MJ. The increasing impact of arthritis on public health. J Rheumatol Suppl,60:6–8, 2000.
[38] Forster H and Fisher J. The influence of loading time and lubricant on the frictionof articular cartilage. Proc Inst Mech Eng [H], 210(2):109–19, 1996.
[39] Fortin M, Buschmann MD, Bertrand MJ, Foster FS, and Ophir J. Dynamic measure-ment of internal solid displacement in articular cartilage using ultrasound backscat-ter. J Biomech, 36(3):443–7, 2003.
[40] Fortin M, Soulhat J, Shirazi-Adl A, Hunziker EB, and Buschmann MD. Unconfinedcompression of articular cartilage: nonlinear behavior and comparison with a fibril-reinforced biphasic model. J Biomech Eng, 122(2):189–95., 2000.
[41] Garon M, Legare A, Guardo R, Savard P, and Buschmann MD. Streaming potentialsmaps are spatially resolved indicators of amplitude, frequency and ionic strengthdependant responses of articular cartilage to load. J Biomech, 35(2):207–16, 2002.
[42] Gluer CC, Blake G, Lu Y, Blunt BA, Jergas M, and Genant HK. Accurate assess-ment of precision errors: how to measure the reproducibility of bone densitometrytechniques. Osteoporos Int, 5(4):262–70, 1995.
[43] Guilak F, Ratcliffe A, Lane N, Rosenwasser MP, and Mow VC. Mechanical and bio-chemical changes in the superficial zone of articular cartilage in canine experimental
90 References
osteoarthritis. J Orthop Res, 12(4):474–84., 1994.[44] Harris (Jr) ED, Parker HG, Radin EL, and Krane SM. Effects of proteolytic enzymes
on structural and mechanical properties of cartilage. Arthritis Rheum, 15(5):497–503, 1972.
[45] Hattori K, Mori K, Habata T, Takakura Y, and Ikeuchi K. Measurement of themechanical condition of articular cartilage with an ultrasonic probe: quantitativeevaluation using wavelet transformation. Clin Biomech (Bristol, Avon), 18(6):553–7, 2003.
[46] Hayes WC, Keer LM, Herrmann G, and Mockros LF. A mathematical analysis forindentation tests of articular cartilage. J Biomech, 5(5):541–51, 1972.
[47] Herrmann JM, Pitris C, Bouma BE, Boppart SA, Jesser CA, Stamper DL, Fuji-moto JG, and Brezinski ME. High resolution imaging of normal and osteoarthriticcartilage with optical coherence tomography. J Rheumatol, 26(3):627–35, 1999.
[48] Hu K, Radhakrishnan P, Patel RV, and Mao JJ. Regional structural and viscoelasticproperties of fibrocartilage upon dynamic nanoindentation of the articular condyle.J Struct Biol, 136(1):46–52, 2001.
[49] Hunziker EB. Articular cartilage repair: basic science and clinical progress. a reviewof the current status and prospects. Osteoarthritis Cartilage, 10(6):432–63, 2002.
[50] Jaffre B, Watrin A, Loeuille D, Gillet P, Netter P, Laugier P, and Saied A. Effectsof antiinflammatory drugs on arthritic cartilage: a high-frequency quantitative ul-trasound study in rats. Arthritis Rheum, 48(6):1594–601, 2003.
[51] James CB and Uhl TL. A review of articular cartilage pathology and the use ofglucosamine sulfate. J Athl Train, 36(4):413–419, 2001.
[52] Joiner GA, Bogoch ER, Pritzker KP, Buschmann MD, Chevrier A, and Foster FS.High frequency acoustic parameters of human and bovine articular cartilage follow-ing experimentally-induced matrix degradation. Ultrason Imaging, 23(2):106–16,2001.
[53] Joseph D, Gu WY, Mao XG, Lai WM, and Mow VC. True density of normal andenzymatically treated bovine articular cartilage. Trans Orthop Res Soc, 24:642,1999.
[54] Jurvelin JS, Arokoski JP, Hunziker EB, and Helminen HJ. Topographical varia-tion of the elastic properties of articular cartilage in the canine knee. J Biomech,33(6):669–75, 2000.
[55] Jurvelin JS, Buschmann MD, and Hunziker EB. Optical and mechanical determi-nation of poisson’s ratio of adult bovine humeral articular cartilage. J Biomech,30(3):235–41, 1997.
[56] Jurvelin JS, Buschmann MD, and Hunziker EB. Mechanical anisotropy of the humanknee articular cartilage in compression. Proc Inst Mech Eng [H], 217(3):215–9, 2003.
[57] Karsdal MA, Tanko LB, Riis BJ, Sondergard BC, Henriksen K, Altman RD, Qvist P,and Christiansen C. Calcitonin is involved in cartilage homeostasis: is calcitonin atreatment for OA? Osteoarthritis Cartilage, 14(7):617–24, 2006.
[58] Kawchuk GN and Elliott PD. Validation of displacement measurements obtainedfrom ultrasonic images during indentation testing. Ultrasound Med Biol, 24(1):105–
References 91
11, 1998.[59] Kempson GE, Spivey CJ, Swanson SA, and Freeman MA. Patterns of cartilage
stiffness on normal and degenerate human femoral heads. J Biomech, 4(6):597–609,1971.
[60] Khalsa PS and Eisenberg SR. Compressive behavior of articular cartilage is notcompletely explained by proteoglycan osmotic pressure. J Biomech, 30(6):589–94.,1997.
[61] Kim HK, Babyn PS, Harasiewicz KA, Gahunia HK, Pritzker KPH, and Foster FS.Imaging of immature articular cartilage using ultrasound backscatter microscopy at50 MHz. J Orthop Res, 13(6):963–70, 1995.
[62] Kiviranta P, Toyras J, Nieminen MT, Laasanen MS, Saarakkala S, Nieminen HJ,Nissi MJ, and Jurvelin JS. Comparison of novel clinically applicable methodologyfor sensitive diagnostics of cartilage degeneration. European Cells and Materials,Submitted, 2007.
[63] Korhonen RK, Laasanen MS, Toyras J, Rieppo J, Hirvonen J, Helminen HJ, andJurvelin JS. Comparison of the equilibrium response of articular cartilage in uncon-fined compression, confined compression and indentation. J Biomech, 35(7):903–9,2002.
[64] Korhonen RK, Laasanen MS, Toyras J, Lappalainen R, Helminen HJ, and Ju-rvelin JS. Fibril reinforced poroelastic model predicts specifically mechanical be-havior of normal, proteoglycan depleted and collagen degraded articular cartilage.J Biomech, 36(9):1373–9, 2003.
[65] Korhonen RK, Saarakkala S, Toyras J, Laasanen MS, Kiviranta I, and Jurvelin JS.Experimental and numerical validation for the novel configuration of an arthroscopicindentation instrument. Phys Med Biol, 48(11):1565–76, 2003.
[66] Korhonen RK, Wong M, Arokoski J, Lindgren R, Helminen HJ, Hunziker EB, andJurvelin JS. Importance of the superficial tissue layer for the indentation stiffnessof articular cartilage. Med Eng Phys, 24(2):99–108, 2002.
[67] Kurkijarvi JE, Nissi MJ, Kiviranta I, Jurvelin JS, and Nieminen MT. Delayedgadolinium-enhanced MRI of cartilage (dGEMRIC) and T2 characteristics of humanknee articular cartilage: topographical variation and relationships to mechanicalproperties. Magn Reson Med, 52(1):41–6, 2004.
[68] Kuroki H, Nakagawa Y, Mori K, Kobayashi M, Yasura K, Okamoto Y, Mizuno Y,Ando K, Ikeuchi K, and Nakamura T. Maturation-dependent change and regionalvariations in acoustic stiffness of rabbit articular cartilage: an examination of thesuperficial collagen-rich zone of cartilage. Osteoarthritis Cartilage, 14(8):784–92,2006.
[69] Laasanen MS, Saarakkala S, Toyras J, Hirvonen J, Rieppo J, Korhonen RK, andJurvelin JS. Ultrasound indentation of bovine knee articular cartilage in situ. JBiomech, 36(9):1259–67, 2003.
[70] Laasanen MS, Toyras J, Hirvonen J, Saarakkala S, Korhonen RK, Nieminen MT,Kiviranta I, and Jurvelin JS. Novel mechano-acoustic technique and instrument fordiagnosis of cartilage degeneration. Physiol Meas, 23:491–503, 2002.
92 References
[71] Laasanen MS, Toyras J, Korhonen RK, Rieppo J, Saarakkala S, Nieminen MT,Hirvonen J, and Jurvelin JS. Biomechanical properties of knee articular cartilage.Biorheology, 40(1-3):133–40, 2003.
[72] Laasanen MS, Toyras J, Vasara A, Saarakkala S, Hyttinen MM, Kiviranta I, andJurvelin JS. Quantitative ultrasound imaging of spontaneous repair of porcine car-tilage. Osteoarthritis Cartilage, 14(3):258–63, 2006.
[73] Laasanen MS, Toyras J, Vasara AI, Hyttinen MM, Saarakkala S, Hirvonen J, Ju-rvelin JS, and Kiviranta I. Mechano-acoustic diagnosis of cartilage degenerationand repair. J Bone Joint Surg Am, 85-A Suppl 2:78–84, 2003.
[74] Lai WM, Hou JS, and Mow VC. A triphasic theory for the swelling and deformationbehaviors of articular cartilage. J Biomech Eng, 113(3):245–58, 1991.
[75] Lammentausta E, Kiviranta P, Nissi MJ, Laasanen MS, Kiviranta I, Nieminen MT,and Jurvelin JS. T2 relaxation time and delayed gadolinium-enhanced MRI ofcartilage (dGEMRIC) of human patellar cartilage at 1.5 T and 9.4 T: Relationshipswith tissue mechanical properties. J Orthop Res, 24(3):366–74, 2006.
[76] Lammi MJ, Qu CJ, Laasanen MS, Saarakkala S, Rieppo J, Jurvelin JS, and Toyras J.Undersulfated chondroitin sulfate does not increase in osteoarthritic cartilage. JRheumatol, 31(12):2449–53, 2004.
[77] Lee RC, Frank EH, Grodzinsky AJ, and Roylance DK. Oscillatory compressionalbehavior of articular cartilage and its associated electromechanical properties. JBiomech Eng, 103(4):280–92., 1981.
[78] Lefebvre F, Graillat N, Cherin E, Berger G, and Saıed A. Automatic three-dimensional reconstruction and characterization of articular cartilage from high-resolution ultrasound acquisitions. Ultrasound Med Biol, 24(9):1369–81, 1998.
[79] Legare A, Garon M, Guardo R, Savard P, Poole AR, and Buschmann MD. Detectionand analysis of cartilage degeneration by spatially resolved streaming potentials. JOrthop Res, 20(4):819–26, 2002.
[80] Li X, Martin S, Pitris C, Ghanta R, Stamper DL, Harman M, Fujimoto JG,and Brezinski ME. High-resolution optical coherence tomographic imaging of os-teoarthritic cartilage during open knee surgery. Arthritis Res Ther, 7(2):R318–23,2005.
[81] Lyyra T, Jurvelin J, Pitkanen P, Vaatainen U, and Kiviranta I. Indentation in-strument for the measurement of cartilage stiffness under arthroscopic control. MedEng Phys, 17(5):395–9, 1995.
[82] Mak AF. The apparent viscoelastic behavior of articular cartilage–the contributionsfrom the intrinsic matrix viscoelasticity and interstitial fluid flows. J Biomech Eng,108(2):123–30, 1986.
[83] Mak AF, Lai WM, and Mow VC. Biphasic indentation of articular cartilage. I.Theoretical analysis. J Biomech, 20(7):703–14, 1987.
[84] Mankin HJ, Dorfman H, Lippiello L, and Zarins A. Biochemical and metabolic ab-normalities in articular cartilage from osteo-arthritic human hips. II. Correlation ofmorphology with biochemical and metabolic data. J Bone Joint Surg Am, 53(3):523–37, 1971.
References 93
[85] Mankin HJ and Thrasher AZ. Water content and binding in normal and os-teoarthritic human cartilage. J Bone Joint Surg Am, 57(1):76–80, 1975.
[86] Minns RJ, Steven FS, and Hardinge K. Osteoarthrotic articular cartilage lesions ofthe femoral head observed in the scanning electron microscope. J Pathol, 122(2):63–70, 1977.
[87] Modest VE, Murphy MC, and Mann RW. Optical verification of a technique for insitu ultrasonic measurement of articular cartilage thickness. J Biomech, 22(2):171–6,1989.
[88] Moseley JB, O’Malley K, Petersen NJ, Menke TJ, Brody BA, Kuykendall DH,Hollingsworth JC, Ashton CM, and Wray NP. A controlled trial of arthroscopicsurgery for osteoarthritis of the knee. N Engl J Med, 347(2):81–8, 2002.
[89] Mow VC, Fithian DC, and Kelly MA. Fundamentals of articular cartilage andmeniscus biomechanics. In Ewing JW, editor, Articular cartilage and knee jointfunction: basic science and arthroscopy, pages 1–18. Raven Press Ltd., New York,1990.
[90] Mow VC and Guo XE. Mechano-electrochemical properties of articular cartilage:Their inhomogeneities and anisotropies. Annu Rev Biomed Eng, 4:175–209, 2002.
[91] Mow VC, Kuei SC, Lai WM, and Armstrong CG. Biphasic creep and stress re-laxation of articular cartilage in compression: Theory and experiments. J BiomechEng, 102(1):73–84, 1980.
[92] Mow VC, Ratcliffe A, and Poole AR. Cartilage and diarthrodial joints as paradigmsfor hierarchical materials and structures. Biomaterials, 13(2):67–97, 1992.
[93] Myers E and Mow VC. Biomechanics of cartilage and its response to biomechanicalstimuli. Cartilage, Structure, Function, and Biochemistry, 1:313–341, 1983.
[94] Myers SL, Dines K, Brandt DA, Brandt KD, and Albrecht ME. Experimental assess-ment by high frequency ultrasound of articular cartilage thickness and osteoarthriticchanges. J Rheumatol, 22(1):109–16, 1995.
[95] Niederauer MQ, Cristante S, Niederauer GM, Wilkes RP, Singh SM, Messina DF,Walter MA, Boyan BD, DeLee JC, and Niederauer G. A novel instrument forquantitatively measuring the stiffness of articular cartilage. Trans Orthop Res Soc,23:905, 1998.
[96] Nieminen HJ, Saarakkala S, Laasanen MS, Hirvonen J, Jurvelin JS, and Toyras J.Ultrasound attenuation in normal and spontaneously degenerated articular carti-lage. Ultrasound Med Biol, 30(4):493–500, 2004.
[97] Nieminen HJ, Toyras J, Rieppo J, Nieminen MT, Hirvonen J, Korhonen R, andJurvelin JS. Real-time ultrasound analysis of articular cartilage degradation invitro. Ultrasound Med Biol, 28(4):519–25, 2002.
[98] Nieminen MT, Rieppo J, Silvennoinen J, Toyras J, Hakumaki JM, Hyttinen MM,Helminen HJ, and Jurvelin JS. Spatial assessment of articular cartilage proteogly-cans with Gd-DTPA-enhanced T1 imaging. Magn Reson Med, 48(4):640–8, 2002.
[99] Nieminen MT, Rieppo J, Toyras J, Hakumaki JM, Silvennoinen J, Hyttinen MM,Helminen HJ, and Jurvelin JS. T2 relaxation reveals spatial collagen architecture inarticular cartilage: a comparative quantitative MRI and polarized light microscopic
94 References
study. Magn Reson Med, 46(3):487–93, 2001.[100] Nieminen MT, Toyras J, Rieppo J, Hakumaki JM, Silvennoinen J, Helminen HJ,
and Jurvelin JS. Quantitative MR microscopy of enzymatically degraded articularcartilage. Magn Reson Med, 43(5):676–81, 2000.
[101] Pagnano M and Westrich G. Successful nonoperative management of chronic os-teoarthritis pain of the knee: safety and efficacy of retreatment with intra-articularhyaluronans. Osteoarthritis Cartilage, 13(9):751–61, 2005.
[102] Pan Y, Li Z, Xie T, and Chu CR. Hand-held arthroscopic optical coherence to-mography for in vivo high-resolution imaging of articular cartilage. J Biomed Opt,8(4):648–54, 2003.
[103] Pellaumail B, Watrin A, Loeuille D, Netter P, Berger G, Laugier P, and Saıed A.Effect of articular cartilage proteoglycan depletion on high frequency ultrasoundbackscatter. Osteoarthritis Cartilage, 10(7):535–41, 2002.
[104] Poole AR, Kojima T, Yasuda T, Mwale F, Kobayashi M, and Laverty S. Composi-tion and structure of articular cartilage: a template for tissue repair. Clin OrthopRelat Res, (391 Suppl):S26–33, 2001.
[105] Potter K, Kidder LH, Levin IW, Lewis EN, and Spencer RG. Imaging of collagen andproteoglycan in cartilage sections using Fourier transform infrared spectral imaging.Arthritis Rheum, 44(4):846–55, 2001.
[106] Qin L, Zheng Y, Leung C, Mak A, Choy W, and Chan K. Ultrasound detection oftrypsin-treated articular cartilage: its association with cartilaginous proteoglycansassessed by histological and biochemical methods. J Bone Miner Metab, 20(5):281–7, 2002.
[107] Qu CJ, Karjalainen HM, Helminen HJ, and Lammi MJ. The lack of effect of glu-cosamine sulphate on aggrecan mRNA expression and (35)S-sulphate incorporationin bovine primary chondrocytes. Biochim Biophys Acta, 1762(4):453–9, 2006.
[108] Quenneville E, Binette JS, Garon M, Legare A, Meunier M, and Buschmann MD.Fabrication and characterization of nonplanar microelectrode array circuits foruse in arthroscopic diagnosis of cartilage diseases. IEEE Trans Biomed Eng,51(12):2164–73, 2004.
[109] Radin EL, Paul IL, and Lowy M. A comparison of the dynamic force transmittingproperties of subchondral bone and articular cartilage. J Bone Joint Surg Am,52(3):444–56., 1970.
[110] Radin EL and Rose RM. Role of subchondral bone in the initiation and progressionof cartilage damage. Clin Orthop Relat Res, (213):34–40, 1986.
[111] Rieppo J, Hyttinen MM, Jurvelin JS, and Helminen HJ. Reference sample methodreduces the error caused by variable cryosection thickness in fourier transform in-frared imaging. Appl Spectrosc, 58(1):137–40, 2004.
[112] Rogowska J, Bryant CM, and Brezinski ME. Cartilage thickness measurements fromoptical coherence tomography. J Opt Soc Am A Opt Image Sci Vis, 20(2):357–67,2003.
[113] Sachs JR and Grodzinsky AJ. Electromechanical spectroscopy of cartilage usinga surface probe with applied mechanical displacement. J Biomech, 28(8):963–76,
References 95
1995.[114] Saıed A, Cherin E, Gaucher H, Laugier P, Gillet P, Floquet J, Netter P, and
Berger G. Assessment of articular cartilage and subchondral bone: Subtle and pro-gressive changes in experimental osteoarthritis using 50MHz echography in vitro. JBone Miner Res, 12(9):1378–86, 1997.
[115] Samosky JT, Burstein D, Eric Grimson W, Howe R, Martin S, and Gray ML.Spatially-localized correlation of dGEMRIC-measured GAG distribution and me-chanical stiffness in the human tibial plateau. J Orthop Res, 23(1):93–101, 2005.
[116] Senzig DA, Forster FK, and Olerud JE. Ultrasonic attenuation in articular cartilage.J Acoust Soc Am, 92(2 Pt 1):676–81, 1992.
[117] Shingleton WD, Hodges DJ, Brick P, and Cawston TE. Collagenase: A key enzymein collagen turnover. Biochem Cell Biol, 74(6):759–75, 1996.
[118] Shull PJ and Tittmann BR. Ultrasound. In Shull PJ, editor, Nondestructive Eval-uation: Theory, Techniques, and Applications, pages 63–192. Marcel Dekker Inc.,New York, USA, 2002.
[119] Spriet MP, Girard CA, Foster SF, Harasiewicz K, Holdsworth DW, and Laverty S.Validation of a 40 MHz B-scan ultrasound biomicroscope for the evaluation of os-teoarthritis lesions in an animal model. Osteoarthritis Cartilage, 13(2):171–9, 2005.
[120] Stuart MJ and Lubowitz JH. What, if any, are the indications for arthroscopicdebridement of the osteoarthritic knee? Arthroscopy, 22(3):238–9, 2006.
[121] Suh JK, Youn I, and Fu FH. An in situ calibration of an ultrasound transducer:A potential application for an ultrasonic indentation test of articular cartilage. JBiomech, 34(10):1347–53, 2001.
[122] Sun DD, Guo XE, Likhitpanichkul M, Lai WM, and Mow VC. The influence of thefixed negative charges on mechanical and electrical behaviors of articular cartilageunder unconfined compression. J Biomech Eng, 126(1):6–16, 2004.
[123] Toyras J, Laasanen MS, Saarakkala S, Lammi MJ, Rieppo J, Kurkijarvi J, Lap-palainen R, and Jurvelin JS. Speed of sound in normal and degenerated bovinearticular cartilage. Ultrasound Med Biol, 29(3):447–54, 2003.
[124] Toyras J, Rieppo J, Nieminen MT, Helminen HJ, and Jurvelin JS. Characterizationof enzymatically induced degradation of articular cartilage using high frequencyultrasound. Phys Med Biol, 44(11):2723–33, 1999.
[125] Verzijl N, DeGroot J, Bank RA, Bayliss MT, Bijlsma JW, Lafeber FP, Maroudas A,and TeKoppele JM. Age-related accumulation of the advanced glycation endproductpentosidine in human articular cartilage aggrecan: the use of pentosidine levels asa quantitative measure of protein turnover. Matrix Biol, 20(7):409–17, 2001.
[126] Wang CC, Chahine NO, Hung CT, and Ateshian GA. Optical determinationof anisotropic material properties of bovine articular cartilage in compression. JBiomech, 36(3):339–53, 2003.
[127] Wells PNT. Physical Principles of Ultrasonic Diagnosis. Academic Press, London,1969.
[128] Wilson W, van Donkelaar CC, van Rietbergen R, and Huiskes R. The role of compu-tational models in the search for the mechanical behavior and damage mechanisms
96 References
of articular cartilage. Med Eng Phys, 27(10):810–26, 2005.[129] Wong M, Ponticiello M, Kovanen V, and Jurvelin JS. Volumetric changes of articular
cartilage during stress relaxation in unconfined compression. J Biomech, 33(9):1049–54, 2000.
[130] Xia Y, Moody JB, Burton-Wurster N, and Lust G. Quantitative in situ correla-tion between microscopic MRI and polarized light microscopy studies of articularcartilage. Osteoarthritis Cartilage, 9(5):393–406, 2001.
[131] Yamagata T, Saito H, Habuchi O, and Suzuki S. Purification and properties ofbacterial chondroitinases and chondrosulfatases. J Biol Chem, 243(7):1523–1535,1968.
[132] Yelin E and Callahan LF. The economic cost and social and psychological impact ofmusculoskeletal conditions. National Arthritis Data Work Groups. Arthritis Rheum,38(10):1351–62., 1995.
[133] Zhang M, Zheng YP, and Mak AFT. Estimating the effective Young’s modulus ofsoft tissues from indentation tests - Nonlinear finite element analysis of effects offriction and large deformation. Med Eng Phys, 19(6):512–7, 1997.
[134] Zheng YP and Mak AF. An ultrasound indentation system for biomechanical prop-erties assessment of soft tissues in-vivo. IEEE Trans Biomed Eng, 43(9):912–8,1996.
[135] Zheng YP, Mak AF, Lau KP, and Qin L. An ultrasonic measurement for in vitrodepth-dependent equilibrium strains of articular cartilage in compression. Phys MedBiol, 47(17):3165–80, 2002.
[136] Zheng YP, Niu HJ, Arthur Mak FT, and Huang YP. Ultrasonic measurement ofdepth-dependent transient behaviors of articular cartilage under compression. JBiomech, 38(9):1830–7, 2005.
[137] Zheng YP, Shi J, Qin L, Patil SG, Mow VC, and Zhou KY. Dynamic depth-dependent osmotic swelling and solute diffusion in articular cartilage monitoredusing real-time ultrasound. Ultrasound Med Biol, 30(6):841–9, 2004.
Kuopio University Publications C. Natural and Environmental Sciences C 185. Luomala, Eeva-Maria. Photosynthesis, chemical composition and anatomy of Scots pine and Norway spruce needles under elevated atmospheric CO2 concentration and temperature. 2005. 137 p. Acad. Diss. C 186. Heikkinen, Lasse M. Statistical estimation methods for electrical process tomography. 2005. 147 p. Acad. Diss. C 187. Riihinen, Kaisu. Phenolic compounds in berries. 2005. 97 p. Acad. Diss. C 188. Virkutyte, Jurate. Heavy metal bonding and remediation conditions in electrokinetically treated waste medias. 2005. 133 p. Acad. Diss. C 189. Koistinen, Kaisa. Birch PR-10c: multifunctional binding protein. 2006. 79 p. Acad. Diss. C 190. Airaksinen, Sanna. Bedding and manure management in horse stables: its effect on stable air quality, paddock hygiene and the compostability and utilization of manure. 2006. 91 p. Acad. Diss. C 191. Asikainen, Arja. Use of computational tools for rapid sorting and prioritising of organic compounds causing environmental risk with estrogenic and cytochrome P450 activity. 2006. 51 p. Acad. Diss. C 192. Ålander, Timo. Carbon composition and volatility characteristics of the aerosol particles formed in internal combustion engines. 2006. 54 p. Acad. Diss. C 193. Molnar, Ferdinand. Structural analysis of the ligand-binding domains of human and mouse CAR, human VDR and human PPARs. 2006. 115 p. Acad. Diss. C 194. Kasurinen, Anne. Soil-related processes of young silver birch trees grown under elevated CO₂ and O₃ . 2006. 64 p. Acad. Diss. C 195. Metsärinne, Sirpa. Degradation of Novel and Conventional Complexing Agents. 2006. 138 p. Acad. Diss. C 196. Heijari, Juha. Seed origin, forest fertilization and chemical elicitor influencing wood characteristics and biotic resistance of Scots pine. 2006. 39 p. Acad. Diss. C 197. Hakulinen, Mikko. Prediction of density, structure and mechanical properties of trabecular bone using ultrasound and X-ray techniques. 2006. 84 p. Acad. Diss. C 198. Al Natsheh, Anas. Quantum Mechanics Study of Molecular Clusters Composed of Atmospheric Nucleation Precursors. 2006. 55 p. Acad. Diss.