sl modelling fe paper
TRANSCRIPT

8/8/2019 Sl Modelling FE Paper
http://slidepdf.com/reader/full/sl-modelling-fe-paper 1/8
DOWNLOADED FROM: HTTP:// WWW.MTM.KULEUVEN.AC.BE /RESEARCH /C2/ POLY / INDEX.HTM
FEA of textiles and textile composites: a gallery
Stepan V. Lomov, Dmitry S. Ivanov, Vitaly Koissin, Ignaas Verpoest
Department MTM, Katholieke Universiteit Leuven Kasteelpark Arenberg 44 B-3001 LeuvenBelgium
Masaru Zako, Tetsusei Kurashiki, Hiroaki NakaiDepartment of Management of Industry and Technology, Osaka University, 2-1,Yamadaoka, Suita, Osaka, 565-0871, Japan
ABSTRACT
Meso-scale finite element modelling of textiles and textile composites (scale of the unit cell of the textile structure) is a powerful tool for homogenisation of
mechanical properties, study of stress-strain fields inside the unit cell, determinationof damage initiation conditions and sites and simulation of damage development
and associated deterioration of the homogenised mechanical properties of thecomposite.
The paper presents a gallery of cases of such a modelling, discussing issues of
building finite element models of textile structures (geometry, meshing, boundaryconditions), of interpretation of the results (homogenization, damage initiation
criterion, damage propagation) and of verification of the models.
The following cases are considered:
x Composites reinforced by 2D woven fabrics: validation of FE modelingusing full-field strain measurements
x 3-axial braided composites: building of an adequate geometry and mesh,boundary conditions for ¼ of the unit cell, damage initiation and
propagation
x Structurally stitched thick woven composite: interaction of the stitching with
the “body” of the plate
x Knitted fabrics made of shape memory alloy wires: hyperelastic material
behaviour, contacts and slipping of the wires
All the cases are supported by comparison with experimental data.

8/8/2019 Sl Modelling FE Paper
http://slidepdf.com/reader/full/sl-modelling-fe-paper 2/8
DOWNLOADED FROM: HTTP:// WWW.MTM.KULEUVEN.AC.BE /RESEARCH /C2/ POLY / INDEX.HTM
INTRODUCTION
Finite element (FE) meso-modelling of textile composites and textiles
themselves, apart from being a popular research topic, is more and more consideredas a tool for industrially relevant calculations, especially for prediction of damage
threshold and progressive damage. The term “meso” refers to the scale level of unitcell of the textile reinforcement. FE simulation can provide detailed information onthe stress-strain fields inside the unit cell of textile composites, for elastic or non-
elastic behaviour of fibres and matrix, leading to prediction of damage initiation and
further development of damage. Homogenised stiffness of composite can be as well
predicted using FE models, but their computational expense is much higher thensimpler methods, which accurately predict homogenised stiffness (e.g. method of
inclusions [1, 2]). An overview of the state-of-the-art can be found in the
proceedings of a micro-symposium “FE modelling of textiles and textilecomposites” (St.-Petersburg, 2007). An initiative of creating “The Textile
Composite Archives” [3], to be hosted on a server at Texas A&M University is a
follow-up of discussions during that meeting. The “gallery” presented in this paperlies in the streamline of the proposal of this data bank.
The tools (as enumerated in conclusion of the review paper [4]) used in the
examples of FE analysis given in the present paper, are shown in Table I.
TABLE I SOFTWARE TOOLS
2D woven 3-axial braided Structurally
stitched Knitted
Geometric modeller WiseTex
Geometry corrector of
yarn interpenetrationMeshTex
intermediate
analysis in ANSYS
mesh
superposition
contact pairs in
ANSYS
Meshing MeshTex ANSYS MeshTex ANSYS
Material properties MeshTex ANSYS macros MeshTex ANSYS macrosBoundary conditions MeshTex ANSYS macros MeshTex ANSYS macros
FE solver, post-processor SACOM ANSYS SACOM ANSYS
Homogenisation MeshTex ANSYS macros MeshTex ANSYS macros
Damage SACOM ANSYS macros SACOM n/a
References: WiseTex [2], MeshTex [4], SACOM [5], mesh superposition [6], intermediate FE
analysis for correction of geometry [7], damage analysis [4, 5, 7]
2D WOVEN COMPOSITE: HOMOGENISED PROPERTIES AND
ELASTIC STRAIN FIELDS
The work reported in this section is a part of a wider modelling effort, done in
collaboration with A.E. Bogdanovich and D. Mungalov [8], which also includesmodelling of 3D woven composites, performed using MOSAIC 3D model [9].
The plain weave was made of 2275 tex PPG Hybon 2022 E-glass roving in bothwarp and fill directions: 1.95 ends/cm and 1.60 picks/cm. Note the difference
between fibre amounts in warp and fill directions, which asked to alternate fabric
layer orientation in the 4-layer preform. Composite material samples werefabricated in a vacuum bag with Dow Derakane 8084 Epoxy-Vinyl Ester resin as a
stack of four woven layers of 815 g/m2
with orientation 0°/90°/90°/0°.
8/8/2019 Sl Modelling FE Paper
http://slidepdf.com/reader/full/sl-modelling-fe-paper 3/8
DOWNLOADED FROM: HTTP:// WWW.MTM.KULEUVEN.AC.BE /RESEARCH /C2/ POLY / INDEX.HTM
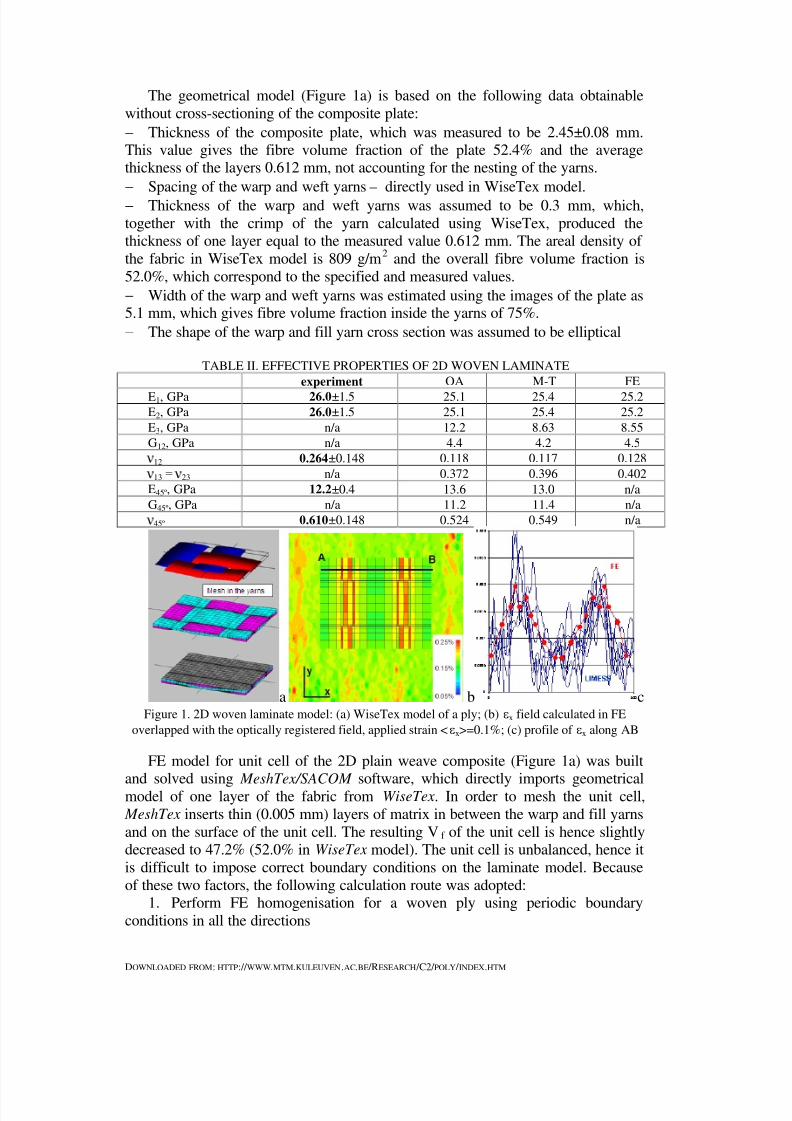
The geometrical model (Figure 1a) is based on the following data obtainable
without cross-sectioning of the composite plate:
Thickness of the composite plate, which was measured to be 2.45±0.08 mm.This value gives the fibre volume fraction of the plate 52.4% and the averagethickness of the layers 0.612 mm, not accounting for the nesting of the yarns.
Spacing of the warp and weft yarns – directly used in WiseTex model.
Thickness of the warp and weft yarns was assumed to be 0.3 mm, which,
together with the crimp of the yarn calculated using WiseTex, produced thethickness of one layer equal to the measured value 0.612 mm. The areal density of
the fabric in WiseTex model is 809 g/m2 and the overall fibre volume fraction is
52.0%, which correspond to the specified and measured values.
Width of the warp and weft yarns was estimated using the images of the plate as5.1 mm, which gives fibre volume fraction inside the yarns of 75%.
The shape of the warp and fill yarn cross section was assumed to be elliptical
TABLE II. EFFECTIVE PROPERTIES OF 2D WOVEN LAMINATE
experiment OA M-T FE
E1, GPa 26.0±1.5 25.1 25.4 25.2
E2, GPa 26.0±1.5 25.1 25.4 25.2
E3, GPa n/a 12.2 8.63 8.55
G12, GPa n/a 4.4 4.2 4.5
12 0.264±0.148 0.118 0.117 0.128
13 23 n/a 0.372 0.396 0.402
E45º, GPa 12.2±0.4 13.6 13.0 n/a
G45º, GPa n/a 11.2 11.4 n/a
45º 0.610±0.148 0.524 0.549 n/a
a b cFigure 1. 2D woven laminate model: (a) WiseTex model of a ply; (b) Hx field calculated in FE
overlapped with the optically registered field, applied strain <Hx>=0.1%; (c) profile of Hx along AB
FE model for unit cell of the 2D plain weave composite (Figure 1a) was built
and solved using MeshTex/SACOM software, which directly imports geometricalmodel of one layer of the fabric from WiseTex. In order to mesh the unit cell,
MeshTex inserts thin (0.005 mm) layers of matrix in between the warp and fill yarns
and on the surface of the unit cell. The resulting Vf of the unit cell is hence slightlydecreased to 47.2% (52.0% in WiseTex model). The unit cell is unbalanced, hence it
is difficult to impose correct boundary conditions on the laminate model. Because
of these two factors, the following calculation route was adopted:1. Perform FE homogenisation for a woven ply using periodic boundary
conditions in all the directions

8/8/2019 Sl Modelling FE Paper
http://slidepdf.com/reader/full/sl-modelling-fe-paper 4/8
DOWNLOADED FROM: HTTP:// WWW.MTM.KULEUVEN.AC.BE /RESEARCH /C2/ POLY / INDEX.HTM
2. Scale elastic properties to fibre volume fraction 52.0%
3. Calculate homogenised laminate properties using Classical Laminate Theory
with properties of lamina calculated as above
Use of periodic boundary conditions in thickness direction may be questioned asthe plate has only four plies and free surfaces are not far from the middle of the
plate. However, the overestimation of the stiffness, connected with that, is believed
to compensate the underestimation of the stiffness resulting from the neglecting of the nesting of the layers.
Table II shows effective elastic properties of the 2D weave composites
calculated using iso-strain Orientation Averaging (OA), Mori-Tanaka (M-T), FEAand experimental results. The OA, M-T and FE analyses give results very close to
the experimental data for all the considered engineering constants. All theoretical
YDOXHV RI 3RLVVRQ¶V UDWLR 12 are consistently lower (about two times) than the
average experimental value, but they are near the edge of the experimental scatter,ZKLFKLVYHU\ODUJHIRUWKLVFKDUDFWHULVWLF)(JLYHVVOLJKWO\EHWWHUDJUHHPHQWIRU 12.
Figure 1b compares the Hx field (loading in x direction) calculated in FE overlappedwith the optically registered field (LIMESS system was used). Comparison of the
two should be done bearing in mind, hat the FE calculation were done forperiodicity of the fields in z-direction, whilst the experimental strains are measured
on the free surface of the sample [10]. FE modelling provides good agreement with
the experimental data both for homogenised properties of the composite and for thestrain fields inside the unit cell.
THREE-AXIAL BRAIDED COMPOSITE: INTERPENETRATION OF THE
YARN VOLUMES, ¼ UNIT CELL, DAMAGE MODELLING
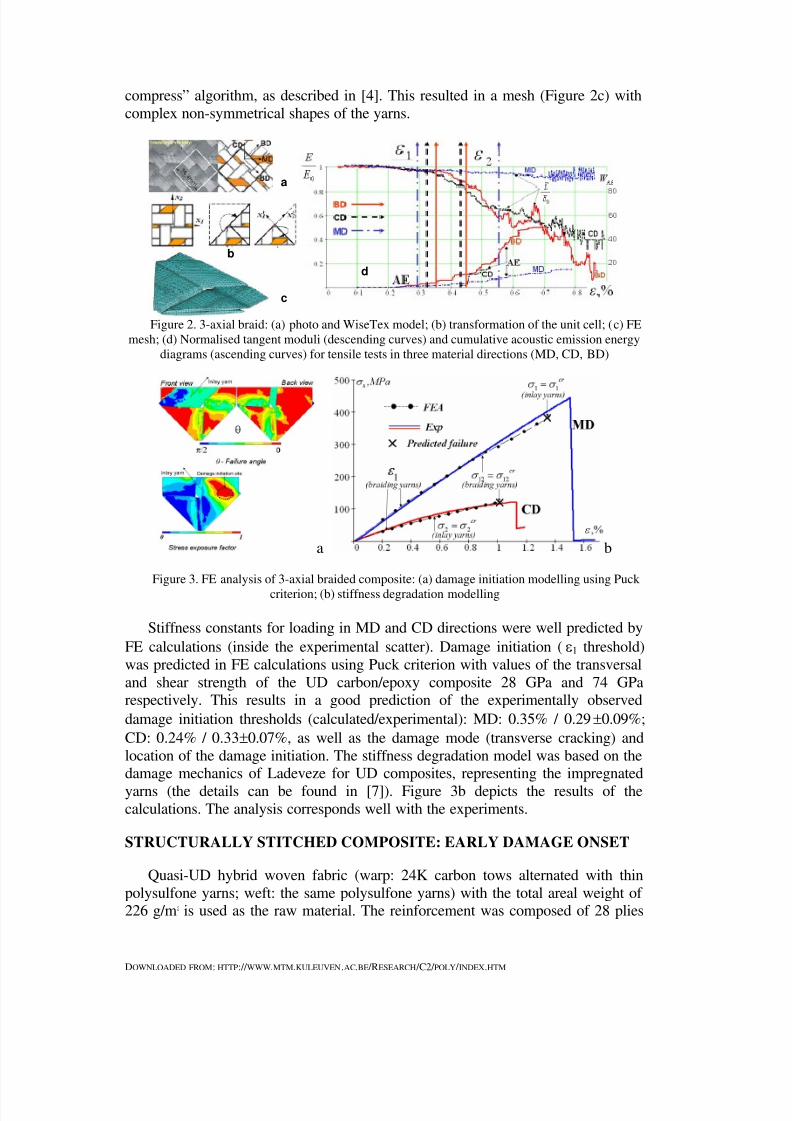
The reinforcement (Figure 2a) is a triaxial braid made of carbon rovings (linear
density 1600 tex), areal density of 600 g/m2. The four-layer braided composite has
interlacing yarns in three directions: braiding yarns (r45q) and inlay yarns. Fiveyarns (two in each biaxial direction and one inlay yarn) are interlaced at a relatively
small distance, which leads to a complex shape of the yarn mid-lines and cross
sections. The unit cell has a large open inner space, which is not occupied by thereinforcement and which causes nesting of the layers. There is variation of fibre
volume fraction across the yarns: at the edges the fibre volume fraction is 15%
lower than in the middle zone. The composite is impregnated with epoxy matrix
(Epicote 828 LV/Epicure DX 6514, mixing ratio 100/17). The composite sampleswere tested in tension in three directions (indicated in Figure 2a) with acoustic
emission (AE) registration. Typical diagrams of cumulative energy of events are
shown in Figure 2d together with diagrams of degradation of stiffness. These
diagrams are used to determine the strain corresponding to onset of damage H1 and asecond stage of the damage accumulation (called H2) as a "knee" on AE curves,
which is close to a slope change in the tensile (stiffness degradation) diagrams.
More details of the experiments can be found in [7].Periodic boundary conditions (based on the translation symmetry of the unit cell
as a whole) are used. In order to decrease the computational efforts, following [11]
the internal symmetry of the unit cell is accounted for (Figure 2b). The yarn shapes
were adjusted to avoid interpenetration of the volumes, using “separate and
8/8/2019 Sl Modelling FE Paper
http://slidepdf.com/reader/full/sl-modelling-fe-paper 5/8
DOWNLOADED FROM: HTTP:// WWW.MTM.KULEUVEN.AC.BE /RESEARCH /C2/ POLY / INDEX.HTM
compress” algorithm, as described in [4]. This resulted in a mesh (Figure 2c) with
complex non-symmetrical shapes of the yarns.
a
b
c
d
Figure 2. 3-axial braid: (a) photo and WiseTex model; (b) transformation of the unit cell; (c) FE
mesh; (d) Normalised tangent moduli (descending curves) and cumulative acoustic emission energy
diagrams (ascending curves) for tensile tests in three material directions (MD, CD, BD)
a b
Figure 3. FE analysis of 3-axial braided composite: (a) damage initiation modelling using Puck
criterion; (b) stiffness degradation modelling
Stiffness constants for loading in MD and CD directions were well predicted by
FE calculations (inside the experimental scatter). Damage initiation (H1 threshold)
was predicted in FE calculations using Puck criterion with values of the transversal
and shear strength of the UD carbon/epoxy composite 28 GPa and 74 GParespectively. This results in a good prediction of the experimentally observed
damage initiation thresholds (calculated/experimental): MD: 0.35% / 0.29r0.09%;
CD: 0.24% / 0.33r0.07%, as well as the damage mode (transverse cracking) and
location of the damage initiation. The stiffness degradation model was based on thedamage mechanics of Ladeveze for UD composites, representing the impregnated
yarns (the details can be found in [7]). Figure 3b depicts the results of thecalculations. The analysis corresponds well with the experiments.
STRUCTURALLY STITCHED COMPOSITE: EARLY DAMAGE ONSET
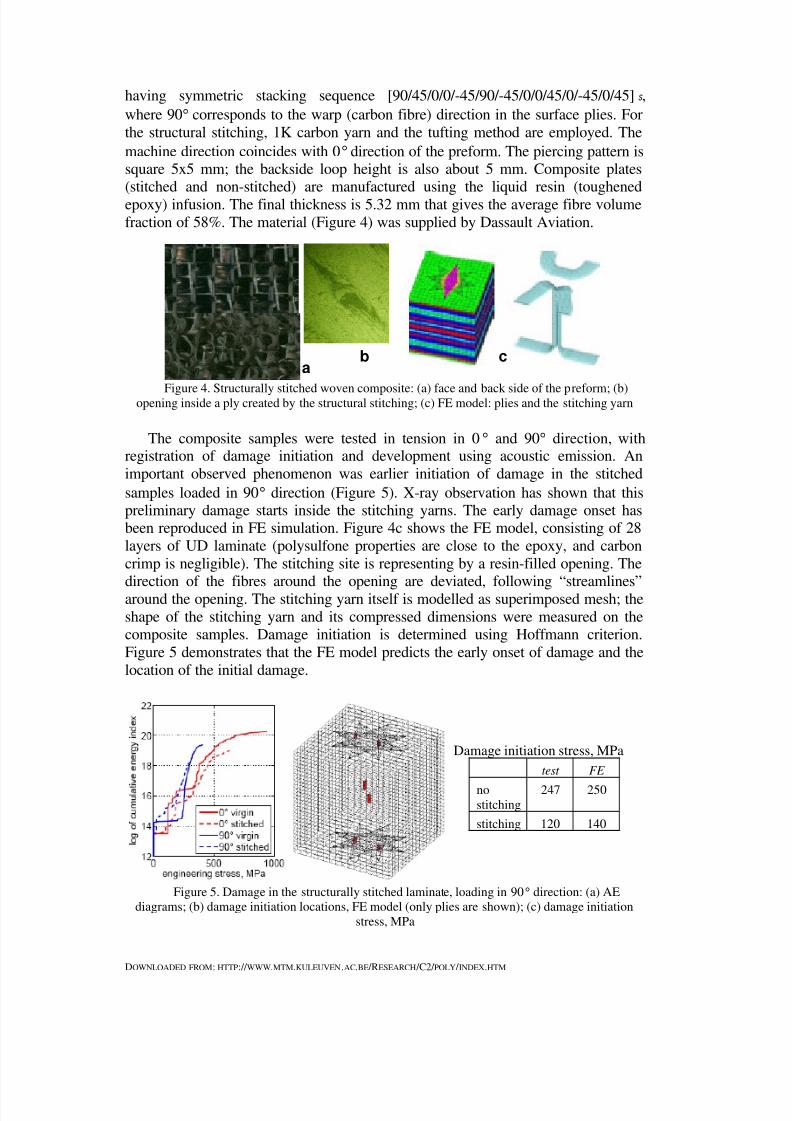
Quasi-UD hybrid woven fabric (warp: 24K carbon tows alternated with thin
polysulfone yarns; weft: the same polysulfone yarns) with the total areal weight of 226 g/m2
is used as the raw material. The reinforcement was composed of 28 plies
8/8/2019 Sl Modelling FE Paper
http://slidepdf.com/reader/full/sl-modelling-fe-paper 6/8
DOWNLOADED FROM: HTTP:// WWW.MTM.KULEUVEN.AC.BE /RESEARCH /C2/ POLY / INDEX.HTM
having symmetric stacking sequence [90/45/0/0/-45/90/-45/0/0/45/0/-45/0/45]s ,
where 90q corresponds to the warp (carbon fibre) direction in the surface plies. For
the structural stitching, 1K carbon yarn and the tufting method are employed. The
machine direction coincides with 0q direction of the preform. The piercing pattern issquare 5x5 mm; the backside loop height is also about 5 mm. Composite plates(stitched and non-stitched) are manufactured using the liquid resin (toughened
epoxy) infusion. The final thickness is 5.32 mm that gives the average fibre volume
fraction of 58%. The material (Figure 4) was supplied by Dassault Aviation.
ab c
Figure 4. Structurally stitched woven composite: (a) face and back side of the preform; (b)opening inside a ply created by the structural stitching; (c) FE model: plies and the stitching yarn
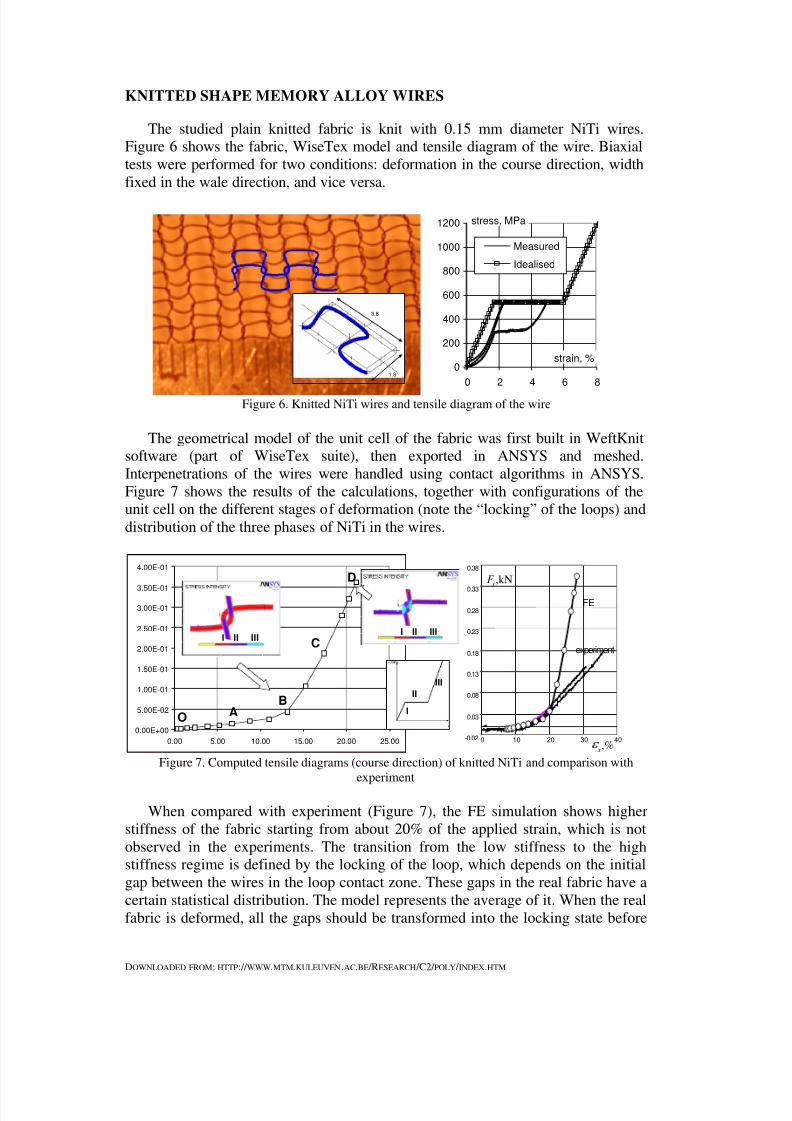
The composite samples were tested in tension in 0q and 90q direction, withregistration of damage initiation and development using acoustic emission. An
important observed phenomenon was earlier initiation of damage in the stitched
samples loaded in 90q direction (Figure 5). X-ray observation has shown that thispreliminary damage starts inside the stitching yarns. The early damage onset hasbeen reproduced in FE simulation. Figure 4c shows the FE model, consisting of 28
layers of UD laminate (polysulfone properties are close to the epoxy, and carbon
crimp is negligible). The stitching site is representing by a resin-filled opening. The
direction of the fibres around the opening are deviated, following “streamlines”around the opening. The stitching yarn itself is modelled as superimposed mesh; the
shape of the stitching yarn and its compressed dimensions were measured on thecomposite samples. Damage initiation is determined using Hoffmann criterion.
Figure 5 demonstrates that the FE model predicts the early onset of damage and the
location of the initial damage.
Damage initiation stress, MPa
test FE
nostitching
247 250
stitching 120 140
Figure 5. Damage in the structurally stitched laminate, loading in 90q direction: (a) AE
diagrams; (b) damage initiation locations, FE model (only plies are shown); (c) damage initiation
stress, MPa
8/8/2019 Sl Modelling FE Paper
http://slidepdf.com/reader/full/sl-modelling-fe-paper 7/8
DOWNLOADED FROM: HTTP:// WWW.MTM.KULEUVEN.AC.BE /RESEARCH /C2/ POLY / INDEX.HTM
KNITTED SHAPE MEMORY ALLOY WIRES
The studied plain knitted fabric is knit with 0.15 mm diameter NiTi wires.Figure 6 shows the fabric, WiseTex model and tensile diagram of the wire. Biaxial
tests were performed for two conditions: deformation in the course direction, width
fixed in the wale direction, and vice versa.
1.8
3.8
0
200
400
600
800
1000
1200
0 2 4 6 8
Measured
Idealised
strain, %
stress, MPa
Figure 6. Knitted NiTi wires and tensile diagram of the wire
The geometrical model of the unit cell of the fabric was first built in WeftKnitsoftware (part of WiseTex suite), then exported in ANSYS and meshed.
Interpenetrations of the wires were handled using contact algorithms in ANSYS.
Figure 7 shows the results of the calculations, together with configurations of theunit cell on the different stages of deformation (note the “locking” of the loops) and
distribution of the three phases of NiTi in the wires.
0.00E+00
5.00E-02
1.00E-01
1.50E-01
2.00E-01
2.50E-01
3.00E-01
3.50E-01
4.00E-01
0.00 5.00 10.00 15.00 20.00 25.00
AB
C
D
OI
II
III
I II IIII II III
-0.02
0.03
0.08
0.13
0.18
0.23
0.28
0.33
0.38
0 10 20 30 40
experiment
FE
,% x
,kN x
F
Figure 7. Computed tensile diagrams (course direction) of knitted NiTi and comparison with
experiment
When compared with experiment (Figure 7), the FE simulation shows higher
stiffness of the fabric starting from about 20% of the applied strain, which is not
observed in the experiments. The transition from the low stiffness to the high
stiffness regime is defined by the locking of the loop, which depends on the initial
gap between the wires in the loop contact zone. These gaps in the real fabric have a
certain statistical distribution. The model represents the average of it. When the real
fabric is deformed, all the gaps should be transformed into the locking state before

8/8/2019 Sl Modelling FE Paper
http://slidepdf.com/reader/full/sl-modelling-fe-paper 8/8
DOWNLOADED FROM: HTTP:// WWW.MTM.KULEUVEN.AC.BE /RESEARCH /C2/ POLY / INDEX.HTM
the fabric will start resisting by the wire tension rather than by the slippage and
decrimping.
CONCLUSION
The presented “gallery” of FE simulations of textiles and textile composites
demonstrate that the state-of-the-art models are capable to adequately simulatedeformation and damage behaviour for a wide range of materials.
ACKNOWLEGEMENTS
The work reported here was supported by EU funded ITOOL project, and
KULeuven PhD grant for D.Ivanov.
REFERENCES
1. Lomov, S.V., G. Huysmans, Y. Luo, R. Parnas, A. Prodromou, I. Verpoest, and F.R.
Phelan, Textile Composites: Modelling Strategies, Composites part A, 2001, 32(10): 1379-
1394.2. Verpoest, I. and S.V. Lomov, Virtual textile composites software Wisetex: integration with
micro-mechanical, permeability and structural analysis, Composites Science and
Technology, 2005, 65(15-16): 2563-2574.
3. Boisse, P., J. Crookston, D.S. Ivanov, S.V. Lomov, A.C. Long, I. Verpoest, J. Whitcomb,
and M. Zako. Data bank for validation of finite element analysis of textiles and textile
composites: a proposal. in 13th European Conference on Composite Materials (ECCM-13).
2008, Stockholm.
4. Lomov, S.V., D.S. Ivanov, I. Verpoest, M. Zako, T. Kurashiki, H. Nakai, and S. Hirosawa
Meso-FE modelling of textile composites: Road map, data flow and algorithms, Composites
Science and Technology, 2007, 67: 1870-1891.
5. Zako, M., Y. Uetsuji, and T. Kurashiki, Finite element analysis of damaged woven fabric
composite materials, Composites Science and Technology, 2003, 63: 507-516.
6. Nakai, H., T. Kurashiki, and M. Zako, Individual modeling of composite materials withmesh superposition method under periodic boundary condition, in Proceedings of the 16th
International Conference on Composite Materials (ICCM-16). 2007: Kyoto, CD edition.
7. Ivanov, D.S., S.V. Lomov, F. Baudry, H. Xie, B. Van Den Broucke, and I. Verpoest,
Failure analysis of triaxial braided composite, Composites Science and Technology, in print.
8. Lomov, S.V., D.S. Ivanov, I. Verpoest, A.E. Bogdanovich, D. Mungalov, M. Zako, T.
Kurashiki, and H. Nakai. Predictive analyses and experimental validations of effective
elastic properties of 2D and 3D woven composites. in 13th European Conference on
Composite Materials (ECCM-13). 2008, Stockholm.
9. Bogdanovich, A.E., Multi-scale modeling, stress and failure analyses of 3-D woven
composites, Journal of Materials Science, 2006, 41(20): 6547-6590.
10. Lomov, S.V., D.S. Ivanov, I. Verpoest, M. Zako, T. Kurashiki, H. Nakai, J. Molimard, and
A. Vautrin, Full field strain measurements for validation of meso-FE analysis of textile
composites, Composites part A, in print.11. Whitcomb, J., C.D. Chapman, and X. Tang, Derivation of boundary conditions for
micromechanics analyses of plain and satin woven composites, Journal of Composite
Materials, 2000, 34(9): 724-747.