software reliability prediction - softrel, llc · · 2016-09-13mil-hdbk-338b, military handbook:...
TRANSCRIPT

How to apply software reliability
engineering
Ann Marie NeufelderSoftRel, LLC
http://www.softrel.com
© SoftRel, LLC 2016. This presentation may not be reprinted in whole or part
without written permission from [email protected]
1

Software is increasing in size, hence it’s
effect on system reliability is increasing The increase in size of F16A to F35 is just one example[1]
With increased size comes increased complexity and
increased failures due to software as shown next
0
5000000
10000000
15000000
20000000
25000000
30000000
1970 1980 1990 2000 2010 2020
SIZE IN SLOC (SOURCE LINES OF CODE)
OF FIGHTER AIRCRAFT SINCE 1974
[1] Delivering Military Software Affordably, Christian Hagen and Jeff Sorenson, Defense AT&L, March-April 2012.
2
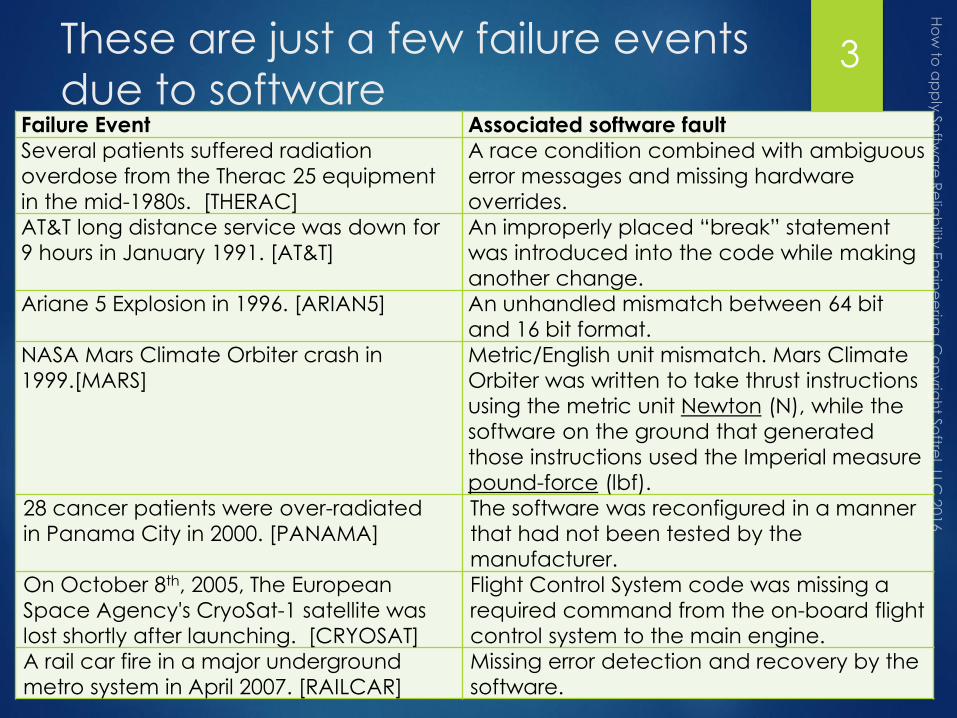
These are just a few failure events
due to softwareFailure Event Associated software fault
Several patients suffered radiation
overdose from the Therac 25 equipment
in the mid-1980s. [THERAC]
A race condition combined with ambiguous
error messages and missing hardware
overrides.
AT&T long distance service was down for
9 hours in January 1991. [AT&T]
An improperly placed “break” statement
was introduced into the code while making
another change.
Ariane 5 Explosion in 1996. [ARIAN5] An unhandled mismatch between 64 bit
and 16 bit format.
NASA Mars Climate Orbiter crash in
1999.[MARS]
Metric/English unit mismatch. Mars Climate
Orbiter was written to take thrust instructions
using the metric unit Newton (N), while the
software on the ground that generated
those instructions used the Imperial measure
pound-force (lbf).
28 cancer patients were over-radiated
in Panama City in 2000. [PANAMA]
The software was reconfigured in a manner
that had not been tested by the
manufacturer.
On October 8th, 2005, The European
Space Agency's CryoSat-1 satellite was
lost shortly after launching. [CRYOSAT]
Flight Control System code was missing a
required command from the on-board flight
control system to the main engine.
A rail car fire in a major underground
metro system in April 2007. [RAILCAR]
Missing error detection and recovery by the
software.
3

Software reliability timeline 4
1960’s 1970’s 1980’s 1990’s
1962 First
recorded
system
failure due
to software
Many software reliability estimation models
developed.
Main obstacle – can’t be used until late in life cycle.
1968
The term
“software
reliability” is
invented.
First publicly available
model to predict
software reliability early in
lifecycle developed by
USAF Rome Air
Development Center with
SAIC and Research
Triangle Park –
Main obstacles – model
only useful for aircraft and
model never updated
after 1992.
SoftRel, LLC
develops
models based
on RL model
but usable on
all
applications
A few proprietary models
developed
2000’s
IEEE 1633
Rewritten to
be practical

IEEE 1633 Recommended
Practices for Software Reliability
Chaired by Ann Marie Neufelder, Softrel, LLC
Vice Chaired by Martha Wetherholt, NASA WHQ
Every branch of DoD, NASA, NRC, major defense
contractors, medical device industry, participated in
development/approval of document
Revised the 2008 edition which was poorly received as it
was written for academic audience
Document received 100% approval on first IEEE ballot on
5/24/16
Document will be formally approved by IEEE on 9/16/16,
and released by end of year
5
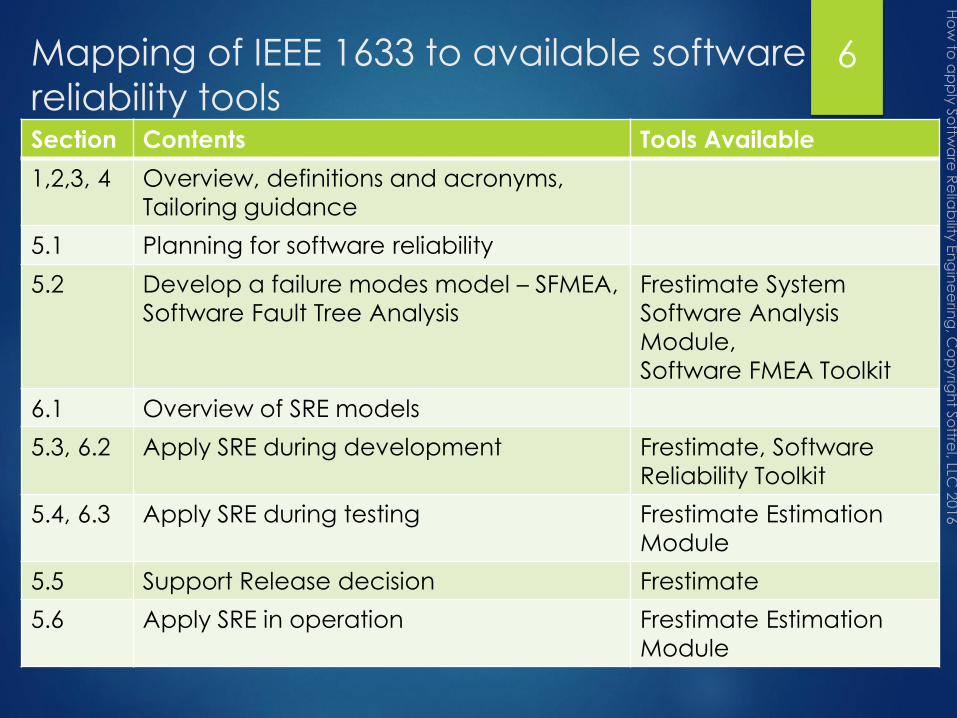
Mapping of IEEE 1633 to available software
reliability toolsSection Contents Tools Available
1,2,3, 4 Overview, definitions and acronyms,
Tailoring guidance
5.1 Planning for software reliability
5.2 Develop a failure modes model – SFMEA,
Software Fault Tree Analysis
Frestimate System
Software Analysis
Module,
Software FMEA Toolkit
6.1 Overview of SRE models
5.3, 6.2 Apply SRE during development Frestimate, Software
Reliability Toolkit
5.4, 6.3 Apply SRE during testing Frestimate Estimation
Module
5.5 Support Release decision Frestimate
5.6 Apply SRE in operation Frestimate Estimation
Module
6

Table of contents for this
presentation7
Section Contents
1 Planning for software reliability
2 Develop a failure modes model – SFMEA, Software Fault Tree
Analysis, Root Cause Analysis
3 Overview of SRE models
4 Apply software reliability during development
5 Apply software reliability during testing
6 Support Release decision
7 Apply software reliability in operation

Planning for Software
ReliabilitySECTION 1
8

Before using any models it’s
prudent to do some planning1. What are the software Line Replaceable Units in your system?
Today’s systems have many software LRUs – not just one
SRE can be applied to in-house developed software, COTS, FOSS, GFS, and firmware
2. System specific failure definition and scoring criteria is an essential first step. The more specific the definitions, the better.
3. Perform an initial risk assessment
Can the software effect safety?
How mature is the product and target hardware?
Is the actual size of the software always bigger than expected or planned?
Is the actual reliability growth always smaller than planned?
Are the releases spaced so close together that defects are piling up from one release to the next?
Is this the very first deployed version of this software for this product?
Do we have the right people developing the software throughout the development process?
Is there a key technology change during software development?
9
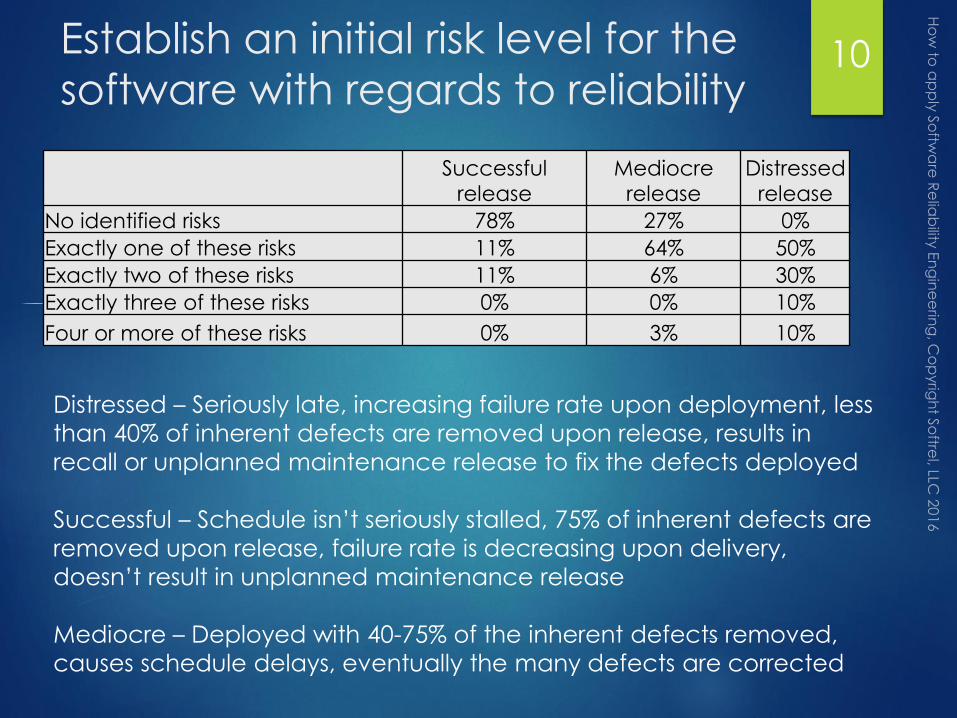
Establish an initial risk level for the
software with regards to reliability
Successful release
Mediocre release
Distressed release
No identified risks 78% 27% 0%
Exactly one of these risks 11% 64% 50%
Exactly two of these risks 11% 6% 30%
Exactly three of these risks 0% 0% 10%
Four or more of these risks 0% 3% 10%
10
Distressed – Seriously late, increasing failure rate upon deployment, less
than 40% of inherent defects are removed upon release, results in
recall or unplanned maintenance release to fix the defects deployed
Successful – Schedule isn’t seriously stalled, 75% of inherent defects are
removed upon release, failure rate is decreasing upon delivery,
doesn’t result in unplanned maintenance release
Mediocre – Deployed with 40-75% of the inherent defects removed,
causes schedule delays, eventually the many defects are corrected
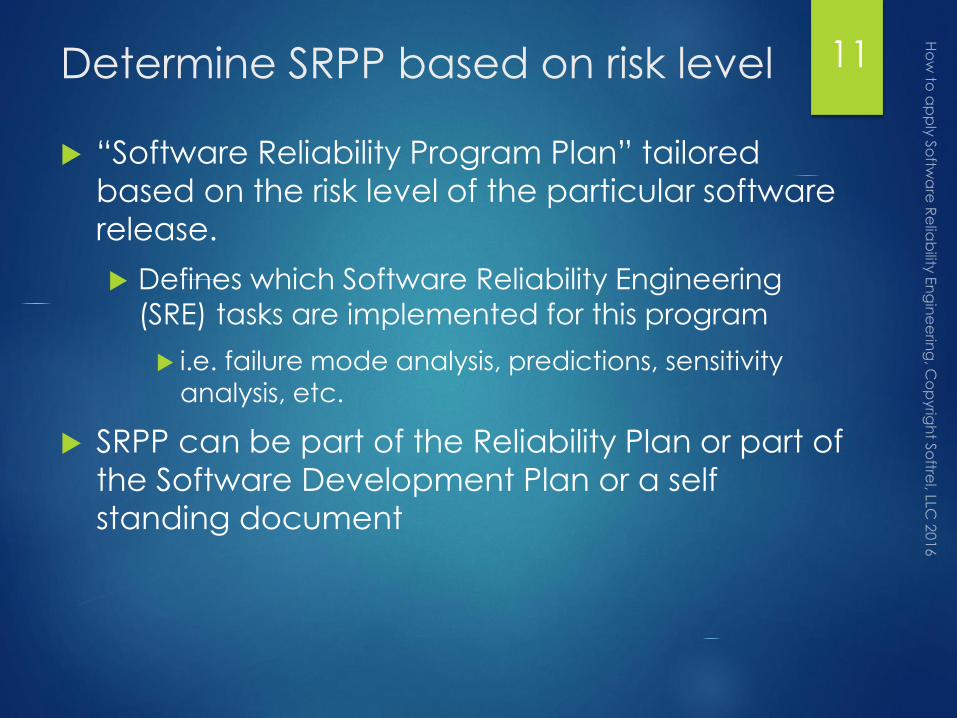
Determine SRPP based on risk level
“Software Reliability Program Plan” tailored
based on the risk level of the particular software
release.
Defines which Software Reliability Engineering
(SRE) tasks are implemented for this program
i.e. failure mode analysis, predictions, sensitivity
analysis, etc.
SRPP can be part of the Reliability Plan or part of
the Software Development Plan or a self
standing document
11

Develop a failure modes model
– SFMEA, Software Fault Tree
AnalysisSECTION 2
12

Software FMEA and Software
Fault Tree Analysis
Requirements , interfaces, design ,
code, users manuals, installation scripts,
changes to the design and code
Failure Modes
Events
SFMEA
works
this way
These are
visible to end
users
These are
visible to
software
engineers.
FTA
Works
this
way
13

General guidance for when to use
a SFMEA versus a SFTA versus bothSelection characteristic SFTA SFMEA Both
Small number of clearly defined top level hazards
Interest in identifying failures that are due to a combination of events, including events caused by both software and hardware
Very large or complex system with a lot of code
The detailed design/code have not been started yet
The SRS does not describe very well how the software should handle negative behavior or hazardous events
A symptom is known but not the failure modes or top level effects
Brand new technology or product. System level hazards not completely understood
Interest in identifying failure modes and/or single point failures
The product is mature but the code is suspect
The personnel available for the analyses have more experience with the software than with the system
14

Key benefits of Software FMEAs
Many software systems fail when deployed because the engineers
did not consider what the software should “Not” do
SFMEA is one of 2 analyses for identifying the failure space so often
overlooked
Useful for early identification of
Defects that easier to see when looking at the design or code but
difficult to see during testing
i.e. can be used to improve the efficiency of design or code reviews
Single point failures due to software
Defects that cannot be addressed by redundancy or other hardware
controls
Abnormal behavior that might be missing from the requirements or
design specifications
Unwritten assumptions
Features that need fault handling design
Addressing one failure mode could mean eliminating several
failures
15
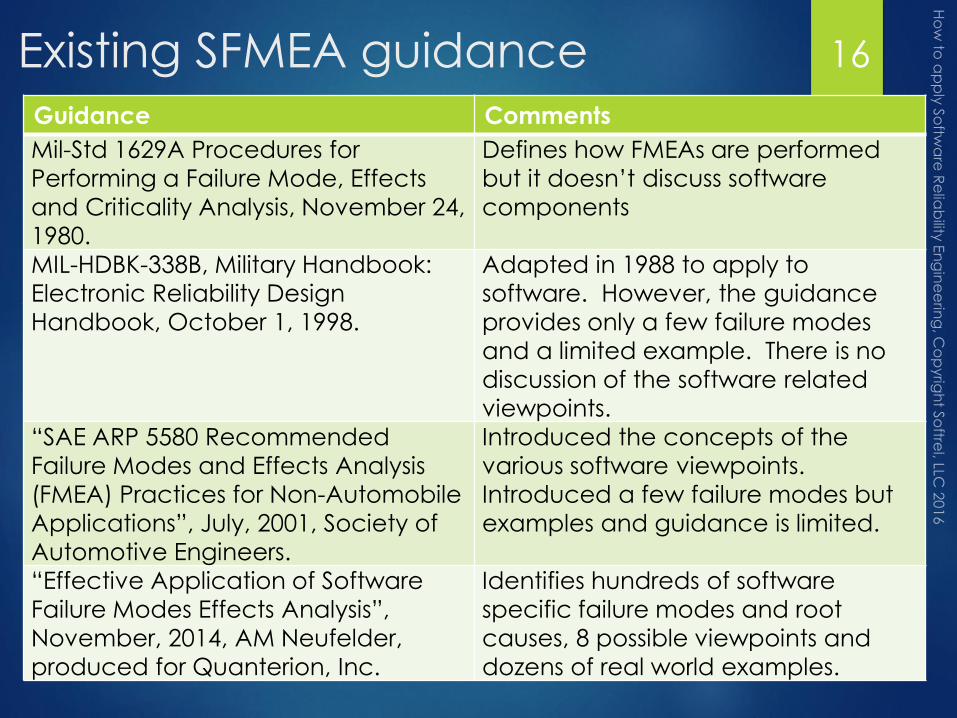
Existing SFMEA guidanceGuidance Comments
Mil-Std 1629A Procedures for
Performing a Failure Mode, Effects
and Criticality Analysis, November 24,
1980.
Defines how FMEAs are performed
but it doesn’t discuss software
components
MIL-HDBK-338B, Military Handbook:
Electronic Reliability Design
Handbook, October 1, 1998.
Adapted in 1988 to apply to
software. However, the guidance
provides only a few failure modes
and a limited example. There is no
discussion of the software related
viewpoints.
“SAE ARP 5580 Recommended
Failure Modes and Effects Analysis
(FMEA) Practices for Non-Automobile
Applications”, July, 2001, Society of
Automotive Engineers.
Introduced the concepts of the
various software viewpoints.
Introduced a few failure modes but
examples and guidance is limited.
“Effective Application of Software
Failure Modes Effects Analysis”,
November, 2014, AM Neufelder,
produced for Quanterion, Inc.
Identifies hundreds of software
specific failure modes and root
causes, 8 possible viewpoints and
dozens of real world examples.
16
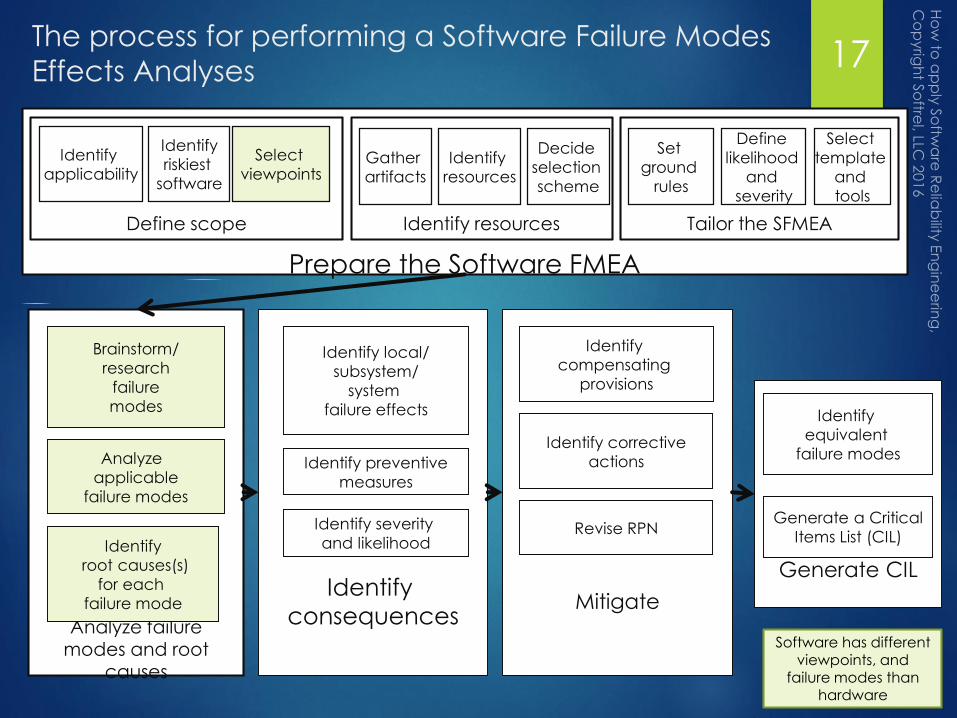
The process for performing a Software Failure Modes
Effects Analyses
Generate CIL
MitigateAnalyze failure
modes and root causes
Prepare the Software FMEA
Identify
resources
Brainstorm/
research
failure
modesIdentify
equivalent
failure modes
Identify
consequences
Identify local/
subsystem/
system
failure effects
Identify severity
and likelihood
Identify corrective
actionsIdentify preventive
measures
Identify
compensating
provisions
Analyze
applicable
failure modes
Identify
root causes(s)
for each
failure mode
Generate a Critical
Items List (CIL)
Identify
applicability
Set
ground
rules
Select
viewpoints
Identify
riskiest
software
Gather
artifacts
Define
likelihood
and
severity
Select
template
and
tools
Revise RPN
Decide
selection
scheme
Define scope Identify resources Tailor the SFMEA
Software has different viewpoints, and
failure modes than hardware
17
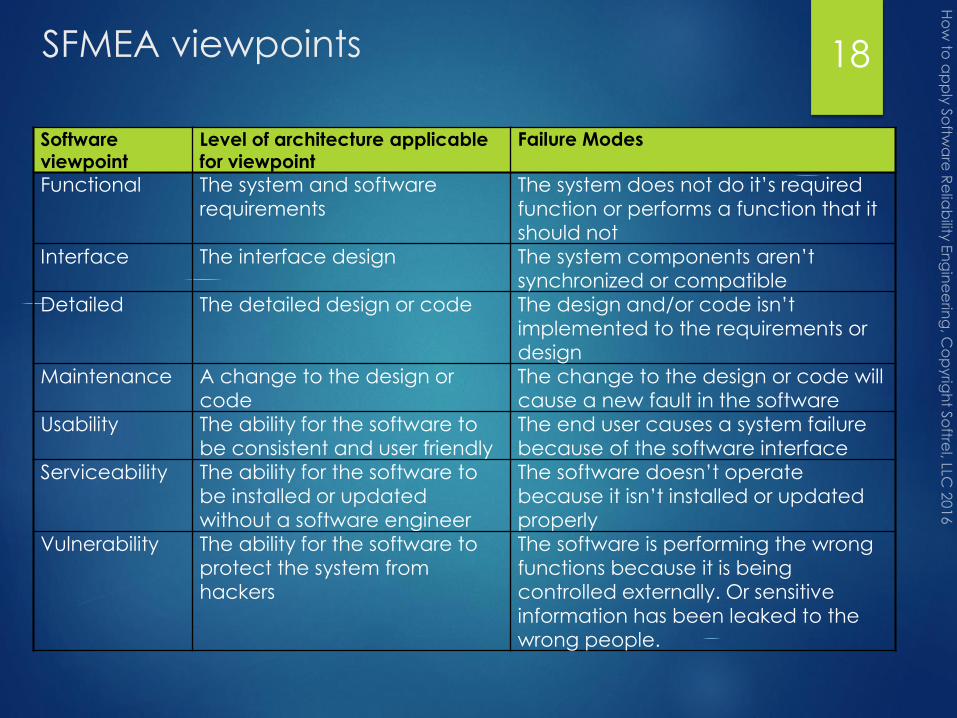
SFMEA viewpoints
Software viewpoint
Level of architecture applicable for viewpoint
Failure Modes
Functional The system and software
requirements
The system does not do it’s required
function or performs a function that it
should not
Interface The interface design The system components aren’t
synchronized or compatible
Detailed The detailed design or code The design and/or code isn’t
implemented to the requirements or
design
Maintenance A change to the design or
code
The change to the design or code will
cause a new fault in the software
Usability The ability for the software to
be consistent and user friendly
The end user causes a system failure
because of the software interface
Serviceability The ability for the software to
be installed or updated
without a software engineer
The software doesn’t operate
because it isn’t installed or updated
properly
Vulnerability The ability for the software to
protect the system from
hackers
The software is performing the wrong
functions because it is being
controlled externally. Or sensitive
information has been leaked to the
wrong people.
18

Applicability of each of the viewpoints
FMEA When this viewpoint is relevant
Functional Any new system or any time there is a new or updated
set of requirements.
Interface Anytime there is complex hardware and software
interfaces or software to software interfaces.
Detailed Almost any type of system is applicable. Most useful for
mathematically intensive functions.
Maintenance An older legacy system which is prone to errors
whenever changes are made.
Usability Anytime user misuse can impact the overall system
reliability.
Serviceability Any software that is mass distributed or installed in
difficult to service locations.
Vulnerability The software is at risk from hacking or intentional abuse.
19

Failure modes associated with each viewpoint
Failure mode
categories
Description
Fu
nc
tio
na
l
Inte
rfa
ce
De
taile
d
Ma
inte
na
nc
e
Usa
bility
Vu
lne
rab
ility
Se
rvic
ea
bility
Faulty functionality The software provides the incorrect functionality or fails to provide required functionality
X X X
Faulty timing The software or parts of it execute too early or too late or the software responds too quickly or too sluggishly
X X X
Faulty sequence/ order
A particular event is initiated in the incorrect order or not at all.
X X X X X
Faulty data Data is corrupted, incorrect, in the incorrect units, etc.
X X X X X
Faulty error detection and/or recovery
Software fails to detect or recover from a failure in the system
X X X X X
False alarm Software detects a failure when there is none X X X X XFaulty synchronization
The parts of the system aren’t synchronized or communicating.
X X
Faulty Logic There is complex logic and the software executes the incorrect response for a certain set of conditions
X X X X
Faulty Algorithms/Computations
A formula or set of formulas does not work for all possible inputs
X X X X
20

Failure modes associated with each viewpoint
Failure mode
categories
Description
Fu
nc
tio
na
l
Inte
rfa
ce
De
taile
d
Ma
inte
na
nc
e
Usa
bility
Vu
lne
rab
ility
Se
rvic
ea
bility
Memory
management
The software runs out of memory or runs
too slowly
X X X
User makes
mistake
The software fails to prohibit incorrect
actions or inputs
X
User can’t
recover from
mistake
The software fails to recover from
incorrect inputs or actions
X
Faulty user
instructions
The user manual has the incorrect
instructions or is missing instructions
needed to operate the software
X
User misuses or
abuses
An illegal user is abusing system or a legal
user is misusing system
X X
Faulty
Installation
The software installation package installs
or reinstalls the software improperly
requiring either a reinstall or a downgrade
X X
21

Software Fault Tree Analysis
Why are they used on software?
When there is an intermittent problem in operation and the
root cause cannot be determined
To identify what the software should NOT be doing which
helps to define the exception handling requirements
To identify events that are caused by combinations of
defects/root causes such as interactions between HW and
SW
What’s different between HW and SW fault trees?
Mechanically, software fault trees work the same as
hardware fault trees.
The major differences is the types of events and modes that
appear on the tree.
The software FTA should be an integrated into the system FTA. Otherwise, interactions between software and
hardware won’t be analyzed.
22

This is the overview of how to
include software in the system FTA
Plan the SFTA
Brainstorm
System
Failure
Events
Place each event at the
top of a tree and describe
in past tense
Brainstorm sub-events due to software
(see next page)
Place event on tree and
describe in past tense
Use the risk/severity to rank mitigation effort or
Determine probability of each top level event
Revise the applicable
Requirements or design
Gather
Applicable
Product
Documents
such as
requirements
and design
23
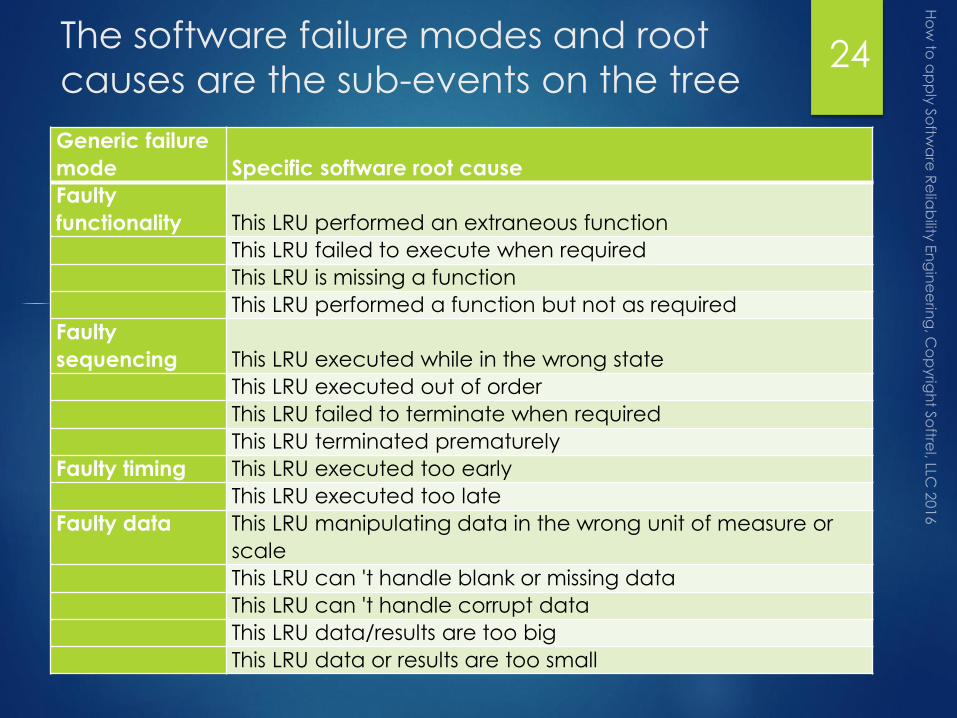
The software failure modes and root
causes are the sub-events on the tree
Generic failure
mode Specific software root cause
Faulty
functionality This LRU performed an extraneous function
This LRU failed to execute when required
This LRU is missing a function
This LRU performed a function but not as required
Faulty
sequencing This LRU executed while in the wrong state
This LRU executed out of order
This LRU failed to terminate when required
This LRU terminated prematurely
Faulty timing This LRU executed too early
This LRU executed too late
Faulty data This LRU manipulating data in the wrong unit of measure or
scale
This LRU can 't handle blank or missing data
This LRU can 't handle corrupt data
This LRU data/results are too big
This LRU data or results are too small
24

The software failure modes are
the sub-events on the treeGeneric failure
mode Specific root cause
Faulty error
handling This LRU generated a false alarm
This LRU A failure in the hardware, system or
software has occurred
A failure in the
hardware, system
or software has
occurred
This LRU detected a system failure but provided
an incorrect recovery
This LRU failed to detect errors in the incoming
data, hardware, software, user or system
Faulty processing This LRU consumed too many resources while executing
This LRU was unable to communicate/interface with the rest of the
system
Faulty usability This LRU caused the user to make a mistake
This LRU User made mistake because of user manual
This LRU failed to prevent common human mistakes
This LRU allowed user to perform functions that they should not perform
This LRU prevented user from performing functions that they should be
allowed to perform
Faulty
serviceability This LRU installed improperly
This LRU updated improperly
This LRU is the wrong version or is outdated
25

Example of these failure modes on the system fault tree26

Overview of SRE modelsSECTION 3
27

Overview of SRE Models
Software reliability can be predicted before the code is written,
estimated during testing and calculated once the software is fielded
28
Prediction/
Assessment
Reliability Growth Models
Used before code is written
•Predictions can be
incorporated into the
system RBD
•Supports planning
•Supports sensitivity analysis
•A few models have been
available since 1987 due to
expense
Used during system level testing or
operation
•Determines when to stop testing
•Validates prediction
•Less useful than prediction for planning
and avoiding problematic releases
•Many models have been developed
since 1970s of which only a few are
useful.
Section of IEEE 1633 Recommended Practices for
Software Reliability, 2016
5.3 5.4

Limitations of each type of modeling
All are based on historical actual
data
All generate a prediction by
calibrating current project
against historical project(s)
Accuracy depends on
How similar historical data is to
current project
Application type
Product stability (version 1
versus version 50)
Capabilities of the
development team
How current the historical data is
How much historical data exists
All are based on extrapolating
an existing trend into the future
Accuracy depends on
Test coverage
Low test coverage usually
results in optimistic results
How closely actual trend
matches assumed trend
i.e. if model assumes a
logarithmic trend is that the
actual trend?
How closely the model
assumptions match actual
Defect removal
Defect independence
29
PREDICTION/ASSESSMENT MODELS RELIABILITY GROWTH MODELS

Apply Software Reliability
during developmentSECTION 4
30
Software reliability prediction/assessment
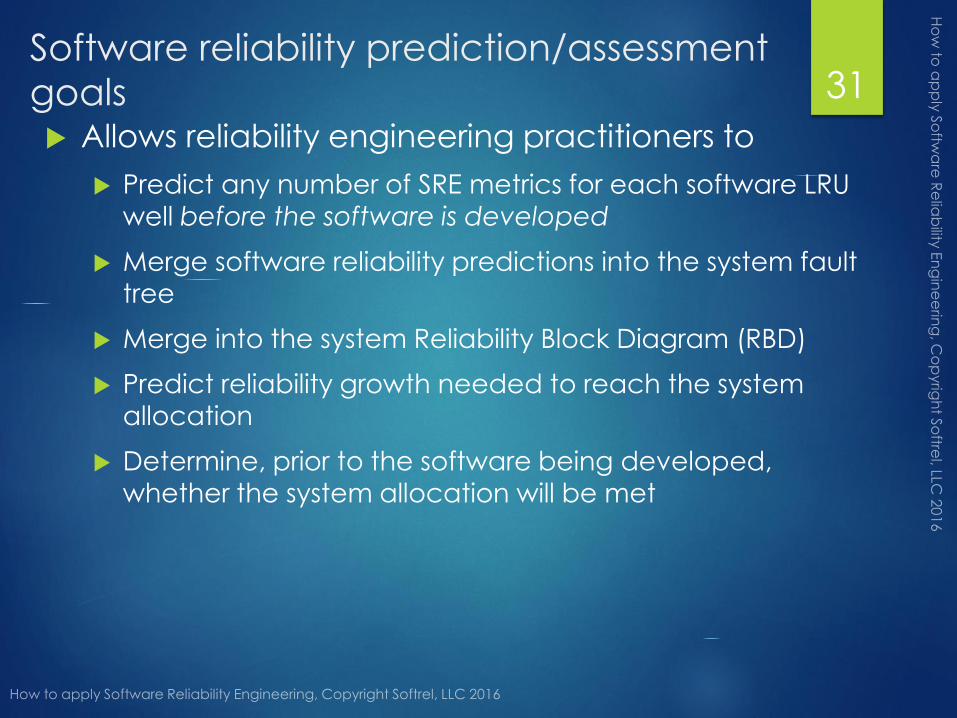
goals Allows reliability engineering practitioners to
Predict any number of SRE metrics for each software LRU well before the software is developed
Merge software reliability predictions into the system fault
tree
Merge into the system Reliability Block Diagram (RBD)
Predict reliability growth needed to reach the system
allocation
Determine, prior to the software being developed, whether the system allocation will be met
31

Software reliability prediction/assessment
goals Allows software and engineering management to
Benchmark SRE to others in same industry
Predict probability of late delivery
Predict improvement scenarios
Analyze sensitivity between development practices and
reliability and perform tradeoffs
Identify practices that are effective for improving SRE
Identify practices that aren’t effective for improving SRE (every
moment spent on an ineffective practice is a moment that’s not
spent on an effective practice)
Predict optimal spacing between releases so as to
avoid defect pileup which directly effects software reliability
ensure that there is adequate SRE growth across software releases
Determine how many people are needed to support the
software once deployed
32
Industry approved framework for
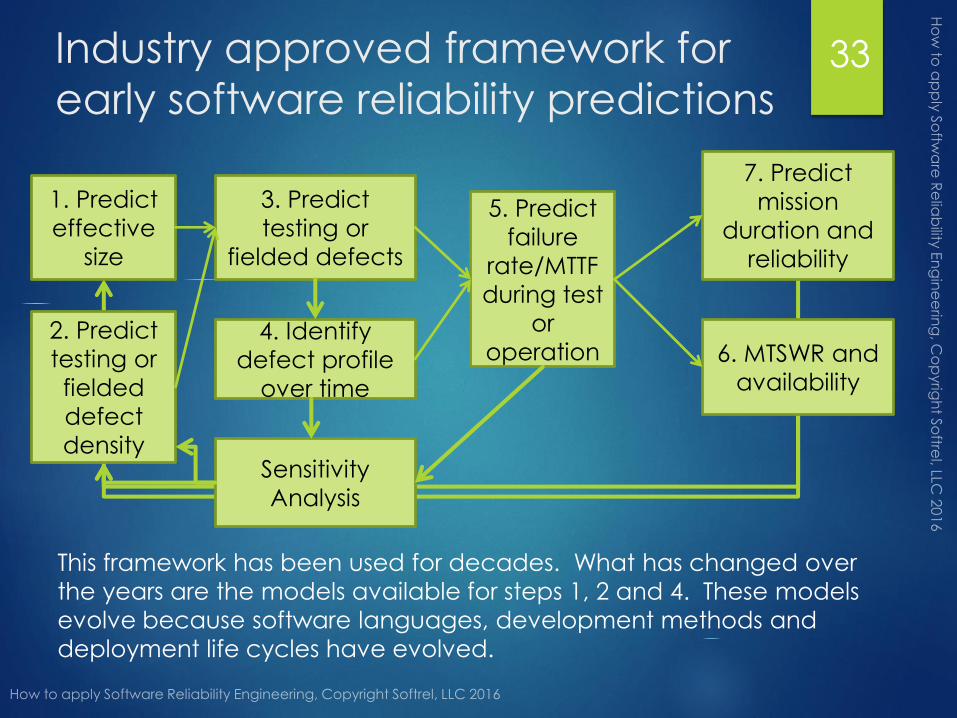
early software reliability predictions33
1. Predict
effective
size
2. Predict
testing or
fielded
defect
density
3. Predict
testing or
fielded defects
5. Predict
failure
rate/MTTF
during test
or
operation4. Identify
defect profile
over time
7. Predict
mission
duration and
reliability
6. MTSWR and
availability
Sensitivity
Analysis
This framework has been used for decades. What has changed over
the years are the models available for steps 1, 2 and 4. These models
evolve because software languages, development methods and
deployment life cycles have evolved.
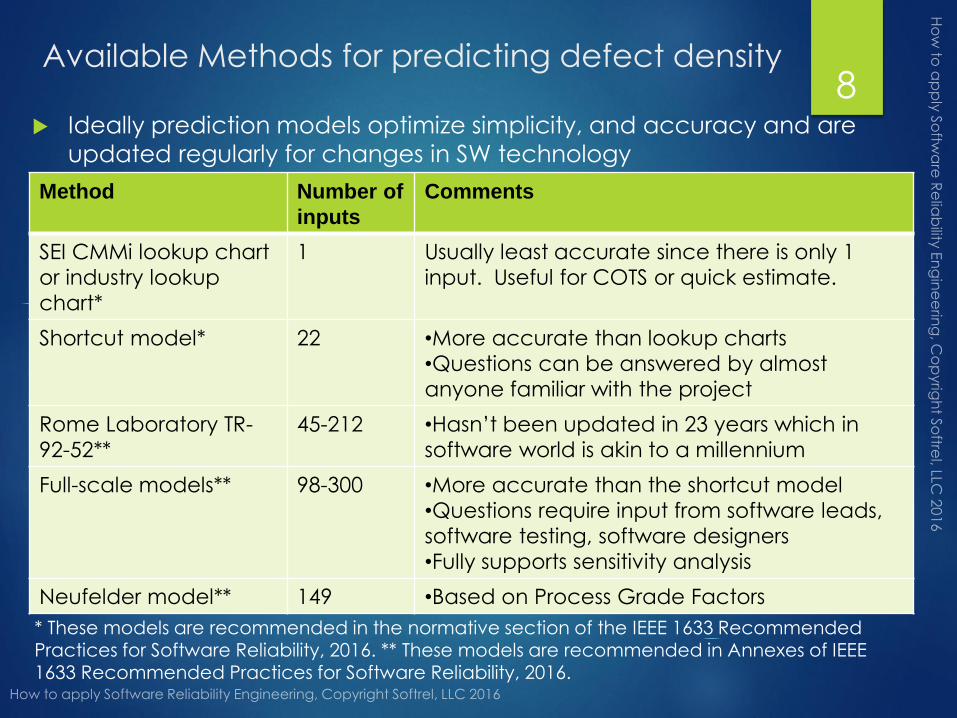
Available Methods for predicting defect density
Ideally prediction models optimize simplicity, and accuracy and are
updated regularly for changes in SW technology
Method Number of
inputs
Comments
SEI CMMi lookup chart
or industry lookup
chart*
1 Usually least accurate since there is only 1
input. Useful for COTS or quick estimate.
Shortcut model* 22 •More accurate than lookup charts
•Questions can be answered by almost
anyone familiar with the project
Rome Laboratory TR-
92-52**
45-212 •Hasn’t been updated in 23 years which in
software world is akin to a millennium
Full-scale models** 98-300 •More accurate than the shortcut model
•Questions require input from software leads,
software testing, software designers
•Fully supports sensitivity analysis
Neufelder model** 149 •Based on Process Grade Factors
8
* These models are recommended in the normative section of the IEEE 1633 Recommended Practices for Software Reliability, 2016. ** These models are recommended in Annexes of IEEE 1633 Recommended Practices for Software Reliability, 2016.

Predict any number of SRE metrics for each software
LRU well before the software is developed
Predict availability,
reliability, failure
rate, MTTF, MTBI,
MTBCF for each
software LRU as well
as all software LRUs
combined
35

Merge software predictions into
system RBD36
A particular software LRU is in series
with the particular hardware LRU
that it supports. Several software
LRUs such as COTS, Operating
System, firmware, etc. may be in
series with each other and the
hardware

Merge software predictions into
system fault tree37
Once the
predictions for
each software LRU
are complete,
they can be
merged into the
system FTA

Predict reliability growth needed
to reach the system allocation
The predictions are performed over a period of operational time
to allow the practitioner to determine how much growth is
needed to reach a specific objective
Adding new features in subsequent releases can effect the
objective
38
If the allocation for the software LRUs combined is 3500 hours MTTCF then
the allocation will be met after about 9
months into the first release and then about 4 months into the next
release.

Determine, prior to the software being
developed, whether the system allocation will
be met
The system allocation for the software is met when
The reliability growth needed to achieve the objective is feasible with the given plans for
Features to be implemented and their predicted size
Practices to be deployed during development and testing
If the allocation can not be met tradeoffs can be performed such as
Avoid reinventing the wheel (writing new code when you can purchase the same functions commercially) so as to decrease the size of the software to be developed
Postponing some features to a later version
Deploying more smaller less risky releases instead of bigger more risky releases
Implementing development practices that reduce defect density
39

Benchmark SRE to others in industry, Predict
probability of late delivery, Predict improvement
scenarios
40
Complete
assessment
and
calculate
score
If the software development organization could transition to the next percentile group…•Average defect reduction is about 55%•Average probability (late) reduction is about 25%
Assessment models provide for means to identify how to transition to the next percentile group
PredictedPercentile Group
World class
Distressed
Very good
Good
Average
Fair
Poor
1%
99%
10%
25%
50%
75%
90%
Score
PredictedNormalizedFieldedDefectDensity
PredictedProbability
latedelivery
.011
2.069
.060
.112
.205
.608
1.111
10%
100%
20%
25%
36%
85%
100%
Predict both defect density and probability of late delivery

Identify practices that are effective for improving
software reliability
Top ten factors quantitatively associated with better software reliability
1. Software engineers have product/industry domain expertise
2. Software engineers conduct formal white/clear box unit testing
3. Testers start writing test plans before any code is written
4. Management outsources features that aren’t in the organization’s line of business
5. Management avoids outsourcing features that are in organization’s line of business
6. No one skips the requirements, design, unit test or system testing even for small releases
7. Management plans ahead – even for small releases. Most projects are late because of
unscheduled defect fixes from the previous release (and didn’t plan on it)
8. Everyone avoids “Big Blobs” - big teams, long milestones - especially when there is a
large project
9. Pictures are used in the requirements and detailed design whenever possible
10. It is defined in writing what the software should NOT do
23

Identify practices that aren’t effective for
improving software reliabilityTop ten factors that aren’t quantitatively associated with improved reliability
1. Requirements, design and code reviews that don’t have a defined agenda and
criteria
2. Waiting until the code is done to decide how to test it
3. Focusing on style instead of function when doing product reviews
4. Using automated tools before you know how to perform the task manually
5. Too much emphasis on independent Software Quality Assurance organization
6. Too much emphasis on independent software test organization
7. Too much emphasis on the processes and not enough on the techniques and the
people
8. Misusing complexity metrics
9. Hiring software engineers based on their experience with a particular language instead
of with a particular industry
10. Using agile development as an excuse not to do the things you don’t want to do
23

Predict optimal spacing between releases to avoid defect
and ensure adequate SRE growth across software releases
This is an example of the predicted defect discovery profile predicted
over the next 4 releases.
One can visibly see that defects are predicted to “pile up”. Failure rate
is proportional to defect discovery so when one is ramping up so is the
other. The SRE for version 1 may be within the required range but future
releases may not be.
Predictions can be used to identify optimal spacing between releases so
as to avoid “defect pileup”.
43

Predict optimal spacing between releases to avoid
defect and ensure adequate SRE growth across
software releases
This is an example of a predicted defect discovery profile
that has been optimized
There is no pileup across releases
It supports a defined and repeatable maintenance staff as
discussed next
44
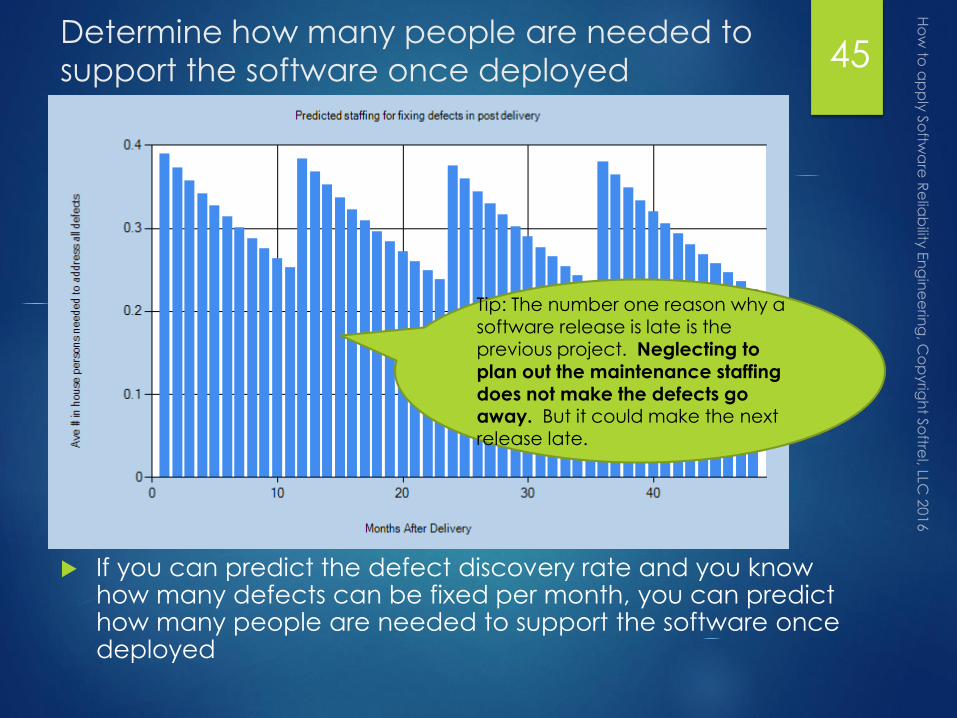
Determine how many people are needed to
support the software once deployed
If you can predict the defect discovery rate and you know how many defects can be fixed per month, you can predict how many people are needed to support the software once deployed
45
Tip: The number one reason why a
software release is late is the previous project. Neglecting to
plan out the maintenance staffing does not make the defects go away. But it could make the next release late.

Apply SRE during testing –
Reliability Growth ModelsSECTION 5
46

Overview
Reliability growth models have been in use since the 1970s for
software reliability
Thanks to the academic community the hundreds of models
developed
Have no real roadmap on how or when to use
Require data that isn’t feasible in a non-academic environment
Assume that the failure rate is decreasing
Yield the same or similar results
Don’t have methods to solve for parameters or compute confidence
This was resolved in the 2016 edition of the IEEE Recommended
Practices for Software Reliability.
Overview of the models
How to select the model(s)
When to use them and when not to
How to use with incremental development life cycle
47

Reliability Growth Model framework 48
1. Collect date
of software
failure, severity
and
accumulated
operational
hours between
failures
2. Plot the
data.
Determine if
failure rate is
increasing or
decreasing.
Observe
trends.
3. Select the
model(s) that
best fits the
current trend
4. Compute
failure rate,
MTBF, MTBCF,
reliability and
availability
5. Verify the
accuracy against
the next actual
time to failure.
Compute the
confidence.
Support
release
decision
New defects discovered in testing
6. Estimate
remaining defects
and test hours
required to reach
an objective

Collect data during software
system testing49
For each day during
software system testing
collect:1. # hours the software was in
operation (by all computers)
on that day (x)
2. # defects were discovered
on that day (f)
n = cumulative defects
t = cumulative hours

Plot the data
Fault rate (n/t) plotted on x axis
Cumulative defects (n) plotted on y axis
If plot has negative slope then fault rate is decreasing
These parameters are used by the models:
Y intercept = estimated inherent defects N0
X intercept = estimated initial failure rate l0
K = 1/slope
50

Example of increasing fault rate
In this example, the fault rate is increasing. This
means that most of the models can’t be used.
This is a common situation during the early part of
software testing
51
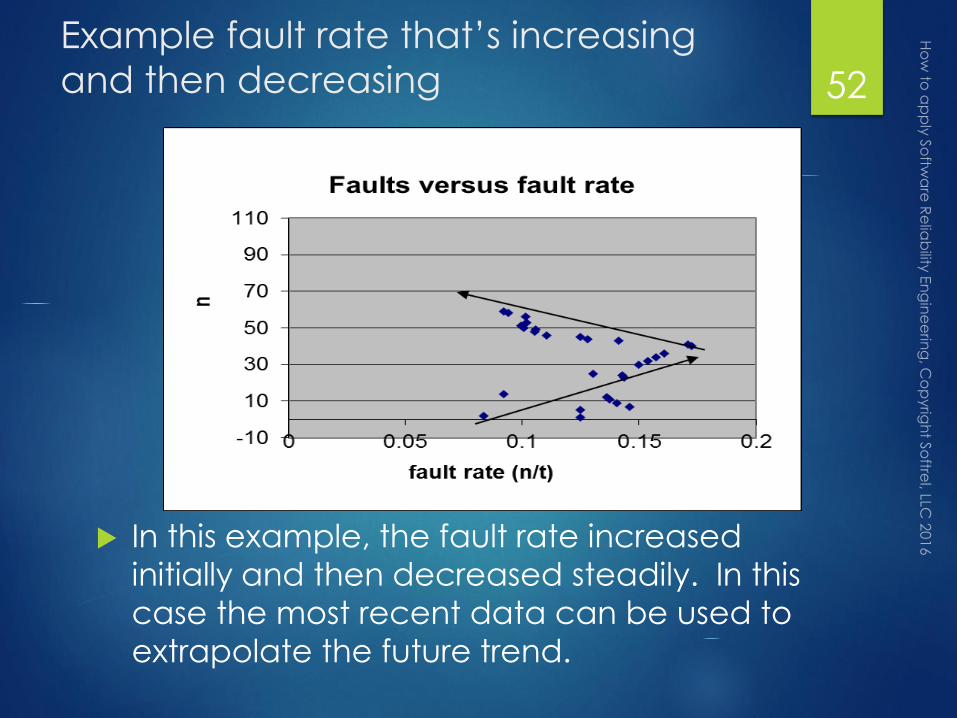
Example fault rate that’s increasing
and then decreasing
In this example, the fault rate increased
initially and then decreased steadily. In this
case the most recent data can be used to
extrapolate the future trend.
52
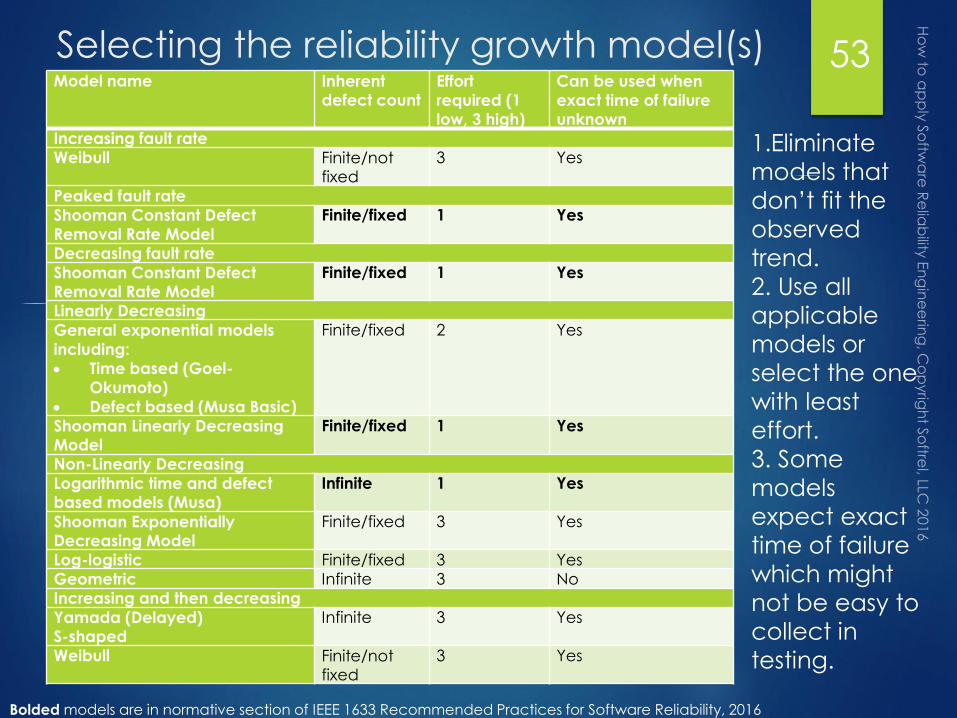
Selecting the reliability growth model(s)Model name Inherent
defect countEffort
required (1 low, 3 high)
Can be used when
exact time of failure unknown
Increasing fault rate
Weibull Finite/not fixed
3 Yes
Peaked fault rate
Shooman Constant Defect Removal Rate Model
Finite/fixed 1 Yes
Decreasing fault rate
Shooman Constant Defect Removal Rate Model
Finite/fixed 1 Yes
Linearly Decreasing
General exponential models
including:
Time based (Goel-
Okumoto)
Defect based (Musa Basic)
Finite/fixed 2 Yes
Shooman Linearly Decreasing Model
Finite/fixed 1 Yes
Non-Linearly Decreasing
Logarithmic time and defect based models (Musa)
Infinite 1 Yes
Shooman Exponentially Decreasing Model
Finite/fixed 3 Yes
Log-logistic Finite/fixed 3 Yes
Geometric Infinite 3 No
Increasing and then decreasing
Yamada (Delayed) S-shaped
Infinite 3 Yes
Weibull Finite/not fixed
3 Yes
53
1.Eliminate
models that
don’t fit the
observed
trend.
2. Use all
applicable
models or
select the one
with least
effort.
3. Some
models
expect exact
time of failure
which might
not be easy to
collect in
testing.
Bolded models are in normative section of IEEE 1633 Recommended Practices for Software Reliability, 2016

Compute failure rate, MTTF
with the 2 simplest modelsModel Estimated
remainingdefects
Estimated currentfailure rate
Estimatedcurrent MTBF
Estimated currentreliability
Defect
based
generalExponential
N0 - n l(n) = l0 (1-(n/N0)) The inverse of
the estimated failure rate
e-( l(n) * mission time)
Time based
generalExponential
l(t) = N0ke-kte-( l(t) * mission time)
54
N0, l0, k estimated graphically as shown earlier
n – cumulative defects discovered in testing to date
t – cumulative hours of operation in testing to date
Mission time – How long the software must operate to complete one
mission or cycle
Both models are in normative section of the IEEE 1633 Recommended
Practices for Software Reliability

Example with real data 55
N0 = 117.77
l0 = .137226
k = .001165
n=84 defects
discovered to
date
t=1628
operational
test hours to
date
y = -857.97x + 117.77
-60
-40
-20
0
20
40
60
80
100
120
140
0 0.05 0.1 0.15 0.2Cu
mu
lati
ve F
ault
s (n
)
Fault Rate n/t
Cumulative faults versus fault rate
X intercept = .137226Slope = 117.77/.137226k = .137225/117.77Y intercept = 117.77
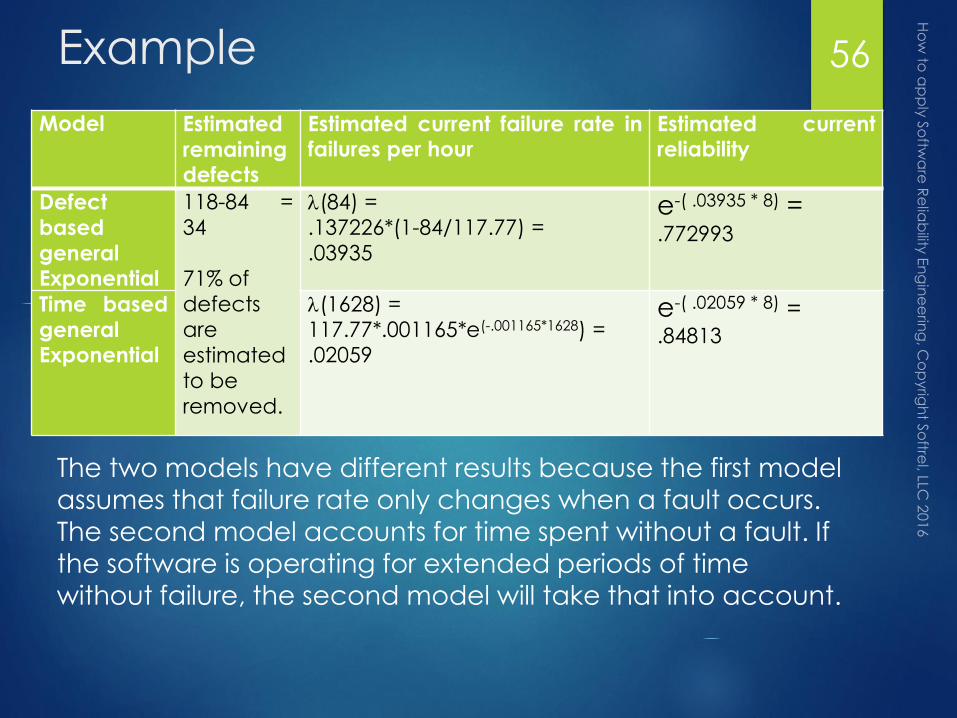
Example 56
The two models have different results because the first model
assumes that failure rate only changes when a fault occurs. The second model accounts for time spent without a fault. If
the software is operating for extended periods of time
without failure, the second model will take that into account.
Model Estimated
remainingdefects
Estimated current failure rate infailures per hour
Estimated currentreliability
Defect
based
generalExponential
118-84 =
34
71% of
defects
are
estimated
to be
removed.
l(84) = .137226*(1-84/117.77) =
.03935
e-( .03935 * 8) = .772993
Time based
generalExponential
l(1628) = 117.77*.001165*e(-.001165*1628) =.02059
e-( .02059 * 8) = .84813
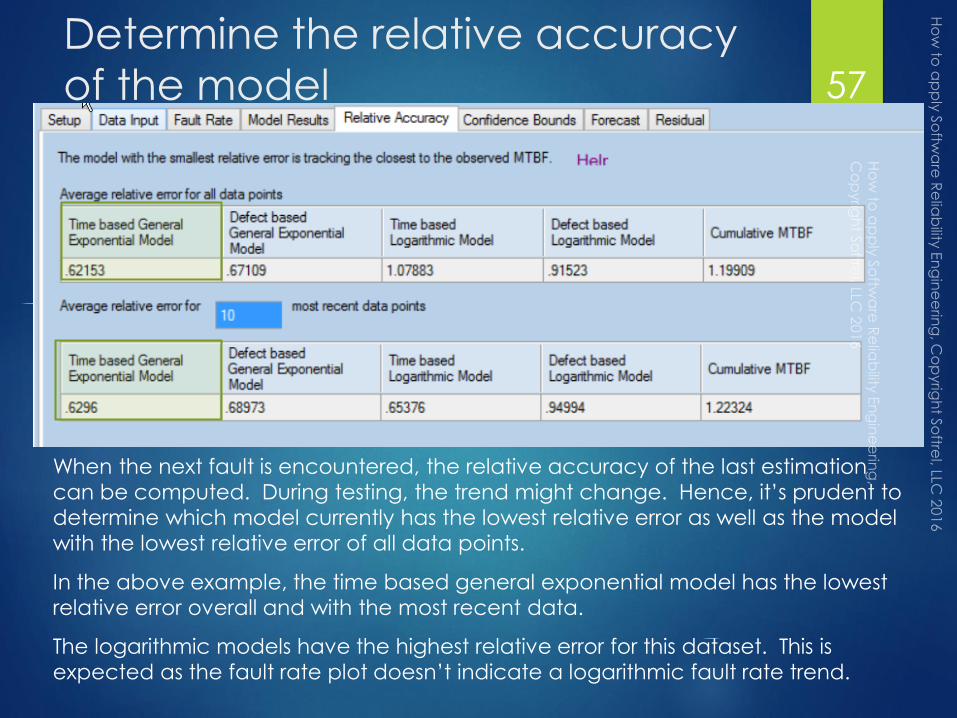
Determine the relative accuracy
of the model
When the next fault is encountered, the relative accuracy of the last estimation
can be computed. During testing, the trend might change. Hence, it’s prudent to
determine which model currently has the lowest relative error as well as the model
with the lowest relative error of all data points.
In the above example, the time based general exponential model has the lowest
relative error overall and with the most recent data.
The logarithmic models have the highest relative error for this dataset. This is
expected as the fault rate plot doesn’t indicate a logarithmic fault rate trend.
57
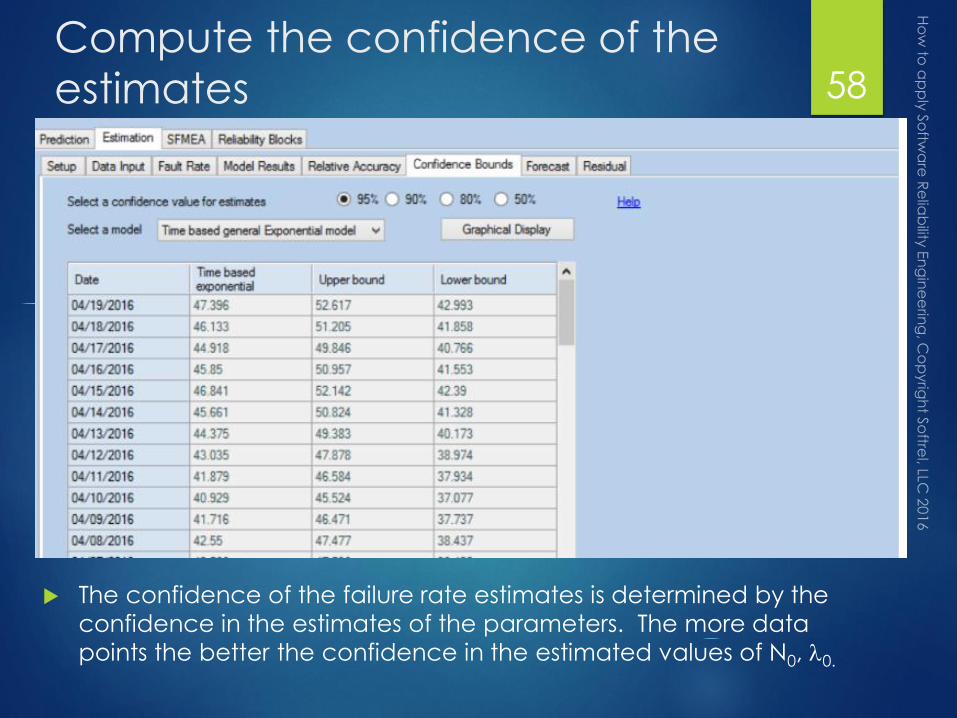
Compute the confidence of the
estimates
The confidence of the failure rate estimates is determined by the
confidence in the estimates of the parameters. The more data
points the better the confidence in the estimated values of N0, l0.
58
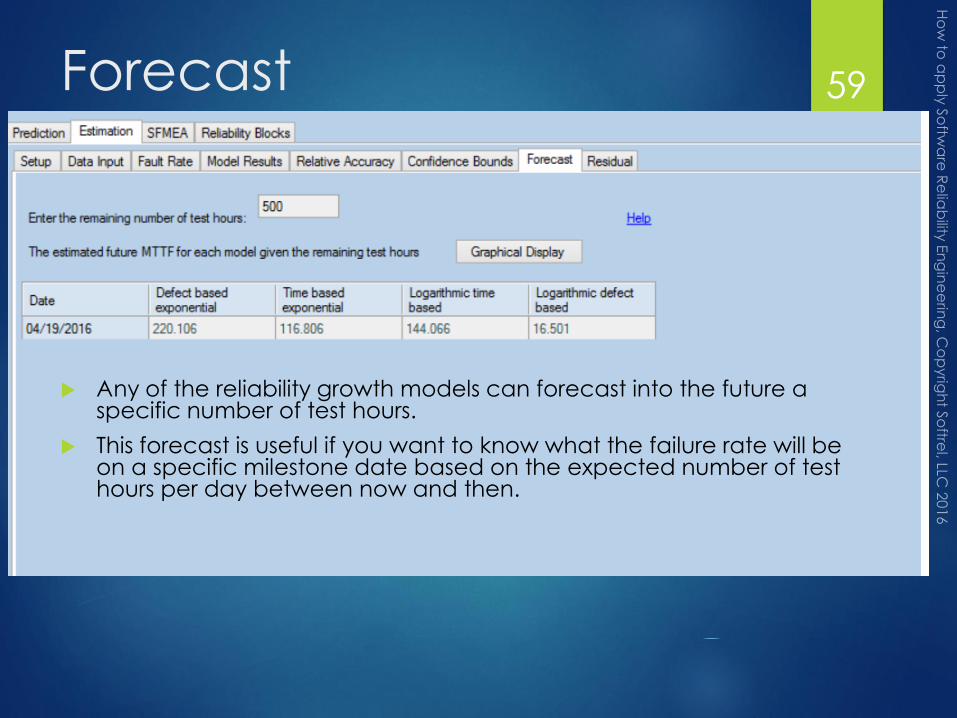
Forecast
Any of the reliability growth models can forecast into the future a specific number of test hours.
This forecast is useful if you want to know what the failure rate will be on a specific milestone date based on the expected number of test hours per day between now and then.
59

Estimate remaining defects or test
hours to reach an objective
You can determine how many more defects need to be found to reach a
specific MTBF objective
You can also determine how many more test hours are needed to reach
that objective (assuming that the discovered defects are corrected)
60
In this example, between 6 and 7
defects need to be found and removed
to meet the objective. Based on the current trend it will take about 767 hours to find those
defects.

Support release decisionSECTION 6
61
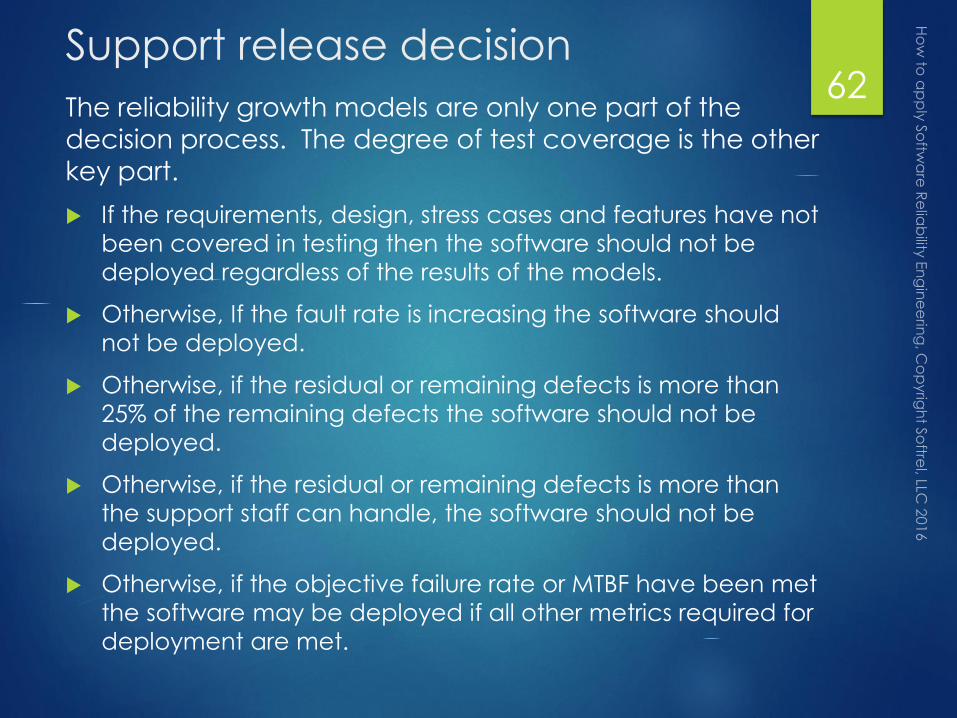
Support release decision
The reliability growth models are only one part of the
decision process. The degree of test coverage is the other
key part.
If the requirements, design, stress cases and features have not
been covered in testing then the software should not be
deployed regardless of the results of the models.
Otherwise, If the fault rate is increasing the software should
not be deployed.
Otherwise, if the residual or remaining defects is more than
25% of the remaining defects the software should not be
deployed.
Otherwise, if the residual or remaining defects is more than
the support staff can handle, the software should not be
deployed.
Otherwise, if the objective failure rate or MTBF have been met
the software may be deployed if all other metrics required for
deployment are met.
62

Apply software reliability
during operationSECTION 7
63
Apply SRE in operation
Once the software is deployed the actual
failure rate is computed directly from
Actual failures reported during some period of time
(such as a month)
Actual operational hours the software was used during
that period of time across all users and installed systems
The reliability growth models can be used with
operational data as well as testing data
64
Conclusions
Software reliability can be predicted before the code is
written using prediction/assessment models
It can be applied to COTS software as well as custom software
A variety of metrics can be predicted
The predictions can be used for sensitivity analysis and defect
reduction
Software reliability can be estimated during testing using the
reliability growth models
Used to determine when to stop testing
Used to quantify effort required to reach an objective
Used to quantify staffing required to support the software once
deployed
65

Frequently Asked Questions
Can I predict the software reliability when there is an agile or incremental software development lifecycle?
Yes, your options are
You can use the models for each internal increment and then combine the results of each internal increment to yield a prediction for each field release
You can add up the code size predicted for each increment and do a prediction for the field release based on sum of all increment sizes
How often are the predictions updated during development?
Whenever the size estimates have a major change or whenever there is a major review
The surveys are not updated once complete unless it is known that something on the survey has changed
i.e. there is a major change in staffing, tools or other resource during development, etc.
66
Frequently Asked Questions
Which prediction models are preferred?
The ones that you can complete accurately and the ones
that reflect your application type
If you can’t answer most of the questions in a particular
mode survey then you shouldn’t use that model
If the application lookup charts don’t have your application
type you shouldn’t use them
67
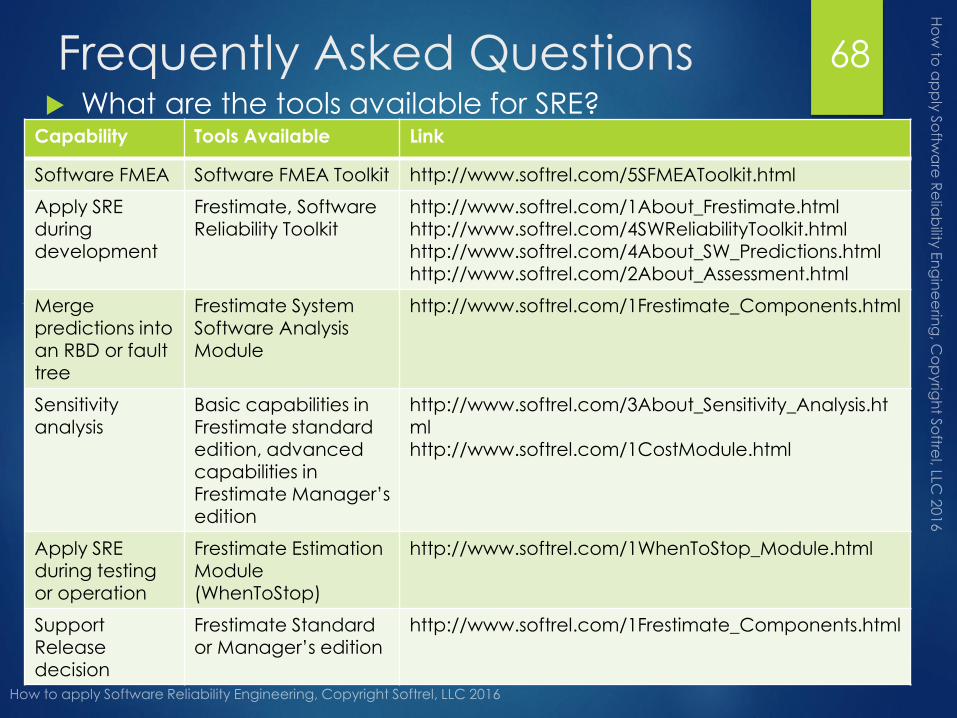
Frequently Asked Questions What are the tools available for SRE?
68
Capability Tools Available Link
Software FMEA Software FMEA Toolkit http://www.softrel.com/5SFMEAToolkit.html
Apply SRE during development
Frestimate, Software Reliability Toolkit
http://www.softrel.com/1About_Frestimate.htmlhttp://www.softrel.com/4SWReliabilityToolkit.htmlhttp://www.softrel.com/4About_SW_Predictions.htmlhttp://www.softrel.com/2About_Assessment.html
Merge predictions into an RBD or fault tree
Frestimate System Software Analysis Module
http://www.softrel.com/1Frestimate_Components.html
Sensitivity analysis
Basic capabilities in Frestimate standard edition, advanced capabilities in Frestimate Manager’s edition
http://www.softrel.com/3About_Sensitivity_Analysis.htmlhttp://www.softrel.com/1CostModule.html
Apply SRE during testing or operation
Frestimate EstimationModule (WhenToStop)
http://www.softrel.com/1WhenToStop_Module.html
Support Release decision
Frestimate Standard or Manager’s edition
http://www.softrel.com/1Frestimate_Components.html

References
[1] “The Cold Hard Truth About Reliable Software”, A.
Neufelder, SoftRel, LLC, 2014
[2]Four references are
a) J. McCall, W. Randell, J. Dunham, L. Lauterbach, Software
Reliability, Measurement, and Testing Software Reliability and Test
Integration RL-TR-92-52, Rome Laboratory, Rome, NY, 1992
b) "System and Software Reliability Assurance Notebook", P. Lakey,
Boeing Corp., A. Neufelder, produced for Rome Laboratory, 1997.
c) Section 8 of MIL-HDBK-338B, 1 October 1998
d) Keene, Dr. Samuel, Cole, G.F. “Gerry”, “Reliability Growth of
Fielded Software”, Reliability Review, Vol 14, March 1994.
69

Related Terms
Error
Related to human mistakes made while developing the software
Ex: Human forgets that b may approach 0 in algorithm c = a/b
Fault or defect
Related to the design or code
Ex: This code is implemented without exception handling “c = a/b;”
Defect rate is from developer’s perspective
Defects measured/predicted during testing or operation
Defect density = defects/normalized size
Failure
An event
Ex: During execution the conditions are so that the value of b
approaches 0 and the software crashes or hangs
Failure rate is from system or end user’s perspective
KSLOC
1000 source lines of code – common measure of software size
70

Backup SlidesADDITIONAL DETAILS ABOUT MODELS
71

Prediction/Assessment
steps
72

Industry approved framework for
early software reliability predictions73
1. Predict
effective
size
2. Predict
testing or
fielded
defect
density
3. Predict
testing or
fielded defects
5. Predict
failure
rate/MTTF
during test
or
operation4. Identify
defect profile
over time
7. Predict
mission
duration and
reliability
6. MTSWR and
availability
Sensitivity
Analysis
This framework has been used for decades. What has changed over
the years are the models available for steps 1, 2 and 4. These models
evolve because software languages, development methods and
deployment life cycles have evolved.

1. Predict size
If everything else is equal, more code means more
defects
For in house software
Predict effective size of new, modified and reused code using best
available industry method
For COTS software (assuming vendor can’t provide
effective size estimates)
Determine installed application size in KB (only EXEs and DLLs)
Convert application size to KSLOC using industry conversion
Assess reuse effectiveness by using default multiplier of 1%
Accounts for fact that COTS has been fielded to multiple sites
7

2. Predict defect density
Ideally prediction models optimize simplicity, and accuracy and are
updated regularly for changes in SW technology
Method Number of
inputs
Comments
SEI CMMi lookup chart
or industry lookup
chart*
1 Usually least accurate since there is only 1
input. Useful for COTS or quick estimate.
Shortcut model* 22 •More accurate than lookup charts
•Questions can be answered by almost
anyone familiar with the project
Rome Laboratory TR-
92-52**
45-212 •Hasn’t been updated in 23 years which in
software world is akin to a millennium
Full-scale models** 98-300 •More accurate than the shortcut model
•Questions require input from software leads,
software testing, software designers
•Fully supports sensitivity analysis
Neufelder model** 149 •Based on Process Grade Factors
8
* These models are recommended in the normative section of the IEEE 1633 Recommended Practices for Software Reliability, 2016. ** These models are recommended in Annexes of IEEE 1633 Recommended Practices for Software Reliability, 2016.

3. Predict testing or fielded defects
Defects can be predicted as follows
Testing defect density * Effective size = Defects predicted to be found
during testing (Entire yellow area)
Fielded defect density * Effective size = Defects predicted to be found in
operation (Entire red area)
Defects predicted after system testing
Defects predicted
during system testing
0
2
4
6
8
10
12
Defects over life of version
12
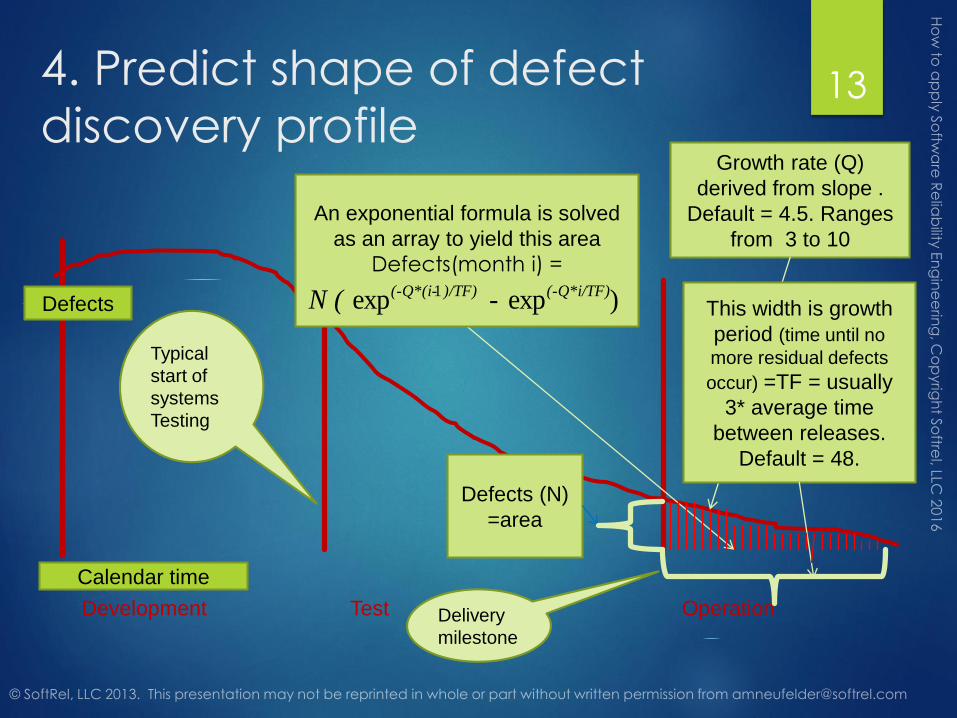
4. Predict shape of defect
discovery profileGrowth rate (Q)
derived from slope .
Default = 4.5. Ranges
from 3 to 10
Development Test Operation
Defects
Calendar time
This width is growth
period (time until no
more residual defects
occur) =TF = usually
3* average time
between releases.
Default = 48.
An exponential formula is solved
as an array to yield this area
Defects(month i) =
Defects (N)
=area
Typical
start of
systems
Testing
Delivery
milestone
- N ( (-Q*i/TF))/TF)(-Q*(i- )expexp 1
13
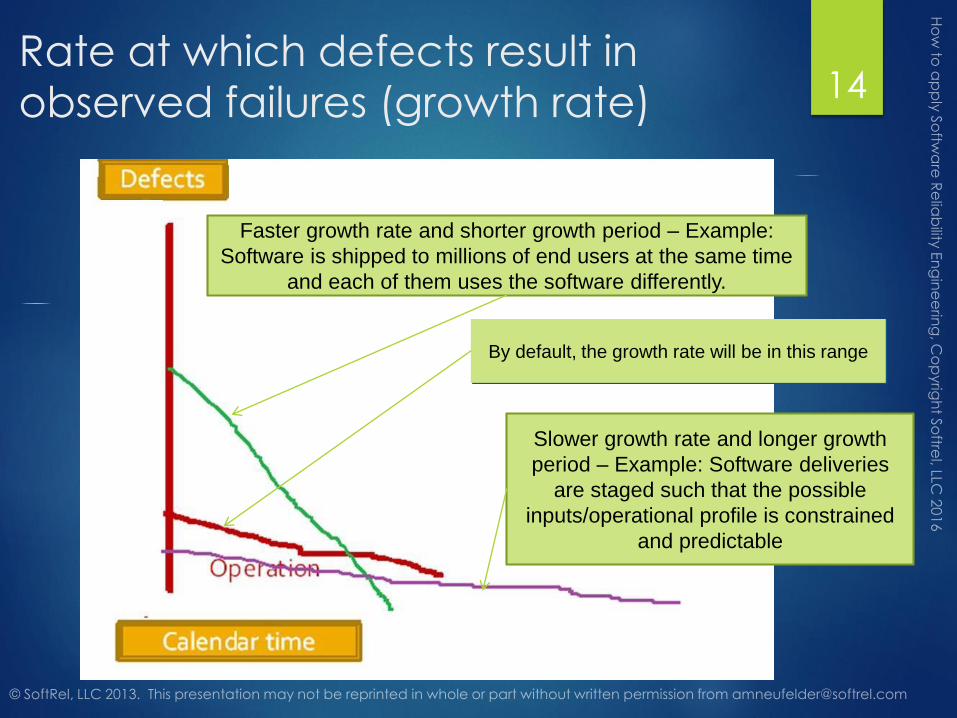
Rate at which defects result in
observed failures (growth rate)
Faster growth rate and shorter growth period – Example:
Software is shipped to millions of end users at the same time
and each of them uses the software differently.
Slower growth rate and longer growth
period – Example: Software deliveries
are staged such that the possible
inputs/operational profile is constrained
and predictable
By default, the growth rate will be in this range
14

5. Use defect discovery profile to predict
failure rate/MTTF
Dividing defect profile by duty cycle profile yields a prediction of
failure rate as shown next
Ti= duty cycle for month i - how much the software is operated during
some period of calendar time. Ex:
If software is operating 24/7 ->duty cycle is 730 hours per month
If software operates during normal working hours ->duty cycle is
176 hours per month
MTTF i=
MTTCF i
% severe = % of all fielded defects that are predicted to impact availability
i
i
ileDefectprofsevere
T
*%
i
i
ileDefectprof
T
15
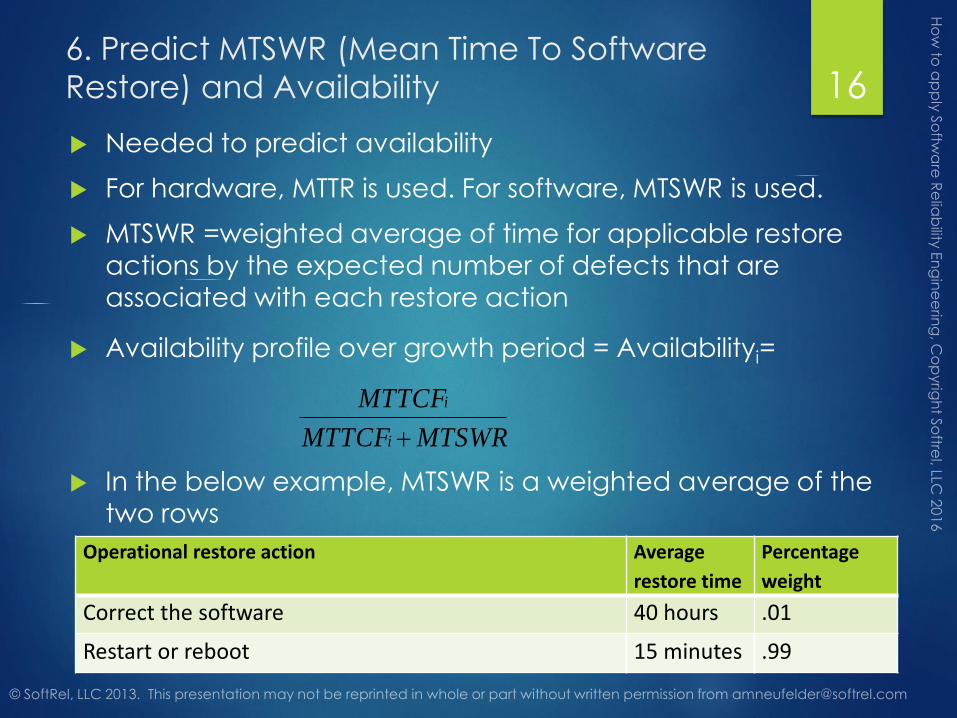
6. Predict MTSWR (Mean Time To Software
Restore) and Availability
Needed to predict availability
For hardware, MTTR is used. For software, MTSWR is used.
MTSWR =weighted average of time for applicable restore
actions by the expected number of defects that are
associated with each restore action
Availability profile over growth period = Availabilityi=
In the below example, MTSWR is a weighted average of the
two rows
Operational restore action Average
restore time
Percentage
weight
Correct the software 40 hours .01
Restart or reboot 15 minutes .99
MTSWRMTTCF
MTTCF
i
i
16

7. Predict mission time and reliability
Reliability profile over growth period =
Ri= exp(-mission time/ MTTCFi)
Mission time = how long the software will take to
perform a specific operation or mission
Not to be confused with duty cycle or testing time
Example: A typical dishwasher cycle is 45 minutes. The software is not executing outside of this time, so reliability is
computed for the 45 minute cycle.
81
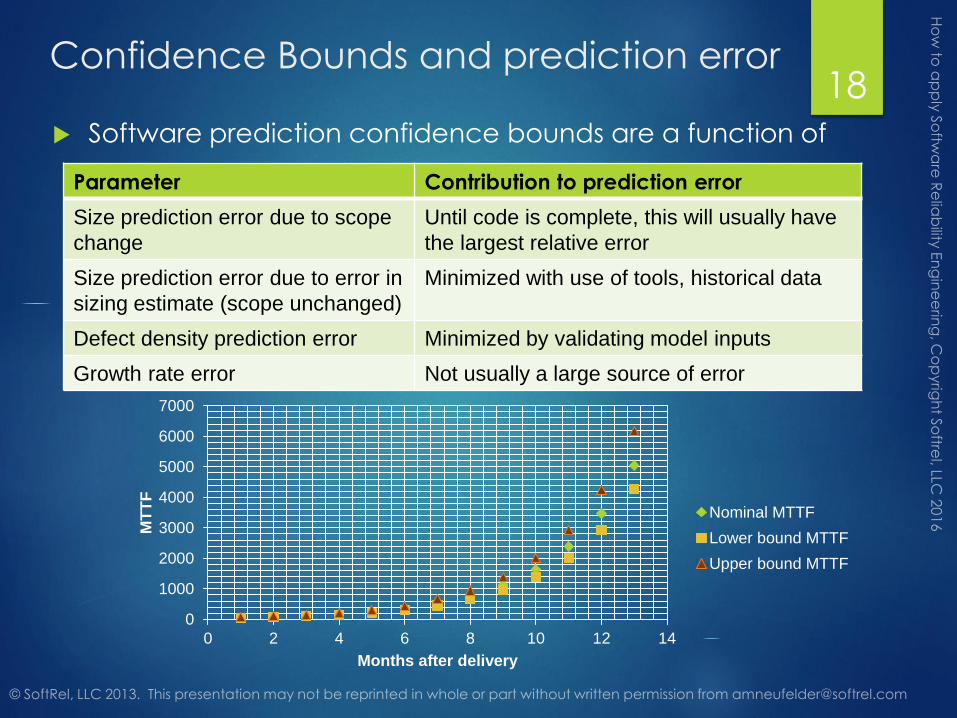
Confidence Bounds and prediction error
Software prediction confidence bounds are a function of
0
1000
2000
3000
4000
5000
6000
7000
0 2 4 6 8 10 12 14
MT
TF
Months after delivery
Nominal MTTF
Lower bound MTTF
Upper bound MTTF
Parameter Contribution to prediction error
Size prediction error due to scope
change
Until code is complete, this will usually have
the largest relative error
Size prediction error due to error in
sizing estimate (scope unchanged)
Minimized with use of tools, historical data
Defect density prediction error Minimized by validating model inputs
Growth rate error Not usually a large source of error
18