sql server performance tuning
TRANSCRIPT

SQL Server
Performance Tuning
SQL Server Profiler & Execute Plan

Agenda
• 如何觀察SQL Server的效能瓶頸
• 使用SQL Profiler來觀察SQL Server的運作
• Execution Plan怎麼看?
• 從Execution Plan來診斷SQL Statement效能瓶頸
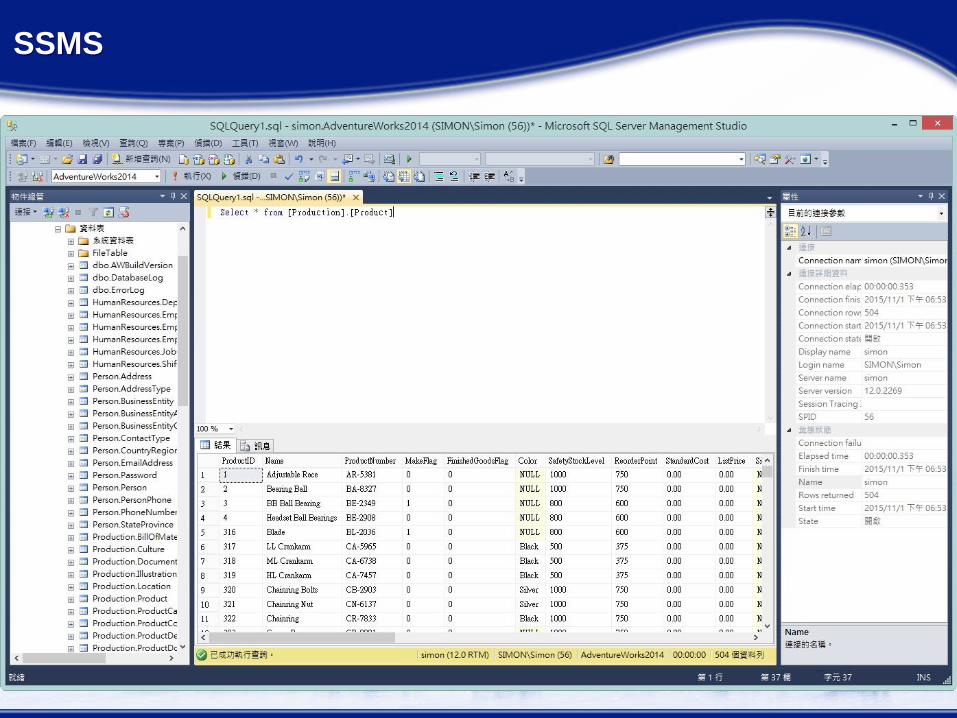
SSMS
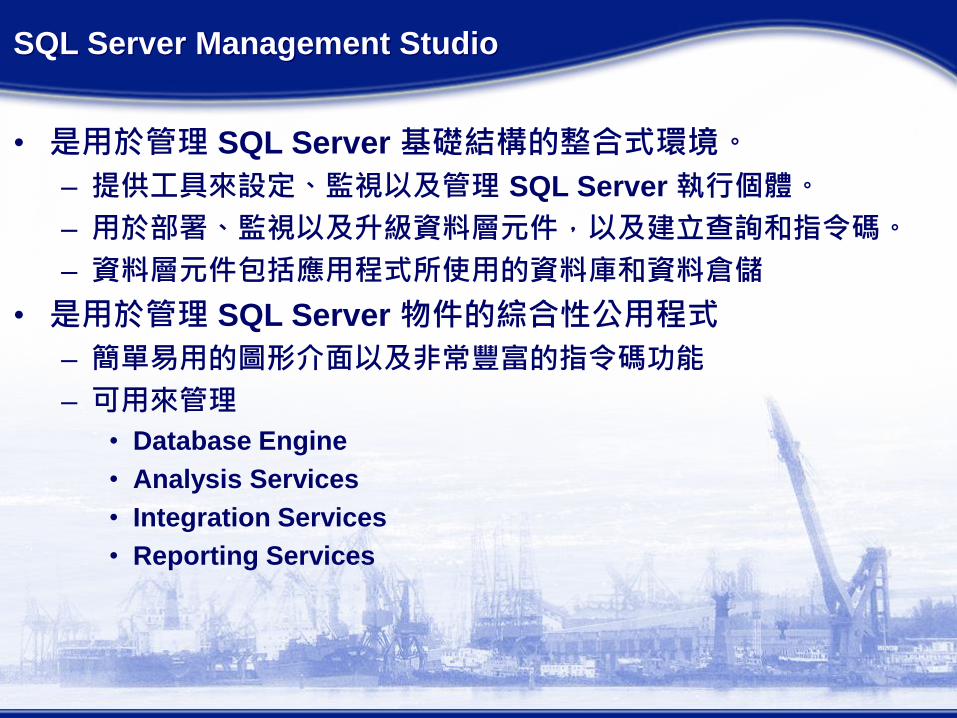
SQL Server Management Studio
• 是用於管理 SQL Server 基礎結構的整合式環境。
– 提供工具來設定、監視以及管理 SQL Server 執行個體。
– 用於部署、監視以及升級資料層元件,以及建立查詢和指令碼。
– 資料層元件包括應用程式所使用的資料庫和資料倉儲
• 是用於管理 SQL Server 物件的綜合性公用程式
– 簡單易用的圖形介面以及非常豐富的指令碼功能
– 可用來管理
• Database Engine
• Analysis Services
• Integration Services
• Reporting Services

如何監視SQL Server效能

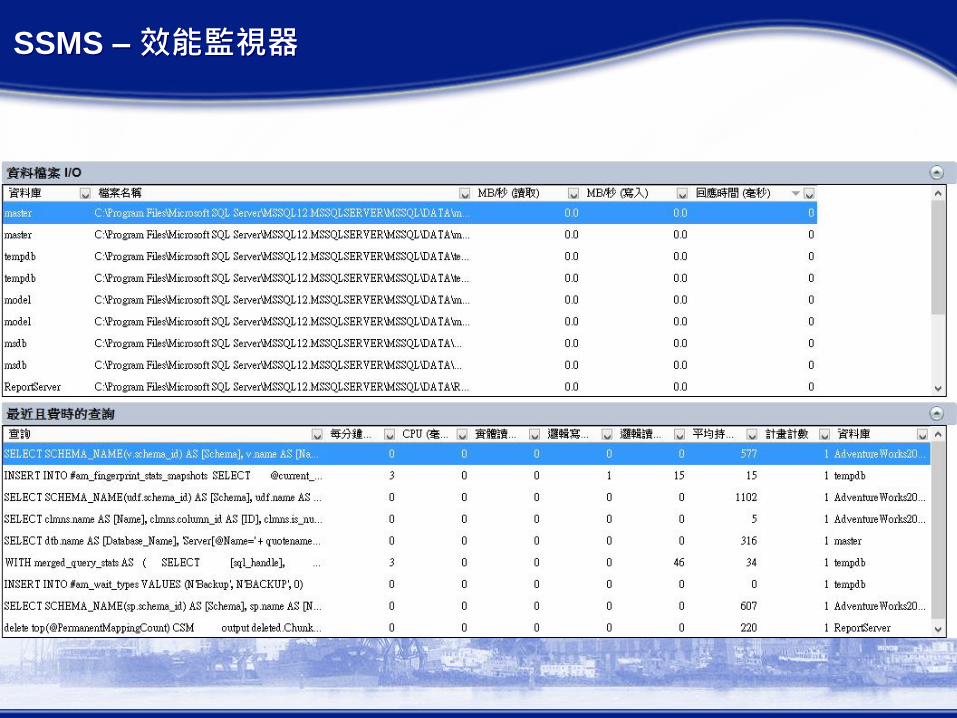
SSMS – 效能監視器 - 概觀
• 處理器時間: 佔用CPU%, 多核心伺服器顯示的是平均數
• 等候工作: 排在Queue裏等候CPU處理的Job數
• 資料庫I/O: 這是和資料庫存取有關的Disk I/O
• 批次要求數/秒: 每秒鐘要求SQL Server處理Job的次數

SSMS – 效能監視器
SSMS – 效能監視器

Windows效能監視工具
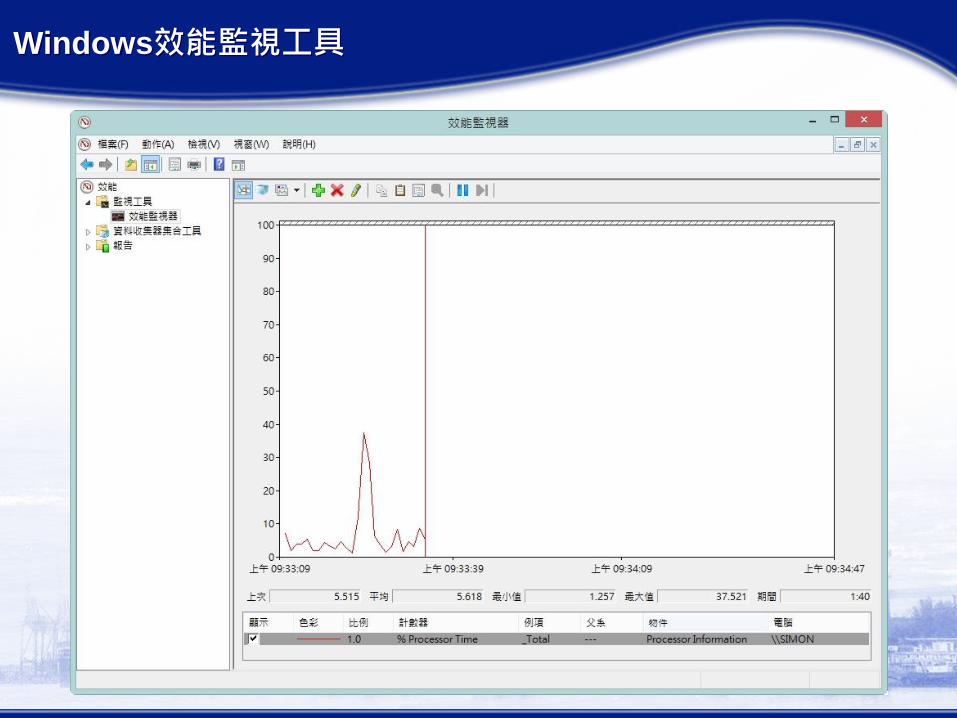
Windows效能監視工具

SQL Server Profiler
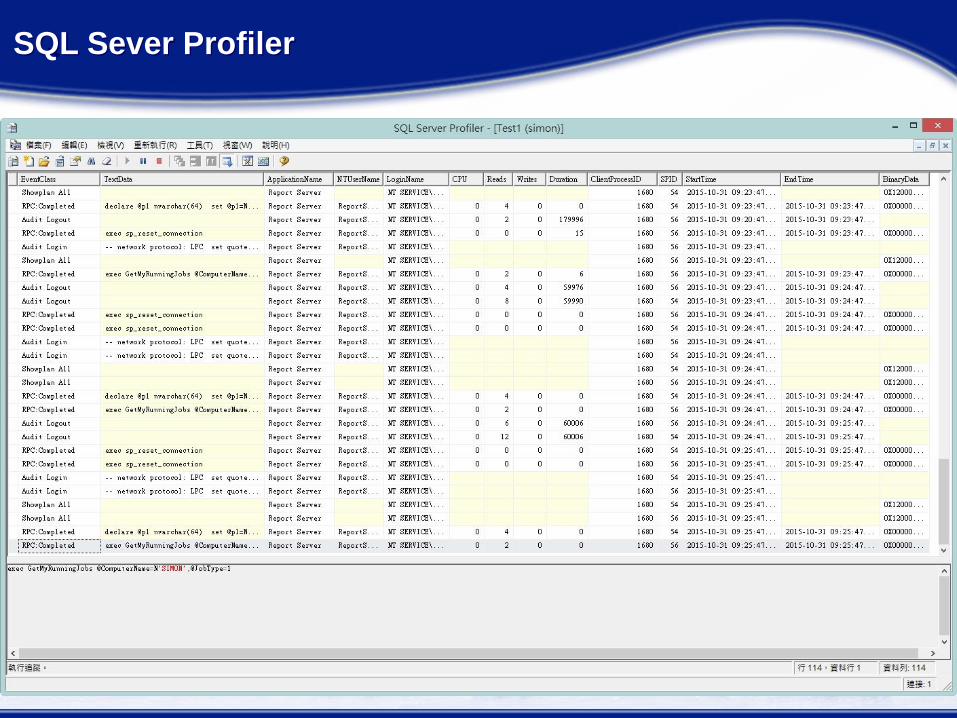
SQL Sever Profiler
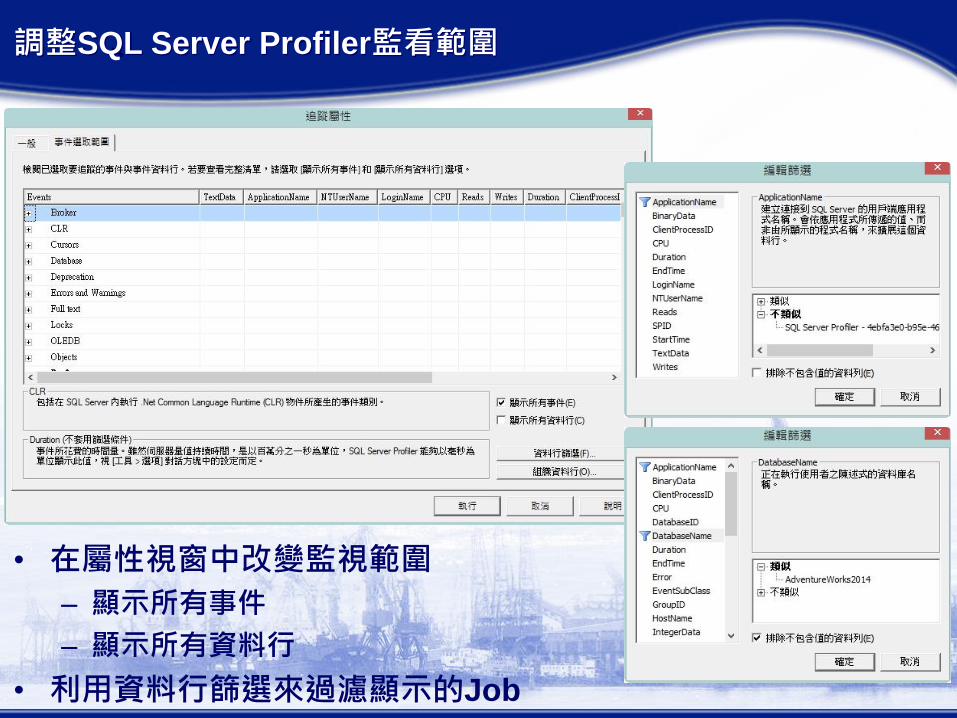
調整SQL Server Profiler監看範圍
• 在屬性視窗中改變監視範圍
– 顯示所有事件
– 顯示所有資料行
• 利用資料行篩選來過濾顯示的Job
Execution (Query) Plan
• SSMS提供線上即時Execution Plan
• Why Execution Plan
– When a query is submitted to the database, the query
optimizer evaluates some of the different, correct possible
plans for executing the query and returns what it considers
the best option.
– Because query optimizers are imperfect, database users and
administrators sometimes need to manually examine and
tune the plans produced by the optimizer to get better
performance.
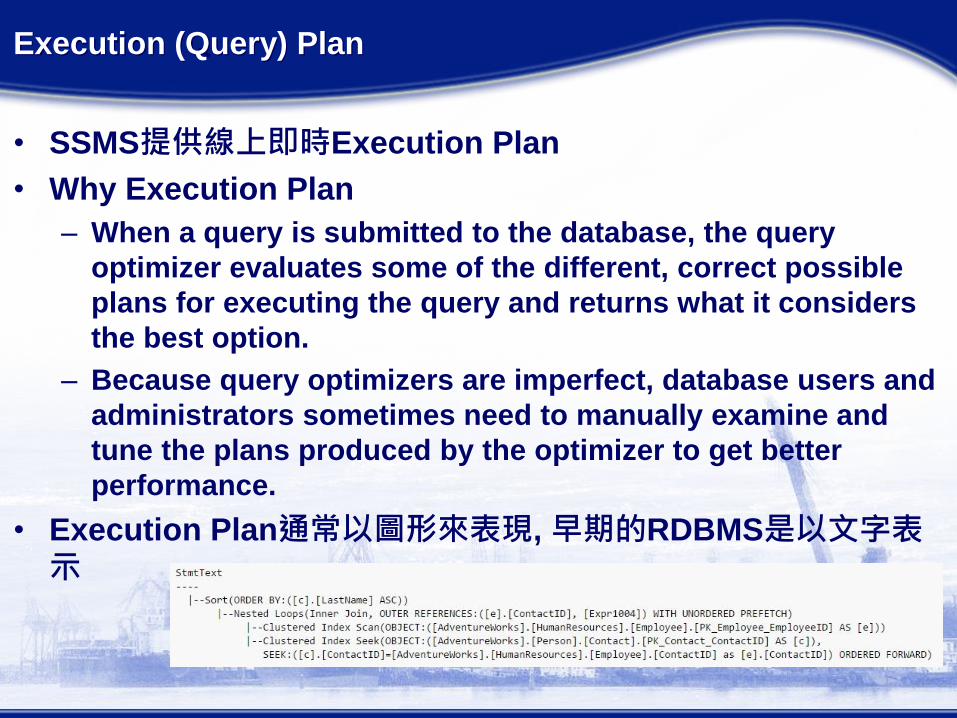
• Execution Plan通常以圖形來表現, 早期的RDBMS是以文字表示
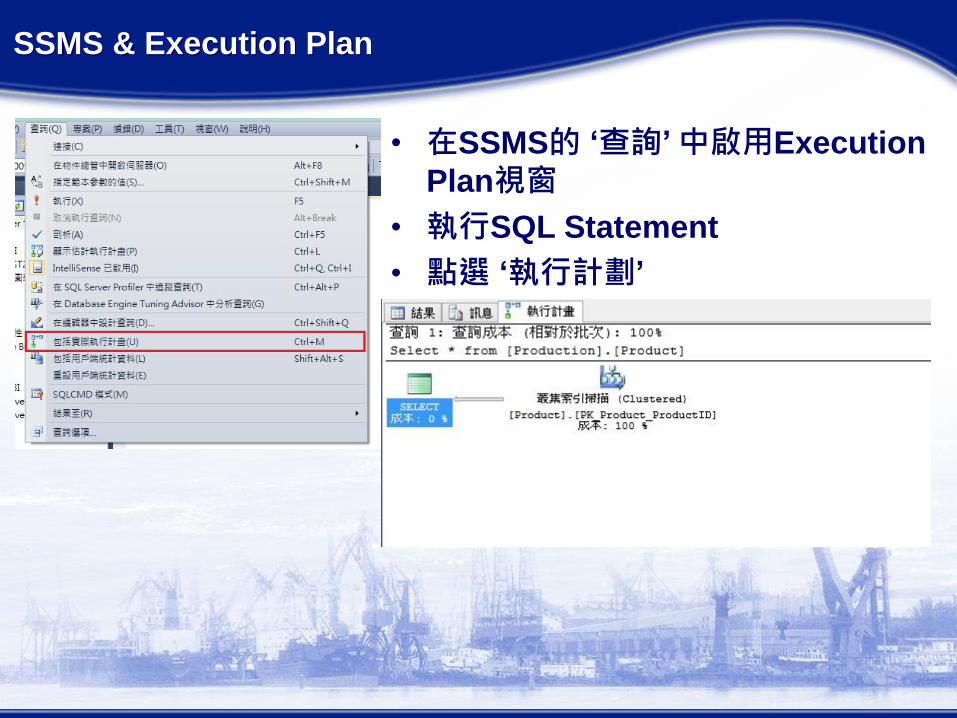
SSMS & Execution Plan
• 在SSMS的 ‘查詢’ 中啟用Execution
Plan視窗
• 執行SQL Statement
• 點選 ‘執行計劃’

Cost-Based Optimizer
• 大多數RDBMS採用Cost-Based Optimizer技術
• Cost有兩種: I/O Cost, CPU Cost
• ‘Cost’ is a weighted average of the costs derived from the
cost-based decision tree generated when the SQL
statement is bring processed.
• It is essentially an estimate of the run-time for a given
operation.
• ‘Cost’較低, 代表需要的硬體成本較低, 效能通常較好.
• 以前的伺服器硬體成本高昂, 在進行效能調校時, 常以 ‘Cost’較低的Execution Plan為考量.
• 但現在的RDBMS系統, ‘Cost’不再是效能調校的基本參照, 因為伺服器的效能還有很多空間可用時, 最佳Execution Plan不一定是 ‘Cost’最低者.
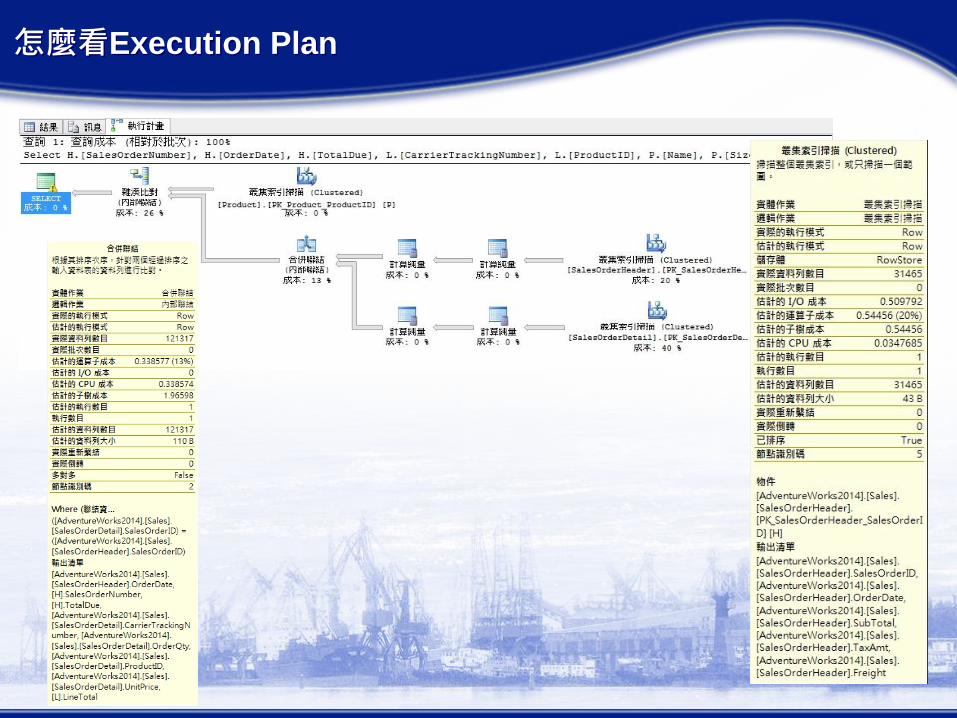
怎麼看Execution Plan
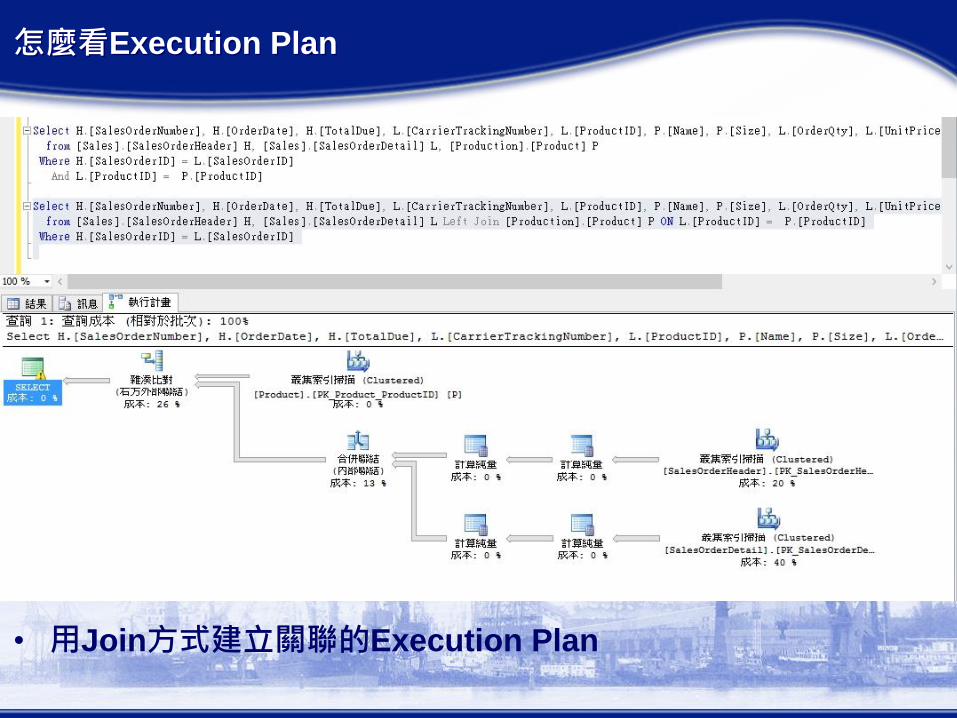
怎麼看Execution Plan
• 用Join方式建立關聯的Execution Plan

從Execution Plan來診斷SQL Statement
效能瓶頸
• 從Cost判斷SQL Statement的效能瓶頸
• Cost值越高, 代表影響效能越大
• 因此, 如果能降低Cost可以提高執行效能, 但這不是絕對
• 降低Cost最明顯的方法有三
– 善用Index, 避免Table Scan
– 儘量避免使用Outer Join
– 避免在Cursor裏執行太吃重的SQL Statement
• 要和Optimizer合作, 儘量將Cost壓低, 讓Optimizer自行選取最佳Execution Plan

Q & A