stability of slopes in residual soilsestabilidad de taludes en suelos residuales this paper examines...
TRANSCRIPT
47
Wesley, L. (2011). Stability of slopes in residual soils. Obras y Proyectos 10, 47-61
Stability of slopes in residual soils
Fecha de entrega: 29 de septiembre 2011 Fecha de aceptación: 15 de noviembre 2011
Laurence WesleyDepartment of Civil and Environmental Engineering, the University of Auckland, Private Bag 92019, Auckland, New Zealand, [email protected]
Estabilidad de taludes en suelos residuales
This paper examines and discusses a number of factors that make slope stability assessments, and slope engineering in residual soils somewhat different from sedimentary soils. In particular, slopes are generally steeper and of higher permeability. They are also likely to be more heterogeneous and thus less amenable to analytical assessment than slopes in sedimentary soils. These factors are discussed in some detail. It is explained that climate and weather influence is much greater in residual soils than sedimentary soils, and theoretical methods are presented for taking this influence into account. It is shown also that traditional computer program methods of slip circle analysis can result in very large errors if applied to steep slopes in which seepage is occurring. More rigorous treatment of the seepage state, especially the “worst case” state is needed in order to produce sensible estimates of safety factor.
Keywords: slope stability, residual soils, pore pressure ratio, back analysis, remedial measures
Este artículo analiza y discute una serie de factores que hacen que las evaluaciones de estabilidad de taludes y la ingeniería de taludes en suelos residuales sean algo diferente a las de suelos sedimentarios. En particular, los taludes son generalmente más pronunciados y de mayor permeabilidad. También son probablemente más heterogéneos y por lo tanto, menos susceptibles a evaluaciones analíticas en comparación a los taludes en suelos sedimentarios. Se discuten estos factores con cierto detalle. Se explica que la influencia del clima y el tiempo es mucho mayor en suelos residuales que en suelos sedimentarios, y se presentan métodos teóricos para tomar esta influencia en consideración. También se demuestra que los métodos computacionales tradicionales de análisis de círculos de deslizamiento pueden dar lugar a errores muy grandes si se aplican a taludes empinados en los que ocurre escurrimiento. Es necesario un tratamiento más riguroso del estado de escurrimiento, especialmente el estado para el “peor caso”, con el objeto de obtener estimaciones razonables del factor de seguridad.
Palabras clave: estabilidad de taludes, suelos residuales, razón de presión de poros, retro análisis, medidas mitigadoras
IntroductionThe general principles of slope stability apply equally to sedimentary soils and residual soils, but there are various aspects of slope behaviour that are peculiar to, or characteristic of, residual soils. These include the following:
(a) Slopes in residual soils (excluding “black cotton” soils) generally remain stable at much steeper angles than those in most sedimentary soils. Slopes of 45o or steeper are not uncommon. Cuts in volcanic ash (allophane) clays can often be made as steep as 60o and 10 m high, without danger of slipping.
(b) Slope failures in residual soils, especially when steep slopes are involved, are unlikely to be deep seated
circular failures. They are more likely to be relatively shallow, often with slightly curved or almost planar failure surfaces. However, the volume of material involved may still be very large.
(c) The value of c’ usually plays a significant role in maintaining stability; it appears to be due to some form of weak bonds between particles.
(d) The residual strength is generally closer to the peak strength than in the case with most sedimentary soils, especially in clays containing allophane or halloysite.
(e) The stability of many slopes in residual soils is dependent on the contribution to shear strength arising from the zone of negative pore pressure above the water table.
(f) With some (possibly the majority) residual soils,
48
Wesley, L. (2011). Obras y Proyectos 10, 47-61
the presence of discontinuities may be the factor governing the stability behaviour of slopes.
(g) The extent to which the stability of slopes in residual soils can be evaluated by analytical methods is often very limited, because of uncertainties in the soil strength parameters and in the seepage conditions.
(h) Slips and landslides in residual soils area generally triggered by heavy rainfall, and are the result of temporary increases in the pore pressure in the slope. This is an important difference with sedimentary soils, where water tables tend to stay in a permanent equilibrium position unaffected by weather.
(i) Strong earthquakes may also be the trigger for slips or landslides.
(j) The actual cause (as distinct from the “trigger”) of a great many landslides in residual soils is in fact human activity. Excavations into slopes, the placing of fill on slopes, the interference with natural drainage and seepage patterns, and deforestation are all factors that lead to reducing stability and possibly to failures, especially in urban areas.
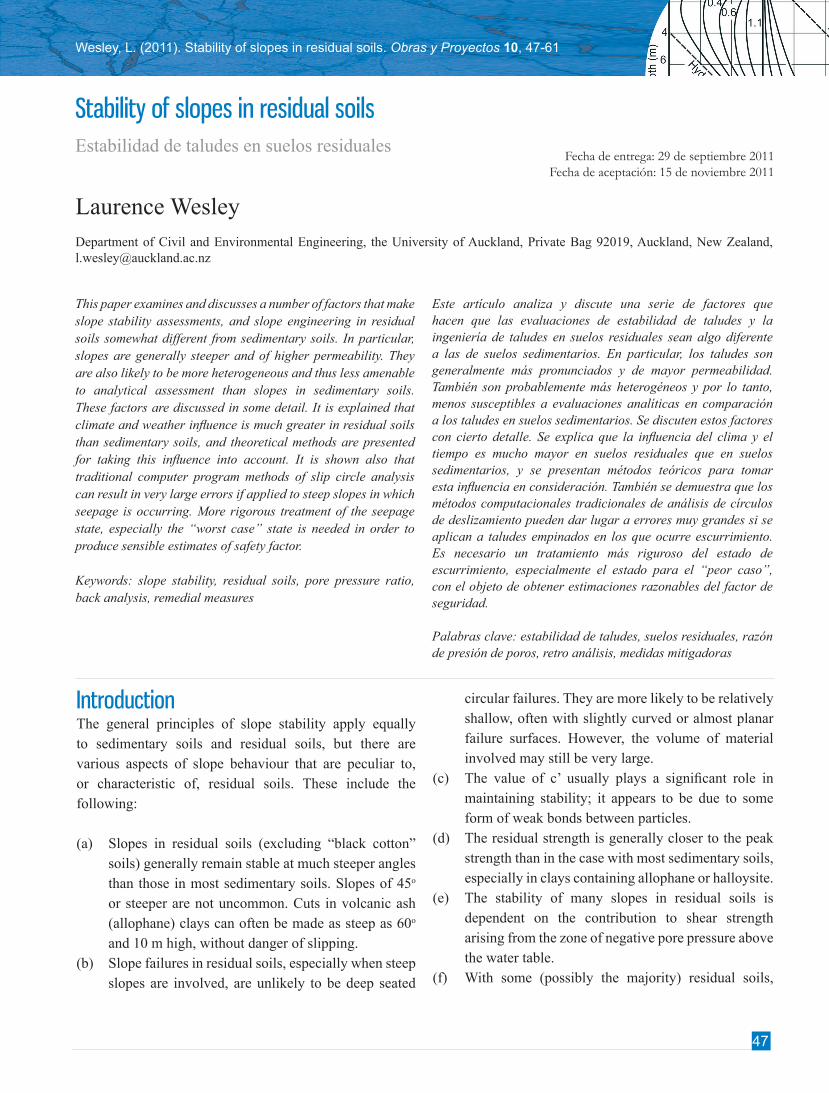
Failure modes As mentioned above, slope failures in residual soils, especially when steep slopes are involved, are unlikely to be deep seated circular failures. They are more likely to be relatively shallow, with fairly planar failure surfaces. In large slopes with a limited depth of weathered material overlying sound rock, they are likely to be predominantly translational slides. Also, it is not uncommon in volcanic areas for volcanic material to slide at the interface between volcanic deposits and the underlying sedimentary soils. The slip surface in this case may be fairly linear so that the slide is essentially a translational slide. However, the volume of material involved may still be very large. Some modes of failure are illustrated in Figure 1.
It should not be imagined that assessing the stability of natural slopes is essentially an analytical exercise. There are severe limitations on the extent to which analytical methods can be applied to natural slopes. They may or may not be an important part of slope stability assessment, depending on the nature of the slope, in particular its geology, topography, soil conditions and history.
Figure 1: Failure modes in residual soils
The place of analytical and non-analytical methods Other, non-analytical methods, however, are always an essential part of any assessment of the stability of natural slopes. These methods may appear “primitive” and not technically satisfying, but that does not lessen their importance. They include the following:
(a) Visual inspection of the slope(b) Geological appraisal of the slope and surrounding area(c) Inspection of aerial photos(d) Inspection of existing slopes in similar materials to
the slope in question
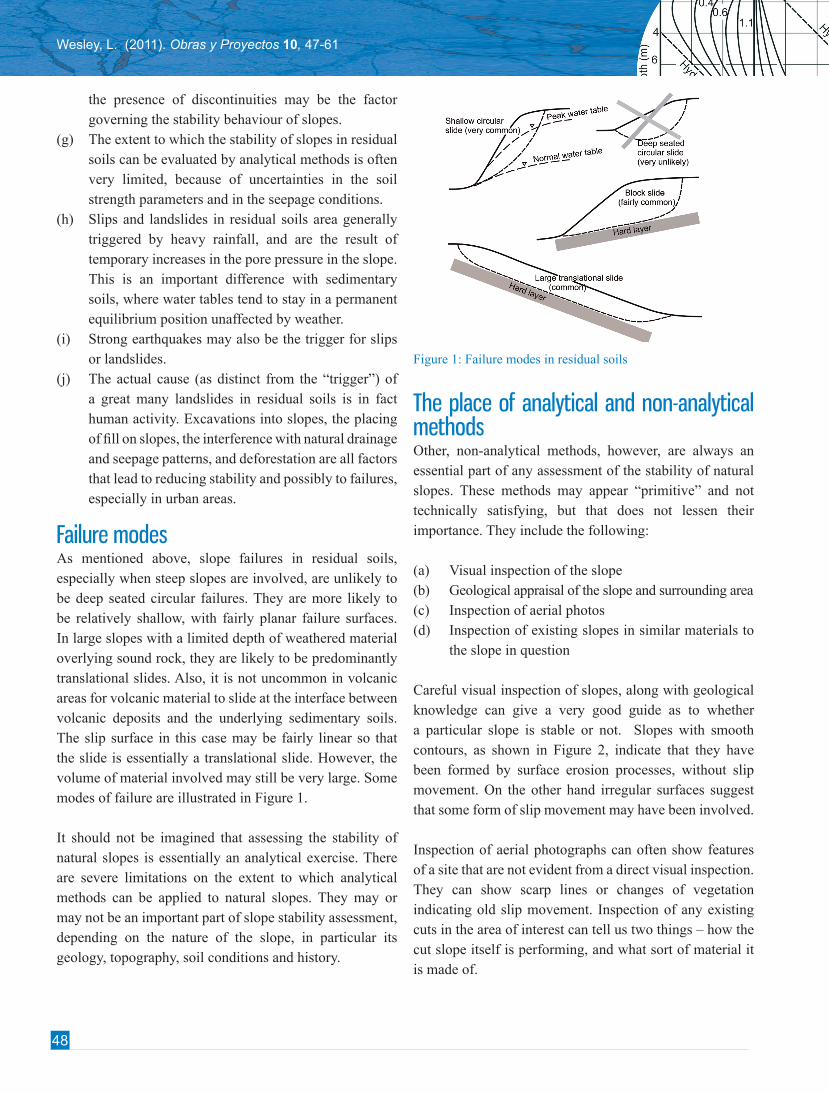
Careful visual inspection of slopes, along with geological knowledge can give a very good guide as to whether a particular slope is stable or not. Slopes with smooth contours, as shown in Figure 2, indicate that they have been formed by surface erosion processes, without slip movement. On the other hand irregular surfaces suggest that some form of slip movement may have been involved. Inspection of aerial photographs can often show features of a site that are not evident from a direct visual inspection. They can show scarp lines or changes of vegetation indicating old slip movement. Inspection of any existing cuts in the area of interest can tell us two things – how the cut slope itself is performing, and what sort of material it is made of.
49
Wesley, L. (2011). Stability of slopes in residual soils. Obras y Proyectos 10, 47-61
Figure 2: Stability indications from surface features of slopes
It is probably true that most assessments of the stability of a natural slope are based 80% or more on (a) to (d) above and less than 20% on analytical procedures.
Limitations of analytical methodsThe limitations of applying analytical methods to residual soil slopes arise from uncertainties in the shear strength parameters and in the seepage conditions. With respect to the strength parameters, it is convenient to divide slopes into three categories, as follows:
1. Slopes consisting of uniform, homogeneous materials.2. Slopes containing distinct, continuous, planes of
weakness.3. Slopes of heterogeneous material, but without distinct
planes of weakness, as for example in a weathering profile of the “Little” kind.
Slopes consisting of uniform materials With such slopes, the determination of accurate safety factors by conventional slip circle analysis would appear to be a reasonable expectation. However, there are still uncertainties that cannot easily be eliminated. These uncertainties relate to firstly the shear strength of the soil and secondly the seepage and pore pressure state in the ground, as explained in the following paragraphs.
With respect to shear strength, the following points should be noted:• The value of f’ can usually be determined with
reasonable accuracy using normal measurement methods, such as triaxial testing.
• The value of c’ is often very significant, (due to weak bonds between particles) but cannot easily be determined with the same degree of reliability as f’. Very careful triaxial testing at low confining stresses is needed to accurately determine c’.
• The residual strength is likely to be fairly close to the peak strength, especially in clays containing allophane or halloysite.
With regard to the seepage pattern and pore pressure state in the slope, the relatively high permeability of most slopes in residual soils means that the seepage state is continuously changing depending on the weather conditions. The worst case seepage pattern is clearly the one that governs the long-term stability of the slope. Unfortunately there is no reliable way to determine this pattern, although there are some methods that we can adopt to try to estimate this worst case.
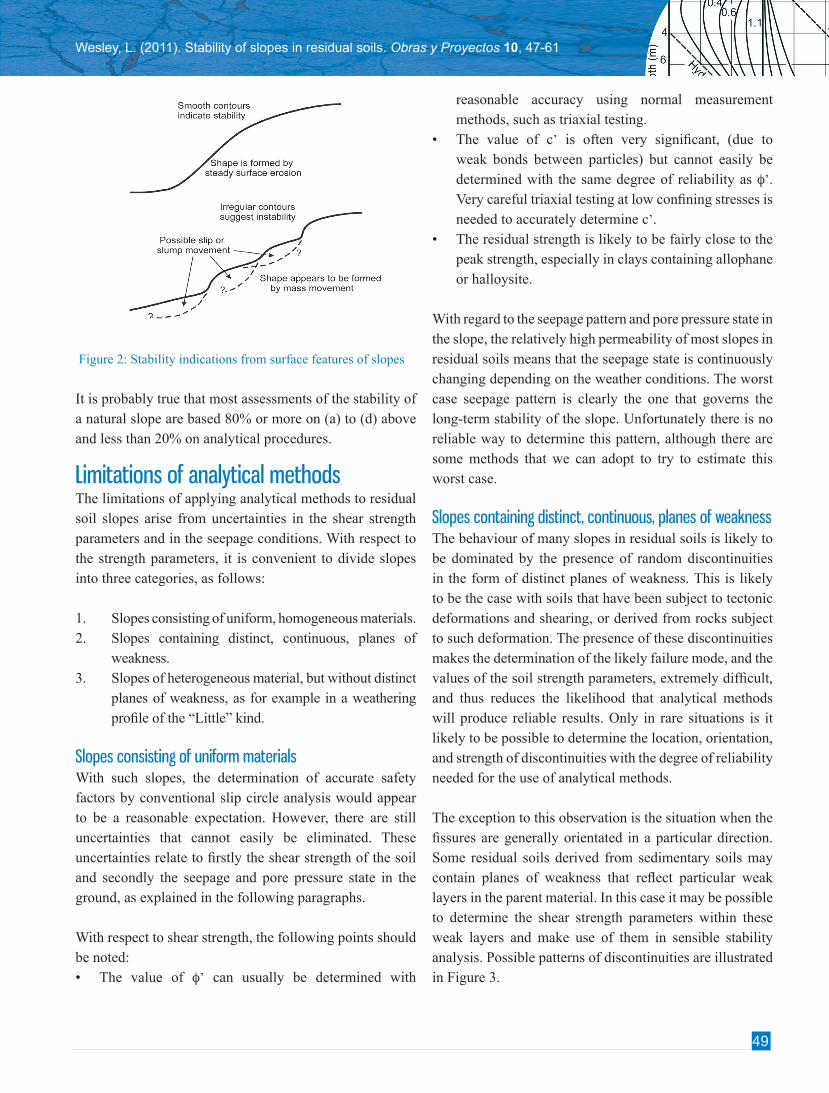
Slopes containing distinct, continuous, planes of weaknessThe behaviour of many slopes in residual soils is likely to be dominated by the presence of random discontinuities in the form of distinct planes of weakness. This is likely to be the case with soils that have been subject to tectonic deformations and shearing, or derived from rocks subject to such deformation. The presence of these discontinuities makes the determination of the likely failure mode, and the values of the soil strength parameters, extremely difficult, and thus reduces the likelihood that analytical methods will produce reliable results. Only in rare situations is it likely to be possible to determine the location, orientation, and strength of discontinuities with the degree of reliability needed for the use of analytical methods.
The exception to this observation is the situation when the fissures are generally orientated in a particular direction. Some residual soils derived from sedimentary soils may contain planes of weakness that reflect particular weak layers in the parent material. In this case it may be possible to determine the shear strength parameters within these weak layers and make use of them in sensible stability analysis. Possible patterns of discontinuities are illustrated in Figure 3.
50
Wesley, L. (2011). Obras y Proyectos 10, 47-61
Figure 3: Possible discontinuity patterns and influence on slope
stability
Slopes of heterogeneous material, but without distinct planes of weaknessThe weathering of igneous rocks such as granite, does not generally create distinct planes of weakness, so that this is quite a different situation to that just described above. The soil profile consists of zones of partly weathered material containing remnants of the parent rock, and zones of fully weathered material (soil). Determination of the strength parameters applicable to the material as a whole is still very difficult, if not impossible, by conventional sampling and laboratory testing. This may not entirely rule out the use of analytical methods, as it may still be possible to determine the strength parameters from back analysis methods applied to existing slips or slopes. Some examples of these methods are given in a later section.
Influence of climateSlips and landslides in residual soils are generally triggered by periods of prolonged or intense rainfall, and are the result of temporary increases in the pore water pressure in the slope. This is an important difference in behaviour between residual and sedimentary clays. With sedimentary clays of low permeability (such as London clay) the pore pressures can be measured and the assumption safely made that they will remain approximately the same indefinitely (except very close to the surface), provided there are no significant changes in external conditions. With residual soils, any measurement of pore water pressure in the slope is valid only at the time it is made and cannot be assumed to be relevant to long term stability estimates. For such estimates, it is the worst seepage condition likely to occur in the future
which will determine the long term stability of the slope.
One important reason (which should be clearly recognised) that slopes in residual soils remain stable at steep angles is because the phreatic surface (water table) is often deep, and the pore pressure above the surface is negative (“suction” or “pore water tension”) as described elsewhere. This zone of pore water tension may include most of the slope, and increases the effective normal stress across any potential failure surface, thus increasing the shear strength and the safety factor of the slope. The influence of intense rainfall on this zone is to increase the pore pressure from its negative value towards zero (i.e. to reduce or destroy the “suction” above the water table), or possibly to turn it into a positive value if the phreatic surface rises. However, it is not necessary for the phreatic surface to rise at all for rainfall to induce failure in a slope. The reduction in the negative pore pressure without change in water table my induce failure in the slope. An example of such a situation is given later.
Response of pore pressure to rainfallThe influence of rainfall on the water table and the pore pressure state in a slope arises from two distinct weather effects, as follows:(1) Regular seasonal influence. This is cyclical in nature,
and for many climates is reasonably predictable, as described elsewhere.
(2) Isolated storm events. These are generally unpredictable, both in timing and intensity, and are more likely to be the direct trigger of landslides than normal seasonal changes.
The place where the most study has been given to the response of slopes to periods of heavy rainfall is Hong Kong, a part of China. Hong Kong, along with many parts of the Far East, is subject to extremely intense rainfall from time to time, because it is in the path of typhoons; these typhoons have been the trigger for many large disastrous landslides, resulting in severe damage to property, and even loss of life. For about the last four decades, Hong Kong has had a specialist geotechnical unit responsible for investigating slope failures and setting up guidelines for all new developments close to, or actually on, sloping sites. Considerable data has been obtained from field monitoring of the way pore pressures in slopes respond to periods
51
Wesley, L. (2011). Stability of slopes in residual soils. Obras y Proyectos 10, 47-61
of rainfall, and this has been used to develop empirical or semi-empirical methods for predicting pore pressures corresponding to particular return period storms.
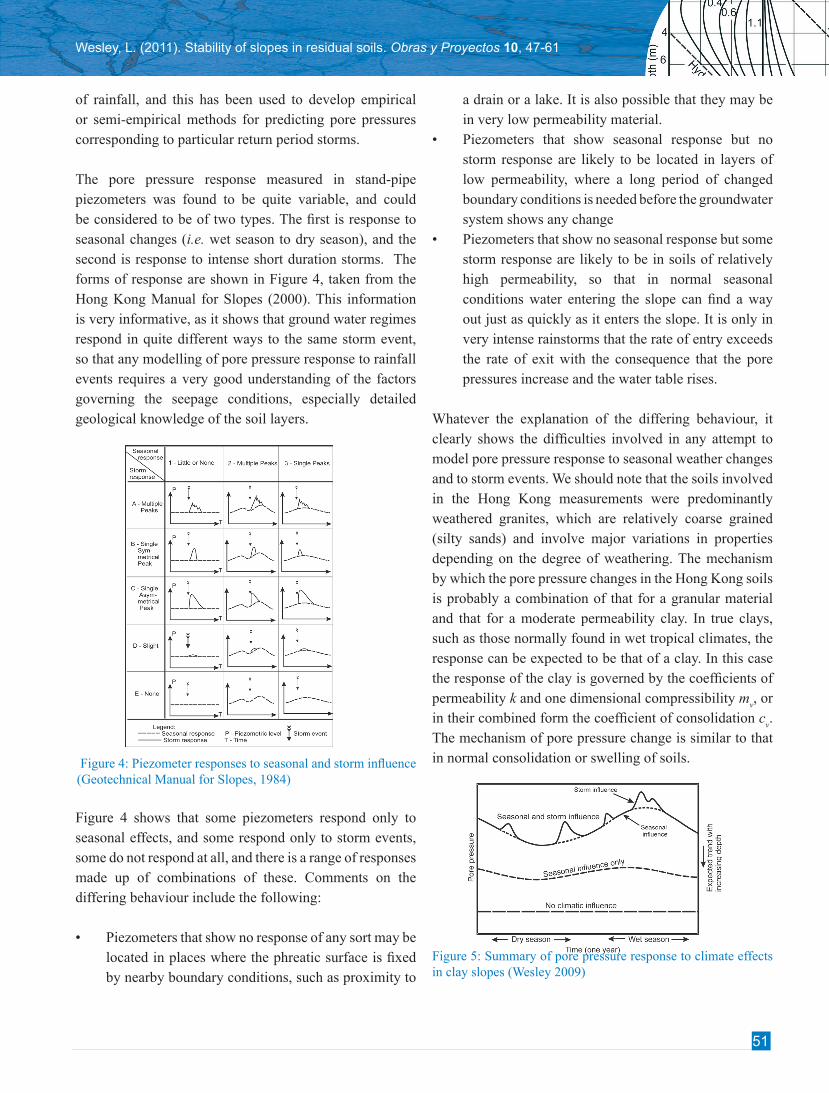
The pore pressure response measured in stand-pipe piezometers was found to be quite variable, and could be considered to be of two types. The first is response to seasonal changes (i.e. wet season to dry season), and the second is response to intense short duration storms. The forms of response are shown in Figure 4, taken from the Hong Kong Manual for Slopes (2000). This information is very informative, as it shows that ground water regimes respond in quite different ways to the same storm event, so that any modelling of pore pressure response to rainfall events requires a very good understanding of the factors governing the seepage conditions, especially detailed geological knowledge of the soil layers.
Figure 4 shows that some piezometers respond only to seasonal effects, and some respond only to storm events, some do not respond at all, and there is a range of responses made up of combinations of these. Comments on the differing behaviour include the following:
• Piezometers that show no response of any sort may be located in places where the phreatic surface is fixed by nearby boundary conditions, such as proximity to
a drain or a lake. It is also possible that they may be in very low permeability material.
• Piezometers that show seasonal response but no storm response are likely to be located in layers of low permeability, where a long period of changed boundary conditions is needed before the groundwater system shows any change
• Piezometers that show no seasonal response but some storm response are likely to be in soils of relatively high permeability, so that in normal seasonal conditions water entering the slope can find a way out just as quickly as it enters the slope. It is only in very intense rainstorms that the rate of entry exceeds the rate of exit with the consequence that the pore pressures increase and the water table rises.
Whatever the explanation of the differing behaviour, it clearly shows the difficulties involved in any attempt to model pore pressure response to seasonal weather changes and to storm events. We should note that the soils involved in the Hong Kong measurements were predominantly weathered granites, which are relatively coarse grained (silty sands) and involve major variations in properties depending on the degree of weathering. The mechanism by which the pore pressure changes in the Hong Kong soils is probably a combination of that for a granular material and that for a moderate permeability clay. In true clays, such as those normally found in wet tropical climates, the response can be expected to be that of a clay. In this case the response of the clay is governed by the coefficients of permeability k and one dimensional compressibility mv
, or in their combined form the coefficient of consolidation c
v.
The mechanism of pore pressure change is similar to that in normal consolidation or swelling of soils.
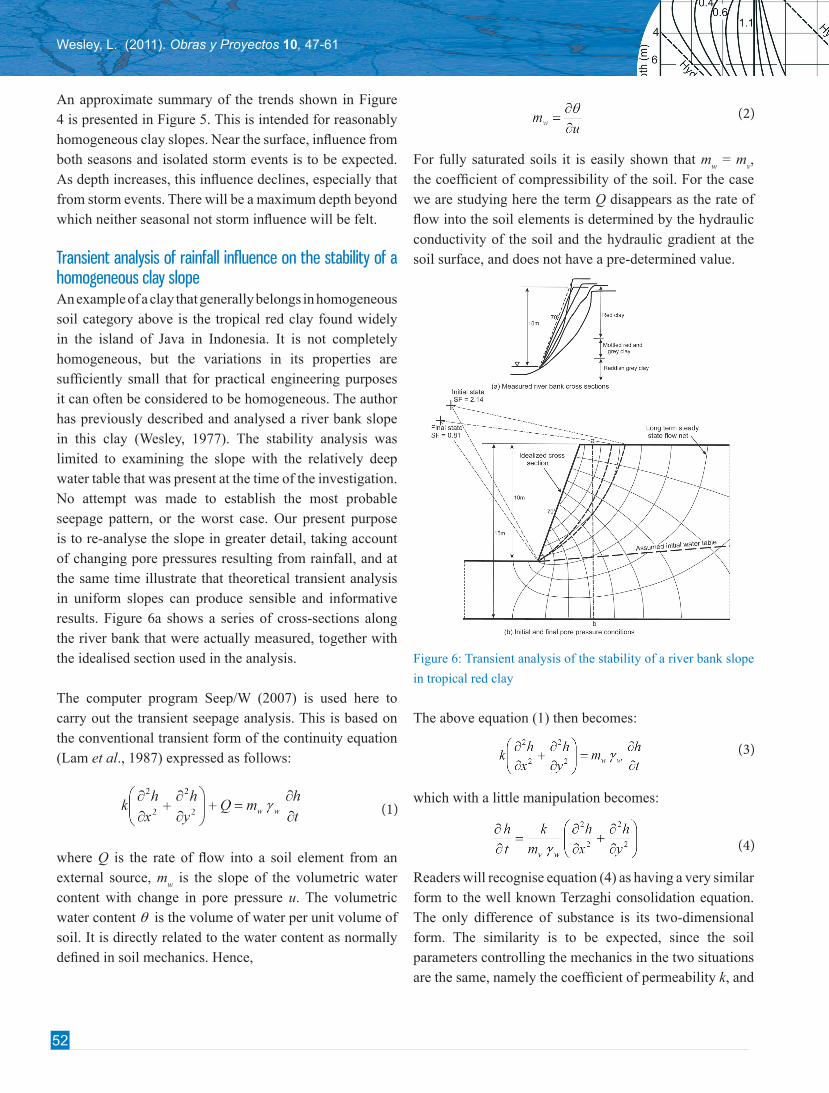
Figure 5: Summary of pore pressure response to climate effects in clay slopes (Wesley 2009)
Figure 4: Piezometer responses to seasonal and storm influence (Geotechnical Manual for Slopes, 1984)
52
Wesley, L. (2011). Obras y Proyectos 10, 47-61
An approximate summary of the trends shown in Figure 4 is presented in Figure 5. This is intended for reasonably homogeneous clay slopes. Near the surface, influence from both seasons and isolated storm events is to be expected. As depth increases, this influence declines, especially that from storm events. There will be a maximum depth beyond which neither seasonal not storm influence will be felt.
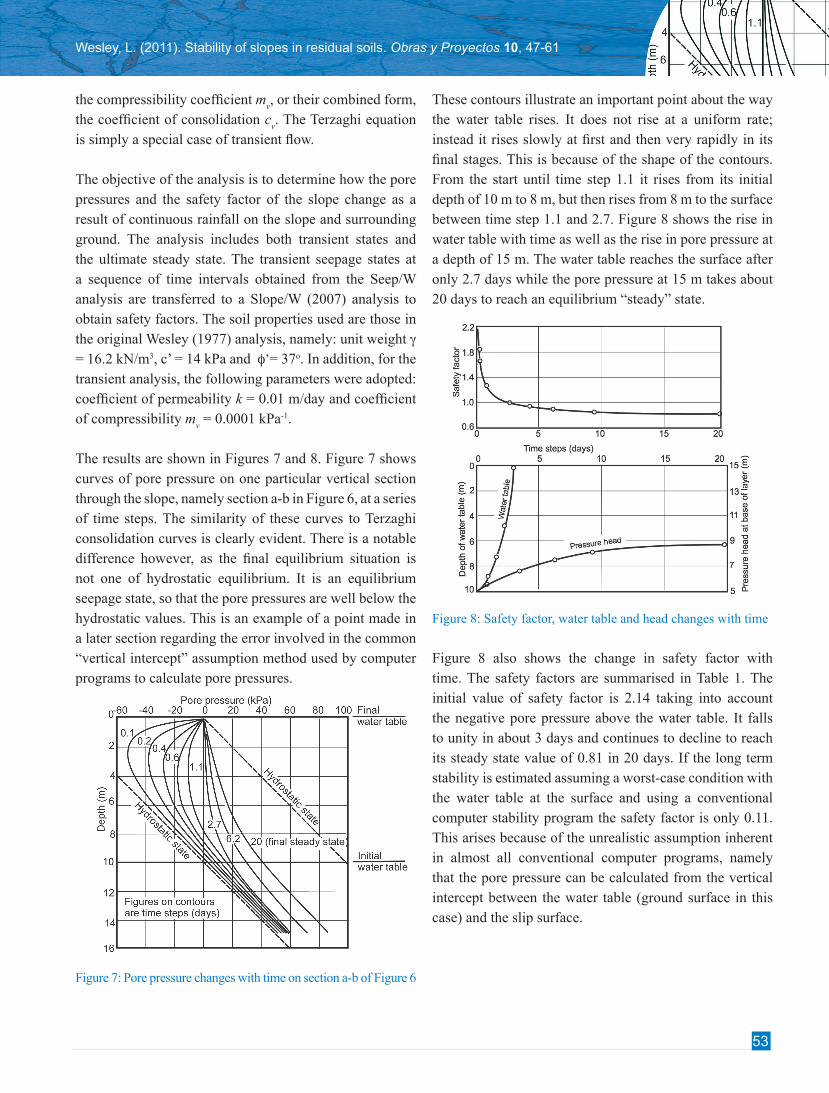
Transient analysis of rainfall influence on the stability of a homogeneous clay slopeAn example of a clay that generally belongs in homogeneous soil category above is the tropical red clay found widely in the island of Java in Indonesia. It is not completely homogeneous, but the variations in its properties are sufficiently small that for practical engineering purposes it can often be considered to be homogeneous. The author has previously described and analysed a river bank slope in this clay (Wesley, 1977). The stability analysis was limited to examining the slope with the relatively deep water table that was present at the time of the investigation. No attempt was made to establish the most probable seepage pattern, or the worst case. Our present purpose is to re-analyse the slope in greater detail, taking account of changing pore pressures resulting from rainfall, and at the same time illustrate that theoretical transient analysis in uniform slopes can produce sensible and informative results. Figure 6a shows a series of cross-sections along the river bank that were actually measured, together with the idealised section used in the analysis.
The computer program Seep/W (2007) is used here to carry out the transient seepage analysis. This is based on the conventional transient form of the continuity equation (Lam et al., 1987) expressed as follows:
where Q is the rate of flow into a soil element from an external source, m
w is the slope of the volumetric water
content with change in pore pressure u. The volumetric water content q is the volume of water per unit volume of soil. It is directly related to the water content as normally defined in soil mechanics. Hence,
For fully saturated soils it is easily shown that mw = m
v,
the coefficient of compressibility of the soil. For the case we are studying here the term Q disappears as the rate of flow into the soil elements is determined by the hydraulic conductivity of the soil and the hydraulic gradient at the soil surface, and does not have a pre-determined value.
Figure 6: Transient analysis of the stability of a river bank slope
in tropical red clay
The above equation (1) then becomes:
which with a little manipulation becomes:
Readers will recognise equation (4) as having a very similar form to the well known Terzaghi consolidation equation. The only difference of substance is its two-dimensional form. The similarity is to be expected, since the soil parameters controlling the mechanics in the two situations are the same, namely the coefficient of permeability k, and
53
Wesley, L. (2011). Stability of slopes in residual soils. Obras y Proyectos 10, 47-61
the compressibility coefficient mv, or their combined form,
the coefficient of consolidation cv. The Terzaghi equation
is simply a special case of transient flow.
The objective of the analysis is to determine how the pore pressures and the safety factor of the slope change as a result of continuous rainfall on the slope and surrounding ground. The analysis includes both transient states and the ultimate steady state. The transient seepage states at a sequence of time intervals obtained from the Seep/W analysis are transferred to a Slope/W (2007) analysis to obtain safety factors. The soil properties used are those in the original Wesley (1977) analysis, namely: unit weight g = 16.2 kN/m3, c’ = 14 kPa and f’= 37o. In addition, for the transient analysis, the following parameters were adopted: coefficient of permeability k = 0.01 m/day and coefficient of compressibility m
v = 0.0001 kPa-1.
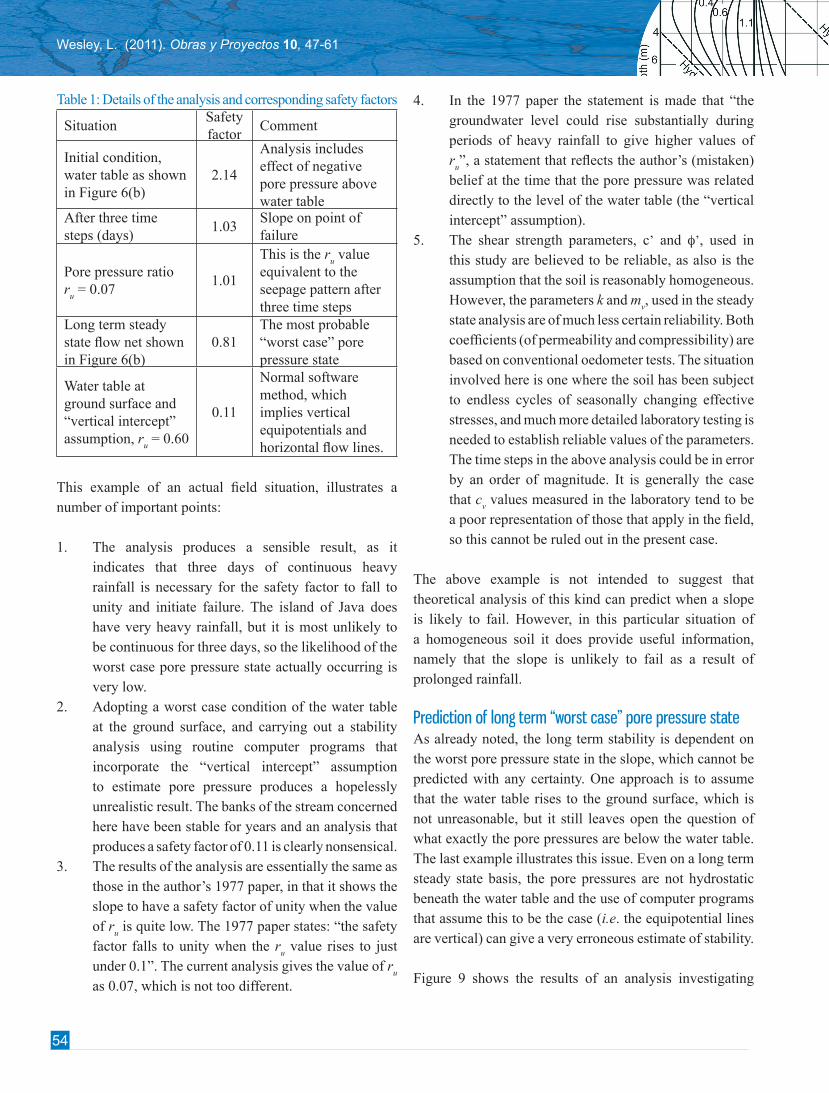
The results are shown in Figures 7 and 8. Figure 7 shows curves of pore pressure on one particular vertical section through the slope, namely section a-b in Figure 6, at a series of time steps. The similarity of these curves to Terzaghi consolidation curves is clearly evident. There is a notable difference however, as the final equilibrium situation is not one of hydrostatic equilibrium. It is an equilibrium seepage state, so that the pore pressures are well below the hydrostatic values. This is an example of a point made in a later section regarding the error involved in the common “vertical intercept” assumption method used by computer programs to calculate pore pressures.
Figure 7: Pore pressure changes with time on section a-b of Figure 6
These contours illustrate an important point about the way the water table rises. It does not rise at a uniform rate; instead it rises slowly at first and then very rapidly in its final stages. This is because of the shape of the contours. From the start until time step 1.1 it rises from its initial depth of 10 m to 8 m, but then rises from 8 m to the surface between time step 1.1 and 2.7. Figure 8 shows the rise in water table with time as well as the rise in pore pressure at a depth of 15 m. The water table reaches the surface after only 2.7 days while the pore pressure at 15 m takes about 20 days to reach an equilibrium “steady” state.
Figure 8: Safety factor, water table and head changes with time
Figure 8 also shows the change in safety factor with time. The safety factors are summarised in Table 1. The initial value of safety factor is 2.14 taking into account the negative pore pressure above the water table. It falls to unity in about 3 days and continues to decline to reach its steady state value of 0.81 in 20 days. If the long term stability is estimated assuming a worst-case condition with the water table at the surface and using a conventional computer stability program the safety factor is only 0.11. This arises because of the unrealistic assumption inherent in almost all conventional computer programs, namely that the pore pressure can be calculated from the vertical intercept between the water table (ground surface in this case) and the slip surface.
54
Wesley, L. (2011). Obras y Proyectos 10, 47-61
Table 1: Details of the analysis and corresponding safety factors
SituationSafety factor
Comment
Initial condition, water table as shown in Figure 6(b)
2.14
Analysis includes effect of negative pore pressure above water table
After three time steps (days)
1.03Slope on point of failure
Pore pressure ratio r
u = 0.07
1.01
This is the ru value
equivalent to the seepage pattern after three time steps
Long term steady state flow net shown in Figure 6(b)
0.81The most probable “worst case” pore pressure state
Water table at ground surface and “vertical intercept” assumption, r
u = 0.60
0.11
Normal software method, which implies vertical equipotentials and horizontal flow lines.
This example of an actual field situation, illustrates a number of important points:
1. The analysis produces a sensible result, as it indicates that three days of continuous heavy rainfall is necessary for the safety factor to fall to unity and initiate failure. The island of Java does have very heavy rainfall, but it is most unlikely to be continuous for three days, so the likelihood of the worst case pore pressure state actually occurring is very low.
2. Adopting a worst case condition of the water table at the ground surface, and carrying out a stability analysis using routine computer programs that incorporate the “vertical intercept” assumption to estimate pore pressure produces a hopelessly unrealistic result. The banks of the stream concerned here have been stable for years and an analysis that produces a safety factor of 0.11 is clearly nonsensical.
3. The results of the analysis are essentially the same as those in the author’s 1977 paper, in that it shows the slope to have a safety factor of unity when the value of ru
is quite low. The 1977 paper states: “the safety factor falls to unity when the r
u value rises to just
under 0.1”. The current analysis gives the value of ru
as 0.07, which is not too different.
4. In the 1977 paper the statement is made that “the groundwater level could rise substantially during periods of heavy rainfall to give higher values of r
u”, a statement that reflects the author’s (mistaken)
belief at the time that the pore pressure was related directly to the level of the water table (the “vertical intercept” assumption).
5. The shear strength parameters, c’ and f’, used in this study are believed to be reliable, as also is the assumption that the soil is reasonably homogeneous. However, the parameters k and m
v, used in the steady
state analysis are of much less certain reliability. Both coefficients (of permeability and compressibility) are based on conventional oedometer tests. The situation involved here is one where the soil has been subject to endless cycles of seasonally changing effective stresses, and much more detailed laboratory testing is needed to establish reliable values of the parameters. The time steps in the above analysis could be in error by an order of magnitude. It is generally the case that c
v values measured in the laboratory tend to be
a poor representation of those that apply in the field, so this cannot be ruled out in the present case.
The above example is not intended to suggest that theoretical analysis of this kind can predict when a slope is likely to fail. However, in this particular situation of a homogeneous soil it does provide useful information, namely that the slope is unlikely to fail as a result of prolonged rainfall.
Prediction of long term “worst case” pore pressure stateAs already noted, the long term stability is dependent on the worst pore pressure state in the slope, which cannot be predicted with any certainty. One approach is to assume that the water table rises to the ground surface, which is not unreasonable, but it still leaves open the question of what exactly the pore pressures are below the water table. The last example illustrates this issue. Even on a long term steady state basis, the pore pressures are not hydrostatic beneath the water table and the use of computer programs that assume this to be the case (i.e. the equipotential lines are vertical) can give a very erroneous estimate of stability.
Figure 9 shows the results of an analysis investigating
55
Wesley, L. (2011). Stability of slopes in residual soils. Obras y Proyectos 10, 47-61
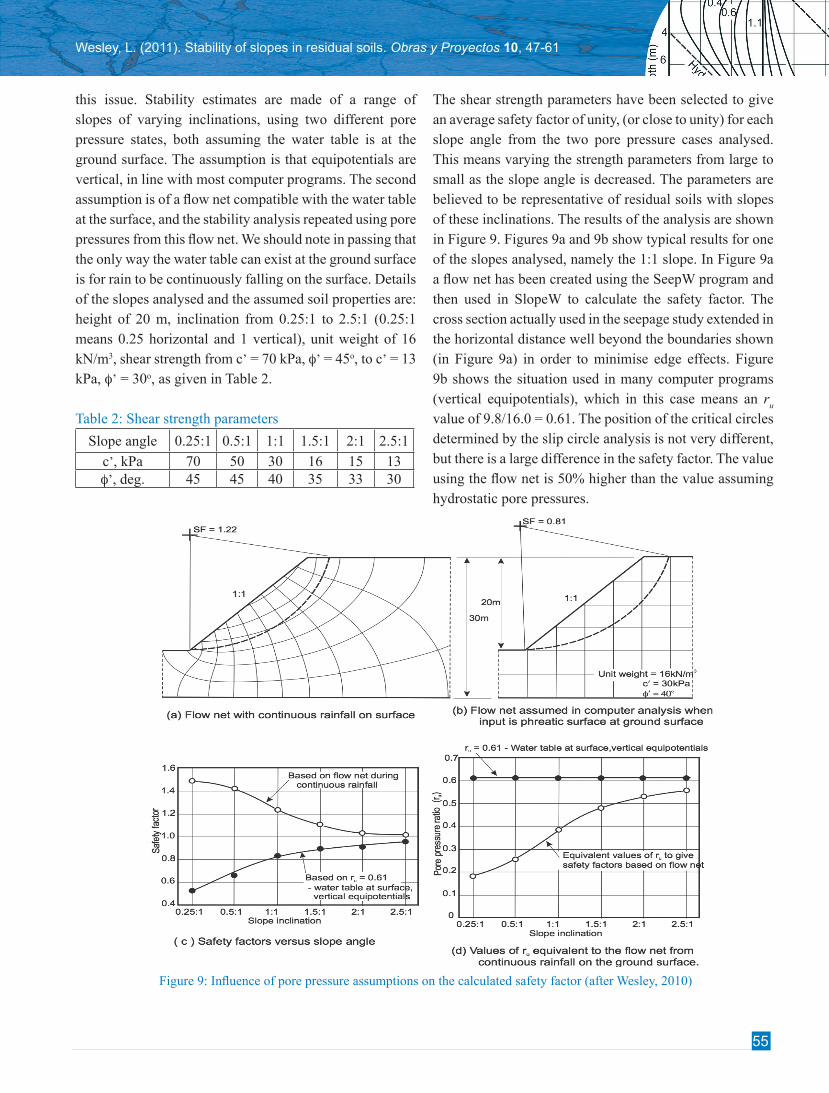
this issue. Stability estimates are made of a range of slopes of varying inclinations, using two different pore pressure states, both assuming the water table is at the ground surface. The assumption is that equipotentials are vertical, in line with most computer programs. The second assumption is of a flow net compatible with the water table at the surface, and the stability analysis repeated using pore pressures from this flow net. We should note in passing that the only way the water table can exist at the ground surface is for rain to be continuously falling on the surface. Details of the slopes analysed and the assumed soil properties are: height of 20 m, inclination from 0.25:1 to 2.5:1 (0.25:1 means 0.25 horizontal and 1 vertical), unit weight of 16 kN/m3, shear strength from c’ = 70 kPa, f’ = 45o, to c’ = 13 kPa, f’ = 30o, as given in Table 2.
Table 2: Shear strength parameters
Slope angle 0.25:1 0.5:1 1:1 1.5:1 2:1 2.5:1c’, kPa 70 50 30 16 15 13f’, deg. 45 45 40 35 33 30
The shear strength parameters have been selected to give an average safety factor of unity, (or close to unity) for each slope angle from the two pore pressure cases analysed. This means varying the strength parameters from large to small as the slope angle is decreased. The parameters are believed to be representative of residual soils with slopes of these inclinations. The results of the analysis are shown in Figure 9. Figures 9a and 9b show typical results for one of the slopes analysed, namely the 1:1 slope. In Figure 9a a flow net has been created using the SeepW program and then used in SlopeW to calculate the safety factor. The cross section actually used in the seepage study extended in the horizontal distance well beyond the boundaries shown (in Figure 9a) in order to minimise edge effects. Figure 9b shows the situation used in many computer programs (vertical equipotentials), which in this case means an ru
value of 9.8/16.0 = 0.61. The position of the critical circles determined by the slip circle analysis is not very different, but there is a large difference in the safety factor. The value using the flow net is 50% higher than the value assuming hydrostatic pore pressures.
Figure 9: Influence of pore pressure assumptions on the calculated safety factor (after Wesley, 2010)
56
Wesley, L. (2011). Obras y Proyectos 10, 47-61
Figures 9c and d summarise the results for all the slopes. The dramatic difference in safety factor with steep slopes is clearly illustrated in Figure 9c. With the 0.25:1 slope the assumption of vertical equipotentials gives a safety factor of 0.5 while that with the flow net gives a value of 1.5. Figure 9d shows the actual values of r
u that correspond
to the flow net seepage state. The conclusion from this analysis is that estimating the “worst case” pore pressure state in steep slopes by assuming the phreatic surface rises to ground level and the equipotential lines are vertical can easily lead to extremely erroneous results.
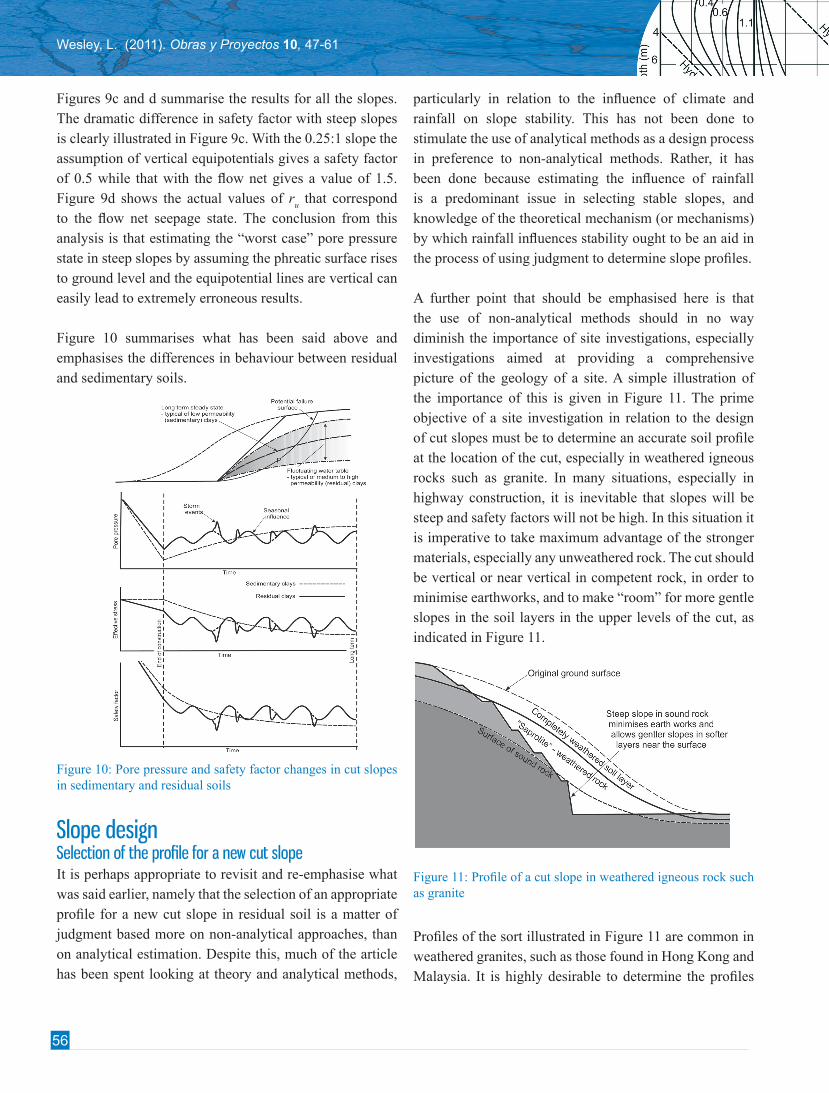
Figure 10 summarises what has been said above and emphasises the differences in behaviour between residual and sedimentary soils.
Figure 10: Pore pressure and safety factor changes in cut slopes in sedimentary and residual soils
Slope design Selection of the profile for a new cut slopeIt is perhaps appropriate to revisit and re-emphasise what was said earlier, namely that the selection of an appropriate profile for a new cut slope in residual soil is a matter of judgment based more on non-analytical approaches, than on analytical estimation. Despite this, much of the article has been spent looking at theory and analytical methods,
particularly in relation to the influence of climate and rainfall on slope stability. This has not been done to stimulate the use of analytical methods as a design process in preference to non-analytical methods. Rather, it has been done because estimating the influence of rainfall is a predominant issue in selecting stable slopes, and knowledge of the theoretical mechanism (or mechanisms) by which rainfall influences stability ought to be an aid in the process of using judgment to determine slope profiles.
A further point that should be emphasised here is that the use of non-analytical methods should in no way diminish the importance of site investigations, especially investigations aimed at providing a comprehensive picture of the geology of a site. A simple illustration of the importance of this is given in Figure 11. The prime objective of a site investigation in relation to the design of cut slopes must be to determine an accurate soil profile at the location of the cut, especially in weathered igneous rocks such as granite. In many situations, especially in highway construction, it is inevitable that slopes will be steep and safety factors will not be high. In this situation it is imperative to take maximum advantage of the stronger materials, especially any unweathered rock. The cut should be vertical or near vertical in competent rock, in order to minimise earthworks, and to make “room” for more gentle slopes in the soil layers in the upper levels of the cut, as indicated in Figure 11.
Figure 11: Profile of a cut slope in weathered igneous rock such as granite
Profiles of the sort illustrated in Figure 11 are common in weathered granites, such as those found in Hong Kong and Malaysia. It is highly desirable to determine the profiles
57
Wesley, L. (2011). Stability of slopes in residual soils. Obras y Proyectos 10, 47-61
prior to commencement of construction rather than during excavation. For practical reasons slopes are cut from the top down in their final profile, and any adjustments to this profile made necessary by soil conditions revealed during excavation poses construction difficulties. It is not an easy matter getting excavation equipment back up to the top of a cut slope to re-shape the profile. For determining the surface of the sound rock, geophysical methods can be a better approach than conventional boreholes.
In volcanic materials, the increase in strength with depth found in weathered granites may be very small or insignificant, in which case a uniform slope angle is likely to be the most appropriate. However, volcanic material is likely to be rather unpredictable, which again emphasises the need for thorough site investigations.
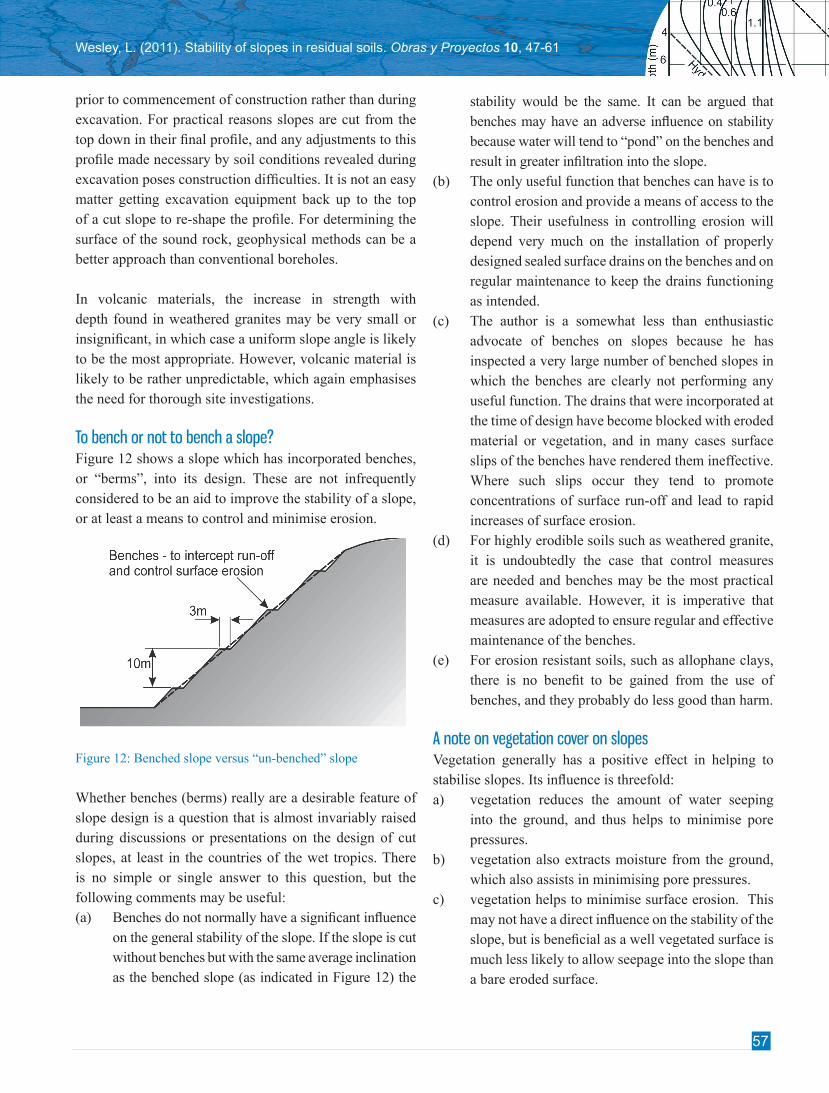
To bench or not to bench a slope?Figure 12 shows a slope which has incorporated benches, or “berms”, into its design. These are not infrequently considered to be an aid to improve the stability of a slope, or at least a means to control and minimise erosion.
Figure 12: Benched slope versus “un-benched” slope
Whether benches (berms) really are a desirable feature of slope design is a question that is almost invariably raised during discussions or presentations on the design of cut slopes, at least in the countries of the wet tropics. There is no simple or single answer to this question, but the following comments may be useful: (a) Benches do not normally have a significant influence
on the general stability of the slope. If the slope is cut without benches but with the same average inclination as the benched slope (as indicated in Figure 12) the
stability would be the same. It can be argued that benches may have an adverse influence on stability because water will tend to “pond” on the benches and result in greater infiltration into the slope.
(b) The only useful function that benches can have is to control erosion and provide a means of access to the slope. Their usefulness in controlling erosion will depend very much on the installation of properly designed sealed surface drains on the benches and on regular maintenance to keep the drains functioning as intended.
(c) The author is a somewhat less than enthusiastic advocate of benches on slopes because he has inspected a very large number of benched slopes in which the benches are clearly not performing any useful function. The drains that were incorporated at the time of design have become blocked with eroded material or vegetation, and in many cases surface slips of the benches have rendered them ineffective. Where such slips occur they tend to promote concentrations of surface run-off and lead to rapid increases of surface erosion.
(d) For highly erodible soils such as weathered granite, it is undoubtedly the case that control measures are needed and benches may be the most practical measure available. However, it is imperative that measures are adopted to ensure regular and effective maintenance of the benches.
(e) For erosion resistant soils, such as allophane clays, there is no benefit to be gained from the use of benches, and they probably do less good than harm.
A note on vegetation cover on slopesVegetation generally has a positive effect in helping to stabilise slopes. Its influence is threefold:a) vegetation reduces the amount of water seeping
into the ground, and thus helps to minimise pore pressures.
b) vegetation also extracts moisture from the ground, which also assists in minimising pore pressures.
c) vegetation helps to minimise surface erosion. This may not have a direct influence on the stability of the slope, but is beneficial as a well vegetated surface is much less likely to allow seepage into the slope than a bare eroded surface.
58
Wesley, L. (2011). Obras y Proyectos 10, 47-61
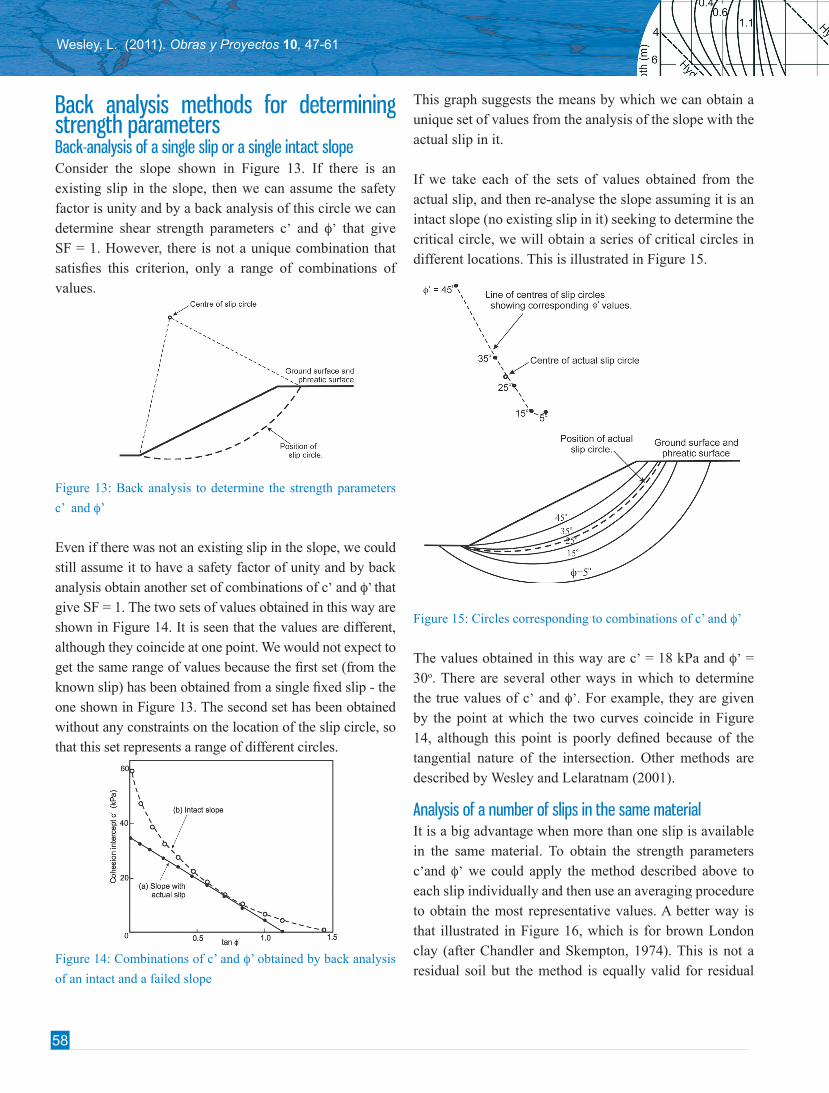
Back analysis methods for determining strength parameters Back-analysis of a single slip or a single intact slope Consider the slope shown in Figure 13. If there is an existing slip in the slope, then we can assume the safety factor is unity and by a back analysis of this circle we can determine shear strength parameters c’ and f’ that give SF = 1. However, there is not a unique combination that satisfies this criterion, only a range of combinations of values.
Figure 13: Back analysis to determine the strength parameters
c’ and f’
Even if there was not an existing slip in the slope, we could still assume it to have a safety factor of unity and by back analysis obtain another set of combinations of c’ and f’ that give SF = 1. The two sets of values obtained in this way are shown in Figure 14. It is seen that the values are different, although they coincide at one point. We would not expect to get the same range of values because the first set (from the known slip) has been obtained from a single fixed slip - the one shown in Figure 13. The second set has been obtained without any constraints on the location of the slip circle, so that this set represents a range of different circles.
Figure 14: Combinations of c’ and f’ obtained by back analysis
of an intact and a failed slope
This graph suggests the means by which we can obtain a unique set of values from the analysis of the slope with the actual slip in it.
If we take each of the sets of values obtained from the actual slip, and then re-analyse the slope assuming it is an intact slope (no existing slip in it) seeking to determine the critical circle, we will obtain a series of critical circles in different locations. This is illustrated in Figure 15.
Figure 15: Circles corresponding to combinations of c’ and f’
The values obtained in this way are c’ = 18 kPa and f’ = 30o. There are several other ways in which to determine the true values of c’ and f’. For example, they are given by the point at which the two curves coincide in Figure 14, although this point is poorly defined because of the tangential nature of the intersection. Other methods are described by Wesley and Lelaratnam (2001).
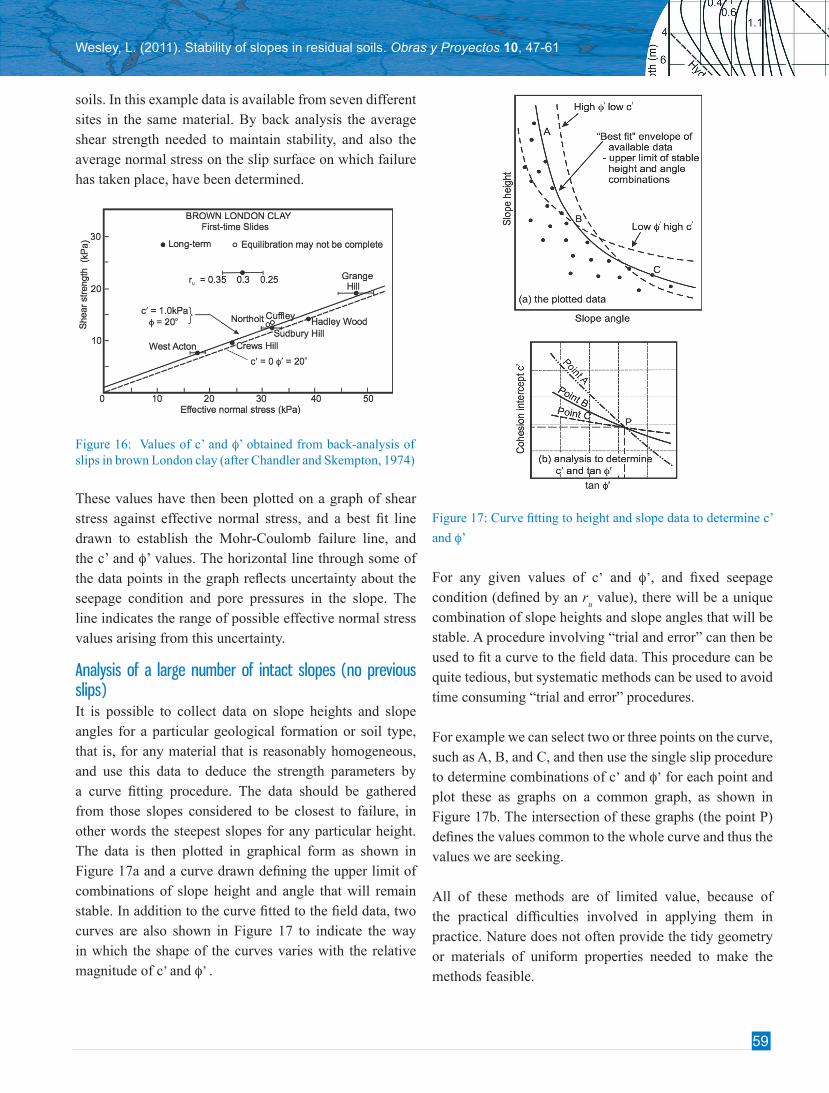
Analysis of a number of slips in the same material It is a big advantage when more than one slip is available in the same material. To obtain the strength parameters c’and f’ we could apply the method described above to each slip individually and then use an averaging procedure to obtain the most representative values. A better way is that illustrated in Figure 16, which is for brown London clay (after Chandler and Skempton, 1974). This is not a residual soil but the method is equally valid for residual
59
Wesley, L. (2011). Stability of slopes in residual soils. Obras y Proyectos 10, 47-61
soils. In this example data is available from seven different sites in the same material. By back analysis the average shear strength needed to maintain stability, and also the average normal stress on the slip surface on which failure has taken place, have been determined.
Figure 16: Values of c’ and f’ obtained from back-analysis of slips in brown London clay (after Chandler and Skempton, 1974)
These values have then been plotted on a graph of shear stress against effective normal stress, and a best fit line drawn to establish the Mohr-Coulomb failure line, and the c’ and f’ values. The horizontal line through some of the data points in the graph reflects uncertainty about the seepage condition and pore pressures in the slope. The line indicates the range of possible effective normal stress values arising from this uncertainty.
Analysis of a large number of intact slopes (no previous slips) It is possible to collect data on slope heights and slope angles for a particular geological formation or soil type, that is, for any material that is reasonably homogeneous, and use this data to deduce the strength parameters by a curve fitting procedure. The data should be gathered from those slopes considered to be closest to failure, in other words the steepest slopes for any particular height. The data is then plotted in graphical form as shown in Figure 17a and a curve drawn defining the upper limit of combinations of slope height and angle that will remain stable. In addition to the curve fitted to the field data, two curves are also shown in Figure 17 to indicate the way in which the shape of the curves varies with the relative magnitude of c’ and f’ .
Figure 17: Curve fitting to height and slope data to determine c’
and f’
For any given values of c’ and f’, and fixed seepage condition (defined by an r
u value), there will be a unique
combination of slope heights and slope angles that will be stable. A procedure involving “trial and error” can then be used to fit a curve to the field data. This procedure can be quite tedious, but systematic methods can be used to avoid time consuming “trial and error” procedures.
For example we can select two or three points on the curve, such as A, B, and C, and then use the single slip procedure to determine combinations of c’ and f’ for each point and plot these as graphs on a common graph, as shown in Figure 17b. The intersection of these graphs (the point P) defines the values common to the whole curve and thus the values we are seeking. All of these methods are of limited value, because of the practical difficulties involved in applying them in practice. Nature does not often provide the tidy geometry or materials of uniform properties needed to make the methods feasible.
60
Wesley, L. (2011). Obras y Proyectos 10, 47-61
Remedial measures Engineering involvement with slope stability issues frequently arises after failure has occurred. The engineer
may be required to determine the cause of failure; his most important role, however, is likely to be determination of appropriate remedial measures to stabilise the slope. To stabilise a slip after it has occurred, or to increase the safety factor of a marginally stable slope we can do one or more of the following:
1. Decrease the disturbing forces(a) flatten the slope(b) decrease the height(c) add a toe weight (berm)
2. Increase the shear resistance(a) lower the pore water pressure (drainage)(b) use mechanical keying such as piling(c) grout the soil
It is difficult to generalise as to which of the above should be used in a particular case. All of the possibilities under (1) are usually practical and relevant if the slope geometry is suitable; of the possibilities under (2) the first (a) is by far the most relevant and practicable, 2(b) and 2(c) can only rarely be used. The choice of measure to use is very dependent on the type of slip. There are two basic kinds of slips:1. Rotational – typical of cuttings and embankments –
usually in slope of low to moderate height. 2. Translational – typical of natural slopes – often in very
large slopes of “indefinite” extent.
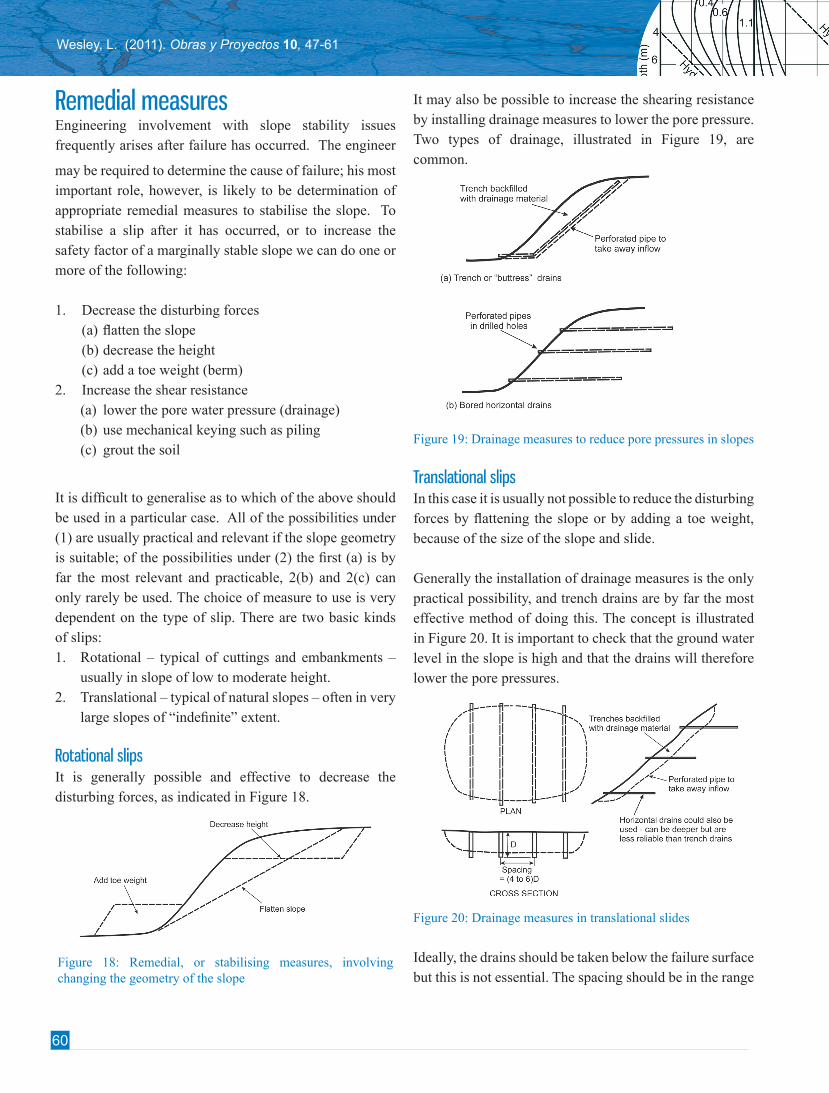
Rotational slipsIt is generally possible and effective to decrease the disturbing forces, as indicated in Figure 18.
It may also be possible to increase the shearing resistance by installing drainage measures to lower the pore pressure. Two types of drainage, illustrated in Figure 19, are common.
Figure 19: Drainage measures to reduce pore pressures in slopes
Translational slipsIn this case it is usually not possible to reduce the disturbing forces by flattening the slope or by adding a toe weight, because of the size of the slope and slide.
Generally the installation of drainage measures is the only practical possibility, and trench drains are by far the most effective method of doing this. The concept is illustrated in Figure 20. It is important to check that the ground water level in the slope is high and that the drains will therefore lower the pore pressures.
Figure 20: Drainage measures in translational slides
Ideally, the drains should be taken below the failure surface but this is not essential. The spacing should be in the range
Figure 18: Remedial, or stabilising measures, involving changing the geometry of the slope
61
Wesley, L. (2011). Stability of slopes in residual soils. Obras y Proyectos 10, 47-61
of 3 to 5 times the depth. It should be noted that in many remedial situations, especially those involving large translation slides in residual soils, the safety factor is often very low, and it is usually impractical to increase the value by more than say 0.1 or 0.2, i.e. we can only hope to raise a safety factor of 1.0 to a value of 1.1 or 1.2. At a dam site (the Clyde Dam) in the South Island of New Zealand, half a billion dollars was spent stabilising landslides – in most cases the safety factors were raised by only 0.1 or 0.2.
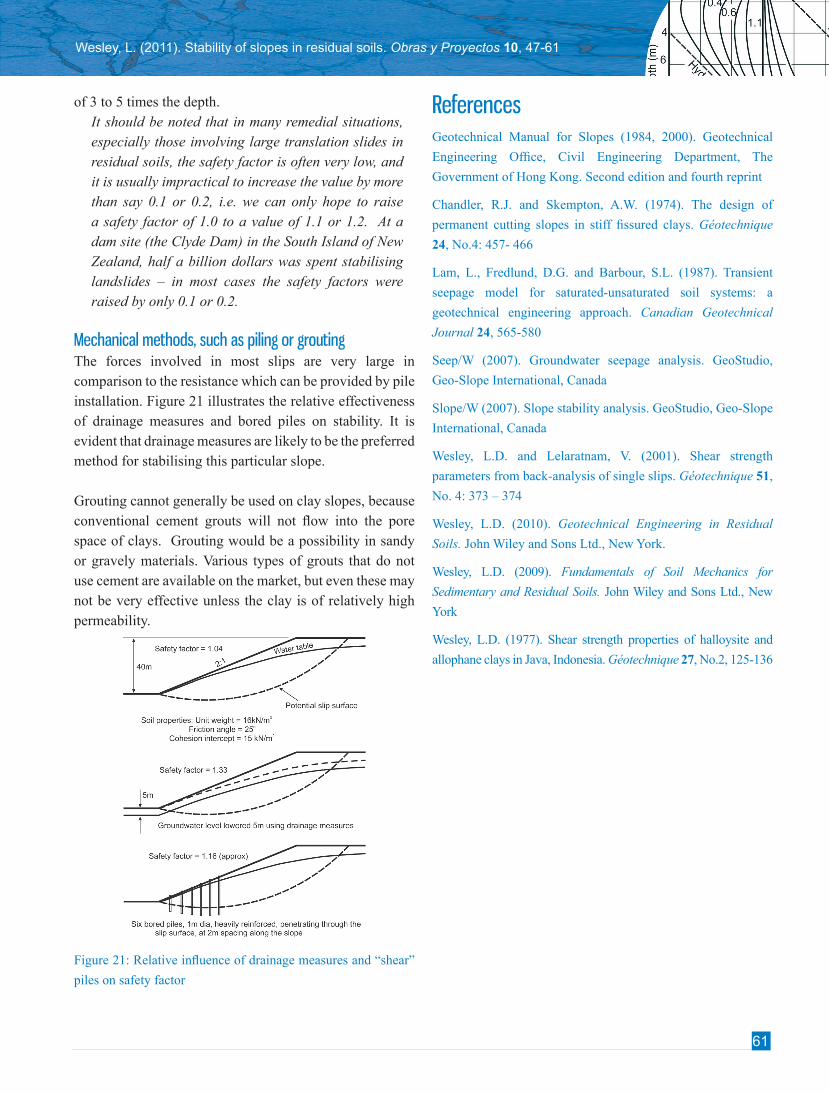
Mechanical methods, such as piling or grouting The forces involved in most slips are very large in comparison to the resistance which can be provided by pile installation. Figure 21 illustrates the relative effectiveness of drainage measures and bored piles on stability. It is evident that drainage measures are likely to be the preferred method for stabilising this particular slope.
Grouting cannot generally be used on clay slopes, because conventional cement grouts will not flow into the pore space of clays. Grouting would be a possibility in sandy or gravely materials. Various types of grouts that do not use cement are available on the market, but even these may not be very effective unless the clay is of relatively high permeability.
Figure 21: Relative influence of drainage measures and “shear”
piles on safety factor
References Geotechnical Manual for Slopes (1984, 2000). Geotechnical
Engineering Office, Civil Engineering Department, The
Government of Hong Kong. Second edition and fourth reprint
Chandler, R.J. and Skempton, A.W. (1974). The design of
permanent cutting slopes in stiff fissured clays. Géotechnique
24, No.4: 457- 466
Lam, L., Fredlund, D.G. and Barbour, S.L. (1987). Transient
seepage model for saturated-unsaturated soil systems: a
geotechnical engineering approach. Canadian Geotechnical
Journal 24, 565-580
Seep/W (2007). Groundwater seepage analysis. GeoStudio,
Geo-Slope International, Canada
Slope/W (2007). Slope stability analysis. GeoStudio, Geo-Slope
International, Canada
Wesley, L.D. and Lelaratnam, V. (2001). Shear strength
parameters from back-analysis of single slips. Géotechnique 51,
No. 4: 373 – 374
Wesley, L.D. (2010). Geotechnical Engineering in Residual
Soils. John Wiley and Sons Ltd., New York.
Wesley, L.D. (2009). Fundamentals of Soil Mechanics for
Sedimentary and Residual Soils. John Wiley and Sons Ltd., New
York
Wesley, L.D. (1977). Shear strength properties of halloysite and
allophane clays in Java, Indonesia. Géotechnique 27, No.2, 125-136