starwood corporate expansion strategy
TRANSCRIPT
TEAM THREE
Arniv GuptaEaton Xie Jia
Ivy HePramod Kamath
Shinichi InoueGreg Stevens
Agenda• Executive Summary………………………………………………………………………………………….Ivy
• Company Analysis…………………………………………………………………………………. …Shinichi
• Industry Analysis ………………………………………………………………………………….....Shinichi
• Analysis of Customers and Competition……………………………………………………Pramod
• Marketing Plan…………………………………………………………………………………….……Pramod
• Management Team………………………………………………………………………………………..Greg
• Financial Plan and Conclusion………………………………………………………………………..Greg
• Appendices …………………………………………………………………………………………………………

Executive Summary
Executive Summary
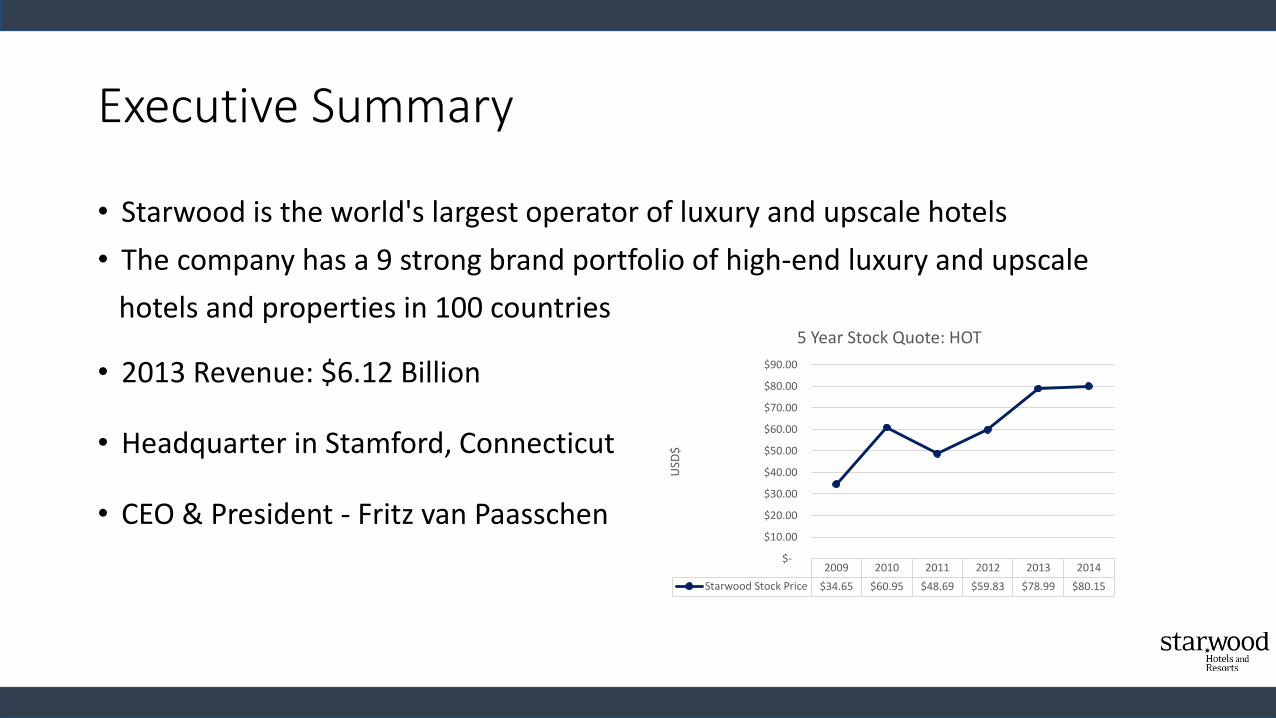
• Starwood is the world's largest operator of luxury and upscale hotels
• The company has a 9 strong brand portfolio of high-end luxury and upscale
hotels and properties in 100 countries
• 2013 Revenue: $6.12 Billion
• Headquarter in Stamford, Connecticut
• CEO & President - Fritz van Paasschen
2009 2010 2011 2012 2013 2014
Starwood Stock Price $34.65 $60.95 $48.69 $59.83 $78.99 $80.15
$-
$10.00
$20.00
$30.00
$40.00
$50.00
$60.00
$70.00
$80.00
$90.00
USD
$
5 Year Stock Quote: HOT
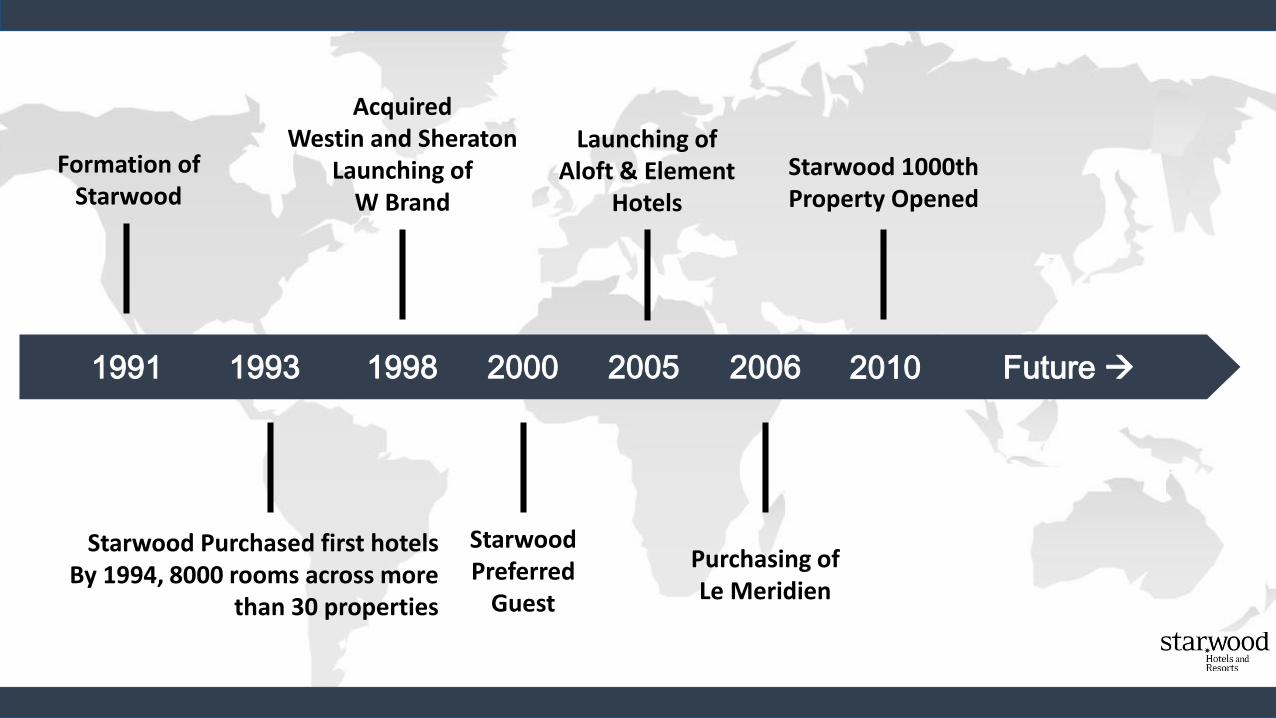
1991 1993 1998 2000 2005 2006 2010 Future
Formation of Starwood
Starwood Purchased first hotelsBy 1994, 8000 rooms across more
than 30 properties
Acquired Westin and Sheraton
Launching ofW Brand
Starwood Preferred
Guest
Launching ofAloft & Element
Hotels
Purchasing of Le Meridien
Starwood 1000th Property Opened
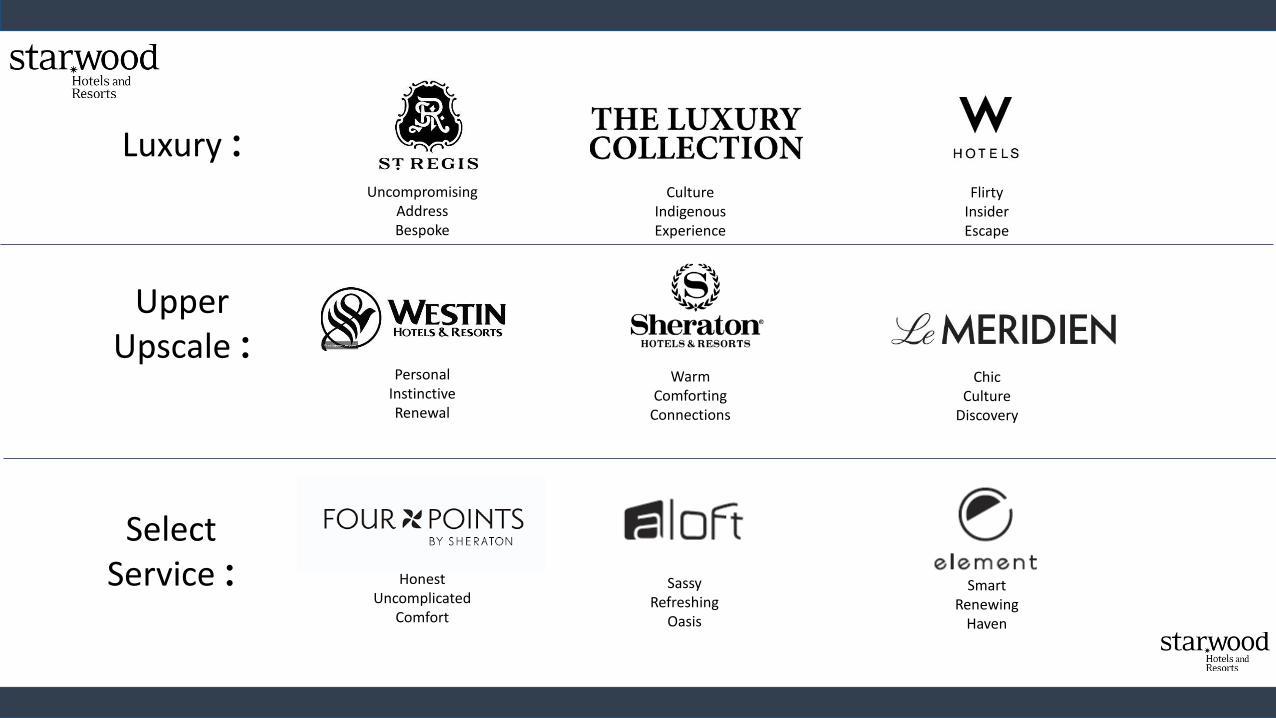
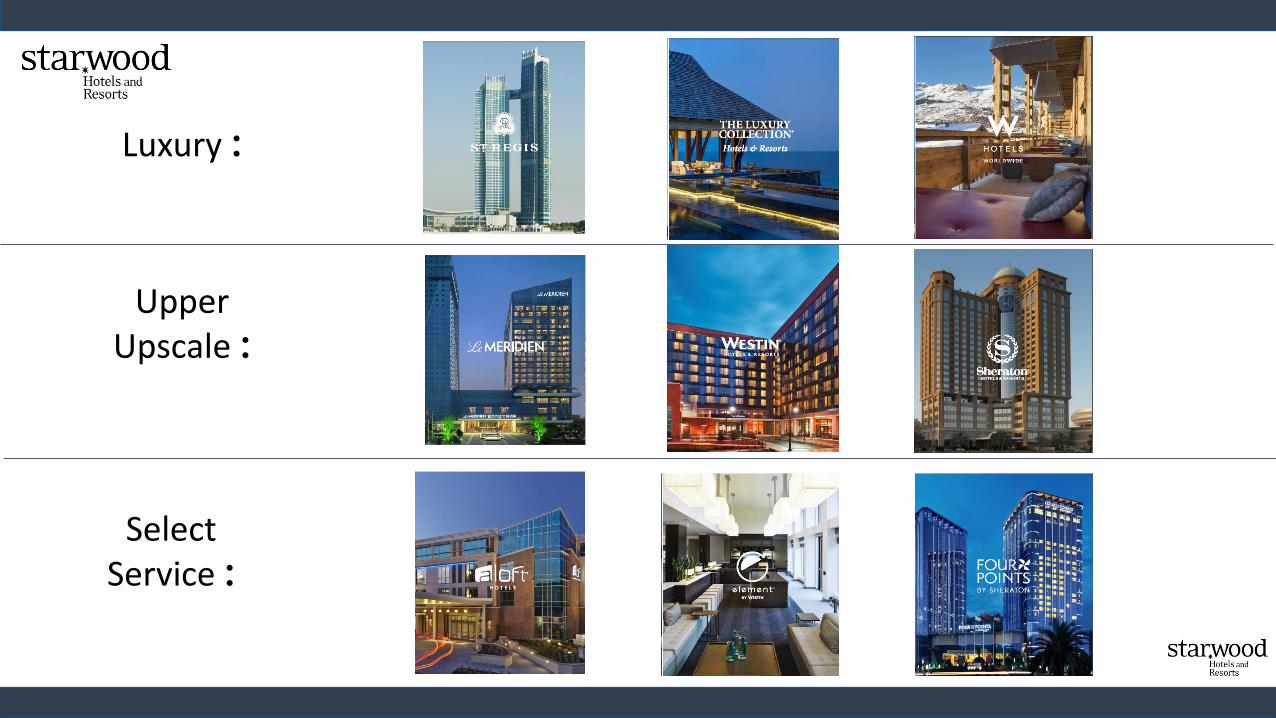
Luxury :
Upper Upscale :
Select Service :
UncompromisingAddressBespoke
CultureIndigenousExperience
FlirtyInsiderEscape
PersonalInstinctiveRenewal
WarmComforting
Connections
ChicCulture
Discovery
SassyRefreshing
Oasis
SmartRenewing
Haven
HonestUncomplicated
Comfort
Luxury :
Upper Upscale :
Select Service :
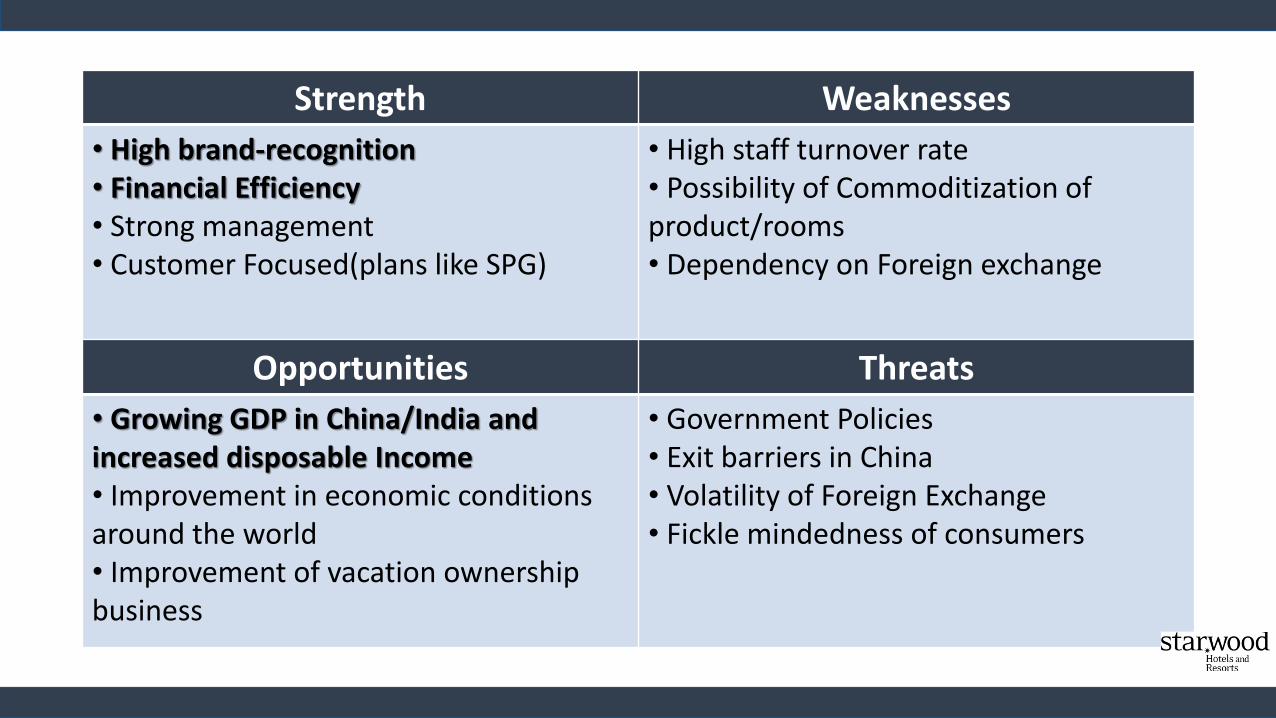
Strength Weaknesses
• High brand-recognition • Financial Efficiency• Strong management • Customer Focused(plans like SPG)
• High staff turnover rate• Possibility of Commoditization of product/rooms• Dependency on Foreign exchange
Opportunities Threats
• Growing GDP in China/India and increased disposable Income• Improvement in economic conditions around the world• Improvement of vacation ownership business
• Government Policies• Exit barriers in China• Volatility of Foreign Exchange• Fickle mindedness of consumers

How can Starwood leverage its brand and financial efficiencies to tap into
the high growth markets with increasing disposable incomes?
The Question

Company Analysis
Company Analysis
• Starwood aims to capitalize on the rise of a new breed of wealthy luxury travellers worldwide and high-powered business travellers while venturing into emerging markets
• Six of its nine brands - St. Regis Hotels & Resorts, The Luxury Collection, W Hotels, Westin Hotels & Resorts, Le Meridien and Sheraton Hotels & Resorts -represent full-service properties which range in amenities from luxury hotels and resorts to upper-upscale hotels
• Starwood also operates three moderately-priced, select-service hotel brands -Four Points by Sheraton, Element and Aloft
Starwood’s USP
• Starwood is strongly focused on the Luxury Segment of the market
• In 2012, the company expanded its Starwood Preferred Guest(SPG) program at a cost of 25 million USD
• The new programme benefits included rolling 24-hour check-in and check-out times and personal travel assistants or “ambassadors”
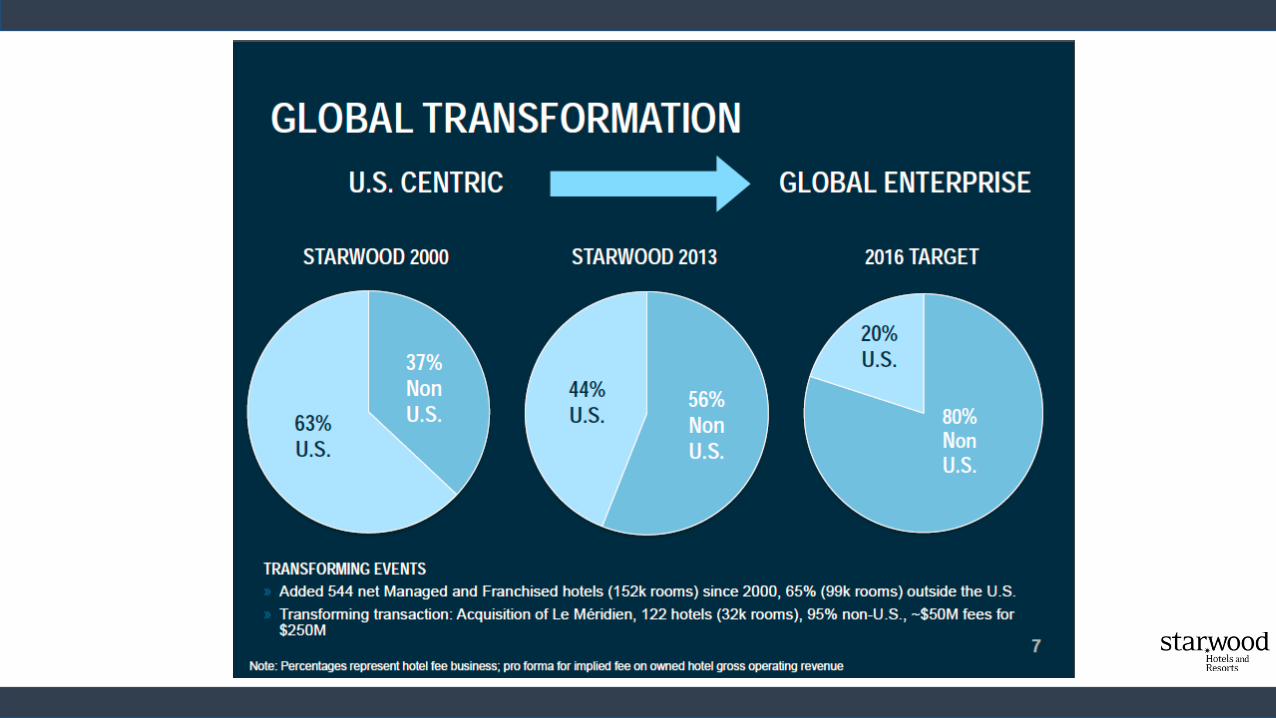
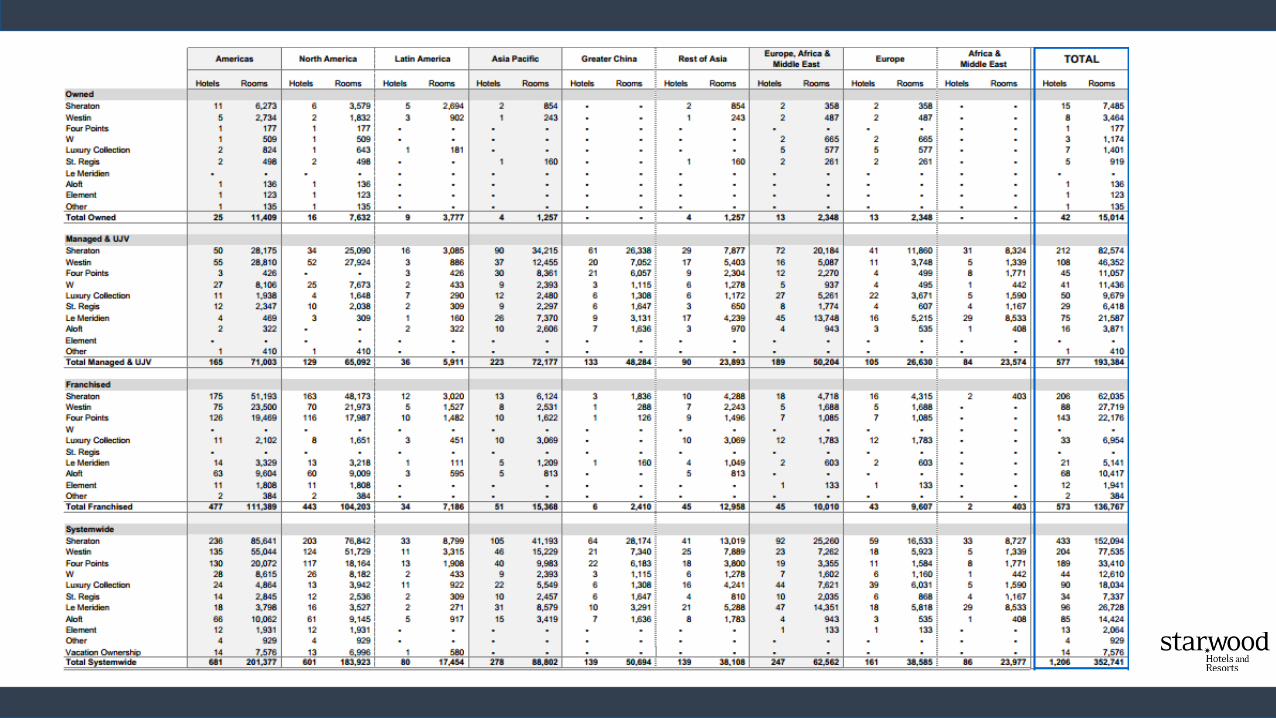
• It is the most global hotel company with 1,200 properties housing 347,000 rooms across 100 countries
• The share of rooms in USA is only 45% as compared to nearly 70% for the biggest three competitors
• Starwood has taken up a leadership position in the Non-US Luxury and Upscale market with more than 162,000 rooms distributed across the world
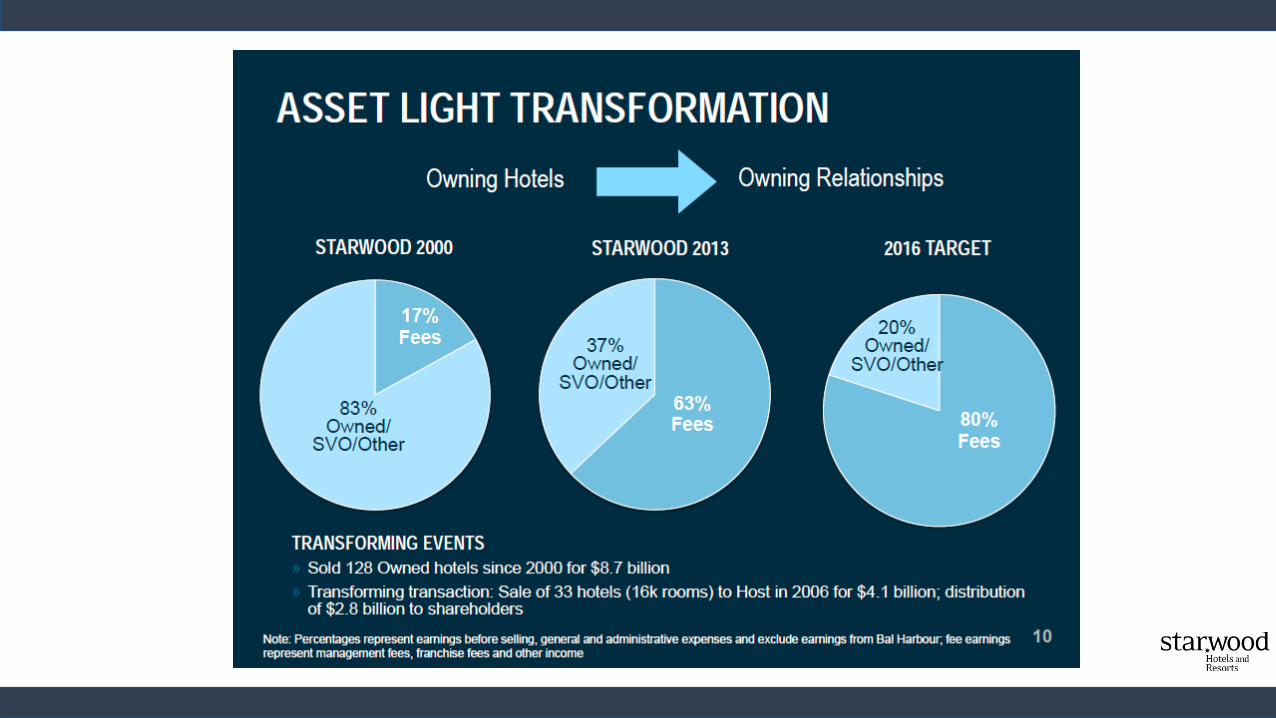
• Transformation from Owning hotels towards Managing and Franchising Hotels
Success Driving Factors
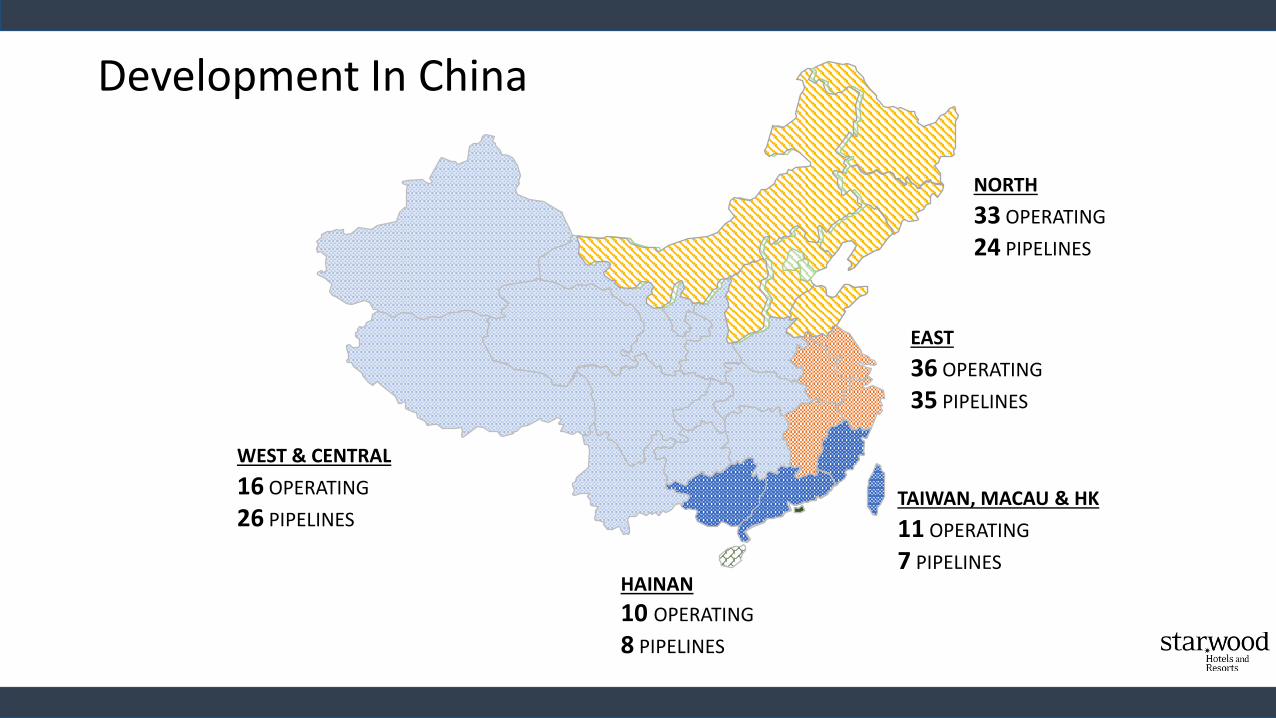
Development In China
WEST & CENTRAL
16 OPERATING
26 PIPELINES
NORTH
33 OPERATING
24 PIPELINES
EAST
36 OPERATING
35 PIPELINES
TAIWAN, MACAU & HK
11 OPERATING
7 PIPELINESHAINAN
10 OPERATING
8 PIPELINES
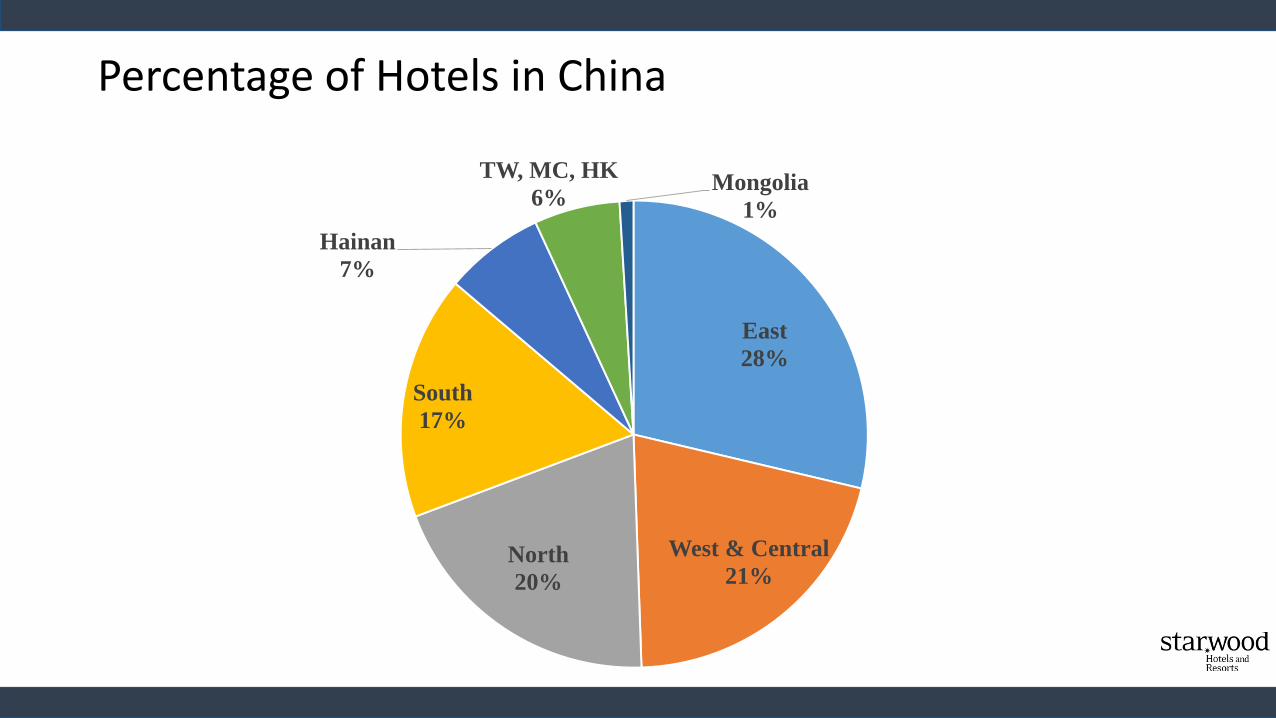
East
28%
West & Central
21%North
20%
South
17%
Hainan
7%
TW, MC, HK
6%Mongolia
1%
Percentage of Hotels in China

Industry Analysis
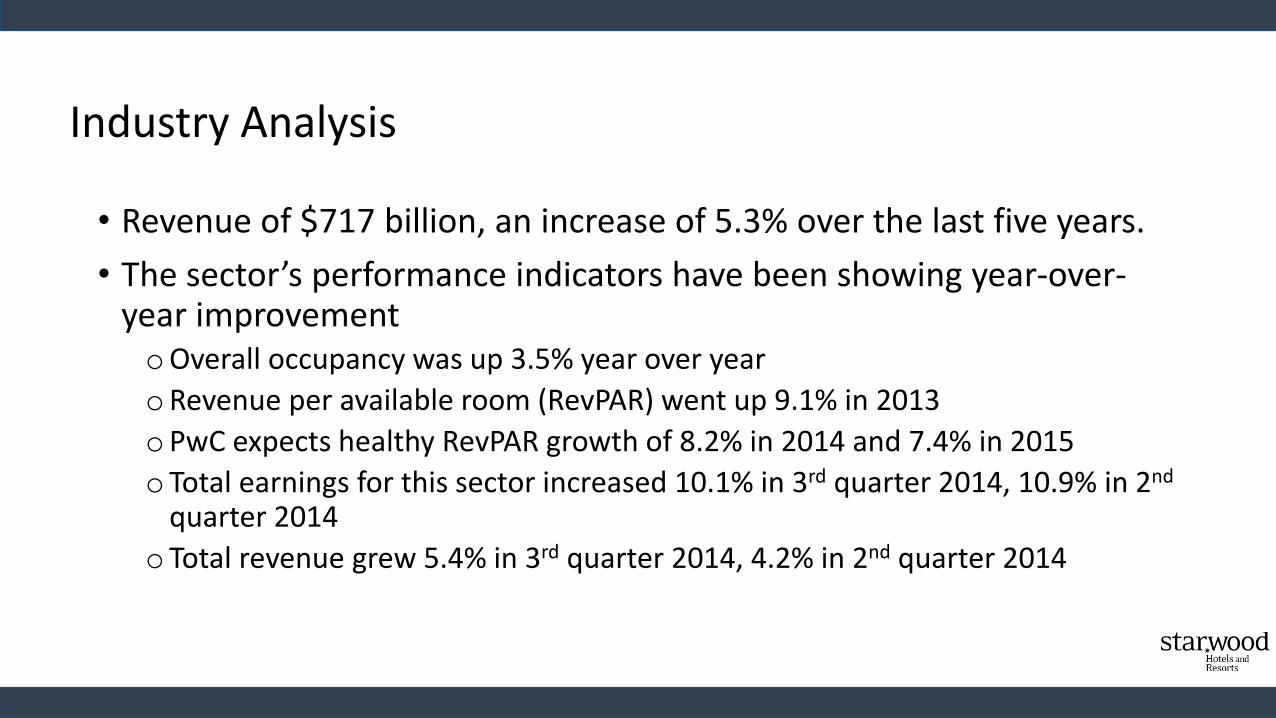
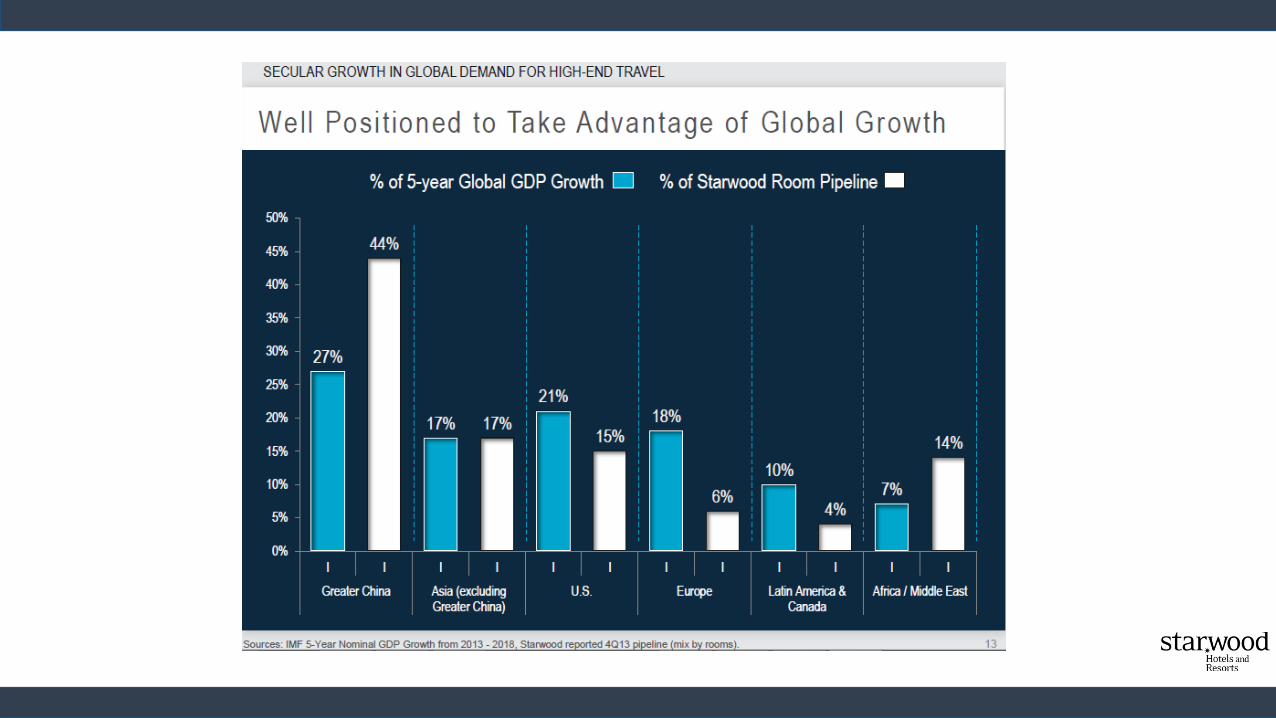
• Revenue of $717 billion, an increase of 5.3% over the last five years.
• The sector’s performance indicators have been showing year-over-year improvementoOverall occupancy was up 3.5% year over year
oRevenue per available room (RevPAR) went up 9.1% in 2013
oPwC expects healthy RevPAR growth of 8.2% in 2014 and 7.4% in 2015
o Total earnings for this sector increased 10.1% in 3rd quarter 2014, 10.9% in 2nd
quarter 2014
o Total revenue grew 5.4% in 3rd quarter 2014, 4.2% in 2nd quarter 2014
Industry Analysis
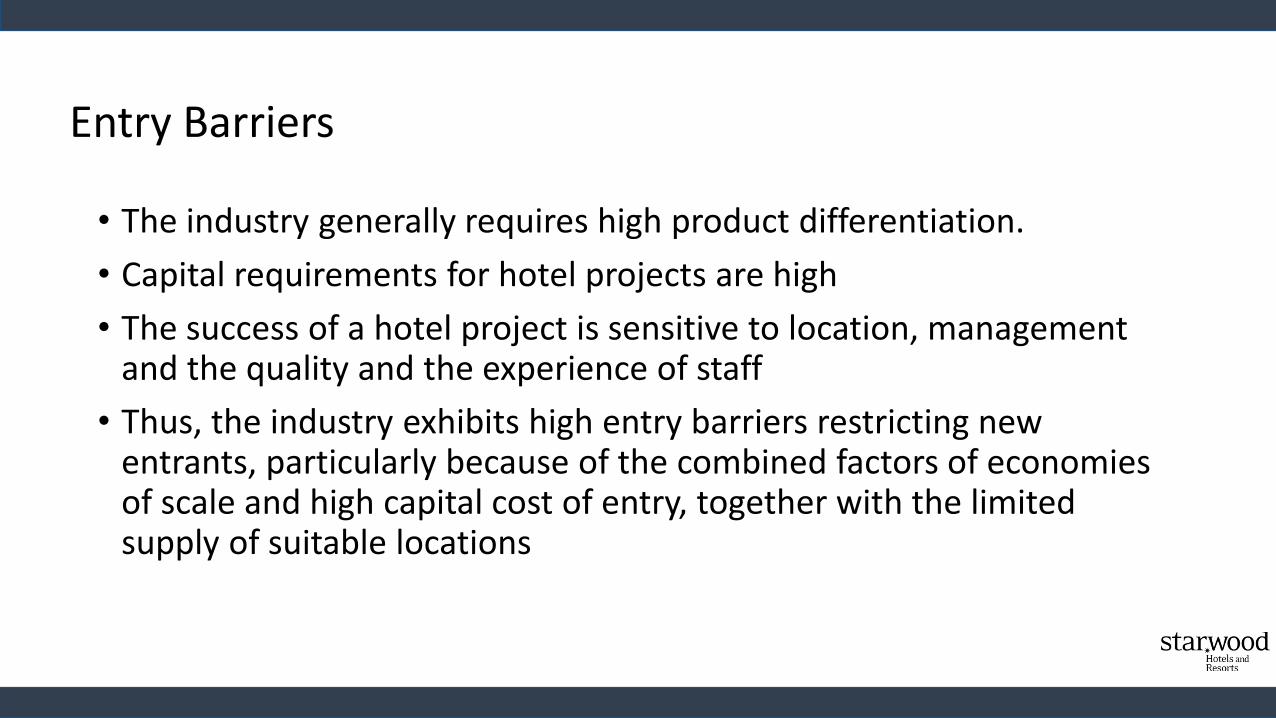
• The industry generally requires high product differentiation.
• Capital requirements for hotel projects are high
• The success of a hotel project is sensitive to location, management and the quality and the experience of staff
• Thus, the industry exhibits high entry barriers restricting new entrants, particularly because of the combined factors of economies of scale and high capital cost of entry, together with the limited supply of suitable locations
Entry Barriers
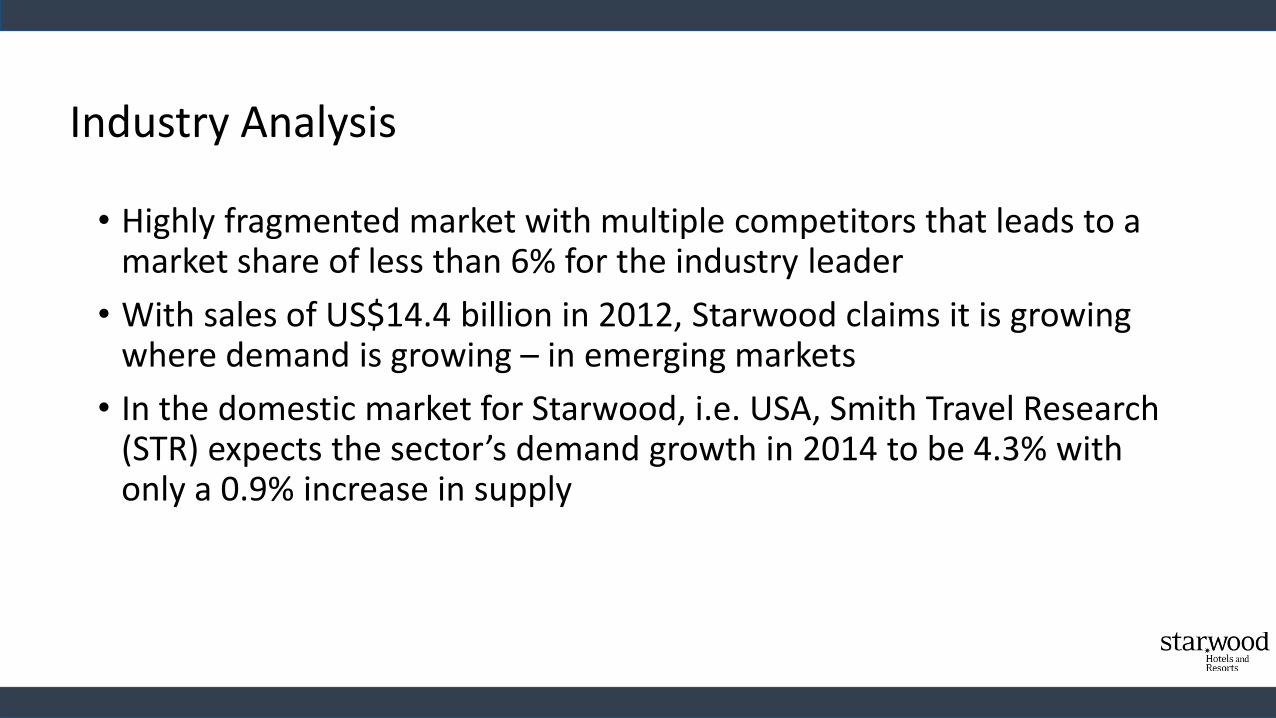
• Highly fragmented market with multiple competitors that leads to a market share of less than 6% for the industry leader
• With sales of US$14.4 billion in 2012, Starwood claims it is growing where demand is growing – in emerging markets
• In the domestic market for Starwood, i.e. USA, Smith Travel Research (STR) expects the sector’s demand growth in 2014 to be 4.3% with only a 0.9% increase in supply
Industry Analysis

Customer Analysis
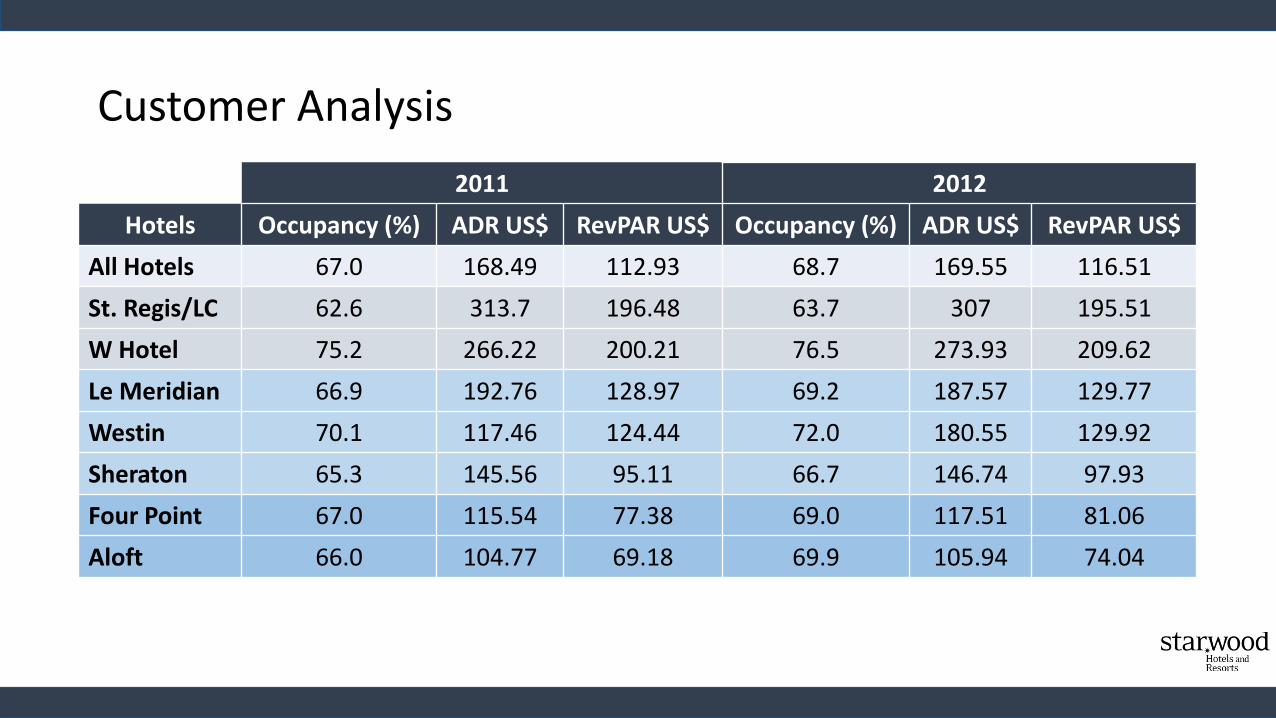
Customer Analysis
2011 2012
Hotels Occupancy (%) ADR US$ RevPAR US$ Occupancy (%) ADR US$ RevPAR US$
All Hotels 67.0 168.49 112.93 68.7 169.55 116.51
St. Regis/LC 62.6 313.7 196.48 63.7 307 195.51
W Hotel 75.2 266.22 200.21 76.5 273.93 209.62
Le Meridian 66.9 192.76 128.97 69.2 187.57 129.77
Westin 70.1 117.46 124.44 72.0 180.55 129.92
Sheraton 65.3 145.56 95.11 66.7 146.74 97.93
Four Point 67.0 115.54 77.38 69.0 117.51 81.06
Aloft 66.0 104.77 69.18 69.9 105.94 74.04
Competitor Analysis
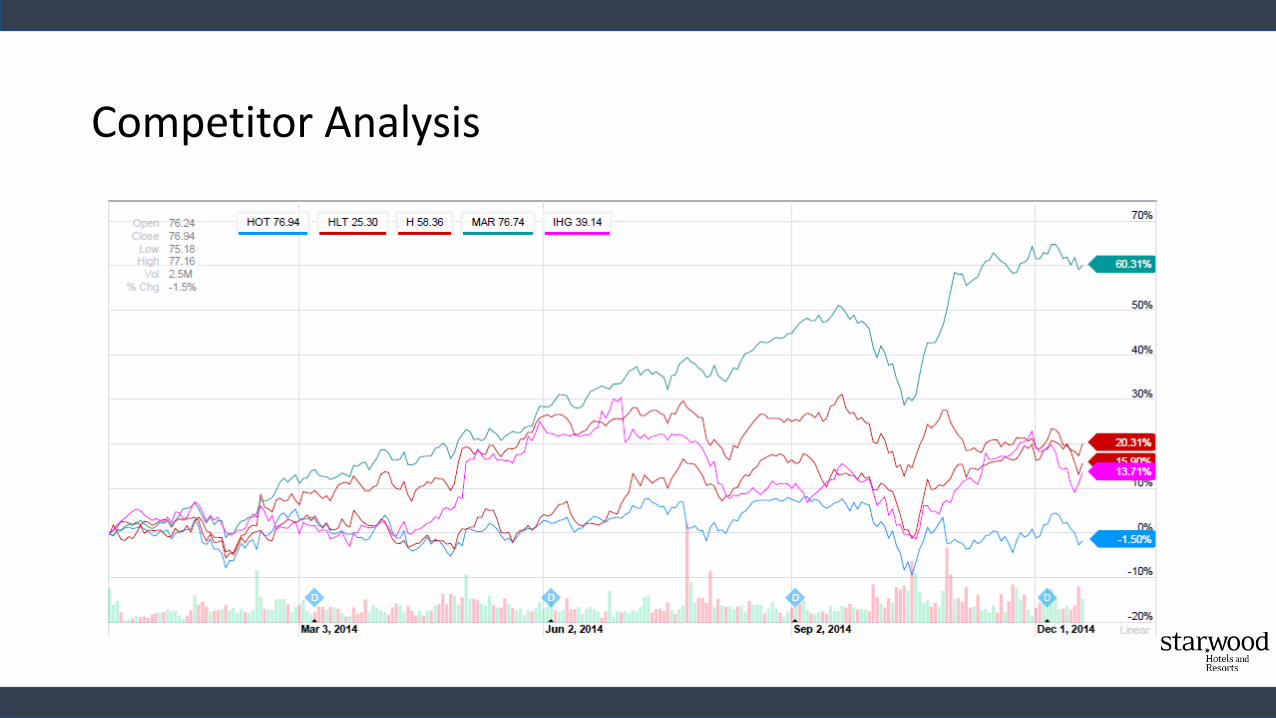
Competitor Analysis
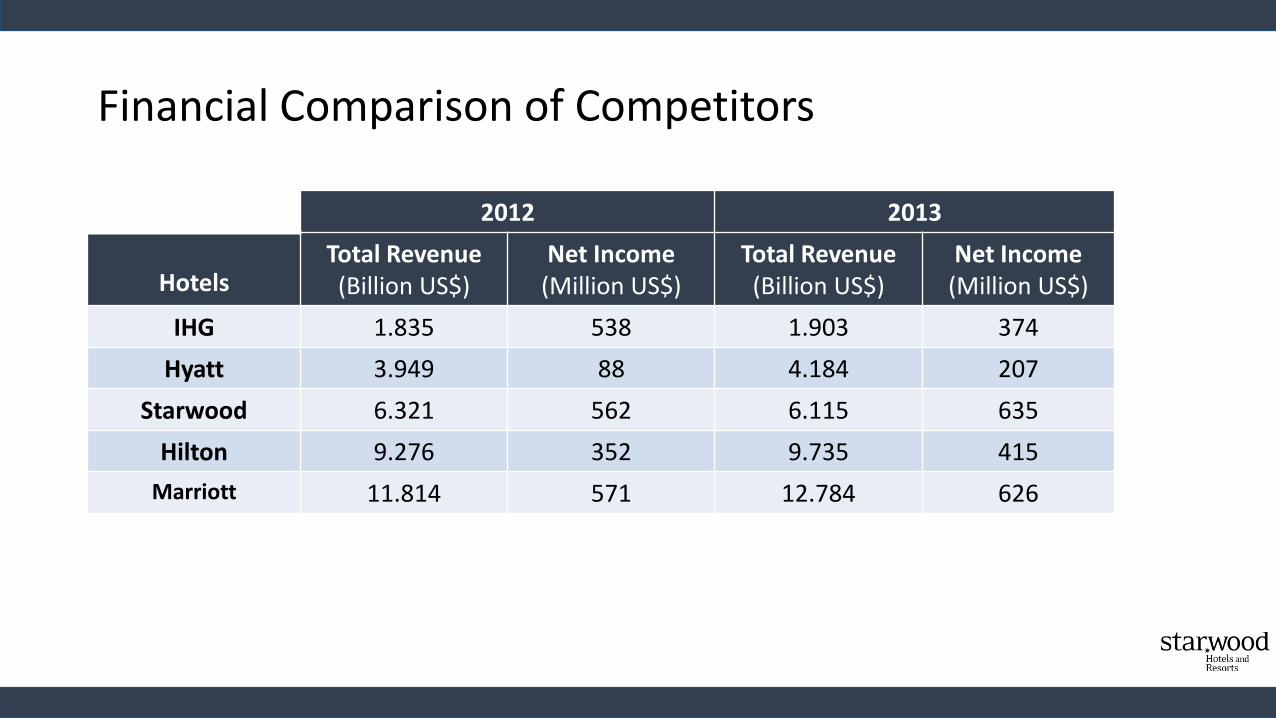
Financial Comparison of Competitors
2012 2013
HotelsTotal Revenue(Billion US$)
Net Income(Million US$)
Total Revenue(Billion US$)
Net Income(Million US$)
IHG 1.835 538 1.903 374
Hyatt 3.949 88 4.184 207
Starwood 6.321 562 6.115 635
Hilton 9.276 352 9.735 415
Marriott 11.814 571 12.784 626

Marketing Plan
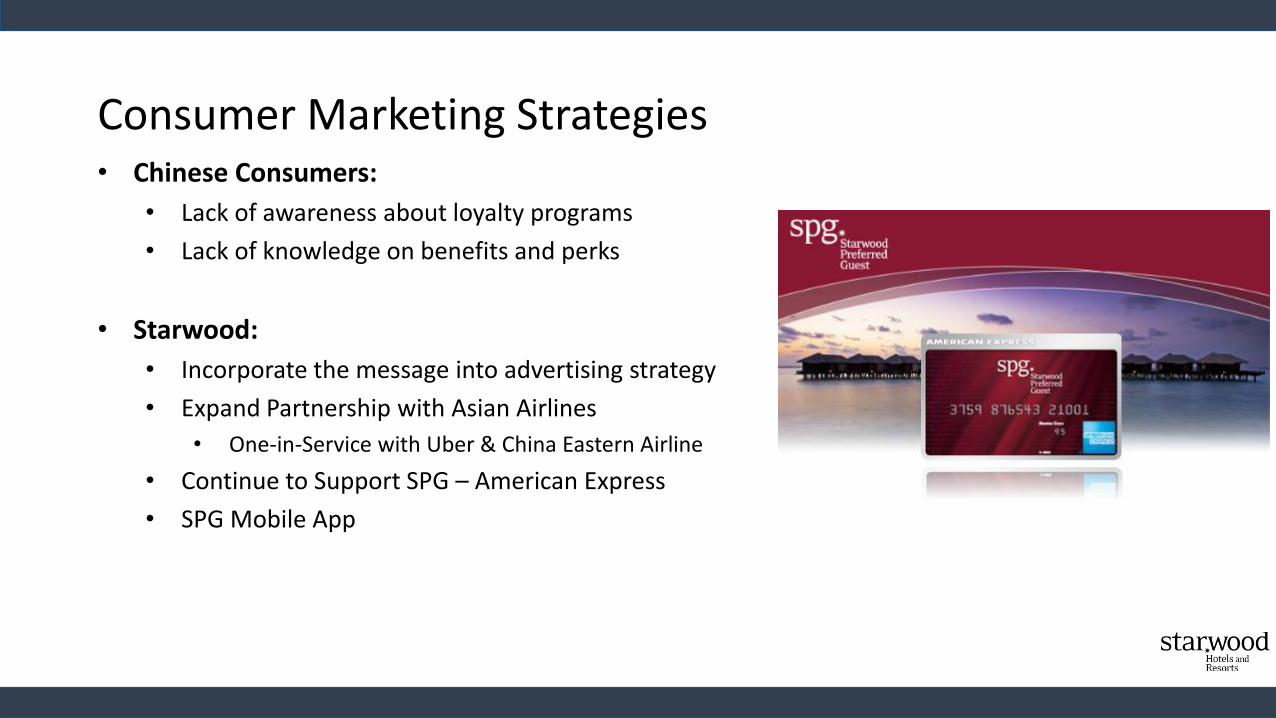
Consumer Marketing Strategies• Chinese Consumers:
• Lack of awareness about loyalty programs
• Lack of knowledge on benefits and perks
• Starwood:
• Incorporate the message into advertising strategy
• Expand Partnership with Asian Airlines
• One-in-Service with Uber & China Eastern Airline
• Continue to Support SPG – American Express
• SPG Mobile App

Partnership with Emirates Airline/Other Airlines
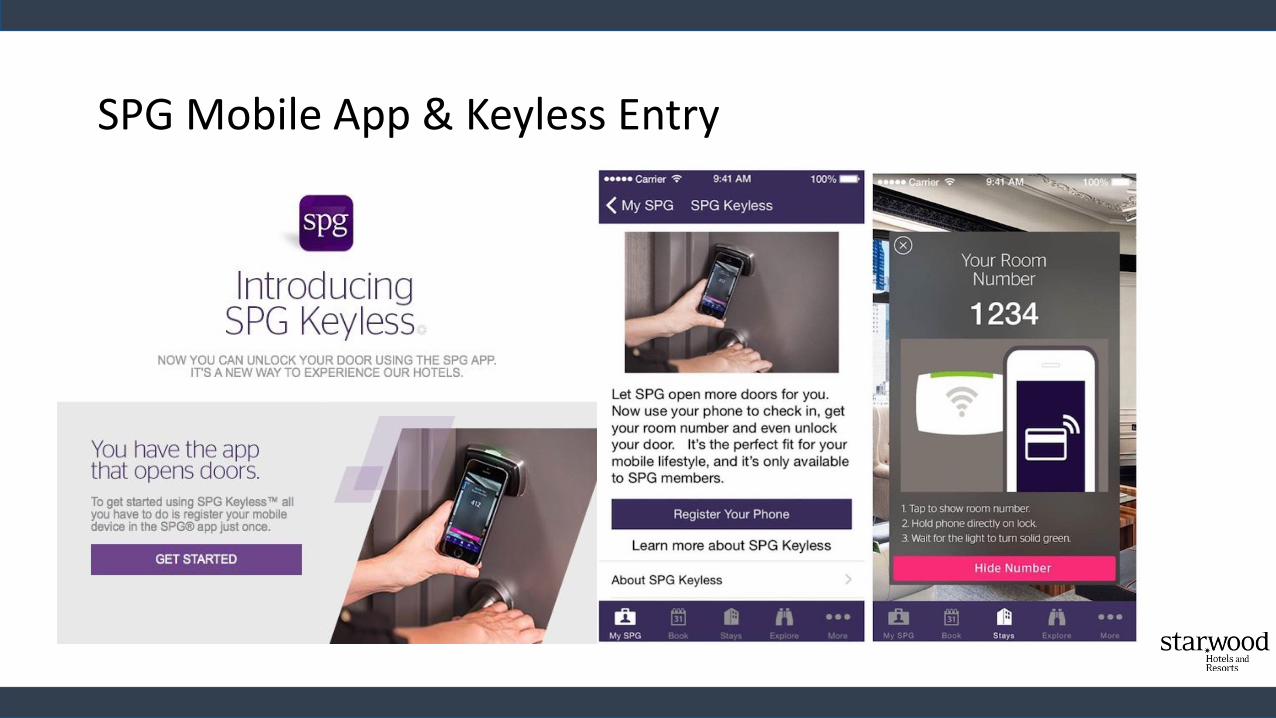
SPG Mobile App & Keyless Entry
Starwood Specialty Marketing
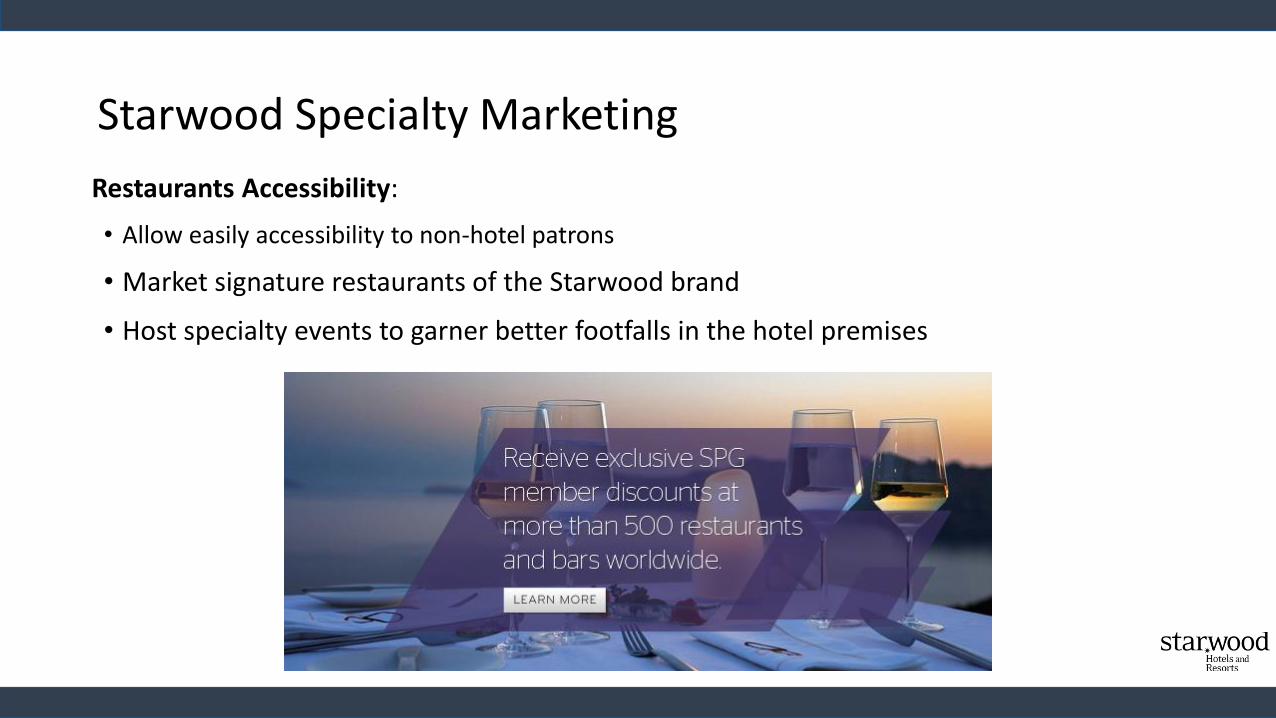
Restaurants Accessibility:
• Allow easily accessibility to non-hotel patrons
• Market signature restaurants of the Starwood brand
• Host specialty events to garner better footfalls in the hotel premises
Starwood Specialty Marketing
• University Relationship: Brand loyalty must be locked in earlier on . By catering
to the university students from reputed colleges early on, Starwood can ensure
the future managers and decision makers have experienced the Starwood
hospitality .Collaboration with MBA colleges for executive MBAs

Commercial Marketing Plan
Starwood Corporate Sales & Marketing
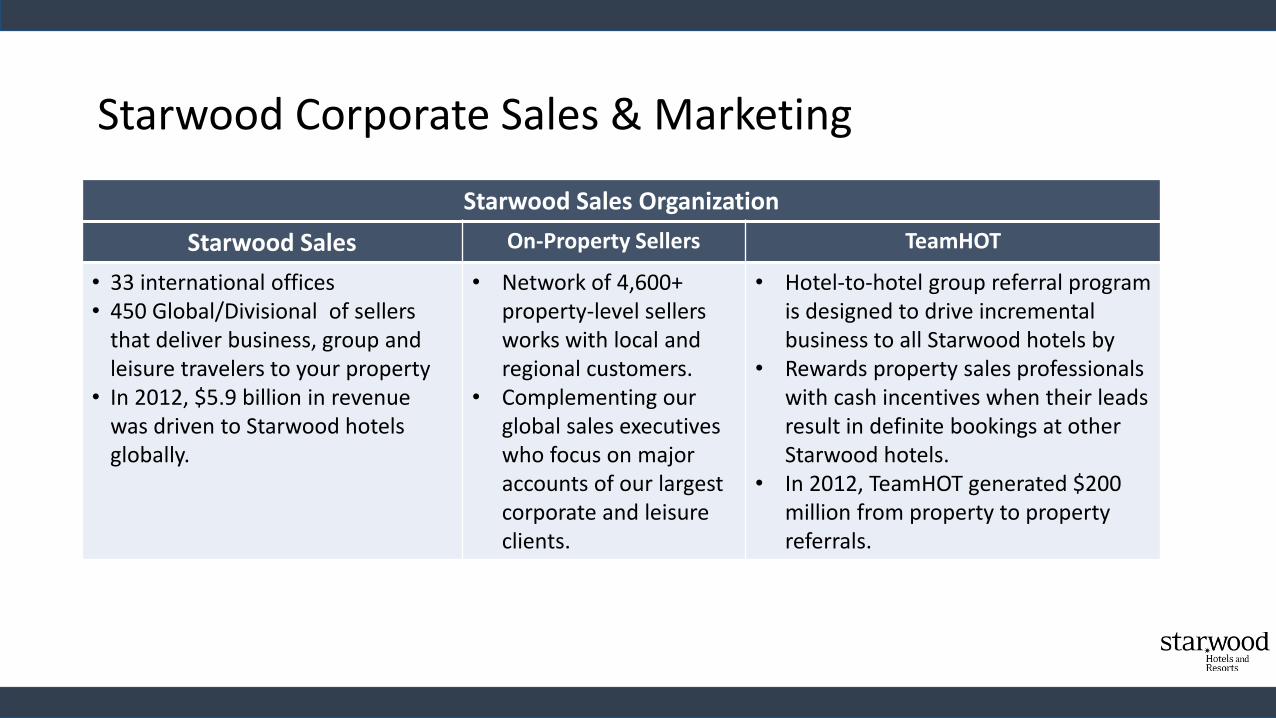
Starwood Sales Organization
Starwood Sales On-Property Sellers TeamHOT
• 33 international offices• 450 Global/Divisional of sellers
that deliver business, group and leisure travelers to your property
• In 2012, $5.9 billion in revenue was driven to Starwood hotels globally.
• Network of 4,600+ property-level sellers works with local and regional customers.
• Complementing our global sales executives who focus on major accounts of our largest corporate and leisure clients.
• Hotel-to-hotel group referral program is designed to drive incremental business to all Starwood hotels by
• Rewards property sales professionals with cash incentives when their leads result in definite bookings at other Starwood hotels.
• In 2012, TeamHOT generated $200 million from property to property referrals.
Starwood Corporate Sales & Marketing
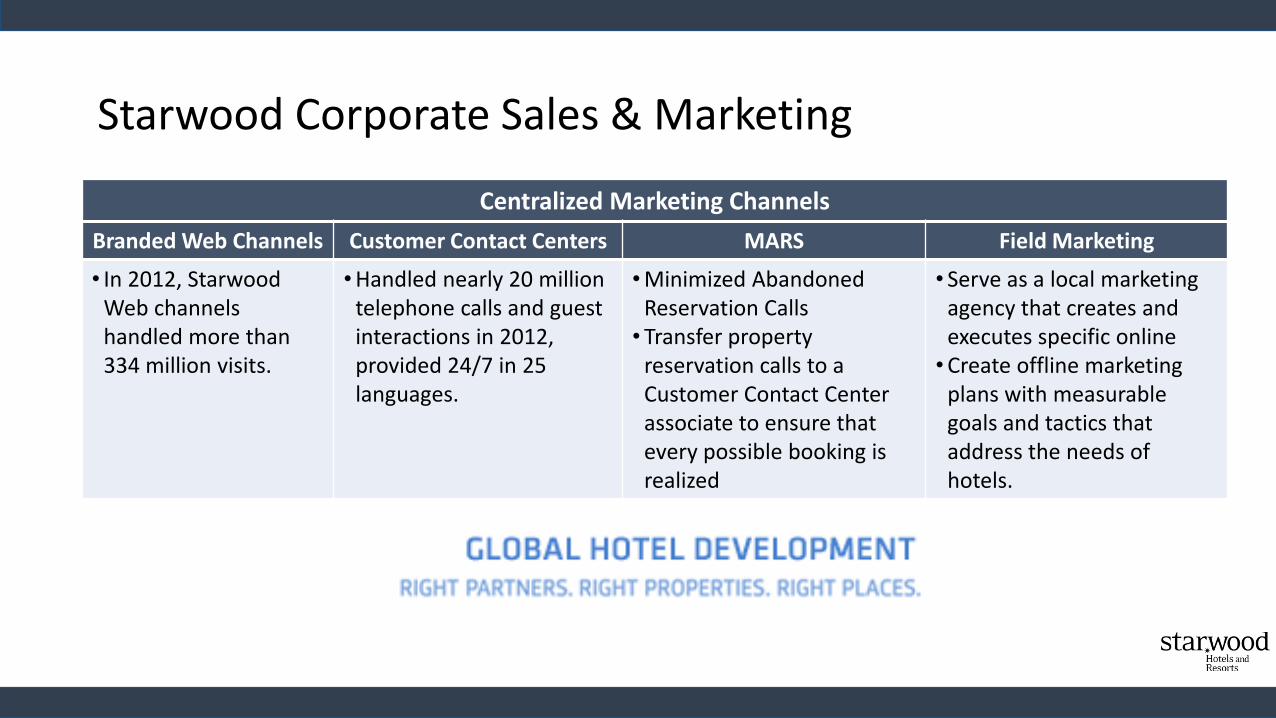
Centralized Marketing Channels
Branded Web Channels Customer Contact Centers MARS Field Marketing
• In 2012, Starwood Web channels handled more than 334 million visits.
•Handled nearly 20 million telephone calls and guest interactions in 2012, provided 24/7 in 25 languages.
•Minimized Abandoned Reservation Calls• Transfer property
reservation calls to a Customer Contact Center associate to ensure that every possible booking is realized
• Serve as a local marketing agency that creates and executes specific online •Create offline marketing
plans with measurable goals and tactics that address the needs of hotels.
Starwood Corporate Sales & Marketing
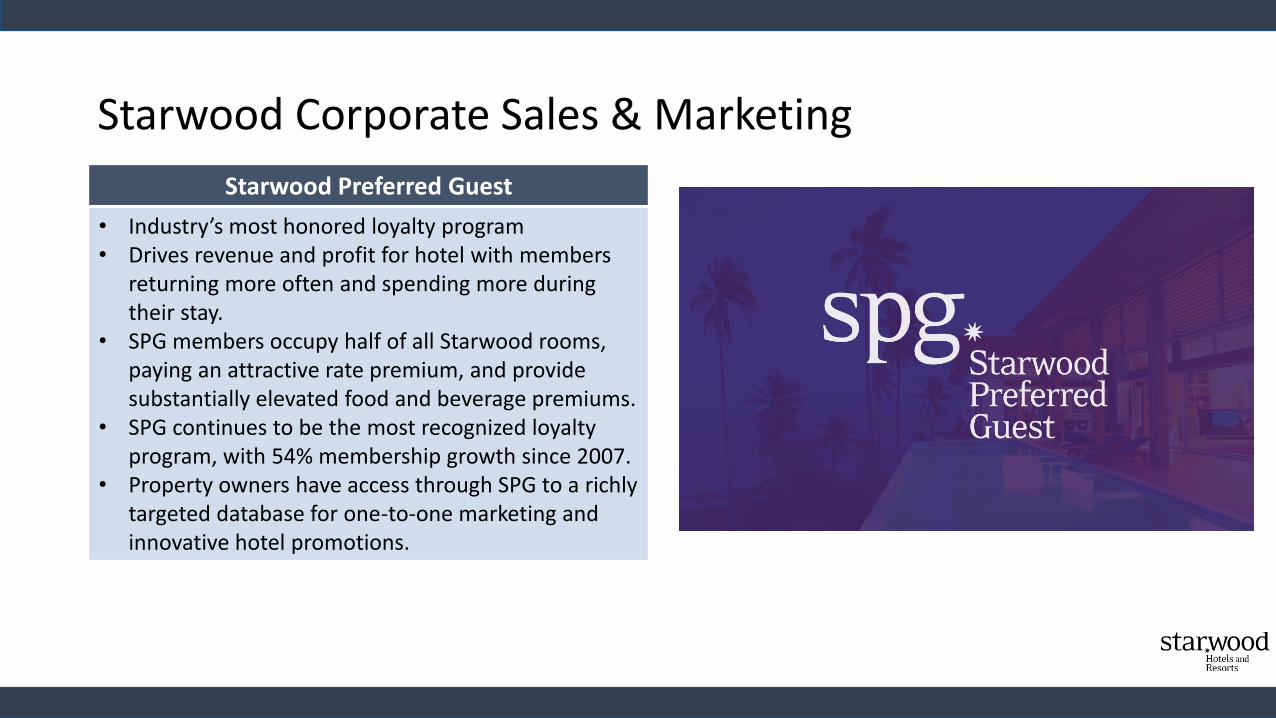
Starwood Preferred Guest
• Industry’s most honored loyalty program• Drives revenue and profit for hotel with members
returning more often and spending more during their stay.
• SPG members occupy half of all Starwood rooms, paying an attractive rate premium, and provide substantially elevated food and beverage premiums.
• SPG continues to be the most recognized loyalty program, with 54% membership growth since 2007.
• Property owners have access through SPG to a richly targeted database for one-to-one marketing and innovative hotel promotions.

Design and Development
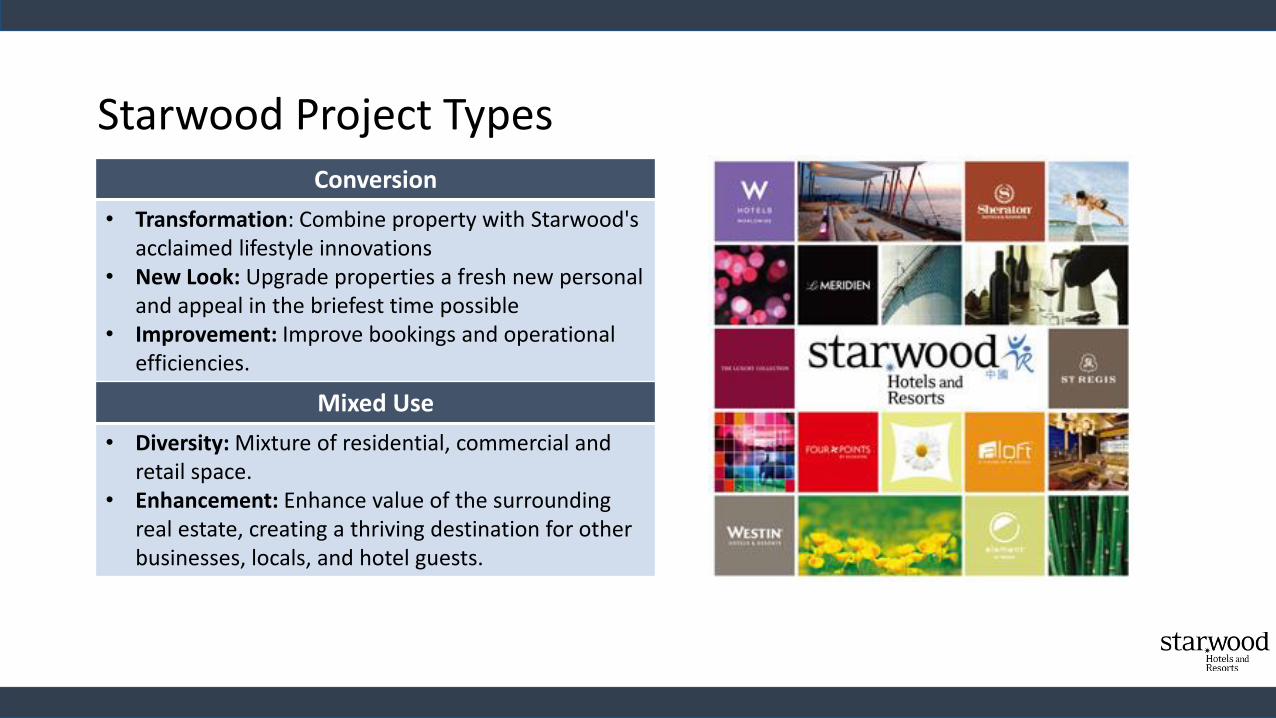
Starwood Project TypesConversion
• Transformation: Combine property with Starwood's acclaimed lifestyle innovations
• New Look: Upgrade properties a fresh new personal and appeal in the briefest time possible
• Improvement: Improve bookings and operational efficiencies.
Mixed Use
• Diversity: Mixture of residential, commercial and retail space.
• Enhancement: Enhance value of the surrounding real estate, creating a thriving destination for other businesses, locals, and hotel guests.
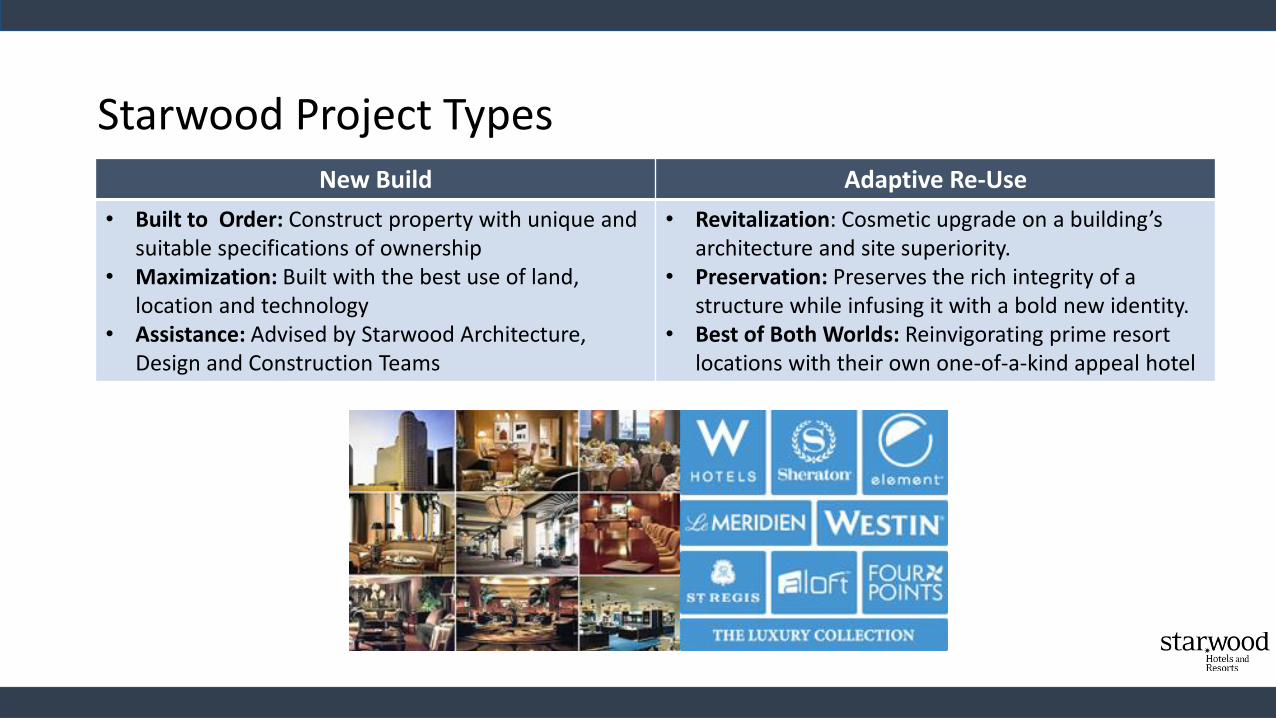
Starwood Project TypesNew Build Adaptive Re-Use
• Built to Order: Construct property with unique and suitable specifications of ownership
• Maximization: Built with the best use of land, location and technology
• Assistance: Advised by Starwood Architecture, Design and Construction Teams
• Revitalization: Cosmetic upgrade on a building’s architecture and site superiority.
• Preservation: Preserves the rich integrity of a structure while infusing it with a bold new identity.
• Best of Both Worlds: Reinvigorating prime resort locations with their own one-of-a-kind appeal hotel
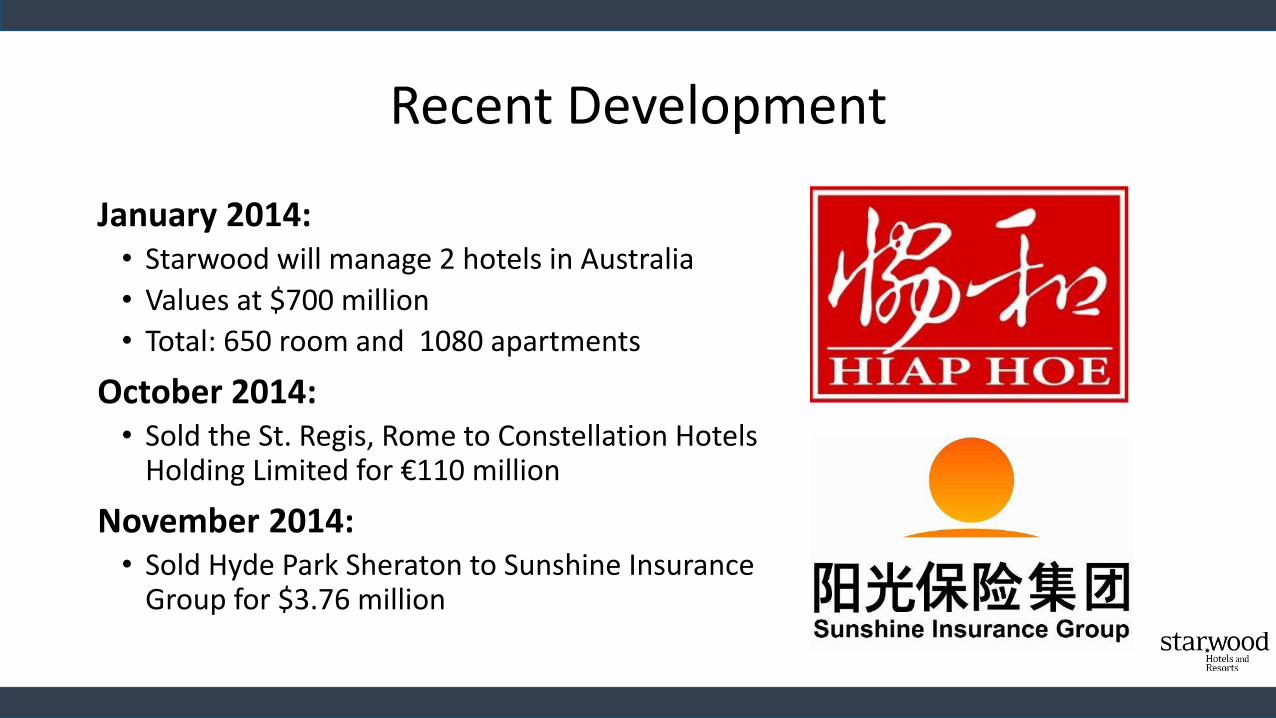
Recent Development
January 2014:• Starwood will manage 2 hotels in Australia
• Values at $700 million
• Total: 650 room and 1080 apartments
October 2014:• Sold the St. Regis, Rome to Constellation Hotels
Holding Limited for €110 million
November 2014:• Sold Hyde Park Sheraton to Sunshine Insurance
Group for $3.76 million

Management Team

Management Team
Frits Van Paasschen• Has valuable and Unique understanding
of the Operations, Management & Culture• Global Branding, development & strategy
experienceCEO & President
Thomas B. Mangas• Has vast experience in Finance, Investor
Relations, Global Business Services• Leadership experience in Strategic
planning, Resource prioritization, Cost management, etc.Exec-VP & CFO
Exec-VP & Senior HRO
Jeff Cava• Has more than 30 yrs experience with
major hospitality companies• Successfully implemented the industry’s
first consumer driven health strategy
Christie Hicks• Is a high energy leader who has built
Starwood’s sales culture around Strategic Customer management
• She spearheaded Starwood’s Meeting Innovation project.
Senior VP
Phil McAveety• Is responsible for marketing and branding
of all aspects of Starwood• Has vast experience in brand
development, marketing and advertising.Exec-VP & Chief
Brand Officer
Senior VP
John Peyton• Drives implementation of key strategic
priorities including SCM, F&B, etc.• Led Starwood in its launch of 6σ,
becoming the first company in the hospitality industry to adopt 6σ.
Management Team
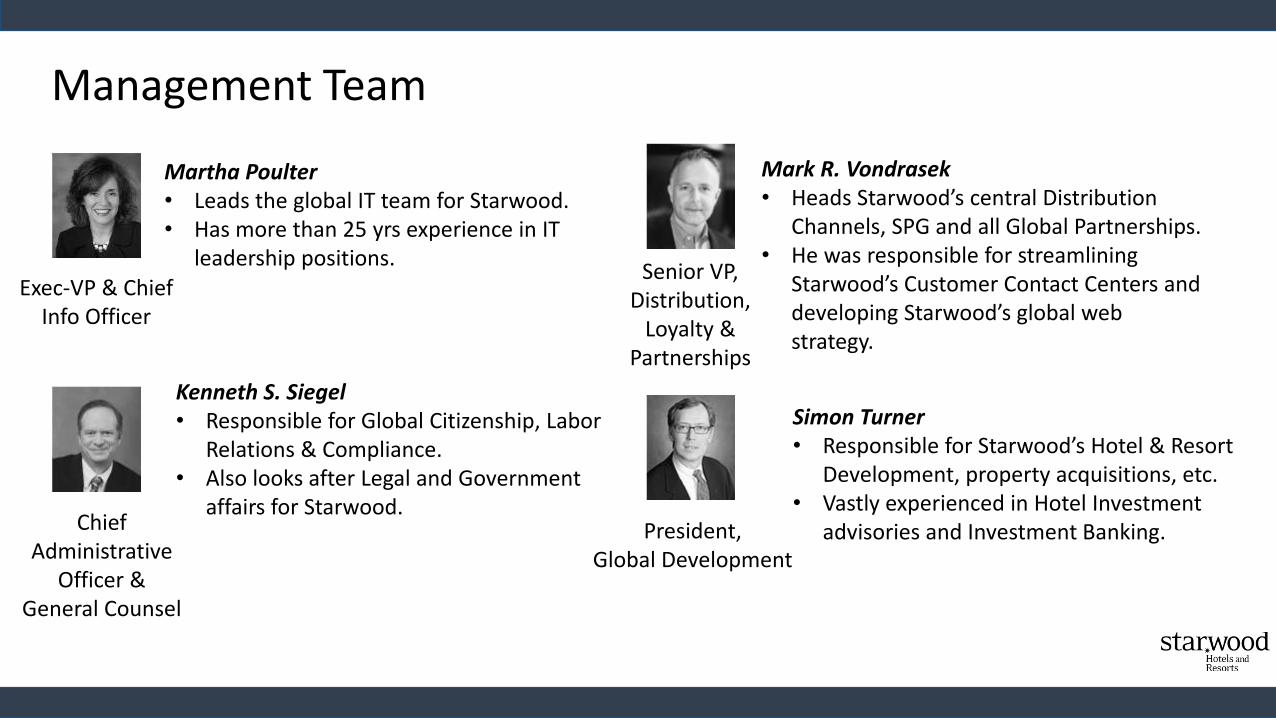
Martha Poulter• Leads the global IT team for Starwood.• Has more than 25 yrs experience in IT
leadership positions.Exec-VP & Chief
Info Officer
Kenneth S. Siegel• Responsible for Global Citizenship, Labor
Relations & Compliance.• Also looks after Legal and Government
affairs for Starwood.Chief
Administrative Officer &
General Counsel
Senior VP, Distribution,
Loyalty & Partnerships
Simon Turner• Responsible for Starwood’s Hotel & Resort
Development, property acquisitions, etc.• Vastly experienced in Hotel Investment
advisories and Investment Banking.President,Global Development
Mark R. Vondrasek• Heads Starwood’s central Distribution
Channels, SPG and all Global Partnerships.• He was responsible for streamlining
Starwood’s Customer Contact Centers and developing Starwood’s global web strategy.

Financial Plan
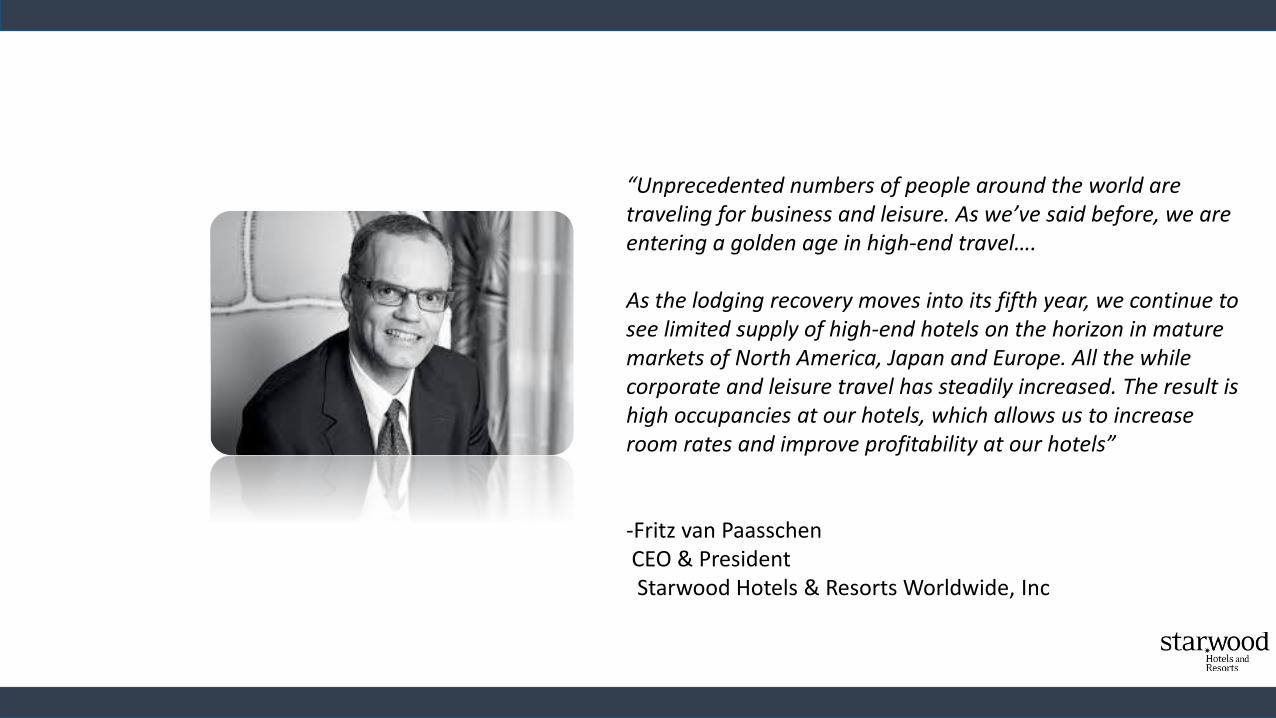
“Unprecedented numbers of people around the world are traveling for business and leisure. As we’ve said before, we are entering a golden age in high-end travel….
As the lodging recovery moves into its fifth year, we continue to see limited supply of high-end hotels on the horizon in mature markets of North America, Japan and Europe. All the while corporate and leisure travel has steadily increased. The result is high occupancies at our hotels, which allows us to increase room rates and improve profitability at our hotels”
-Fritz van PaasschenCEO & President Starwood Hotels & Resorts Worldwide, Inc
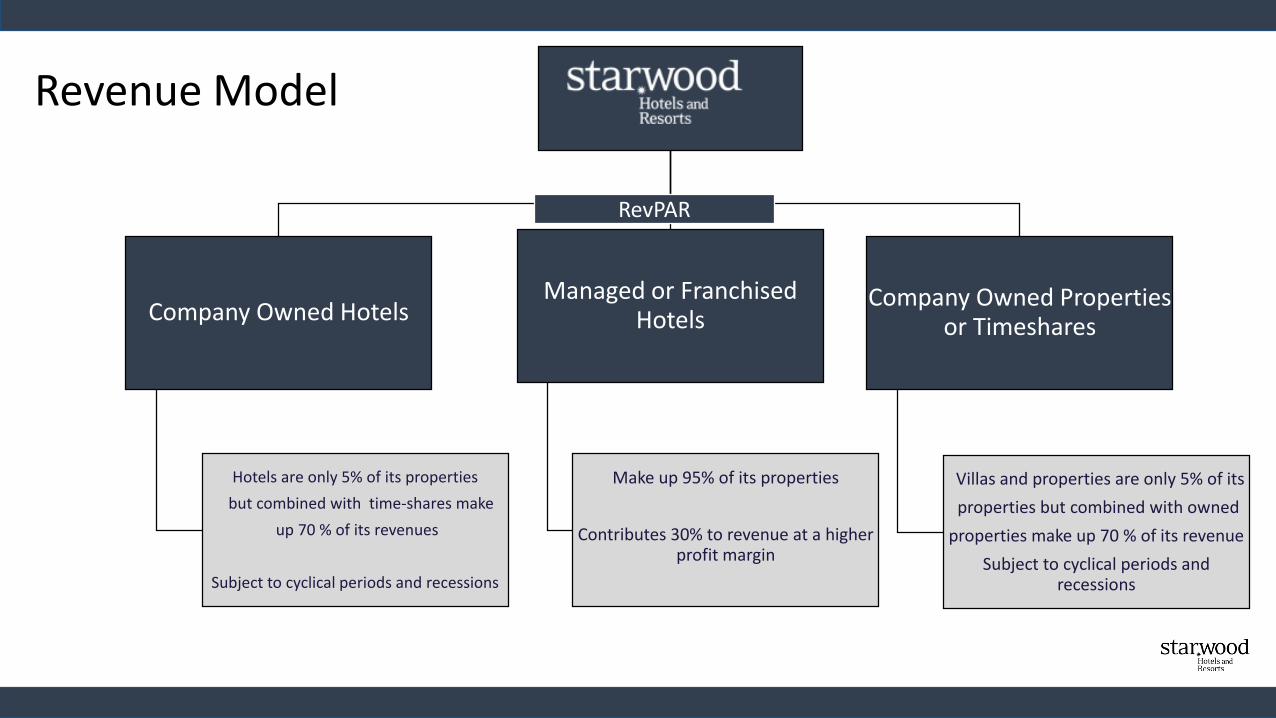
Company Owned Hotels
Hotels are only 5% of its properties
but combined with time-shares make
up 70 % of its revenues
Subject to cyclical periods and recessions
Managed or Franchised Hotels
Make up 95% of its properties
Contributes 30% to revenue at a higher profit margin
Company Owned Properties or Timeshares
Villas and properties are only 5% of its
properties but combined with owned
properties make up 70 % of its revenue
Subject to cyclical periods and recessions
RevPAR
Revenue Model
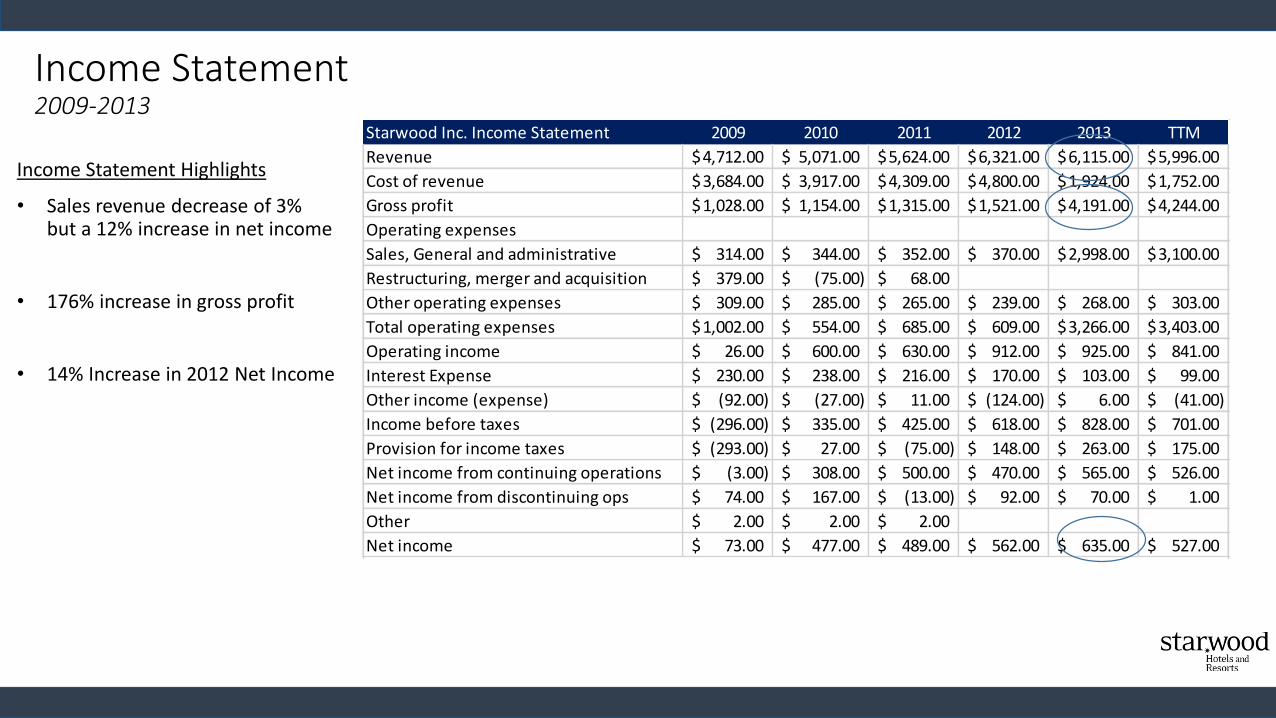
Starwood Inc. Income Statement 2009 2010 2011 2012 2013 TTM
Revenue 4,712.00$ 5,071.00$ 5,624.00$ 6,321.00$ 6,115.00$ 5,996.00$
Cost of revenue 3,684.00$ 3,917.00$ 4,309.00$ 4,800.00$ 1,924.00$ 1,752.00$
Gross profit 1,028.00$ 1,154.00$ 1,315.00$ 1,521.00$ 4,191.00$ 4,244.00$
Operating expenses
Sales, General and administrative 314.00$ 344.00$ 352.00$ 370.00$ 2,998.00$ 3,100.00$
Restructuring, merger and acquisition 379.00$ (75.00)$ 68.00$
Other operating expenses 309.00$ 285.00$ 265.00$ 239.00$ 268.00$ 303.00$
Total operating expenses 1,002.00$ 554.00$ 685.00$ 609.00$ 3,266.00$ 3,403.00$
Operating income 26.00$ 600.00$ 630.00$ 912.00$ 925.00$ 841.00$
Interest Expense 230.00$ 238.00$ 216.00$ 170.00$ 103.00$ 99.00$
Other income (expense) (92.00)$ (27.00)$ 11.00$ (124.00)$ 6.00$ (41.00)$
Income before taxes (296.00)$ 335.00$ 425.00$ 618.00$ 828.00$ 701.00$
Provision for income taxes (293.00)$ 27.00$ (75.00)$ 148.00$ 263.00$ 175.00$
Net income from continuing operations (3.00)$ 308.00$ 500.00$ 470.00$ 565.00$ 526.00$
Net income from discontinuing ops 74.00$ 167.00$ (13.00)$ 92.00$ 70.00$ 1.00$
Other 2.00$ 2.00$ 2.00$
Net income 73.00$ 477.00$ 489.00$ 562.00$ 635.00$ 527.00$
Income Statement 2009-2013
Income Statement Highlights
• Sales revenue decrease of 3% but a 12% increase in net income
• 176% increase in gross profit
• 14% Increase in 2012 Net Income
Plans for Growth & Recommendations
• Global RevPAR increase on a constant-currency basis of 5-6% until 2023. As the demand for global and luxurious travel continues to increase beyond the supply of such hotels, Starwood expects increase its fees 8-10 %
• Continue to expand into BRIC and other strategic locations. 80% of Starwood’s future pipeline is located outside of the of the U.S. This hedges on the slow, mature market (USA, Japan, Europe, etc.) growth and captures the high growth market
• Continue to leverage long-term management and franchise agreements. Doing so-- keeps switching costs for the hotel owners high as well as keeps it’s most profitable source of revenue
• Consider selling it’s company owned properties; hedges against cyclical and recessionary business environments
Xie Xie!
Appendices
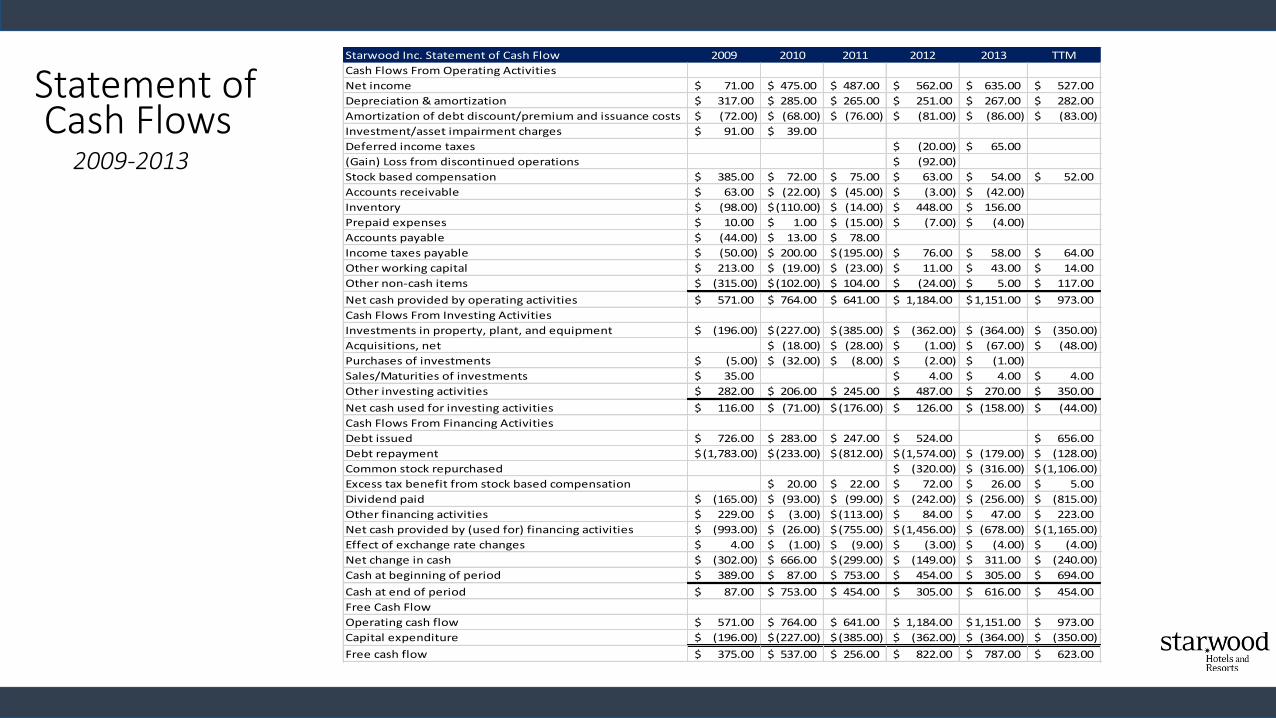
Starwood Inc. Statement of Cash Flow 2009 2010 2011 2012 2013 TTM
Cash Flows From Operating Activities
Net income 71.00$ 475.00$ 487.00$ 562.00$ 635.00$ 527.00$
Depreciation & amortization 317.00$ 285.00$ 265.00$ 251.00$ 267.00$ 282.00$
Amortization of debt discount/premium and issuance costs (72.00)$ (68.00)$ (76.00)$ (81.00)$ (86.00)$ (83.00)$
Investment/asset impairment charges 91.00$ 39.00$
Deferred income taxes (20.00)$ 65.00$
(Gain) Loss from discontinued operations (92.00)$
Stock based compensation 385.00$ 72.00$ 75.00$ 63.00$ 54.00$ 52.00$
Accounts receivable 63.00$ (22.00)$ (45.00)$ (3.00)$ (42.00)$
Inventory (98.00)$ (110.00)$ (14.00)$ 448.00$ 156.00$
Prepaid expenses 10.00$ 1.00$ (15.00)$ (7.00)$ (4.00)$
Accounts payable (44.00)$ 13.00$ 78.00$
Income taxes payable (50.00)$ 200.00$ (195.00)$ 76.00$ 58.00$ 64.00$
Other working capital 213.00$ (19.00)$ (23.00)$ 11.00$ 43.00$ 14.00$
Other non-cash items (315.00)$ (102.00)$ 104.00$ (24.00)$ 5.00$ 117.00$
Net cash provided by operating activities 571.00$ 764.00$ 641.00$ 1,184.00$ 1,151.00$ 973.00$
Cash Flows From Investing Activities
Investments in property, plant, and equipment (196.00)$ (227.00)$ (385.00)$ (362.00)$ (364.00)$ (350.00)$
Acquisitions, net (18.00)$ (28.00)$ (1.00)$ (67.00)$ (48.00)$
Purchases of investments (5.00)$ (32.00)$ (8.00)$ (2.00)$ (1.00)$
Sales/Maturities of investments 35.00$ 4.00$ 4.00$ 4.00$
Other investing activities 282.00$ 206.00$ 245.00$ 487.00$ 270.00$ 350.00$
Net cash used for investing activities 116.00$ (71.00)$ (176.00)$ 126.00$ (158.00)$ (44.00)$
Cash Flows From Financing Activities
Debt issued 726.00$ 283.00$ 247.00$ 524.00$ 656.00$
Debt repayment (1,783.00)$ (233.00)$ (812.00)$ (1,574.00)$ (179.00)$ (128.00)$
Common stock repurchased (320.00)$ (316.00)$ (1,106.00)$
Excess tax benefit from stock based compensation 20.00$ 22.00$ 72.00$ 26.00$ 5.00$
Dividend paid (165.00)$ (93.00)$ (99.00)$ (242.00)$ (256.00)$ (815.00)$
Other financing activities 229.00$ (3.00)$ (113.00)$ 84.00$ 47.00$ 223.00$
Net cash provided by (used for) financing activities (993.00)$ (26.00)$ (755.00)$ (1,456.00)$ (678.00)$ (1,165.00)$
Effect of exchange rate changes 4.00$ (1.00)$ (9.00)$ (3.00)$ (4.00)$ (4.00)$
Net change in cash (302.00)$ 666.00$ (299.00)$ (149.00)$ 311.00$ (240.00)$
Cash at beginning of period 389.00$ 87.00$ 753.00$ 454.00$ 305.00$ 694.00$
Cash at end of period 87.00$ 753.00$ 454.00$ 305.00$ 616.00$ 454.00$
Free Cash Flow
Operating cash flow 571.00$ 764.00$ 641.00$ 1,184.00$ 1,151.00$ 973.00$
Capital expenditure (196.00)$ (227.00)$ (385.00)$ (362.00)$ (364.00)$ (350.00)$
Free cash flow 375.00$ 537.00$ 256.00$ 822.00$ 787.00$ 623.00$
Statement ofCash Flows
2009-2013
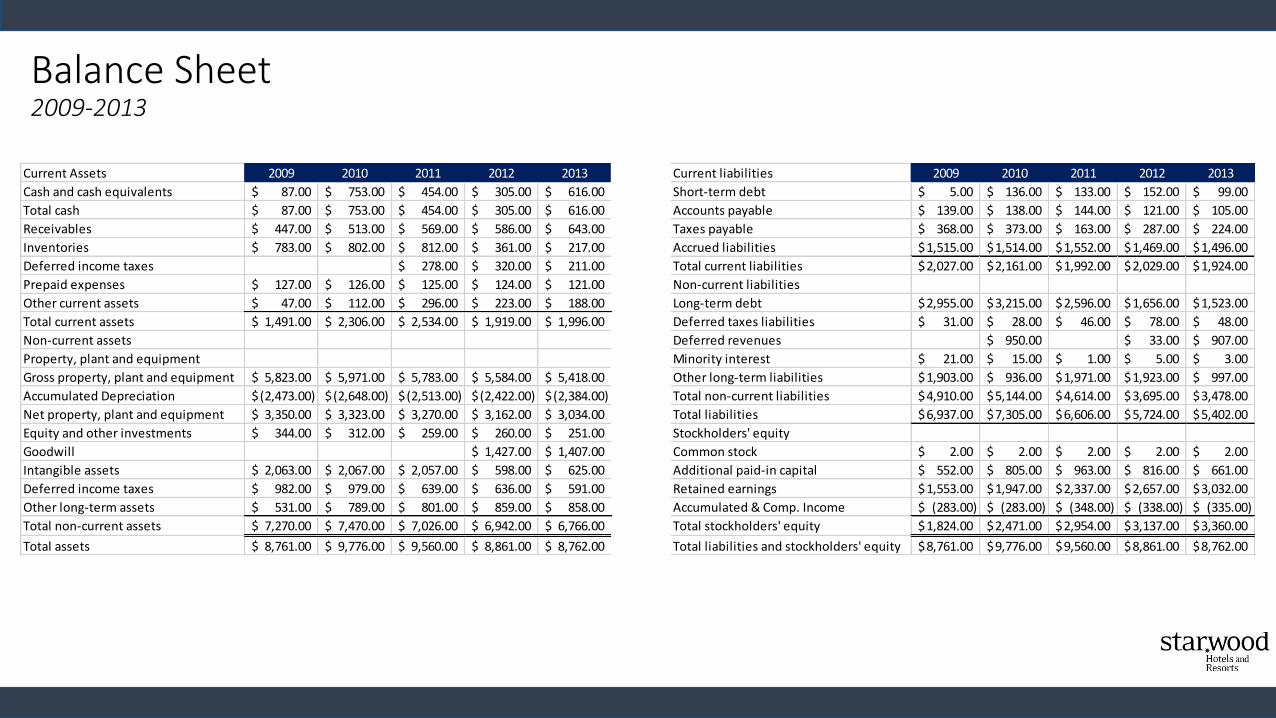
Balance Sheet2009-2013
Current Assets 2009 2010 2011 2012 2013 Current liabilities 2009 2010 2011 2012 2013
Cash and cash equivalents 87.00$ 753.00$ 454.00$ 305.00$ 616.00$ Short-term debt 5.00$ 136.00$ 133.00$ 152.00$ 99.00$
Total cash 87.00$ 753.00$ 454.00$ 305.00$ 616.00$ Accounts payable 139.00$ 138.00$ 144.00$ 121.00$ 105.00$
Receivables 447.00$ 513.00$ 569.00$ 586.00$ 643.00$ Taxes payable 368.00$ 373.00$ 163.00$ 287.00$ 224.00$
Inventories 783.00$ 802.00$ 812.00$ 361.00$ 217.00$ Accrued liabilities 1,515.00$ 1,514.00$ 1,552.00$ 1,469.00$ 1,496.00$
Deferred income taxes 278.00$ 320.00$ 211.00$ Total current liabilities 2,027.00$ 2,161.00$ 1,992.00$ 2,029.00$ 1,924.00$
Prepaid expenses 127.00$ 126.00$ 125.00$ 124.00$ 121.00$ Non-current liabilities
Other current assets 47.00$ 112.00$ 296.00$ 223.00$ 188.00$ Long-term debt 2,955.00$ 3,215.00$ 2,596.00$ 1,656.00$ 1,523.00$
Total current assets 1,491.00$ 2,306.00$ 2,534.00$ 1,919.00$ 1,996.00$ Deferred taxes liabilities 31.00$ 28.00$ 46.00$ 78.00$ 48.00$
Non-current assets Deferred revenues 950.00$ 33.00$ 907.00$
Property, plant and equipment Minority interest 21.00$ 15.00$ 1.00$ 5.00$ 3.00$
Gross property, plant and equipment 5,823.00$ 5,971.00$ 5,783.00$ 5,584.00$ 5,418.00$ Other long-term liabilities 1,903.00$ 936.00$ 1,971.00$ 1,923.00$ 997.00$
Accumulated Depreciation (2,473.00)$ (2,648.00)$ (2,513.00)$ (2,422.00)$ (2,384.00)$ Total non-current liabilities 4,910.00$ 5,144.00$ 4,614.00$ 3,695.00$ 3,478.00$
Net property, plant and equipment 3,350.00$ 3,323.00$ 3,270.00$ 3,162.00$ 3,034.00$ Total liabilities 6,937.00$ 7,305.00$ 6,606.00$ 5,724.00$ 5,402.00$
Equity and other investments 344.00$ 312.00$ 259.00$ 260.00$ 251.00$ Stockholders' equity
Goodwill 1,427.00$ 1,407.00$ Common stock 2.00$ 2.00$ 2.00$ 2.00$ 2.00$
Intangible assets 2,063.00$ 2,067.00$ 2,057.00$ 598.00$ 625.00$ Additional paid-in capital 552.00$ 805.00$ 963.00$ 816.00$ 661.00$
Deferred income taxes 982.00$ 979.00$ 639.00$ 636.00$ 591.00$ Retained earnings 1,553.00$ 1,947.00$ 2,337.00$ 2,657.00$ 3,032.00$
Other long-term assets 531.00$ 789.00$ 801.00$ 859.00$ 858.00$ Accumulated & Comp. Income (283.00)$ (283.00)$ (348.00)$ (338.00)$ (335.00)$
Total non-current assets 7,270.00$ 7,470.00$ 7,026.00$ 6,942.00$ 6,766.00$ Total stockholders' equity 1,824.00$ 2,471.00$ 2,954.00$ 3,137.00$ 3,360.00$
Total assets 8,761.00$ 9,776.00$ 9,560.00$ 8,861.00$ 8,762.00$ Total liabilities and stockholders' equity 8,761.00$ 9,776.00$ 9,560.00$ 8,861.00$ 8,762.00$
Starwood Financials 2009 2010 2011 2012 2013 TTM
Revenue USD Mil 4,712.00$ 5,071.00$ 5,624.00$ 6,321.00$ 6,115.00$ 5,996.00$
Gross Margin % 21.80% 22.80% 23.40% 24.10% 68.50% 70.80%
Operating Income USD Mil 26.00$ 600.00$ 630.00$ 912.00$ 925.00$ 841.00$
Operating Margin % 0.6% 11.8% 11.2% 14.4% 15.1% 14.0%
Net Income USD Mil 73.00$ 477.00$ 489.00$ 562.00$ 635.00$ 527.00$
Earnings Per Share USD 0.41$ 2.51$ 2.51$ 2.86$ 3.28$ 2.77$
Dividends USD 0.20$ 0.30$ 0.50$ 1.25$ 1.35$ 2.40$
Payout Ratio % 18.40% 19.50% 52.30% 46.20% 86.70%
Shares Mil 180 190 195 197 193 190
Book Value Per Share USD 9.77$ 12.81$ 15.08$ 16.24$ 17.51$ 12.03$
Operating Cash Flow USD Mil 571.00$ 764.00$ 641.00$ 1,184.00$ 1,151.00$ 973.00$
Cap Spending USD Mil (196.00)$ (227.00)$ (385.00)$ (362.00)$ (364.00)$ (350.00)$
Free Cash Flow USD Mil 375.00$ 537.00$ 256.00$ 822.00$ 787.00$ 623.00$
Free Cash Flow Per Share USD 2.08$ 2.83$ 1.31$ 4.17$ 4.08$
Working Capital USD Mil (536.00)$ 145.00$ 542.00$ (110.00)$ 72.00$
Margins % of Sales 2009 2010 2011 2012 2013 TTM
Revenue 100 100 100 100 100 100
COGS 78.18 77.24 76.62 75.94 31.46 29.22
Gross Margin 21.82 22.76 23.38 24.06 68.54 70.78
SG&A 6.66 6.78 6.26 5.85 49.03 51.7
R&D
Other 14.6 4.14 5.92 3.78 4.38 5.05
Operating Margin 0.55 11.83 11.2 14.43 15.13 14.03
Net Int Inc & Other -6.83 -5.23 -3.65 -4.65 -1.59 -2.33
EBT Margin -6.28 6.61 7.56 9.78 13.54 11.69
Starwood Financials2009-2013
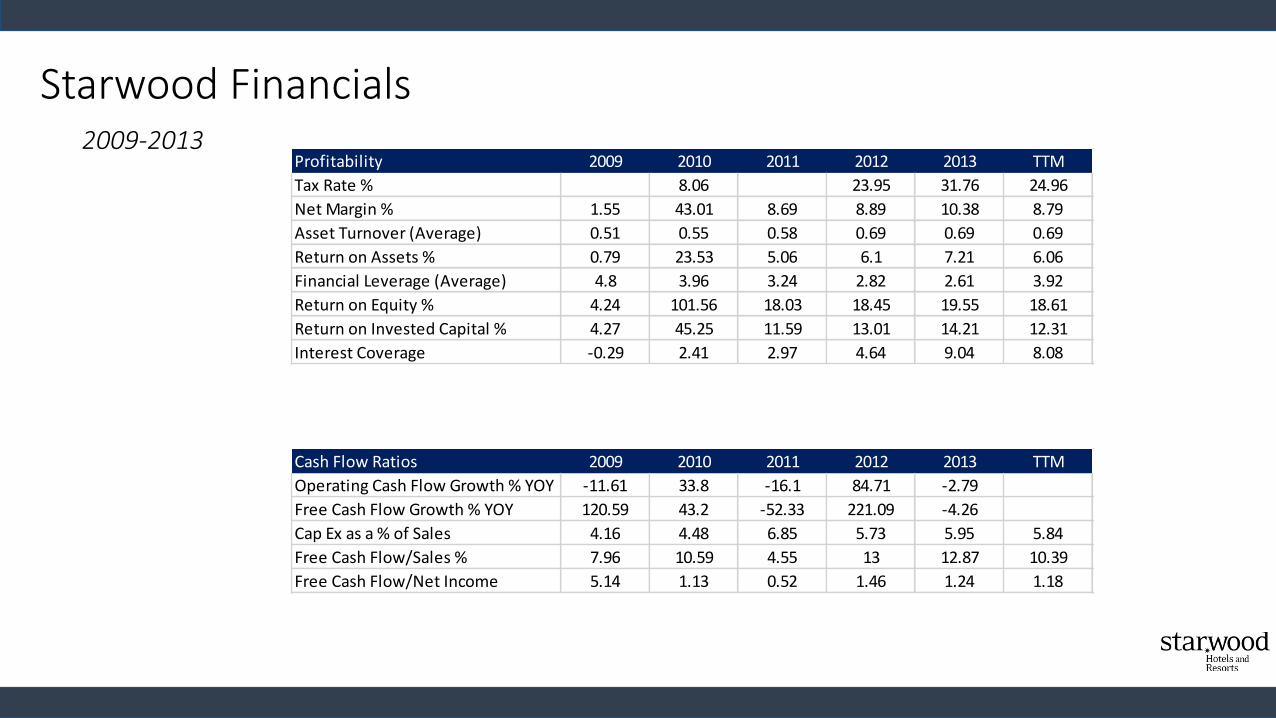
Profitability 2009 2010 2011 2012 2013 TTM
Tax Rate % 8.06 23.95 31.76 24.96
Net Margin % 1.55 43.01 8.69 8.89 10.38 8.79
Asset Turnover (Average) 0.51 0.55 0.58 0.69 0.69 0.69
Return on Assets % 0.79 23.53 5.06 6.1 7.21 6.06
Financial Leverage (Average) 4.8 3.96 3.24 2.82 2.61 3.92
Return on Equity % 4.24 101.56 18.03 18.45 19.55 18.61
Return on Invested Capital % 4.27 45.25 11.59 13.01 14.21 12.31
Interest Coverage -0.29 2.41 2.97 4.64 9.04 8.08
Cash Flow Ratios 2009 2010 2011 2012 2013 TTM
Operating Cash Flow Growth % YOY -11.61 33.8 -16.1 84.71 -2.79
Free Cash Flow Growth % YOY 120.59 43.2 -52.33 221.09 -4.26
Cap Ex as a % of Sales 4.16 4.48 6.85 5.73 5.95 5.84
Free Cash Flow/Sales % 7.96 10.59 4.55 13 12.87 10.39
Free Cash Flow/Net Income 5.14 1.13 0.52 1.46 1.24 1.18
Starwood Financials2009-2013
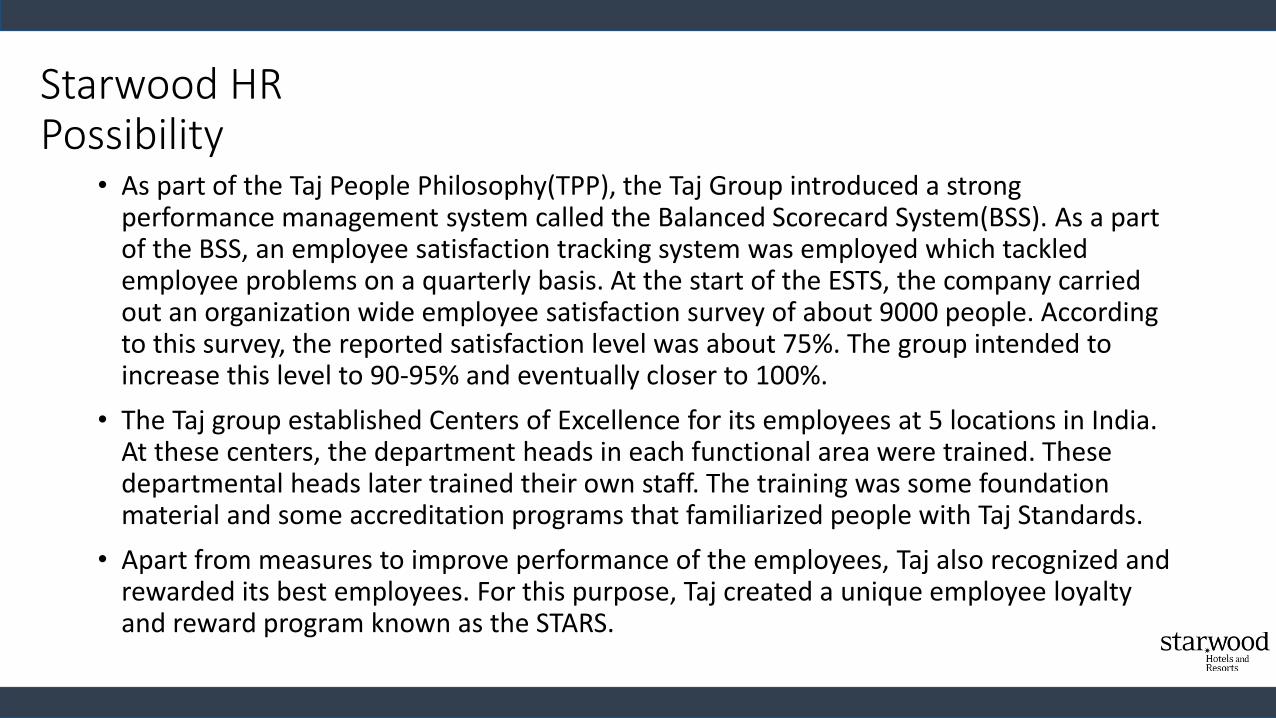
Starwood HR Possibility
• As part of the Taj People Philosophy(TPP), the Taj Group introduced a strong performance management system called the Balanced Scorecard System(BSS). As a part of the BSS, an employee satisfaction tracking system was employed which tackled employee problems on a quarterly basis. At the start of the ESTS, the company carried out an organization wide employee satisfaction survey of about 9000 people. According to this survey, the reported satisfaction level was about 75%. The group intended to increase this level to 90-95% and eventually closer to 100%.
• The Taj group established Centers of Excellence for its employees at 5 locations in India. At these centers, the department heads in each functional area were trained. These departmental heads later trained their own staff. The training was some foundation material and some accreditation programs that familiarized people with Taj Standards.
• Apart from measures to improve performance of the employees, Taj also recognized and rewarded its best employees. For this purpose, Taj created a unique employee loyalty and reward program known as the STARS.
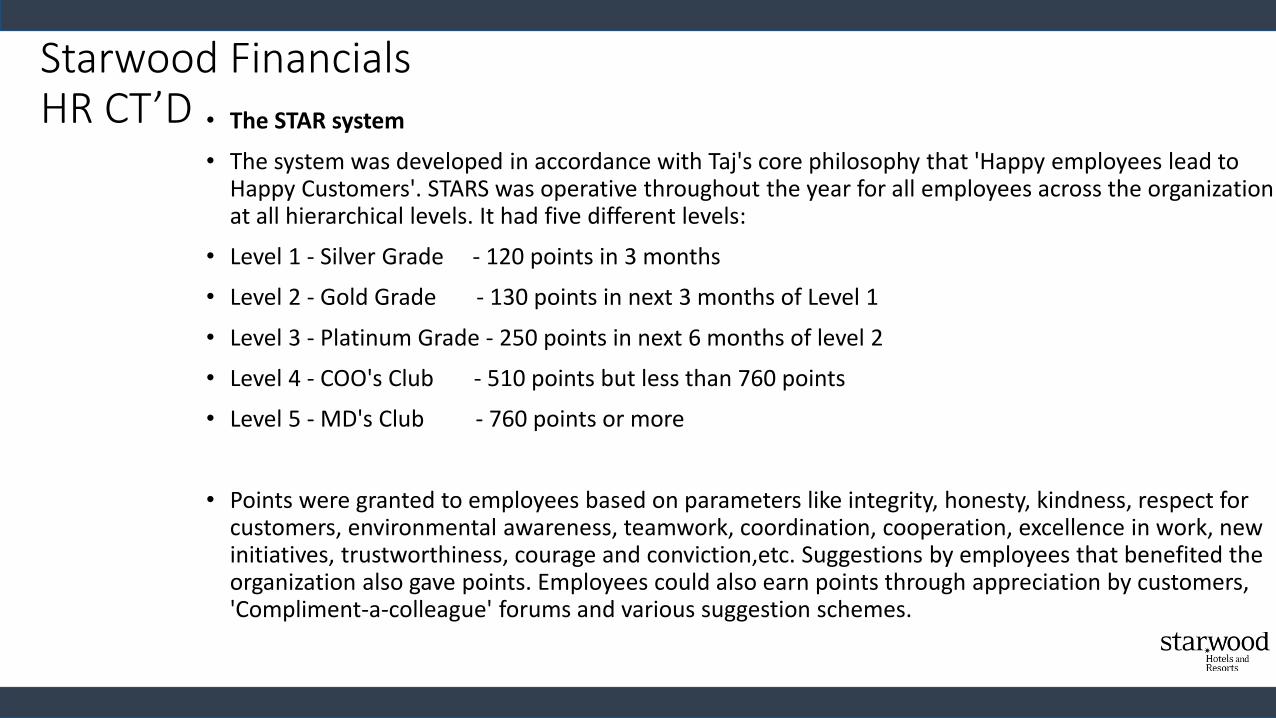
Starwood FinancialsHR CT’D • The STAR system
• The system was developed in accordance with Taj's core philosophy that 'Happy employees lead to Happy Customers'. STARS was operative throughout the year for all employees across the organization at all hierarchical levels. It had five different levels:
• Level 1 - Silver Grade - 120 points in 3 months
• Level 2 - Gold Grade - 130 points in next 3 months of Level 1
• Level 3 - Platinum Grade - 250 points in next 6 months of level 2
• Level 4 - COO's Club - 510 points but less than 760 points
• Level 5 - MD's Club - 760 points or more
• Points were granted to employees based on parameters like integrity, honesty, kindness, respect for customers, environmental awareness, teamwork, coordination, cooperation, excellence in work, new initiatives, trustworthiness, courage and conviction,etc. Suggestions by employees that benefited the organization also gave points. Employees could also earn points through appreciation by customers, 'Compliment-a-colleague' forums and various suggestion schemes.
Starwood FinancialsHR CT’D
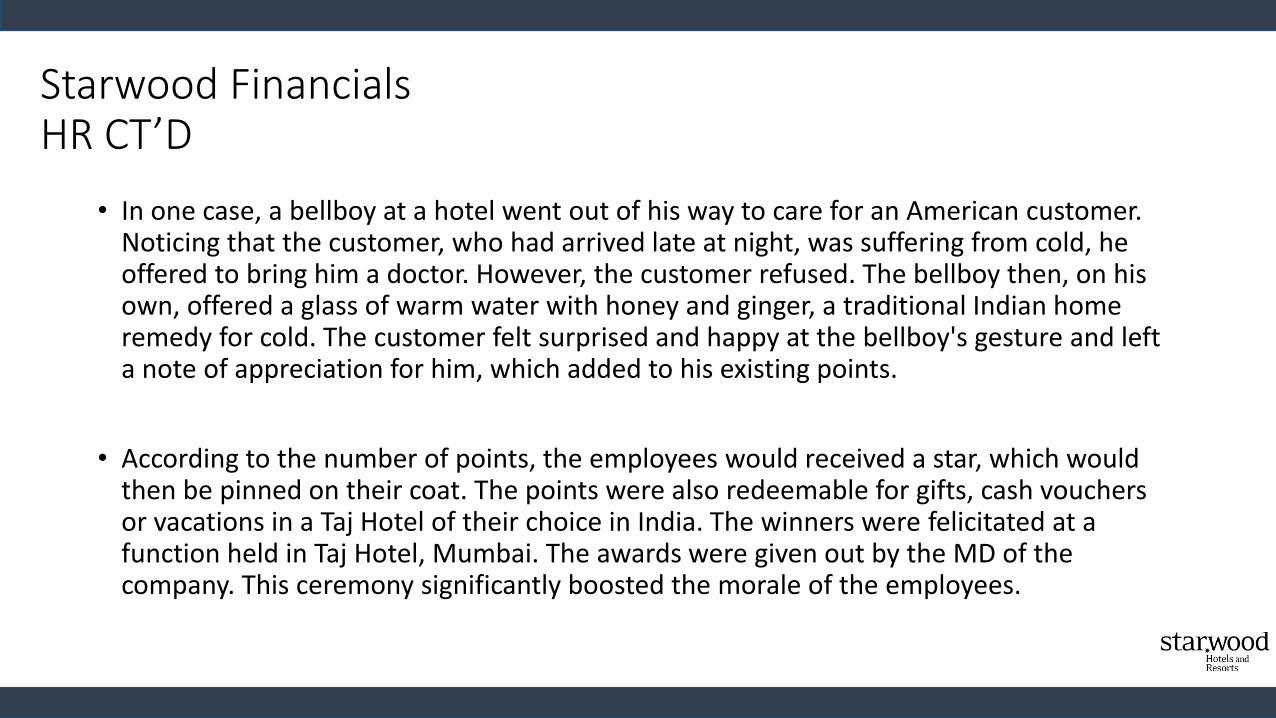
• In one case, a bellboy at a hotel went out of his way to care for an American customer. Noticing that the customer, who had arrived late at night, was suffering from cold, he offered to bring him a doctor. However, the customer refused. The bellboy then, on his own, offered a glass of warm water with honey and ginger, a traditional Indian home remedy for cold. The customer felt surprised and happy at the bellboy's gesture and left a note of appreciation for him, which added to his existing points.
• According to the number of points, the employees would received a star, which would then be pinned on their coat. The points were also redeemable for gifts, cash vouchers or vacations in a Taj Hotel of their choice in India. The winners were felicitated at a function held in Taj Hotel, Mumbai. The awards were given out by the MD of the company. This ceremony significantly boosted the morale of the employees.
Resources
Starwoodhotels.com
Morningstar.com
http://analysisreport.morningstar.com/stock/research?t=HOT®ion=usa&culture=en-US&productcode=MLE
Team Starwood