state of the u.s. oil gas m&a and capital markets denver holdings, inc. ipo 826 7. parsley...
TRANSCRIPT

State of the U.S. Oil & Gas M&A and Capital Markets
Louisiana Energy Conference
Ron Montalbano, CFASr. Managing DirectorEY Principal
May 31, 2017

Page 2
EY is a global leader in Assurance, Tax, Advisory and Transaction Advisory Services (TAS)
Ernst & Young LLPGlobal Financial Services Provider
EY office locationEY Oil & Gas Center
EY’s strong global connectivity enables us to assemble the right teams, share leading practices across the world and address oil and gas companies’ needs, whatever location they are active in. This is a key added value for our clients.
Calgary
Houston
Moscow
Cape TownPerth
Stavanger
AberdeenLondon
Brisbane
Singapore
Beijing
Bahrain
Rio de Janeiro Johannesburg
Lagos
People
>225,000
Countries
>150
DownstreamMidstreamUpstream
Equipment and Services
Working across the entire oil and gas value chain
► Organized around key geographic regions with professionals aligned by industry sectors► EY has a global network of more than 10,000 Oil & Gas professionals across 15 Oil & Gas Centers
Page 3
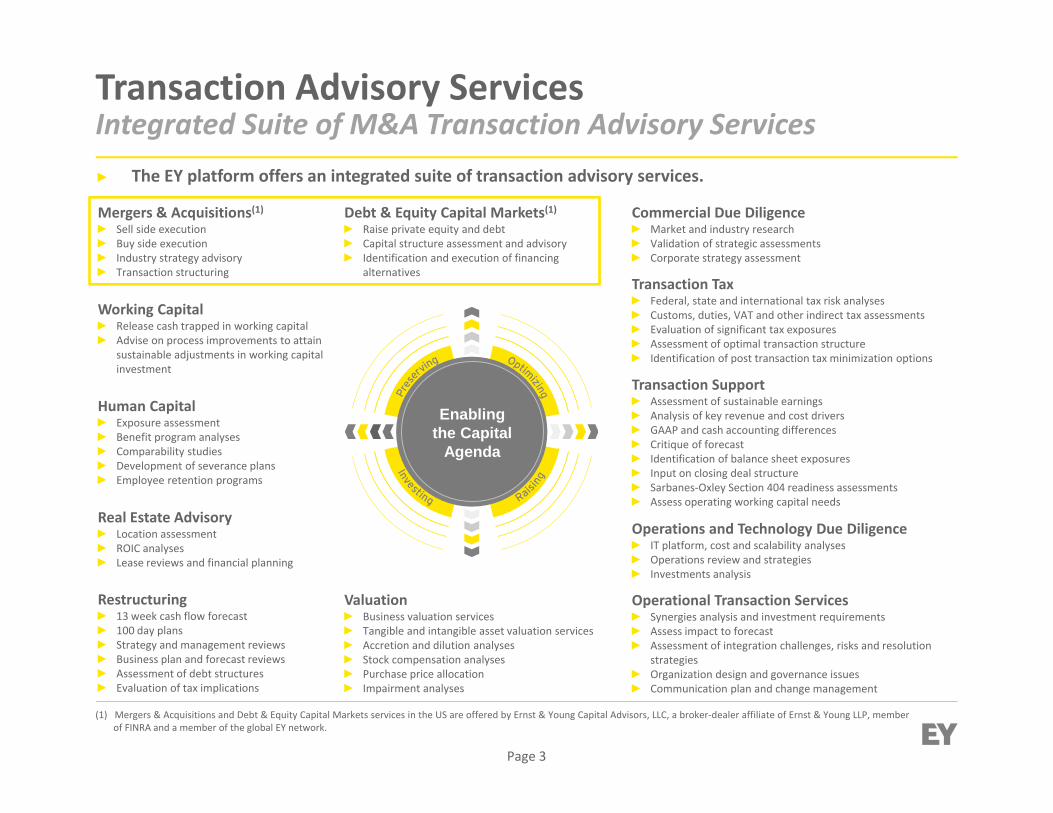
Transaction Advisory ServicesIntegrated Suite of M&A Transaction Advisory Services
Mergers & Acquisitions(1)► Sell side execution► Buy side execution► Industry strategy advisory► Transaction structuring
Debt & Equity Capital Markets(1)► Raise private equity and debt► Capital structure assessment and advisory► Identification and execution of financing
alternatives
(1) Mergers & Acquisitions and Debt & Equity Capital Markets services in the US are offered by Ernst & Young Capital Advisors, LLC, a broker‐dealer affiliate of Ernst & Young LLP, memberof FINRA and a member of the global EY network.
Transaction Tax► Federal, state and international tax risk analyses► Customs, duties, VAT and other indirect tax assessments► Evaluation of significant tax exposures► Assessment of optimal transaction structure► Identification of post transaction tax minimization options
Human Capital► Exposure assessment► Benefit program analyses► Comparability studies► Development of severance plans► Employee retention programs
Operations and Technology Due Diligence► IT platform, cost and scalability analyses► Operations review and strategies► Investments analysis
Valuation ► Business valuation services► Tangible and intangible asset valuation services► Accretion and dilution analyses► Stock compensation analyses► Purchase price allocation► Impairment analyses
Transaction Support► Assessment of sustainable earnings► Analysis of key revenue and cost drivers► GAAP and cash accounting differences► Critique of forecast► Identification of balance sheet exposures► Input on closing deal structure► Sarbanes‐Oxley Section 404 readiness assessments► Assess operating working capital needs
Commercial Due Diligence► Market and industry research► Validation of strategic assessments► Corporate strategy assessment
Operational Transaction Services► Synergies analysis and investment requirements► Assess impact to forecast► Assessment of integration challenges, risks and resolution
strategies► Organization design and governance issues► Communication plan and change management
Real Estate Advisory► Location assessment► ROIC analyses► Lease reviews and financial planning
Restructuring► 13 week cash flow forecast► 100 day plans► Strategy and management reviews► Business plan and forecast reviews► Assessment of debt structures► Evaluation of tax implications
Working Capital► Release cash trapped in working capital► Advise on process improvements to attain
sustainable adjustments in working capital investment
► The EY platform offers an integrated suite of transaction advisory services.
Enabling the Capital
Agenda

Page 4
EY Investment BankingSummary Oil & Gas M&A Activity
2016 Oil & Gas M&A Deal Count by Sector
Source: Multiple sources including S&P Capital IQ and company press releases.
2017 YTD1 Oil & Gas M&A Deal Count by Sector
1.Includes announced transactions between 01/01/17 and 05/26/17.
Upstream17746%
Midstream6517%
Downstream6416%
Oilfield Service8121%
Upstream8247%
Midstream3520%
Downstream1710%
Oilfield Service4123%
Page 5
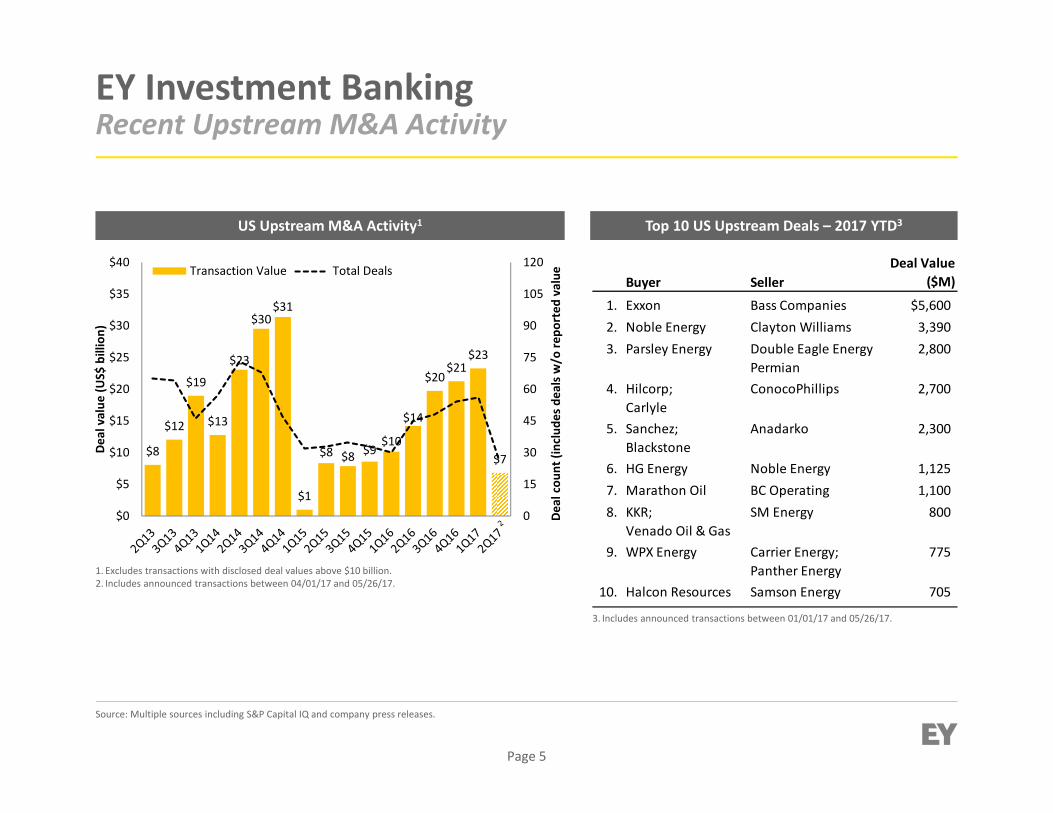
EY Investment BankingRecent Upstream M&A Activity
US Upstream M&A Activity1
Source: Multiple sources including S&P Capital IQ and company press releases.
Top 10 US Upstream Deals – 2017 YTD3
Buyer SellerDeal Value
($M)
1. Exxon Bass Companies $5,6002. Noble Energy Clayton Williams 3,3903. Parsley Energy Double Eagle Energy
Permian 2,800
4. Hilcorp; Carlyle
ConocoPhillips 2,700
5. Sanchez; Blackstone
Anadarko 2,300
6. HG Energy Noble Energy 1,1257. Marathon Oil BC Operating 1,1008. KKR;
Venado Oil & GasSM Energy 800
9. WPX Energy Carrier Energy; Panther Energy
775
10. Halcon Resources Samson Energy 7051. Excludes transactions with disclosed deal values above $10 billion.2. Includes announced transactions between 04/01/17 and 05/26/17.
3. Includes announced transactions between 01/01/17 and 05/26/17.
$8
$12
$19
$13
$23
$30$31
$1
$8 $8 $9$10
$14
$20$21
$23
$7
0
15
30
45
60
75
90
105
120
$0
$5
$10
$15
$20
$25
$30
$35
$40
Deal cou
nt (include
s de
als w/o
repo
rted
value
Deal value
(US$
billion)
Transaction Value Total Deals

Page 6
EY Investment BankingRecent Oilfield Service M&A Activity
1. Excludes transactions with disclosed deal values above $10 billion.2. Includes announced transactions between 04/01/17 and 05/26/17.
US Oilfield Service M&A Activity1
Source: Multiple sources including S&P Capital IQ and company press releases.
Top 10 US Oilfield Service Deals – 2017 YTD3
3. Includes announced transactions between 01/01/17 and 05/26/17.
Buyer SellerDeal Value
($M)
1. Wood Group Amec Foster Wheeler $5,3812. KMG Chemicals Arsenal; Flowchem 4953. Hi‐Crush Partners Permian Basin Sand 2754. Shelf Drilling
International Seadrill Limited 225
5. Schlumberger Borr Drilling 2206. Ametek MOCON 1857. Hi‐Crush Partners Hi‐Crush Proppants 1408. Mammoth Energy
ServicesTaylor Frac, Stingray Energy Services and Stingray Cementing
134
9. Liberty Oilfield Services
Titan Frac Services 65
10. Babcock & Wilcox UniversalAET 55
$4.2
$2.1
$4.3$3.4
$3.7
$9.4
$1.0
$0.3$0.5
$1.3$0.7
$0.8
$6.7
$0.7
$4.3
$6.4
$1.3
0
10
20
30
40
50
$0
$2
$4
$6
$8
$10
$12
Deal C
ount (include
s de
als w
/o re
ported
value
Deal value
(US$
billion)
Transaction Value Total Deals
Page 7
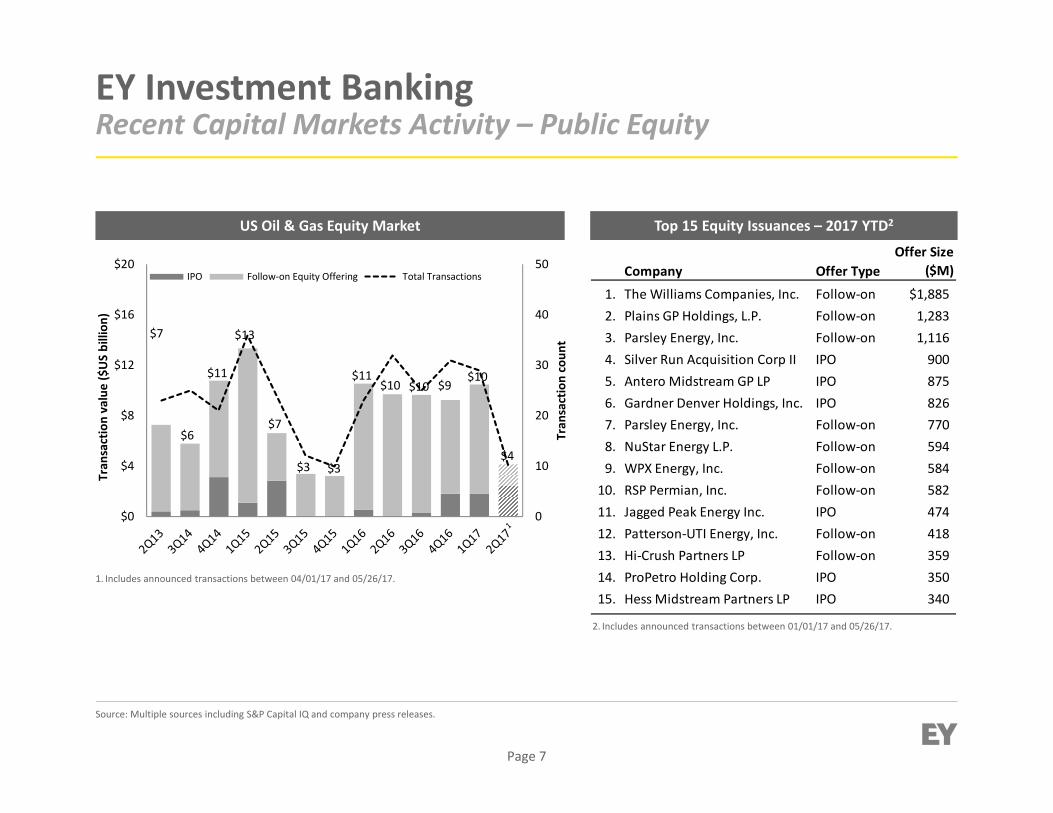
EY Investment BankingRecent Capital Markets Activity – Public Equity
US Oil & Gas Equity Market
Source: Multiple sources including S&P Capital IQ and company press releases.
Top 15 Equity Issuances – 2017 YTD2
1. Includes announced transactions between 04/01/17 and 05/26/17.
2. Includes announced transactions between 01/01/17 and 05/26/17.
0
10
20
30
40
50
$0
$4
$8
$12
$16
$20
Tran
saction coun
t
Tran
saction value ($US billion
)
IPO Follow‐on Equity Offering Total Transactions
$7
$6
$11
$13
$7
$3 $3
$11 $10 $10 $9
$10
$4
Company Offer TypeOffer Size
($M)
1. The Williams Companies, Inc. Follow‐on $1,8852. Plains GP Holdings, L.P. Follow‐on 1,2833. Parsley Energy, Inc. Follow‐on 1,1164. Silver Run Acquisition Corp II IPO 9005. Antero Midstream GP LP IPO 8756. Gardner Denver Holdings, Inc. IPO 8267. Parsley Energy, Inc. Follow‐on 7708. NuStar Energy L.P. Follow‐on 5949. WPX Energy, Inc. Follow‐on 58410. RSP Permian, Inc. Follow‐on 58211. Jagged Peak Energy Inc. IPO 47412. Patterson‐UTI Energy, Inc. Follow‐on 41813. Hi‐Crush Partners LP Follow‐on 35914. ProPetro Holding Corp. IPO 35015. Hess Midstream Partners LP IPO 340

Page 8
EY Investment BankingHistorical Review of the Oil & Gas IPO Market
US Oil & Gas IPOs: 1996 – 2017 YTD
Source: S&P Capital IQ as of May 26, 2017.
► MLPs dominated the Oil & Gas IPO market in 2012‐2015 (including OFS and Upstream names)► OFS IPO market leading in Q4‐2016 and 2017 YTD (more expected)► 2016 (Q4) ‐ 2017 OFS IPO count poised to outpace 1996‐1997 OFS IPO market
Upstream Midstream Downstream OFS
2
6
2 20
43
1
4
1112
15
21
6
18
21
18
22
6 6
10

Page 9
EY Investment BankingRecent Energy IPOs
Source: S&P Capital IQ and company filings.Note: Current Price as of May 26, 2017.
► On average, the IPOs priced 7.2% below the midpoint of filing ranges̶ Oilfield Service ‐13.8% (8)̶ Upstream ‐7.9% (4)̶ Midstream +9.2% (3)
% Delta vs. % DeltaSize Offer Average of Current vs. Offer
Company Sector Offer Date ($M) Filing Range Price Filing Range Price Price
Noble Midstream Partners LP Midstream 09/14/16 $281 $19.00 ‐ $21.00 $22.50 12.5% $45.70 103.1%
Extraction Oil & Gas, LLC Upstream 10/11/16 633 $15.00 ‐ $18.00 19.00 15.2% 15.63 ‐17.7%
Mammoth Energy Services, Inc. Oilfield Service 10/13/16 116 $15.00 ‐ $18.00 15.00 ‐9.1% 18.73 24.9%
Smart Sand Inc. Oilfield Service 11/04/16 129 $15.00 ‐ $18.00 11.00 ‐33.3% 10.00 ‐9.1%
WildHorse Resource Development Upstream 12/13/16 413 $19.00 ‐ $21.00 15.00 ‐25.0% 13.08 ‐12.8%
Keane Group, Inc. Oilfield Service 12/14/16 508 $17.00 ‐ $19.00 19.00 5.6% 16.11 ‐15.2%
Kimbell Royalty Partners, LP Upstream 01/06/17 90 $19.00 ‐ $21.00 18.00 ‐10.0% 19.85 10.3%
Jagged Peak Energy Inc. Upstream 01/26/17 474 $16.00 ‐ $18.00 15.00 ‐11.8% 13.94 ‐7.1%
ProPetro Holding Corp. Oilfield Service 03/16/17 350 $16.00 ‐ $19.00 14.00 ‐20.0% 13.71 ‐2.1%
Hess Midstream Partners LP Midstream 04/04/17 340 $19.00 ‐ $21.00 23.00 15.0% 24.14 5.0%
Select Energy Services, Inc. Oilfield Service 04/20/17 122 $15.00 ‐ $18.00 14.00 ‐15.2% 15.90 13.6%
NCS Multistage Holdings, Inc. Oilfield Service 04/27/17 162 $15.00 ‐ $18.00 17.00 3.0% 27.04 59.1%
Antero Midstream GP LP Midstream 05/03/17 875 $22.00 ‐ $25.00 23.50 0.0% 21.97 ‐6.5%
Gardner Denver Holdings, Inc. Oilfield Service 05/11/17 826 $23.00 ‐ $26.00 20.00 ‐18.4% 23.03 15.2%
Solaris Oilfield Infrastructure, Inc. Oilfield Service 05/11/17 121 $15.00 ‐ $18.00 12.00 ‐27.3% 11.98 ‐0.2%Note: Excludes special purpose acquisition companies (SPACs).

Page 10
EY Investment BankingRecent Capital Markets Activity – Public Debt
US Oil & Gas Fixed Income Market
Source: Multiple sources including S&P Capital IQ and company press releases.
Top 15 Debt Issuances – 2017 YTD2
1. Includes announced transactions between 04/01/17 and 05/26/17.
2. Includes announced transactions between 01/01/17 and 05/26/17.
CompanyOffer Size
($M)
1. Chevron Corporation $4,0002. Sabine Pass Liquefaction, LLC 3,0003. MPLX LP 2,2414. Energy Transfer Partners, L.P. 1,4945. Sabine Pass Liquefaction, LLC 1,3496. Ultra Resources, Inc. 1,1937. EP Energy LLC 1,0008. Halcón Resources Corporation 8509. Cimarex Energy Co. 74810. Enable Midstream Partners, LP 69711. NuStar Logistics, L.P. 55012. Nabors Industries, Inc. 50013. Summit Midstream Holdings, LLC 50014. NGL Energy Partners LP 50015. Crestwood Midstream Partners LP 500
$24$22
$29
$46
$28
$7
$37
$25
$16
$10$14 $14
$9
0
10
20
30
40
50
60
70
80
$0
$10
$20
$30
$40
$50
$60
Tran
saction coun
t
Tran
saction value (US$ billion)
Transaction Value Total Transactions

Page 11
► Bankruptcy flood near an end̶ ~120 upstream; ~120 OFS̶ Offshore GOM still challenged̶ Restructured companies better positioned to buy or merge
► IPO market active ̶ OFS, Upstream, Midstream̶ OFS ‐ completion names & Permian focus leading the way; water on deck
► U.S. Rig count has increased 19 consecutive weeks̶ Permian and Eagle Ford up 164% and 177%, respectively, since May 2016
► Forecasted US oil production increase̶ EIA forecasts US average crude oil production of ~9.3 mm b/d in 2017 and ~10.0 mm b/d in 2018̶ Possible increased midstream capex
► Multiple key factors for active M&A market► Good news: Access to capital (public and private), Motivated buyers, Willing sellers
► Uncertainty: Industry fundamentals/commodity prices, Quality targets, Access to debt
► Commodity price / industry fundaments leading driver for M&A and capital transactions
EY Investment BankingCurrent Market Notes
Page 12
EY | Assurance | Tax | Transactions | Advisory
About EYEY is a global leader in assurance, tax, transaction and advisoryservices. The insights and quality services we deliver help build trust andconfidence in the capital markets and in economies the world over. Wedevelop outstanding leaders who team to deliver on our promises to allof our stakeholders. In so doing, we play a critical role in building a betterworking world for our people, for our clients and for our communities.
EY refers to the global organization, and may refer to one or more, ofthe member firms of Ernst & Young Global Limited, each of which is aseparate legal entity. Ernst & Young Global Limited, a UK company limitedby guarantee, does not provide services to clients. For more informationabout our organization, please visit ey.com.
Ernst & Young Capital Advisors, LLC (EYCA) is a registered broker‐dealerand member of FINRA (www.finra.org) providing sector‐specific advice on M&A,debt capital markets, equity capital markets and capital restructuring transactions. It is an affiliate of Ernst & Young LLP, a member firm of Ernst & Young Global Limited, serving clients in the US.
Some of the materials contained herein are copyright © 2017, S&P Capital IQ (S&P). Reproduction and distribution of referenced S&P data in any form is prohibited except with the prior written permission of S&P. Use of S&P information is intended for the recipient’s internal use purposes only. None of S&P, its affiliates or their suppliers (together, S&P parties) guarantee the accuracy, adequacy, completeness or availability of any information nor are responsible for any errors or omission, regardless of the cause or for the results obtained from the use of such information. In no event shall any S&P party be liable for any damages, costs, expenses, legal fees or losses (including lost income or profit or opportunity costs) in connection with any use of S&P information.
© 2017 Ernst & Young LLP.All Rights Reserved.