steffen m. noe, ahto kangur, urmas hõrrak, marko kaasik smear estonia - current state and further...
TRANSCRIPT

Steffen M. Noe, Ahto Kangur, Urmas Hõrrak, Marko Kaasik
SMEAR Estonia - Current state and further development.

SMEAR Estonia
The SMEAR Estonia station The SMEAR Estonia station
The SMEAR Estonia station is a delocalised infrastructure in South-East Estonia.

XII Ökoloogiakonverents 2013 Tartu 18. Oktoober 2013
The start 2008 in LiispõlluThe start 2008 in Liispõllu
XII Ökoloogiakonverents 2013 Tartu 18. Oktoober 2013
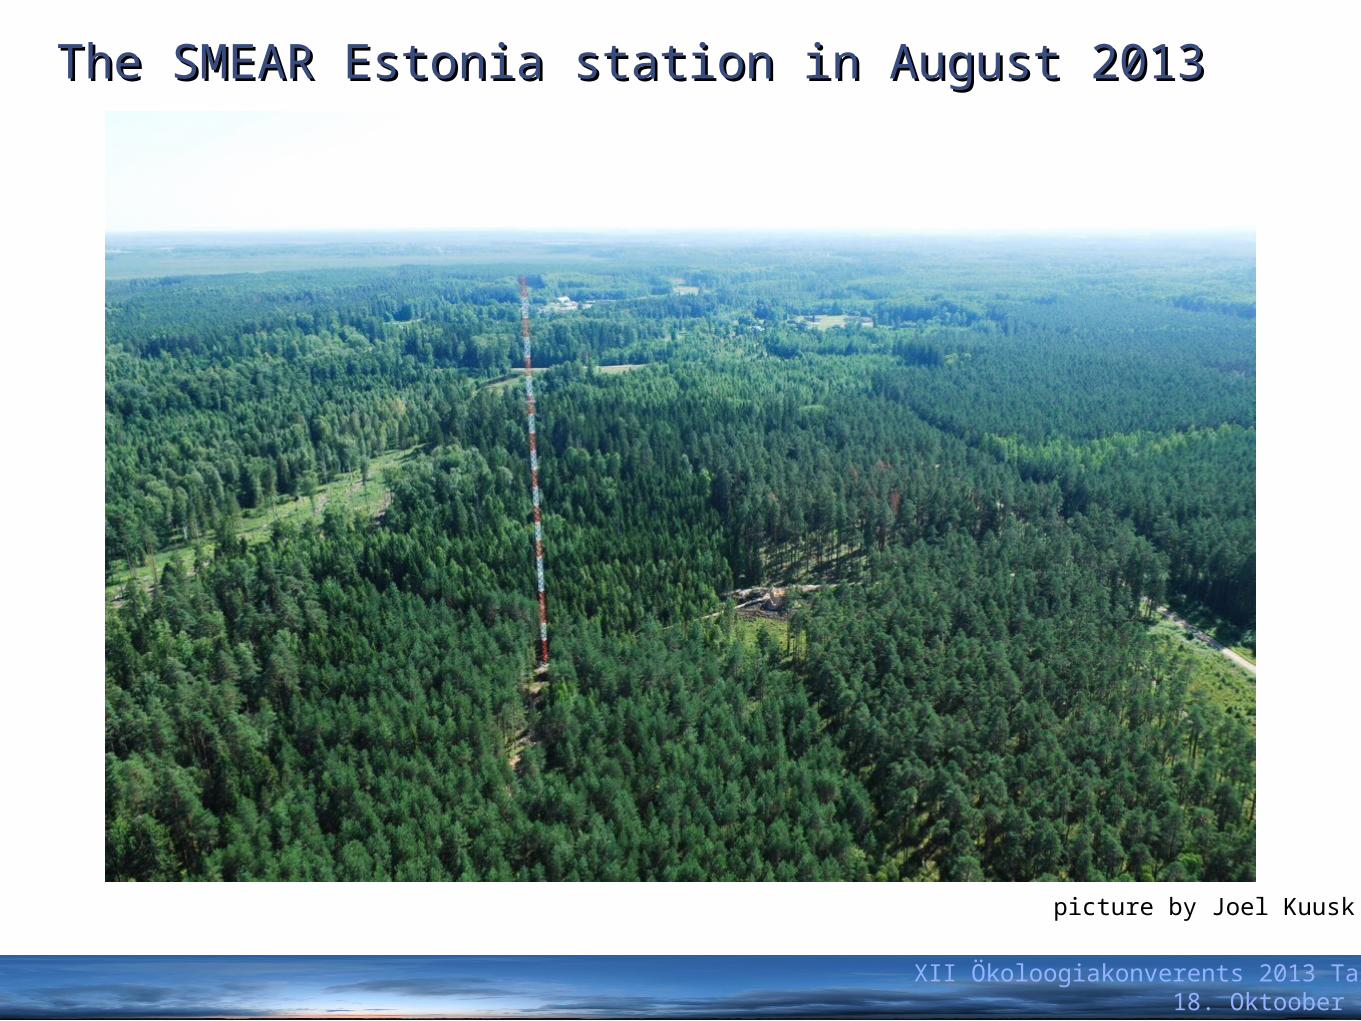
The SMEAR Estonia station in August 2013The SMEAR Estonia station in August 2013
picture by Joel Kuusk

SMEAR Estonia
Planned Equipment at JärvseljaPlanned Equipment at Järvseljamastmast
September 2013130m
110m
90m
70m
50m
40m
30m
15m
5m
Main Cottage
T, inlet
A, T, inlet
A, T, inlet
T, inlet
EC, A, T, inlet
EC, A, T, inlet
A, T, inlet
A, T, inlet
T, inlet
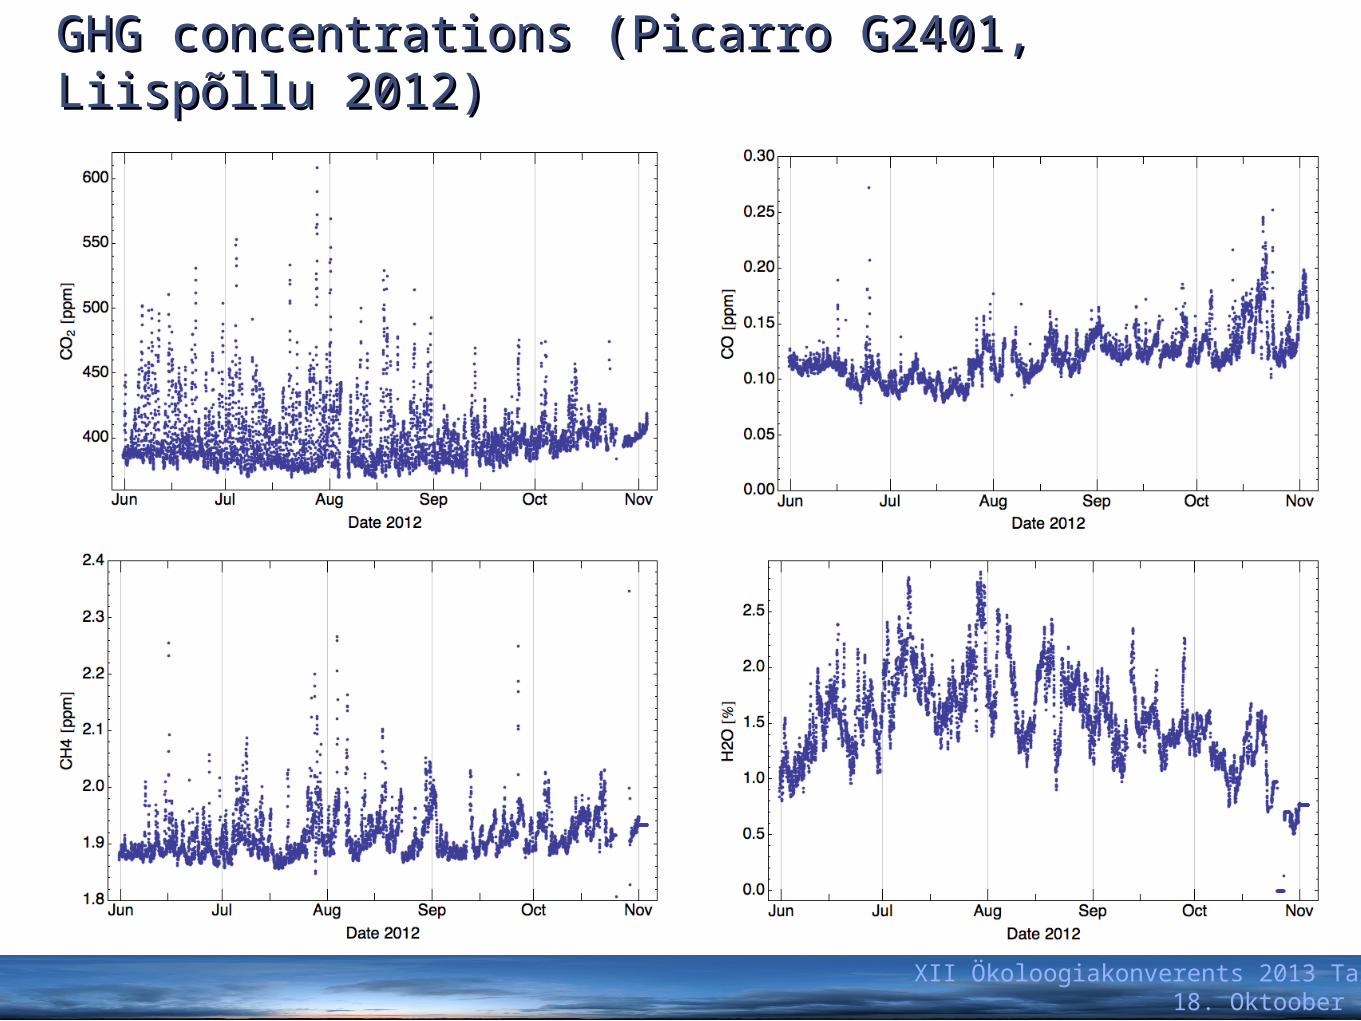
The inlets draw air down to the main cottage where gas analysers measure the concentrations of greenhouse gases (CO2, CO, CH4), water vapour, reactive trace gases (O3, NOx, SO2).
The Eddy covariance systems (EC) are used to measure direct fluxes of CO2, H2O and CH4.
Air ion and aerosol size distributions are measured in the vicinity of the 130m mast.
Small ecosystem towers (like Liispõllu) in the vicinity of the mast are used to measure photosynthesis and BVOC emissions.
Automatic soil chambers measure the CO2 and H2O fluxes over the soil surfaces.
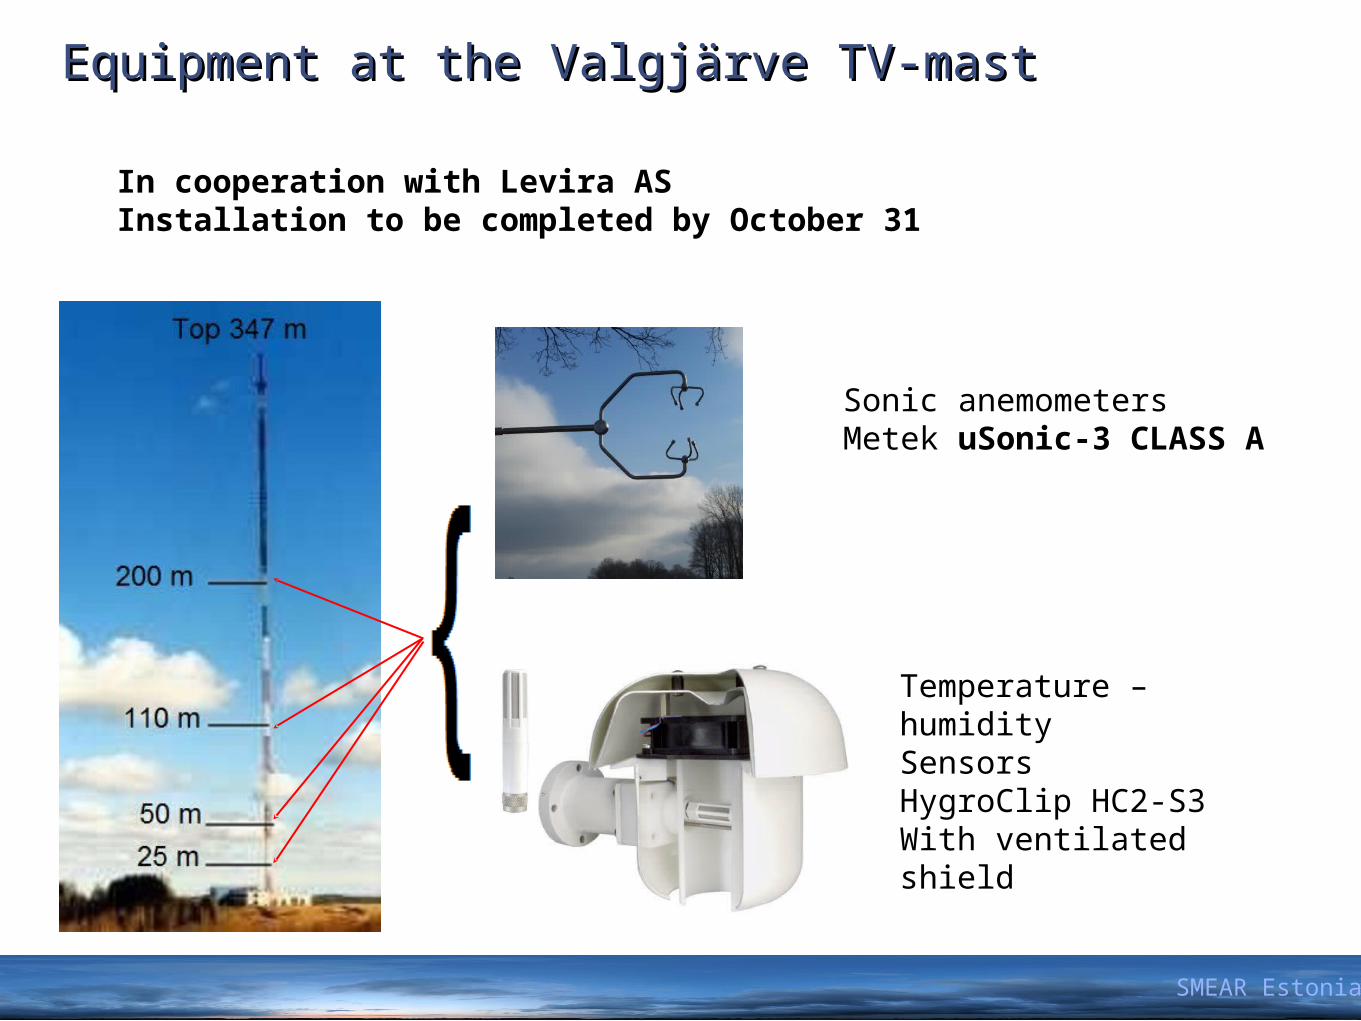
In cooperation with Levira ASInstallation to be completed by October 31
Sonic anemometersMetek uSonic-3 CLASS A
Temperature – humidity SensorsHygroClip HC2-S3With ventilated shield
SMEAR Estonia
Equipment at the Valgjärve TV-mastEquipment at the Valgjärve TV-mast
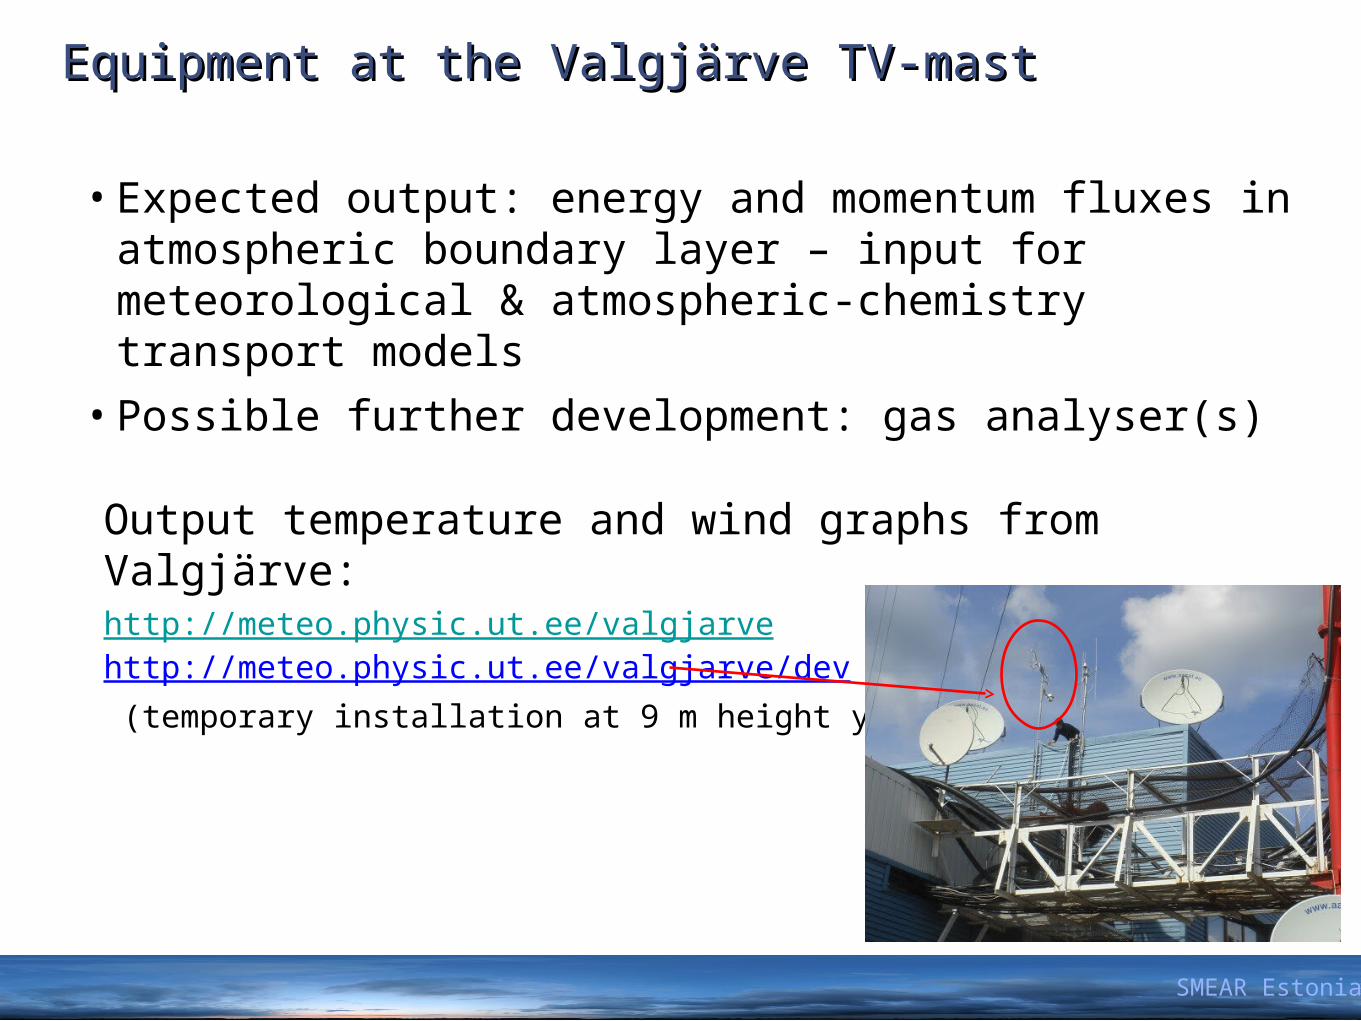
• Expected output: energy and momentum fluxes in atmospheric boundary layer – input for meteorological & atmospheric-chemistry transport models
• Possible further development: gas analyser(s)
Output temperature and wind graphs from Valgjärve:http://meteo.physic.ut.ee/valgjarvehttp://meteo.physic.ut.ee/valgjarve/dev
(temporary installation at 9 m height yet)
SMEAR Estonia
Equipment at the Valgjärve TV-mastEquipment at the Valgjärve TV-mast
SMEAR Estonia
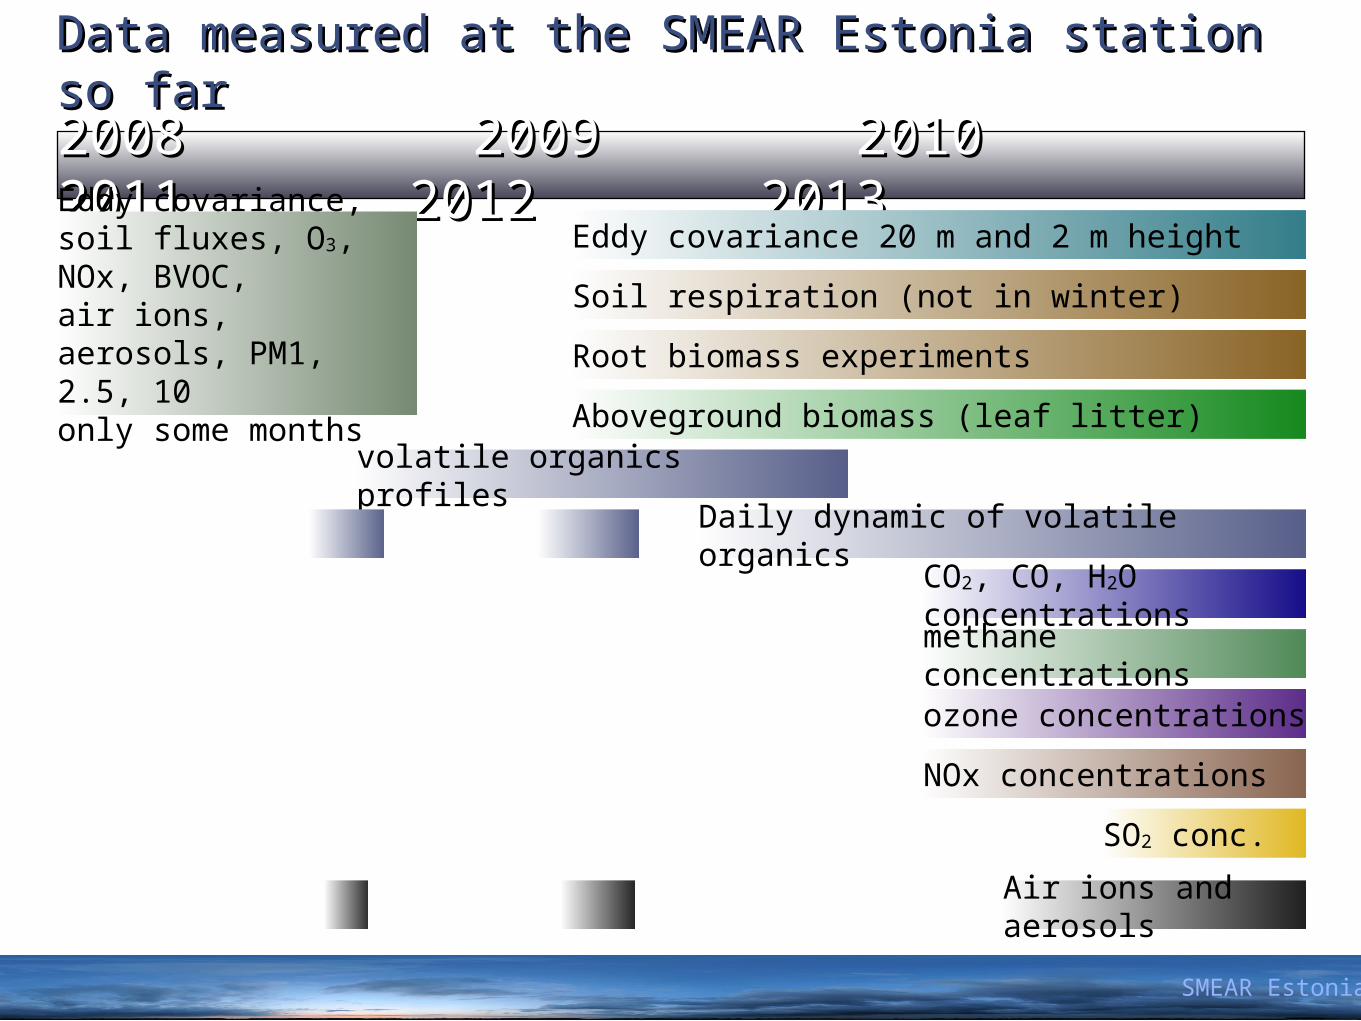
Data measured at the SMEAR Estonia station so farData measured at the SMEAR Estonia station so far
2008 2009 2010 2008 2009 2010 2011 2012 20132011 2012 2013Eddy covariance, soil fluxes, O3, NOx, BVOC,air ions, aerosols, PM1, 2.5, 10only some months
Eddy covariance 20 m and 2 m height
Soil respiration (not in winter)
Root biomass experiments
Aboveground biomass (leaf litter)
volatile organics profiles
Daily dynamic of volatile organics
CO2, CO, H2O concentrations
methane concentrations
ozone concentrations
NOx concentrations
SO2 conc.
Air ions and aerosols
XII Ökoloogiakonverents 2013 Tartu 18. Oktoober 2013
GHG concentrations (Picarro G2401, Liispõllu 2012)GHG concentrations (Picarro G2401, Liispõllu 2012)

SMEAR Estonia
COCO22 fluxes (EC measurements, daily dynamics) fluxes (EC measurements, daily dynamics)

SMEAR Estonia
Trace gas concentrations (daily dynamic)Trace gas concentrations (daily dynamic)

SMEAR Estonia
Spruce branch BVOC emissions in autumn 2012Spruce branch BVOC emissions in autumn 2012

SMEAR Estonia
Modelled aboveground biomass flux from litterfall dataModelled aboveground biomass flux from litterfall data
r2 = 0.8, P < 0.08
r2 = 0.81, P < 0.0001
Gap-filling using parameter estimations
Litterfall data was collected monthly since 2011 at three different sites in Järvselja.
Gap filled yearly litter mass flux accounts to 7.3 t ha-1 year-1 for the gaussian approach that covers more of the measured data. The polynomial approach yields to 5.7 t ha-1 year-1.

SMEAR Estonia
Aerosols daily dynamicAerosols daily dynamic
Example of a typical ”Banana”-shaped nucleation event and the dynamic of secondary organic aerosol (SOA) growth.
Oxidation products from the reactive trace gases lead to condensation on already existing clusters. That process is driven by sun light!

SMEAR Estonia
Aerosol formation events measured in Spring 2013Aerosol formation events measured in Spring 2013

SMEAR Estonia
Nucleation event daysNucleation event days
Järvselja 2013 Hyytiälä 2009
Nieminen et al. 2010, 14 years of observation of atmospheric particle formation in Hyytiälä, Finland: in Report Series in Aerosol Sciences 109, 2010

SMEAR Estonia
Publications related to SMEAR Estonia so far…Publications related to SMEAR Estonia so far…
2011
2012
2014

AcknowledgementsAcknowledgements
The study was supported by the EU Regional Development Fundation, Environmental Conservation and Environmental Technology R&D Programme project BioAtmos (3.2.0802.11-0043).
Info:http://smear.emu.ee
SMEAR Estonia