study on road friction database for automated driving
TRANSCRIPT

Study on Road Friction Database for Automated Driving - Fundamental Consideration of Measuring Device for Road Friction Database -
Ichiro Kageyama 1,2, Yukiyo Kuriyagawa 2, Tetsunori Haraguchi 1,2,3,*, Tetsuya Kaneko 4, Motohiro Asai 5 and Gaku
Matsumoto 5
1 Consortium on Advanced Road-Friction Database, 1-4-31 Hachimandai, Sakura, Chiba 285-0867, Japan;
[email protected] 2 College of Industrial Technology, Nihon University, 1-2-1 Izumi-cho, Narashino, Chiba 275-8575, Japan;
[email protected] 3 Nagoya University, Furocho, Chikusaku, Nagoya, Aichi 464-8603, Japan; [email protected] 4 Osaka Sangyo University, 3-1-1 Nakagaito, Daito, Osaka 574-8530, Japan; [email protected] 5 Nihon Michelin Tire Co.,Ltd., Shinjuku Park Tower 13F, 3-7-1 Nishi-Shinjuku, Shinjuku-ku, Tokyo 163-1073,
Japan; [email protected]
* Correspondence: [email protected]
Featured Application: The magic formula (MF) is used to estimate the road friction characteris-
tics.
Abstract: This research deals with the possibility for construction of the database on the braking
friction coefficient for actual roads from the viewpoint of traffic safety especially for automated
driving such as level 4 or higher. In an automated driving such levels, the controller needs to control
the vehicle, but the road surface condition, especially the road friction coefficient on wet roads,
snowy or icy roads, changes greatly, and in some cases, changes by almost one order. Therefore, it
is necessary for the controller to constantly collect environment information such as the road friction
coefficients and prepare for emergencies such as obstacle avoidance. However, at present, the meas-
urement of the road friction coefficients is not systemically performed, and a method for accurately
measuring has not been established. In order to improve this situation, this study examines a
method for continuously measurement for the road friction characteristics such as μ-s characteris-
tics.
Keywords: Road Friction; Environmental Information; Measurement; Friction Estimation
1. Introduction
According to data from the Ministry of Land, Infrastructure, Transport and Tourism,
the pavement rate of Japanese road in 2019 is about 82.4% including simple pavement,
and the pavement rate of general national roads is about 99.5%. The spread of pavement
can be expected to improve riding comfort, fuel consumption, and noise and vibration
performance. Especially on paved roads, the friction coefficient is relatively high, and rel-
atively high braking performance and obstacle avoidance performance are expected as a
viewpoint of road safety. However, even on such pavement roads, these coefficients of
friction have been shown to be significantly affected by surface conditions such as wet,
dry, snowy and icy conditions, as well as running speed. It is also known that the friction
coefficient of the road surface is greatly affected by the pavement material, pavement
method, and usage conditions even if the road surface condition is the same. According
to the literature [1], it is shown that the road surface friction coefficient significantly de-
creases according to a vehicle speed as shown in Figure 1. From this Figure 1, it can be
seen that the sliding friction coefficient at wet condition depends on the speed, and in
particular, the reduction rate of the friction in the wet surface is extremely large. Further-
more, it was reported that the friction characteristics of the accident occurrence location
were measured, and it was shown that the accident occurrence rate increases when the
friction coefficient is 0.4 or less.
Preprints (www.preprints.org) | NOT PEER-REVIEWED | Posted: 15 November 2021
© 2021 by the author(s). Distributed under a Creative Commons CC BY license.

On actual roads, the coefficient of braking friction varies greatly depending on the
state of wetness, running pattern of the vehicles, tire structure and surface material, and
so on. According to researchers for pavement, pavement in recent years has taken safety
into consideration, and the spread of permeable pavement, which is particularly wide-
spread on highways in Japan, has led to a sharp decrease in the accident rate on highways.
It is considered that this is largely due to the effect of improving visibility in rainy weather
and suppressing a decrease in the friction coefficient in wet surfaces. In this way, the road
surface friction characteristics are greatly related to the safety of the vehicle, and it seems
that the safety has been secured considerably at present. In addition, these changes in
friction characteristics are greatly affected by the dryness and wetness of the road surface,
but a more dangerous condition is the effect of snowfall and freezing in winter, and in
some cases the friction coefficient decreases by about an order of magnitude. A systematic
measurement method of the braking friction coefficient on an actual road and its creation
in a database will be very important issues from the viewpoint of contribution to traffic
safety and construction of a new driving support system including automated driving.
Therefore, it was pointed out that the importance of estimating the road surface in auton-
omous driving would increase in the future.
Therefore, in this study, we will provide information on how to consider the road
friction coefficient in order to ensure the safety of the vehicle, especially the safety of the
autopilot vehicle that will become widespread in the future, and how to provide such
information.
Figure 1. Sliding friction coefficient and road surface condition [1].
2. Characteristics of Road Friction
Normally, two main methods have been used to measure the road friction coefficient
on the actual road surface, one is a stationary measuring device such as Pendulum-type
skid resistance tester (British Pendulum Skid Resistance Tester), DF tester (Dynamic Fric-
tion Tester), and so on, and the other is a moving state measuring device such as bus-
based or trailer-based road slip resistance measurement vehicle such as Grip Tester, and
so on [4,5]. The former is suitable mainly for measuring the dynamic friction coefficient at
a local point, and the latter is suitable for measuring the friction characteristics of an actual
tire while moving. The purpose of these devices is focused on measuring the maximum
coefficient of friction on the road surface.
Important characteristics between tire and road in the development of new vehicles
are not only to know about the maximum coefficient of friction, but also to know about
the value of the slip ratio at which the maximum coefficient of friction occurs, the braking
coefficient related to the braking effect, rolling resistance related to fuel consumption.
Figure 2 shows typical road friction characteristics during braking measured at 65km/h.
Paved road(dry surface)
Paved road(wet surface)
Compacted snowor crushed snow
Compacted snowor crushed snow
0
0.1
0.2
0.3
0.4
0.5
0.6
0.7
0.9
Sli
din
g f
rict
ion
Co
effi
cien
t
0 20 40 60Speed (km/h)
80 100
0.8
Preprints (www.preprints.org) | NOT PEER-REVIEWED | Posted: 15 November 2021
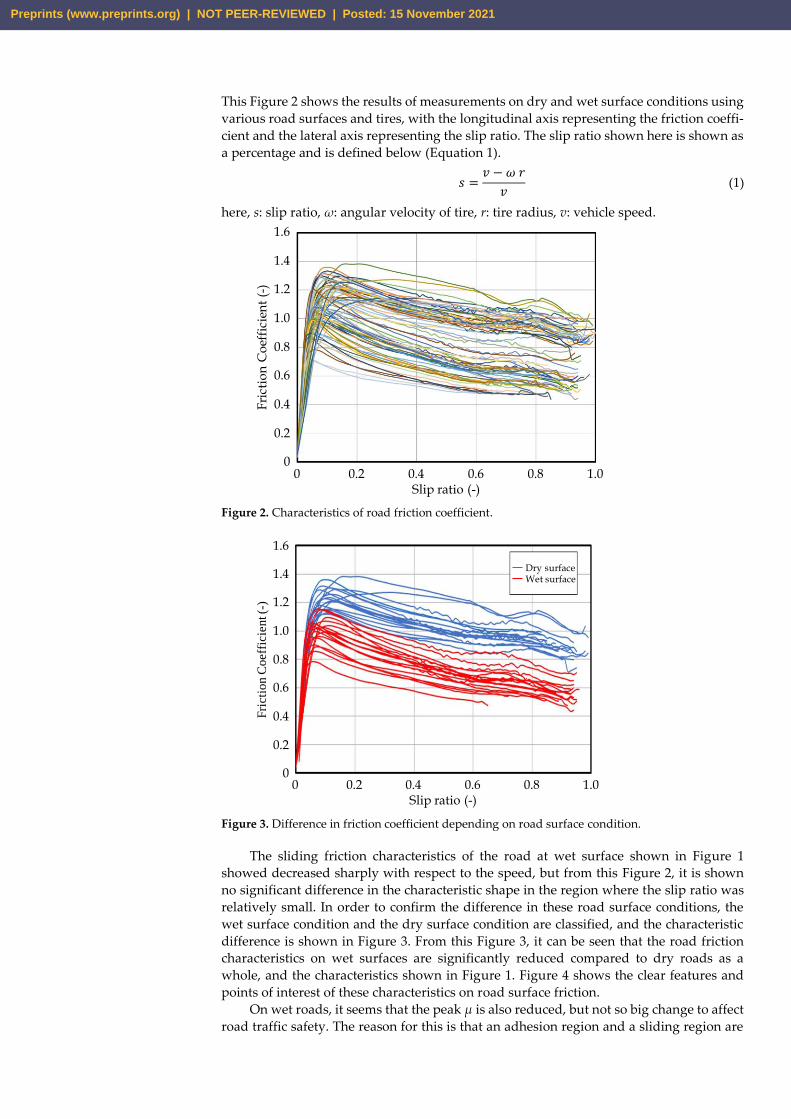
This Figure 2 shows the results of measurements on dry and wet surface conditions using
various road surfaces and tires, with the longitudinal axis representing the friction coeffi-
cient and the lateral axis representing the slip ratio. The slip ratio shown here is shown as
a percentage and is defined below (Equation 1).
𝑠 =𝑣 − 𝜔 𝑟
𝑣 (1)
here, s: slip ratio, ω: angular velocity of tire, r: tire radius, v: vehicle speed.
Figure 2. Characteristics of road friction coefficient.
Figure 3. Difference in friction coefficient depending on road surface condition.
The sliding friction characteristics of the road at wet surface shown in Figure 1
showed decreased sharply with respect to the speed, but from this Figure 2, it is shown
no significant difference in the characteristic shape in the region where the slip ratio was
relatively small. In order to confirm the difference in these road surface conditions, the
wet surface condition and the dry surface condition are classified, and the characteristic
difference is shown in Figure 3. From this Figure 3, it can be seen that the road friction
characteristics on wet surfaces are significantly reduced compared to dry roads as a
whole, and the characteristics shown in Figure 1. Figure 4 shows the clear features and
points of interest of these characteristics on road surface friction.
On wet roads, it seems that the peak μ is also reduced, but not so big change to affect
road traffic safety. The reason for this is that an adhesion region and a sliding region are
0 0.2 0.4 0.6 0.8 1.00
0.2
0.4
0.6
0.8
1.0
1.2
1.4
1.6
Slip ratio (-)
Fri
ctio
n C
oef
fici
ent
(-)
0
0.2
0.4
0.6
0.8
1.0
1.2
Fri
cti
on C
oeff
icie
nt (-
)
0 0.2 0.4 0.6 0.8 1.0Slip ratio (-)
Dry surfaceWet surface1.4
1.6
Preprints (www.preprints.org) | NOT PEER-REVIEWED | Posted: 15 November 2021

generated in the contact patch of the tire, and the reason why friction coefficients in the
sliding region is reduced at wet surfaces. In order to clarify the relationship around this
point, we focused on the relationship between peak μ and lock μ, and is shown in Figure
5.
Figure 4. Important characteristics of road friction.
Figure 5. Ratio of lock μ to peak μ.
In this Figure 5, the value of peak μ is on the lateral axis, and the degree of decrease
in lock μ to the peak μ is shown with respect to this value. This data was measured at
65km / h with a trailer type tire testing machine. From this Figure 5, the decrease in lock
μ on the wet road surface is clearly shown, and it is considered that the effect of the de-
crease in friction coefficient due to the velocity shown in Figure 1 is clearly shown. Cur-
rently, automobiles sold in Japan are obliged to install ABS, so when braking suddenly
such as emergency breaking, it will be used near the peak μ. Therefore, in order to ensure
a vehicle safety, it is necessary to know not only the lock μ but also the peak μ.
Another issue with road friction properties is how road position dependent these
properties are. For this purpose, continuous friction characteristic measurement is re-
quired, but in the above-mentioned trailer type and other measuring instruments, the
characteristic measurement is performed by changing the slip ratio during running, so
this continuous data cannot be measured. The Grip Tester as shown in Figure 6 can be
used as a device that can measure continuously, but with this device, the slip ratio is fixed.
In the μ-s characteristics shown in Figure 2, the slip ratios at peak μ appear to be around
10%, therefore, the measurement result in which the slip ratio on Grip Tester is fixed at
10% is shown in Figure 7. Here, the measurement result when traveling 250m is shown.
As it is clear from this Figure 7, the road surface friction characteristic with respect to the
position of the road surface changes greatly depending on the environmental change and
the condition of the traveling vehicle. From these results, it can be seen that continuous
measurement of road friction characteristics on ordinary road surfaces is important. How-
ever, another problem is that the peak μ changes depending on the road surface and tires.
0 0.2 0.4 0.6 0.8 1.0Slip ratio (-)
0
0.2
0.4
0.6
0.8
1.0
1.2
Fri
ctio
n C
oef
fici
ent
(-)
0
0.2
0.4
0.6
0.8
1.0
1.2
0 0.5 1.0 1.5µmax
µL
ock
/µ
max
Dry surfaceWet surface
Preprints (www.preprints.org) | NOT PEER-REVIEWED | Posted: 15 November 2021

Figure 8 shows the relationship between the slip ratio s at peak μ and the peak μ value
using the μ-s characteristic shown in Figure 3.
Figure 6. Grip Tester using experiment.
Figure 7. Measurement result for road friction with Grip Tester.
Figure 8. Slip ratio at peak μ.
From this Figure 8, it can be seen that the slip ratio at which μ peaks are generally
concentrated until 20% or less, and these values change within this range. Therefore, it is
important to continuously measure the μ-s characteristics. Therefore, Figure 9 shows an
image diagram of this continuous μ-s characteristic and the data measured by the device
currently used for these measurements.
In this Figure 9, the y-axis shows the slip ratio, the z-axis shows the friction coefficient
of the road, and the x-axis shows the running position. Here, since the Grip Tester uses a
0
0.2
0.4
0.6
0.8
1.0
Fri
ctio
n C
oef
fici
ent
(-)
0 50 100 150 200 250Measurement Position (m)
0
0.2
0.4
0.6
0.8
1.0
1.2
1.4
1.6
Fri
ctio
n C
oef
fici
ent
(-)
0 0.2 0.4 0.6 0.8 1.0Slip ratio (-)
Dry surface
Wet surface
Preprints (www.preprints.org) | NOT PEER-REVIEWED | Posted: 15 November 2021

sprocket and a chain to realize a substantially constant slip ratio with respect to the main
tire, continuous data can be measured, but the slip ratio is constant. In general, trailer-
type and bus-type testers that measure μ-s characteristics apply braking force to the meas-
ured tires to change the slip ratio, assuming that the friction during this length is constant,
the measurement is performed with respect to the certain traveling distance as shown in
the Figure 9. Therefore, it is impossible to measure continuous characteristics to travel
distance. Furthermore, since the BP tester and the DF tester measure the lock μ, they can
be used as reference data for vehicle safety, but not as effective information for the safety.
Therefore, it is necessary to construct a method for measuring the μ-s characteristics
shown in Figure 9 with respect to the traveling direction of the road. Therefore, it is nec-
essary to construct a method for measuring the μ-s characteristics shown in Figure 9 with
respect to the traveling direction of the road.
Figure 9. Image of μ-s characteristics on actual roads and of the various measurement system data
[3].
Table 1. Features of the measurement system.
Peak μ Lock μ μ-s
Characteristics Continuity
Velocity
dependence
Trailer tester
Bus tester ○ ○ ○ × ○
Grip tester △ × × ○ ○
BP tester × ○ × × ×
DF tester × ○ × × ○
Finally, Table 1 summarizes the characteristics of devices that generally measure
road surface friction characteristics in the past.
From this result, it can be seen that none of the measuring devices currently in use
satisfies all the road friction information proposed in this study. Since there is no device
for directly measuring the new road surface friction characteristics proposed by this pa-
per, therefore, we propose a new measurement system for estimating these characteristics
in the following chapters.
3. Road friction estimation method
In order to continuously measure the road surface friction characteristics, it is neces-
sary to continuously measure the characteristics with a fixed slip ratio. Furthermore, it is
necessary to confirm the method for estimating the overall μ-s characteristics from some
combinations of μ and s set. In this study, the magic formula (MF) proposed by Prof.
Pacejka in Delft University of Technology [2] is used to estimate the road friction charac-
teristics. This MF has been complicated and improved so that the detailed characteristics
Trailer type Tester
Bus type TesterPeak μ
BP Tester
DF Tester
Grip Tester
Fri
cti
on C
oeff
icie
nt (-
)
Slip
ratio
(-)
Position (m)
0
0.2
0.4
0.6
0.81.0
Preprints (www.preprints.org) | NOT PEER-REVIEWED | Posted: 15 November 2021

of the tire can be expressed, but this basic concept is used in this paper. The basis of this
equation is a combination of the sin function and the arctangent function (Equation 2),
which is expressed here using three parameters as follows.
𝜇 = 𝑎 sin{𝑏 tan−1(𝑐 𝑠)} (2)
Here, a, b, and c are parameters for determining the characteristic shape, and s means
slip ratio. Differentiating this MF with the slip ratio s gives the following Equation 3.
𝑑𝜇
𝑑𝑠=
𝑎 𝑏 𝑐 cos{𝑏 tan−1(𝑐 𝑠)}
𝑐2 𝑠2 + 1 (3)
Here, since the differentiation of MF at s = 0 represents KB, following Equation 4 is intro-
duced.
𝐾𝐵 =𝜕𝜇(𝑠)
𝜕𝑠
|𝑠=0 = 𝑎 𝑏 𝑐 (4)
Next, at the point where Equation 3 becomes 0, the value at which this value peaks is μ-
max, so the slip ratio at which peak μ occurs using this is shown below (Equation 5).
𝑠𝑃 =tan (
𝜋2𝑏
)
𝑐 (5)
Using this Equation 5, the peak μ (μ-max) is expressed by the following Equation 6.
𝜇max = 𝑎 sin [𝑏 tan−1 {tan (𝜋
2𝑏)}] (6)
Further, lock μ is obtained by substituting s = 1 for MF, and is shown in the following
Equation 7.
𝜇𝐿 = 𝑎 sin(𝑏 tan−1 𝑐) (7)
In order to express each characteristic shown here, it is necessary to identify the pa-
rameters a, b, and c in the MF shown in Equation 2, using the experimental data. We con-
duct here using the experimental results of three sets of μ and s. As an example, Figure 10
shows a comparison between the result identified using MF and the experimental result.
From this result, it can be seen that although the value of lock μ is slightly different, the
μ-s characteristics can be generally identified by using MF. The parameters at this identi-
fication result are as follows.
a=0.8232 b=1.6450 c=21.1680
Figure 10. Comparison between experiment and identification results [3].
0
0.2
0.4
0.6
0.8
1.0
Fri
ctio
n C
oef
fici
ent
(-)
0 0.2 0.4 0.6 0.8Slip ratio (-)
identification resultexperimental data
Preprints (www.preprints.org) | NOT PEER-REVIEWED | Posted: 15 November 2021

Therefore, the results of determining these three parameters a, b, c based on the ob-
tained experimental data are shown in Figure 11. Since the parameter a represents the
value of the peak μ, it is compared with this value. Here, since the identification is per-
formed using the steepest descent method, the relationship with other parameters is also
examined, but from the relationship in this Figure 11(a), the correlation coefficient be-
tween μ-max and parameter a is about 0.994. It shows a very high correlation. The rela-
tionship between the remaining parameters b and c is shown in the Figure 11(b), and alt-
hough there are large variations due to differences in shape, etc., the range that these pa-
rameters can take is clarified. MF is a transcendental function, and if it is calculated using
data of three points in this paper, innumerable solutions that completely match these will
occur, but it is impossible to describe actual μ-s characteristics using such solution. So, the
convergence calculation is performed by specifying the range that each parameter can
take with reference to these values. Therefore, identification is performed by setting re-
strictions on each coefficient based on the shape of the actual μ-s characteristic.
(a) Relation between μmax and parameter a
(b) Relation between parameter b and c
Figure 11. MF parameters identified from experimental data.
4. Identification result of road friction characteristics
In the Figure 8, the slip ratio sP at which the peak μ occurs is concentrated at about
5% to 10% on the wet surface conditions and around 8% to 18% on the dry surface condi-
tions. Since most vehicles in Japan are equipped with an ABS system, the operating range
when emergency braking is required is mainly near this peak μ. In order to improve the
estimation accuracy of peak μ as much as possible, it is necessary to concentrate around
the slip ratio sP for the identification. Therefore, the slip ratios for measurement are set to
3, 10, 17% for the equipment designed in this paper. Therefore, the results of estimating
the μ-s characteristics using the characteristics of these three points are shown for the char-
acteristics of the three different characteristics as shown in Figure 12. This Figure 12 is the
0 0.5 1.0 1.5µmax
0.2
0.4
0.6
0.8
1.0
1.2
1.4
0
Par
amet
er a
0 0.5 1.0 1.5 2.0 2.5
Parameter b
5
10
15
0
Par
amet
er c
20
Preprints (www.preprints.org) | NOT PEER-REVIEWED | Posted: 15 November 2021
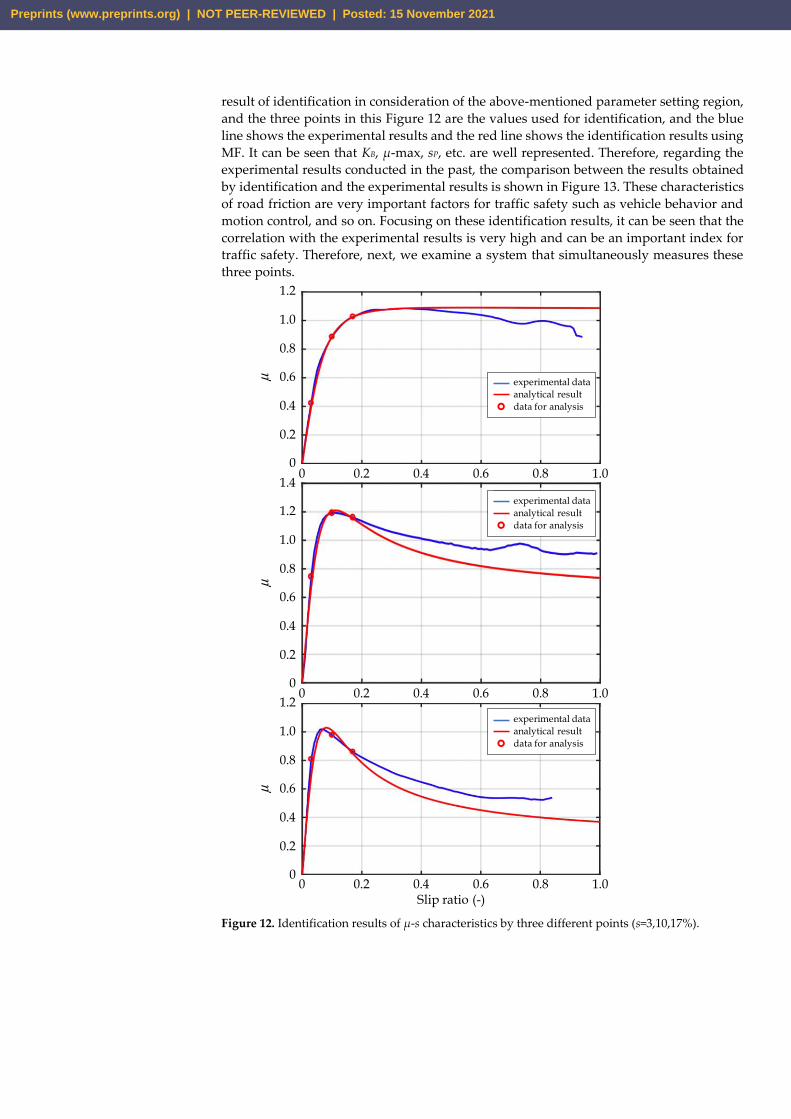
result of identification in consideration of the above-mentioned parameter setting region,
and the three points in this Figure 12 are the values used for identification, and the blue
line shows the experimental results and the red line shows the identification results using
MF. It can be seen that KB, μ-max, sP, etc. are well represented. Therefore, regarding the
experimental results conducted in the past, the comparison between the results obtained
by identification and the experimental results is shown in Figure 13. These characteristics
of road friction are very important factors for traffic safety such as vehicle behavior and
motion control, and so on. Focusing on these identification results, it can be seen that the
correlation with the experimental results is very high and can be an important index for
traffic safety. Therefore, next, we examine a system that simultaneously measures these
three points.
Figure 12. Identification results of μ-s characteristics by three different points (s=3,10,17%).
0 0.2 0.4 0.6 0.8 1.0
0 0.2 0.4 0.6 0.8 1.0
0 0.2 0.4 0.6 0.8 1.0Slip ratio (-)
0
0.2
0.4
0.6
0.8
1.0
1.2
0
0.2
0.4
0.6
0.8
1.0
1.2
0
0.2
0.4
0.6
0.8
1.0
1.2
1.4
µµ
µ
experimental data
analytical result
data for analysis
experimental data
analytical result
data for analysis
experimental data
analytical result
data for analysis
Preprints (www.preprints.org) | NOT PEER-REVIEWED | Posted: 15 November 2021

(a) Identification result for KB
(b) Identification result for μmax
(c) Identification result for sP
Figure 13. Identification results
5. Consideration of measurement device
It is important to consider a mechanical connection to rotate the tire with a constant
slip ratio. As a simple mechanism, it can be realized by arranging sprockets or toothed
pulley having different numbers of tooth on the two tires shown in Figure14, and connect-
ing them with a chain or a timing belt. In this Figure 14, tire 1 is the main tire (driving
tire), and tire 2 is the measurement tire. What may be a problem here is that the main tire
may be greatly affected by the measurement tire and may not be able to rotate sufficiently.
Since these tires are attached to a trailer or a vehicle, they have the same speed, but it is
necessary to calculate the slip ratio of each tire in this case. Here, the same tires are used
(assumption R1=R2), the sprocket radii (r1, r2) are changed, and the slip ratios of each tire
0
5
10
15
20
25
30
35
KB
(Id
enti
fica
tio
n d
ata)
KB (Experimental data)0 10 20 30 40
R=0.994
R=0.982
0.5
1.0
0
0.5
µm
ax(I
den
tifi
cati
on
dat
a)
µmax (Experimental data)0 0.5 1.0 1.5
R=0.972
sP (Experimental data)0 0.1 0.2 0.5 0.60.3 0.4
s P(I
den
tifi
cati
on
dat
a)
0
0.2
0.3
0.4
0.5
0.6
0.1
Preprints (www.preprints.org) | NOT PEER-REVIEWED | Posted: 15 November 2021
are calculated as s1 and s2 from the vehicle speed v and the respective speeds ω1 and ω2.
Here, it is assumed that the rolling resistance is small, and that the μ-s characteristics of
each tire are the same. In this case, the slip ratio of the measured tire to the main tire is
represented below (Equation 8) using the mechanical connection condition.
Figure 14. Mechanical properties between two tires.
𝑠2 = 1 −𝑟1
𝑟2
(1 − 𝑠1) (8)
In addition, the following Equation 9 can be obtained from the relationship between the
torque balance of individual tires and the tension of the chain.
𝐹𝐵1 = −𝑟1
𝑟2
𝐹𝐵2 = −𝑟1
𝑟2
[𝑎 sin{𝑏 tan−1(𝑐 𝑠2)}] 𝑁2 (9)
Tire 1 becomes a drive tire, and the slip ratio can be kept small due to the sprocket ratio.
Therefore, under the condition (s1<<1), the longitudinal force of the tire 1 can be approxi-
mated as follows.
𝐹𝐵1 ≅ 𝑎 𝑏 𝑐 𝑠1𝑁1 (10)
Transforming the Equation 10 above, the slip ratio of the main tire is described as follow
(Equation 11).
𝑠1 = −1
𝑏 𝑐 𝑟1
𝑟2
𝑁2
𝑁1
sin{𝑏 tan−1(𝑐 𝑠2)} (11)
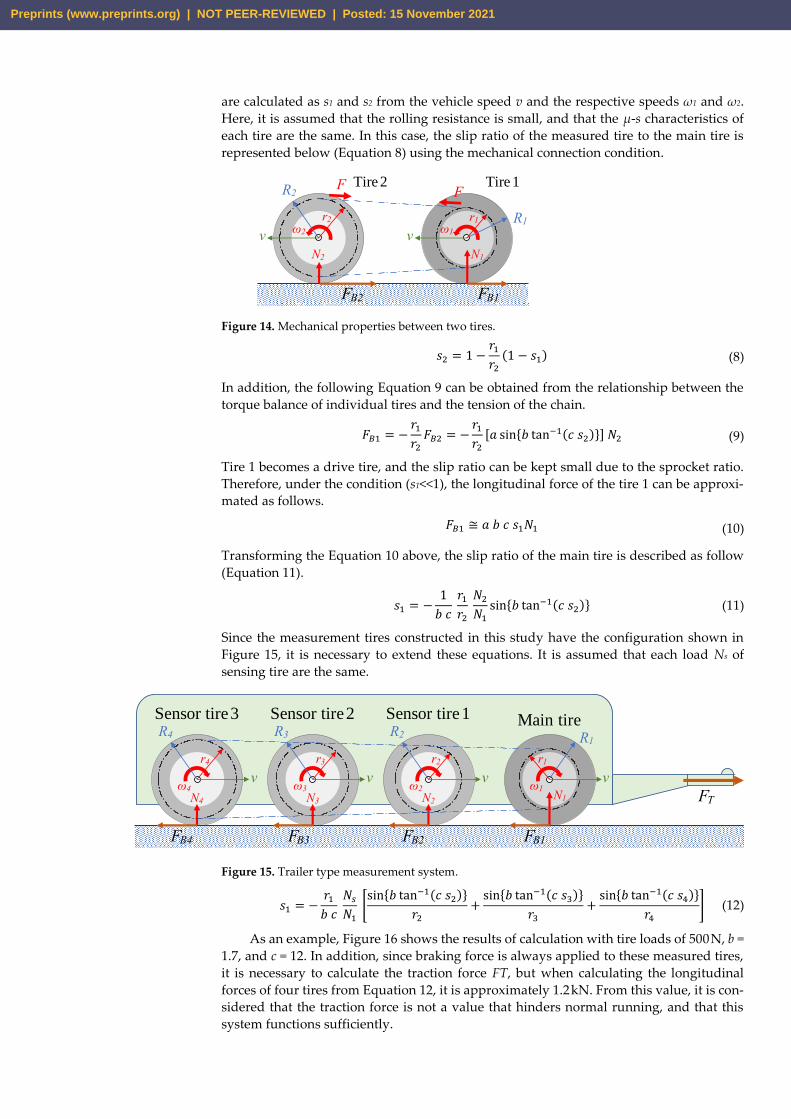
Since the measurement tires constructed in this study have the configuration shown in
Figure 15, it is necessary to extend these equations. It is assumed that each load Ns of
sensing tire are the same.
Figure 15. Trailer type measurement system.
𝑠1 = −𝑟1
𝑏 𝑐 𝑁𝑠
𝑁1
[sin{𝑏 tan−1(𝑐 𝑠2)}
𝑟2
+sin{𝑏 tan−1(𝑐 𝑠3)}
𝑟3
+sin{𝑏 tan−1(𝑐 𝑠4)}
𝑟4
] (12)
As an example, Figure 16 shows the results of calculation with tire loads of 500N, b =
1.7, and c = 12. In addition, since braking force is always applied to these measured tires,
it is necessary to calculate the traction force FT, but when calculating the longitudinal
forces of four tires from Equation 12, it is approximately 1.2kN. From this value, it is con-
sidered that the traction force is not a value that hinders normal running, and that this
system functions sufficiently.
Tire 1Tire 2
r1
FB2 FB1
FFR2
R1v
N2 N1
ω1ω2r2
v
Sensor tire2Sensor tire3 Sensor tire1 Main tire
FB4 FB3 FB2 FB1
v v v v
r2r3r4
R3R4 R2 R1
r1
ω2ω3ω4 ω1N3N4 N2 N1 FT
Preprints (www.preprints.org) | NOT PEER-REVIEWED | Posted: 15 November 2021

Figure 16. Slip ratio of tire 1.
6. Conclusion Remarks
This study examined the construction of a device for continuously measuring the
friction characteristics of actual roads, which are greatly related to the road safety. As a
result of the analysis, the following conclusions are obtained.
(1) The equipment that measures road friction characteristics are examined, especially
continuously measurement for μ-s characteristics, and it is shown that sufficient in-
formation cannot be obtained with the current equipment.
(2) As a result of analysis using MF to continuously measure μ-s characteristics, it is
shown that sufficiently satisfactory results will be obtained.
(3) Finally, it is shown that the outline of the trailer type measuring device using the
method.
We are currently constructing this measuring device, and we plan to show the results in
the future research.
7. Acknowledgement
A part of this research was carried out as a research project of East Nippon Express-
way Company Limited (NEXCO East Japan). We would like to thank all the people in-
volved.
References
1. Onoda. Skid Resistance on Road Surfaces. Asphalt 2003, Vol. 46, No.214, pp.3-10.
2. Pacejka, H. B.; Bakker, E. The magic formula tire model. Supplement to Vehicle System Dynamics 1992, Vol.21, pp.1-18.
3. Kageyama et al. Study on Measurement for Friction Characteristics on Actual Road Surface. Transactions of JSAE 2020, Vol.51,
No.5, pp.924-930
4. N B M Zaid, M R Hainin et.al. Evaluation of Skid Resistance Performance Using British Pendulum and Grip Tester. Earth and
Environmental Science 220 2019, pp.1-7.
5. H.S.Lee, et.al. Measuring Friction of Patterned and Textured Pavements -A Comparative Study-, Transportation Research Rec-
ord Journal of the Transportation Research Board 2155 2010, pp.91-98.
s 1
-0.06
-0.04
-0.03
-0.02
-0.01
0
-0.05
0 0.1 0.2 0.3 0.4 0.5N2 /N1
Preprints (www.preprints.org) | NOT PEER-REVIEWED | Posted: 15 November 2021