subnational finances-to-support-local-development
TRANSCRIPT
Enhancing the role of municipalities in local and
regional economies
Subnational finances to support local development
Zdôraznenie úlohy samospráv v miestnej a
regionálnej ekonomike – Podpora miestneho rozvoja
zo zdrojov regionálnej samosprávy
Seminar: "Inovácie a výzvy v manažmente regionálneho rozvoja“
Bratislava, Slovak Republic
Isabelle Chatry Project Manager, territorial reforms and subnational finance Public Governance and Territorial Development Directorate
OECD

The governance system of subnational government the OECD
Federations & quasi-federations
Unitary countries
38 960
3 818
360
579
78
2 489
1 788
245 1 478 310 8 186
36 004
8 176
419
31
74
11 510
446 311 314
255
338
3 197 2 935
2 109 2 320
605 402
2 874 6 272
103
105
212
213
35 countries: 9 federal and 26 unitary including 137 635 subnational governments in 2015-2016:
• 133 007 municipal-level entities • 4 108 intermediary-level entities • 520 regional or state-level entities
119

• The OECD institutional landscape which has dramatically changed over the last 20 years, especially since the crisis as a result of decentralisation or recentralisation processes.
The OECD: an institutional landscape very diverse and complex at subnational level
9 countries with only one level: - Municipalities
18 countries with two levels:
- States/regions - Municipalities
8 countries with three levels:
- States/regions - Intermediary gov.
- Municipalities
9 federations and quasi-federations
Australia Austria Canada Mexico
Switzerland
Germany Belgium Spain1
United States
25 unitary countries
Estonia Finland2 Ireland Iceland
Israel Latvia
Luxembourg Portugal2 Slovenia
Chile Korea
Denmark Greece
Hungary Japan
Norway
New Zealand Netherlands
Czech Republic Slovak Republic
Sweden Turkey
France Italy
Poland United Kingdom3
Notes: 1. Spain is a quasi-federal country. 2. Finland and Portugal have autonomous regions on part of the country. 3. There is an intermediary level only on part of England.
Almost 138 000
SNGs in the 35 OECD
countries in 2015-2016
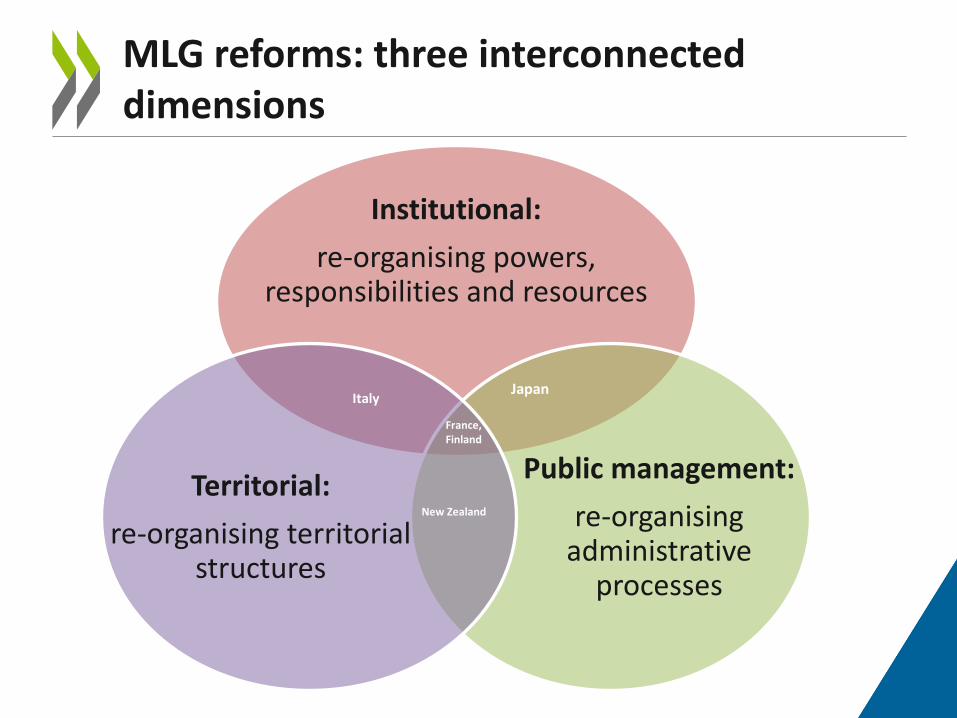
MLG reforms: three interconnected dimensions
Institutional:
re-organising powers, responsibilities and resources
Public management:
re-organising administrative
processes
Territorial:
re-organising territorial structures
France, Finland
Italy
New Zealand
Japan
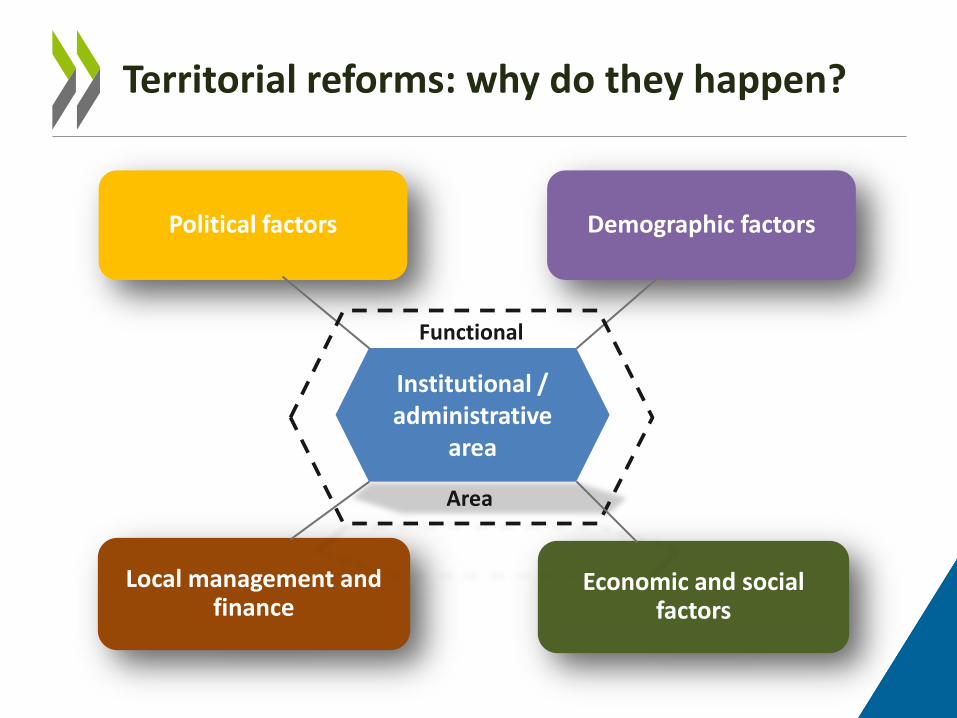
Demographic factors
Economic and social factors
Local management and finance
Political factors
Institutional / administrative
area
Functional
Area
Territorial reforms: why do they happen?
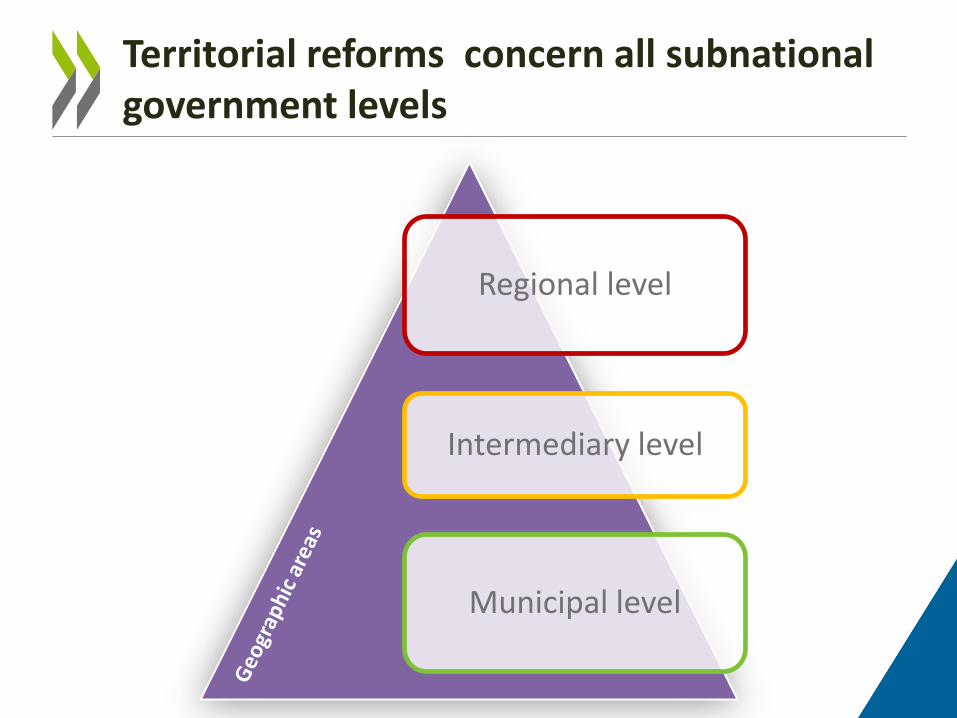
Territorial reforms concern all subnational government levels
Regional level
Intermediary level
Municipal level

Territorial reforms: a complex architecture D
eco
nce
ntr
ated
ad
min
istr
atio
ns
(c
en
tral
go
vern
me
nt
at t
err
ito
rial
leve
l)
De
cen
tralised
adm
inistratio
ns
(sub
natio
nal go
vern
me
nts)
Regional level
Intermediary level
Municipal level
Satellites
8
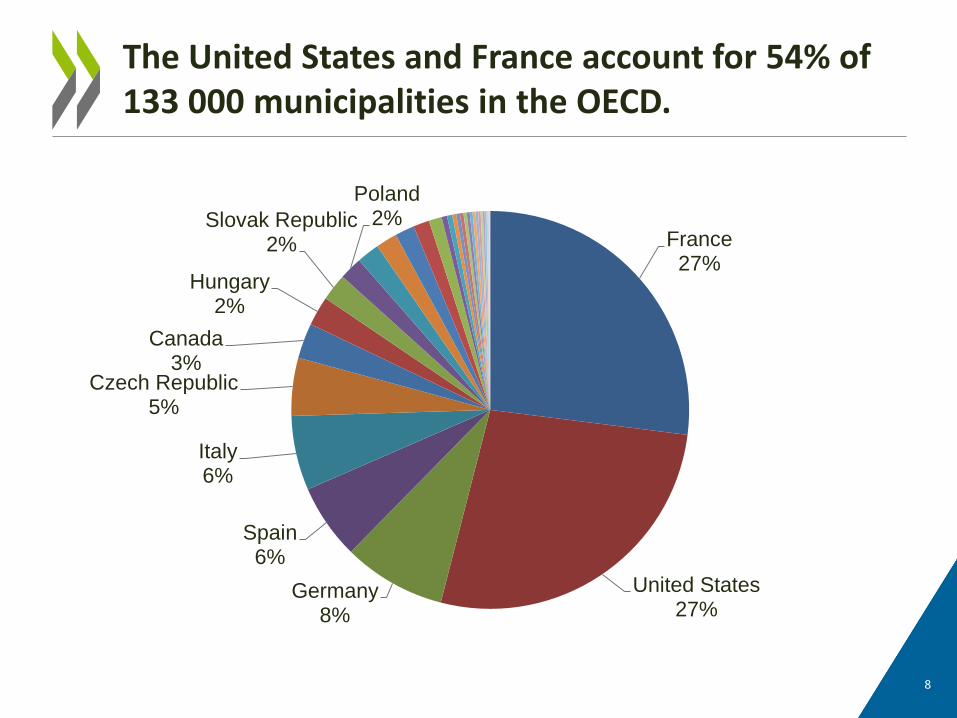
The United States and France account for 54% of 133 000 municipalities in the OECD.
France 27%
United States 27%
Germany 8%
Spain 6%
Italy 6%
Czech Republic 5%
Canada 3%
Hungary 2%
Slovak Republic 2%
Poland 2%
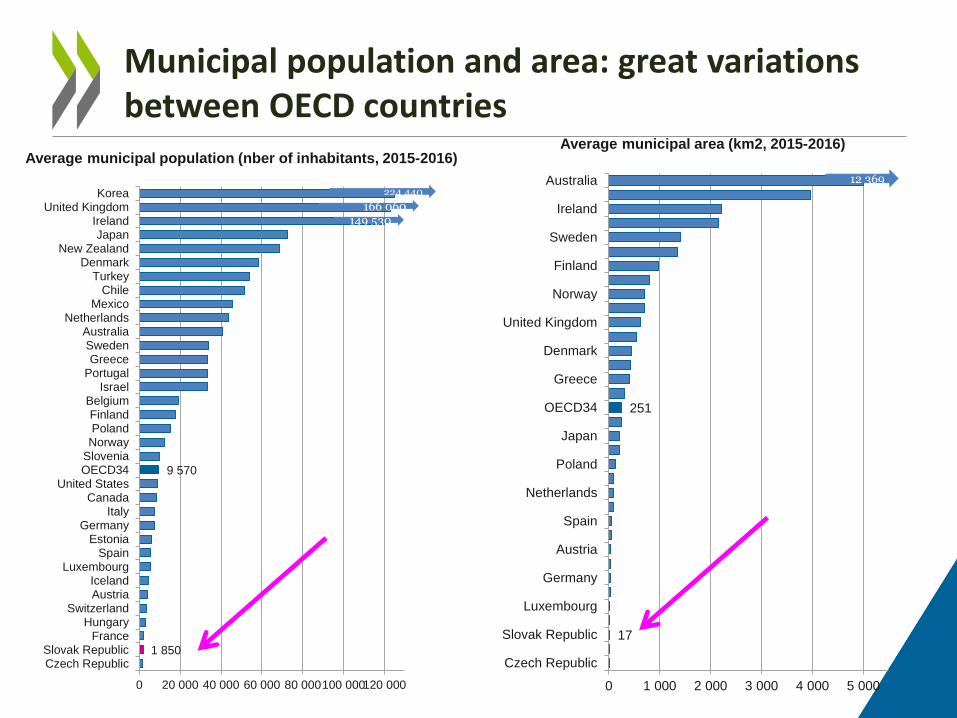
Municipal population and area: great variations between OECD countries
1 850
9 570
0 20 000 40 000 60 000 80 000100 000120 000
Czech RepublicSlovak Republic
FranceHungary
SwitzerlandAustriaIceland
LuxembourgSpain
EstoniaGermany
ItalyCanada
United StatesOECD34SloveniaNorwayPolandFinland
BelgiumIsrael
PortugalGreece
SwedenAustralia
NetherlandsMexico
ChileTurkey
DenmarkNew Zealand
JapanIreland
United KingdomKorea 224 440
166 060 149 530
Average municipal population (nber of inhabitants, 2015-2016)
17
251
0 1 000 2 000 3 000 4 000 5 000
Czech Republic
Slovak Republic
Luxembourg
Germany
Austria
Spain
Netherlands
Poland
Japan
OECD34
Greece
Denmark
United Kingdom
Norway
Finland
Sweden
Ireland
Australia 12 369
Average municipal area (km2, 2015-2016)
10
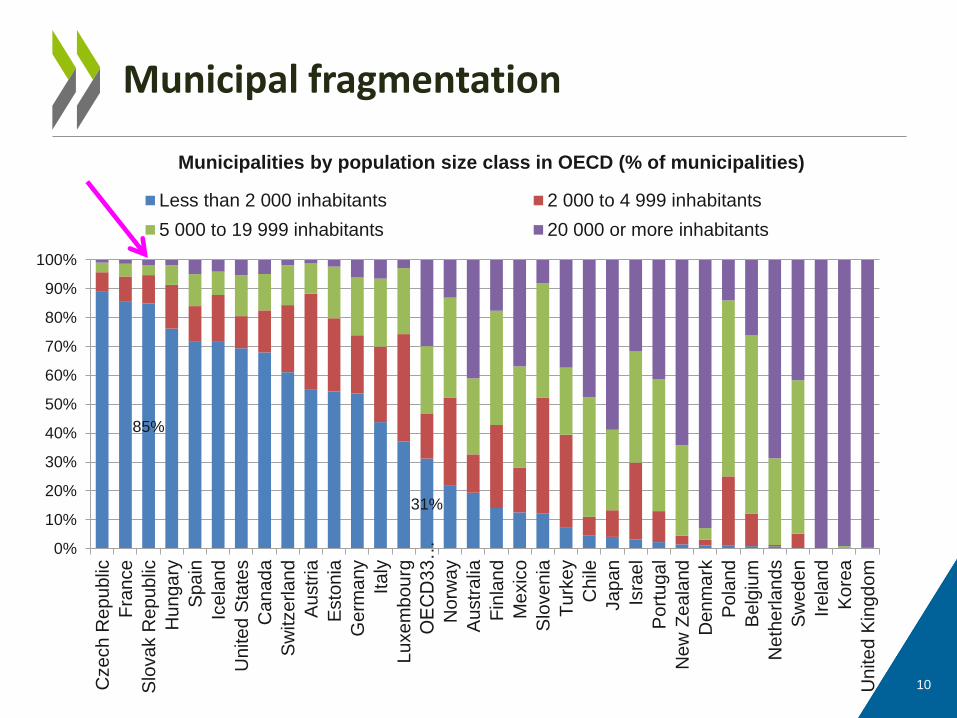
Municipal fragmentation
85%
31%
0%
10%
20%
30%
40%
50%
60%
70%
80%
90%
100%
Czech
Re
pu
blic
Fra
nce
Slo
va
k R
ep
ub
lic
Hu
ng
ary
Spain
Ice
lan
d
Un
ite
d S
tate
s
Ca
na
da
Sw
itze
rla
nd
Au
str
ia
Esto
nia
Ge
rma
ny
Italy
Lu
xe
mb
ou
rg
OECD33…
Norw
ay
Au
str
alia
Fin
lan
d
Mexic
o
Slo
ve
nia
Tu
rke
y
Ch
ile
Ja
pa
n
Isra
el
Po
rtu
ga
l
Ne
w Z
ea
land
De
nm
ark
Po
land
Be
lgiu
m
Ne
the
rla
nd
s
Sw
ed
en
Ire
lan
d
Ko
rea
Un
ite
d K
ing
do
m
Municipalities by population size class in OECD (% of municipalities)
Less than 2 000 inhabitants 2 000 to 4 999 inhabitants
5 000 to 19 999 inhabitants 20 000 or more inhabitants

11
« Upscaling » and/or « transcaling »… Municipal mergers and inter-municipal cooperation
0
1 000
2 000
3 000
4 000
5 000
6 000
Au
stri
a (1
95
0, 2
01
5)
Swed
en
(1
95
2, 1
96
3)
Jap
an (
19
53
, 19
99
)
No
rway
(1
95
7, 1
96
7)
De
nm
ark
(19
70
, 20
07
)
Fin
lan
d (
19
76
, 20
10
)
Be
lgiu
m (
19
75
)
New
Zea
lan
d (
19
89
)
Gre
ece
(1
99
7, 2
01
1)
Turk
ey
(20
08
-20
12
/14
)
Number of municipalities before the reform
Number of municipalities after the reform
Number of municipalities in 2015-2016
9 868
Alternative to municipal
mergers
Efficiency gains
Costs savings
I M C
Better local
services
Staff performance / expertise
Innovation / high tech
Drivers of Inter-municipal co-operation Some examples of mergers policies in the OECD and EU since 1950

12
SNGs are key economic and policy actors across the OECD
29%
45%
38%
10%
55%
20%
12%
Greece
New Zealand
Greece
New Zealand
Chile
Estonia Greece
Denmark
Japan Italy
Denmark
Japan
Japan
Norway
16,1%
37,0%
19,7%
0,5%
25,4%
4,1% 5,2% 0%
10%
20%
30%
40%
50%
60%
70%
80%
90%
100%
Expenditure Staffexpenditure
Publicprocurement*
Currentsocial
expenditure*
Investment Tax revenue Debt**
OECD (unitary countries) Minimum Maximum Slovak Republic% of general government - 2014
*: No data for Chile
**: Debt OECD definition ie including, in addition to "financial debt", insurance reserves and other accounts payable. No data for Chile and New Zealand
13
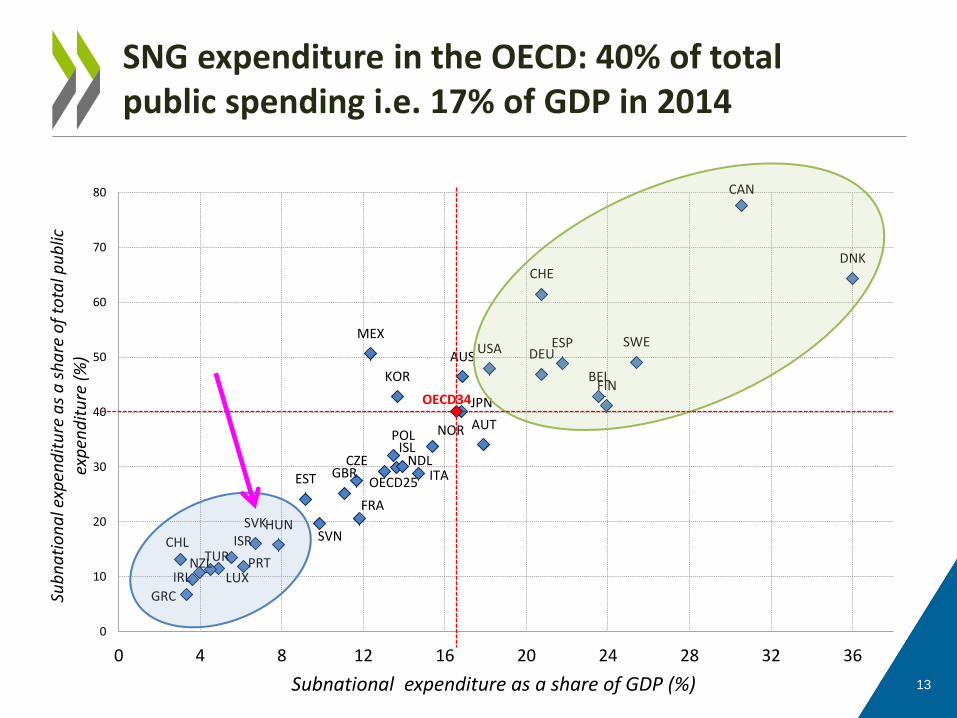
SNG expenditure in the OECD: 40% of total public spending i.e. 17% of GDP in 2014
AUS
AUT
BEL
CAN
CHL
CZE
DNK
EST
FIN
FRA
DEU
GRC
HUN
ISL
IRL
ISR
ITA
JPN
KOR
LUX
MEX
NDL
NZL
NOR POL
PRT
SVK SVN
ESP SWE
CHE
TUR
GBR
USA
OECD34
OECD25
0
10
20
30
40
50
60
70
80
0 4 8 12 16 20 24 28 32 36
Sub
na
tio
na
l exp
end
itu
re a
s a
sh
are
of
tota
l pu
blic
ex
pen
dit
ure
(%
)
Subnational expenditure as a share of GDP (%)
14
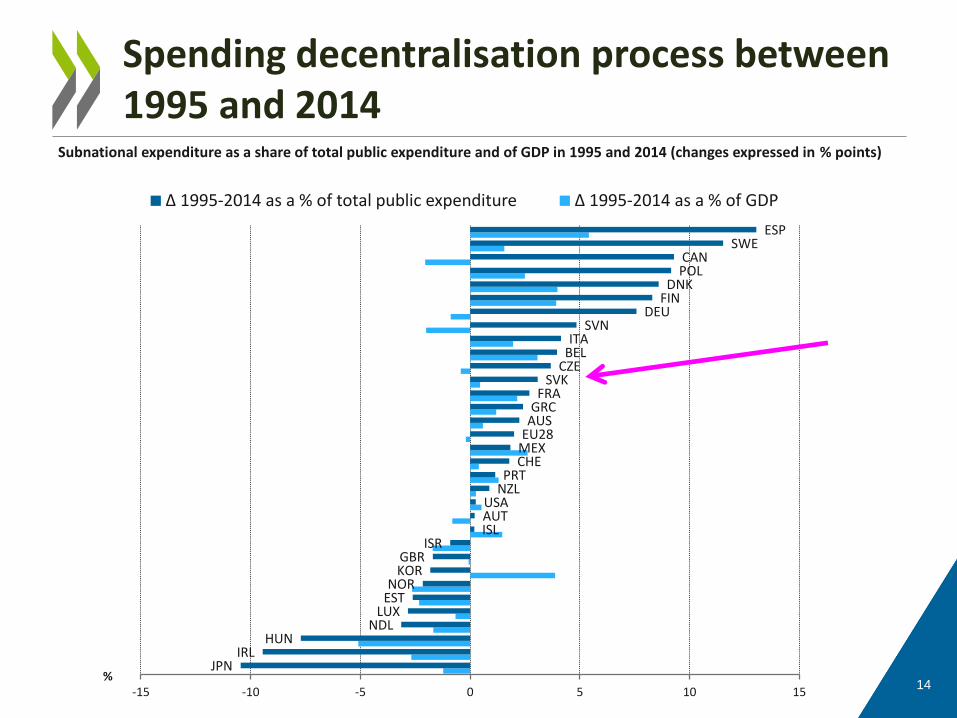
Spending decentralisation process between 1995 and 2014
JPN IRL
HUN NDL
LUX EST NOR
KOR GBR
ISR ISL AUT USA
NZL PRT
CHE MEX EU28 AUS GRC FRA
SVK CZE BEL ITA
SVN DEU
FIN DNK
POL CAN
SWE ESP
-15 -10 -5 0 5 10 15%
∆ 1995-2014 as a % of total public expenditure ∆ 1995-2014 as a % of GDP
Subnational expenditure as a share of total public expenditure and of GDP in 1995 and 2014 (changes expressed in % points)
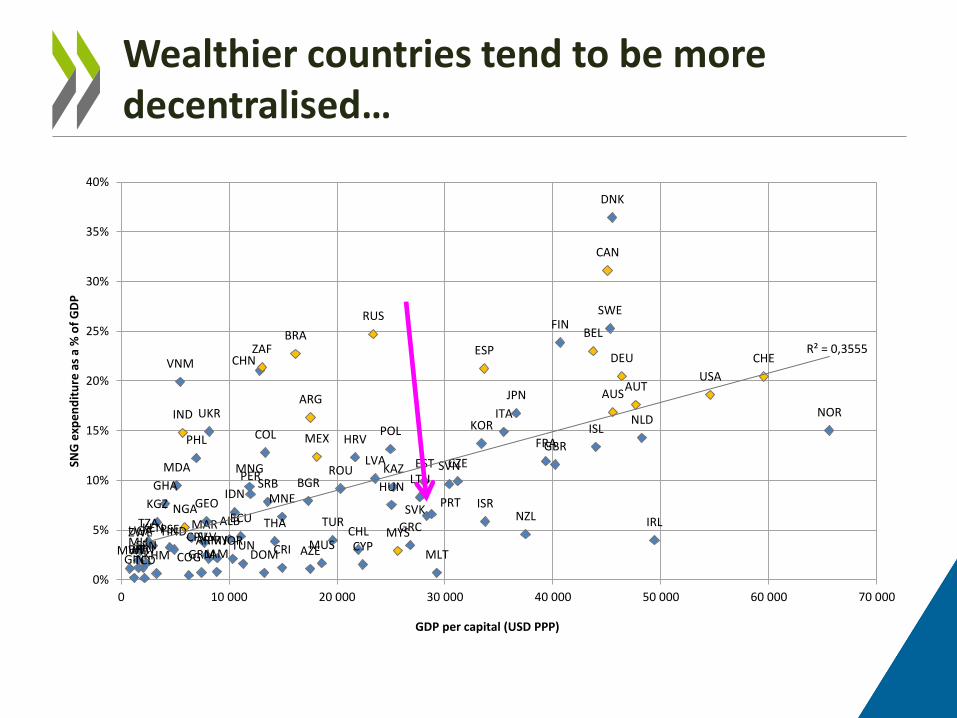
Wealthier countries tend to be more decentralised…
TCD GIN COG KHM MLT GRM DOM JAM AZE BEN MWI BFA CRI CYP TUN SEN MUS MLI JOR ARM PRY SLV ZWE MYS CHL HND UGA PSE KEN GRC MAR TZA THA IRL TUR ALB CPV
ECU NZL NGA KGZ GEO ISR MNE
SVK PRT
IDN HUN GHA SRB BGR LTU PER ROU KAZ MNG MDA SVN EST CZE LVA
GBR FRA PHL HRV MEX COL POL ISL KOR NLD IND ITA UKR NOR
JPN AUS AUT
USA VNM CHE DEU CHN
ESP ZAF BRA BEL
FIN RUS SWE
CAN
DNK
ARG
R² = 0,3555
0%
5%
10%
15%
20%
25%
30%
35%
40%
0 10 000 20 000 30 000 40 000 50 000 60 000 70 000
SNG
exp
en
dit
ure
as
a %
of
GD
P
GDP per capital (USD PPP)
16
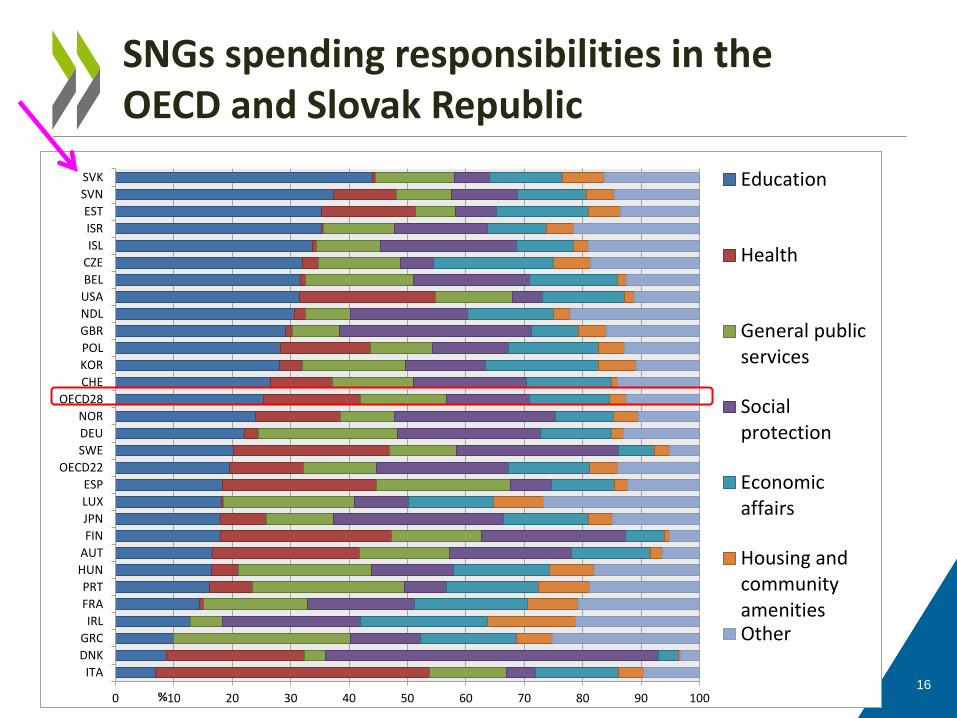
SNGs spending responsibilities in the OECD and Slovak Republic
0 10 20 30 40 50 60 70 80 90 100
ITA
DNK
GRC
IRL
FRA
PRT
HUN
AUT
FIN
JPN
LUX
ESP
OECD22
SWE
DEU
NOR
OECD28
CHE
KOR
POL
GBR
NDL
USA
BEL
CZE
ISL
ISR
EST
SVN
SVK
%
Education
Health
General publicservices
Socialprotection
Economicaffairs
Housing andcommunityamenitiesOther

17
SNGs are major public employers in the OECD
0 20 40 60 80 100
NZLGRC
IRLTURISR
PRTLUX
HUNFRASVNSVKGBRESTITAISL
OECD24CZE
EU28POLAUTKORNORNDL
OECD32MEXDNKFIN
SWEOECD8
USAJPNESP
DEUBELCHECAN
%
Subnational government Central government and social security
Subnational staff expenditure as a share of total public staff expenditure in 2014 (%)
18
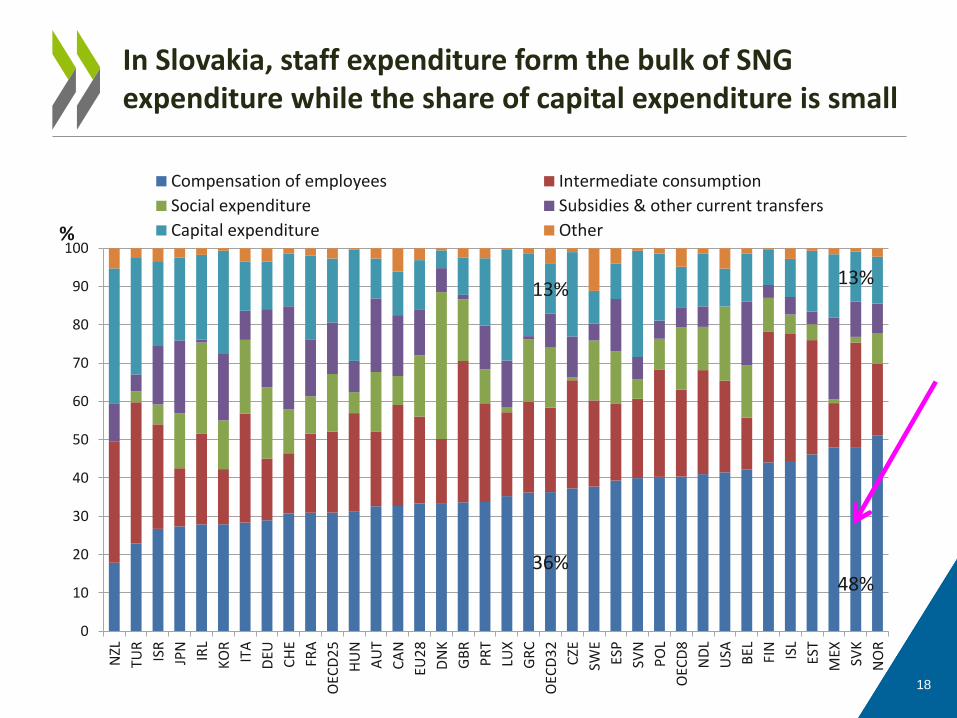
In Slovakia, staff expenditure form the bulk of SNG expenditure while the share of capital expenditure is small
36% 48%
13% 13%
0
10
20
30
40
50
60
70
80
90
100
NZL
TUR
ISR
JPN
IRL
KO
R
ITA
DEU
CH
E
FRA
OEC
D2
5
HU
N
AU
T
CA
N
EU2
8
DN
K
GB
R
PR
T
LUX
GR
C
OEC
D3
2
CZE
SWE
ESP
SVN
PO
L
OEC
D8
ND
L
USA BEL FIN ISL
EST
MEX
SVK
NO
R
%
Compensation of employees Intermediate consumption
Social expenditure Subsidies & other current transfers
Capital expenditure Other
19
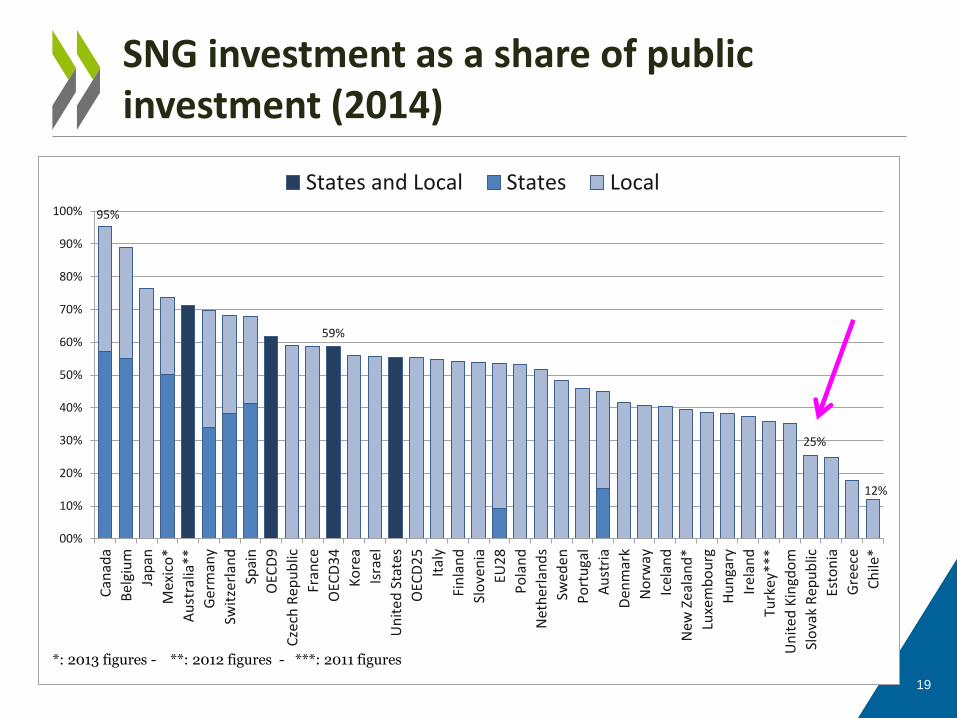
SNG investment as a share of public investment (2014)
59%
95%
25%
12%
00%
10%
20%
30%
40%
50%
60%
70%
80%
90%
100%
Can
ada
Bel
giu
m
Jap
an
Mex
ico
*
Au
stra
lia**
Ger
man
y
Swit
zerl
and
Spai
n
OEC
D9
Cze
ch R
epu
blic
Fran
ce
OEC
D3
4
Ko
rea
Isra
el
Un
ited
Sta
tes
OEC
D2
5
Ital
y
Fin
lan
d
Slo
ven
ia
EU2
8
Po
lan
d
Net
her
lan
ds
Swed
en
Po
rtu
gal
Au
stri
a
Den
mar
k
No
rway
Icel
and
New
Ze
alan
d*
Luxe
mb
ou
rg
Hu
nga
ry
Irel
and
Turk
ey**
*
Un
ited
Kin
gdo
m
Slo
vak
Rep
ub
lic
Esto
nia
Gre
ece
Ch
ile*
States and Local States Local
*: 2013 figures - **: 2012 figures - ***: 2011 figures

20
Economic affairs, education and housing/communities amenities are the main areas of subnational investment
19
39 22
29
09
18
0 10 20 30 40 50 60 70 80 90 100
SWEHUNDNKLUXSVKSVNNORCHEBEL
DEUITA
FRAEU28GBR
OECD27 UWAISR
OECD21OECD27 WA
ISLOECD6
ESPEST
AUTUSA
IRLPRTJPNGRC
%
Economic affairs General services Education Housing and community amenities Environmental protection Other
Breakdown of SNG investment by economic function (% of total SNG investment, 2013)

21
What are the sources of SNG revenues? Tax revenues account for 44% of SNG revenue in the OECD
11%
37%
44%
47%
70%
50%
37%
31%
18%
10%
15%
18%
0% 10% 20% 30% 40% 50% 60% 70% 80% 90% 100%
MexicoNetherlands
AustriaSlovak Republic
TurkeyUnited Kingdom
BelgiumIreland
HungaryGreece
LuxembourgKorea
PolandDenmarkPortugal
OECD24 (unitary)AustraliaNorway
SpainIsraelEU28
SloveniaOECD33
ItalyJapan
EstoniaFinland
ChileOECD9 (federal)
FranceCzech Republic
CanadaUnited StatesNew-Zealand
SwitzerlandSweden
GermanyIceland
Taxes Grants & subsidies Tariffs & fees Property income Social contributions

22
Subnational government tax revenue as a % of public tax revenue and as a % of GDP, 2014
AUS
AUT
BEL
CAN
DEU
MEX
ESP
CHE
USA
OECD9
CHL
CZE DNK
EST
FIN
FRA
GRC
HUN
ISL
IRL
ISR
ITA
JPN
KOR
LUX
NDL NZL
NOR
POL
PRT
SVK
SVN
SWE
TUR
GBR
OECD25
OECD34
0
10
20
30
40
50
60
0 2 4 6 8 10 12 14 16
SN
G t
ax
re
ve
nu
e a
s a
% o
f p
ub
lic
ta
x
re
ve
nu
e
SNG tax revenue as a % of GDP

23
Subnational government debt as a % of GDP and of public debt, 2014
AUS
AUT BEL
CAN
DEU
ESP
CHE
USA
OECD8
CZE
DNK
EST
FIN
FRA
GRC HUN
ISL
IRL ISR
ITA
JPN
KOR LUX
NDL
NOR
POL
PRT SVK SVN
SWE
TUR
GBR
OECD24
OECD32
0
10
20
30
40
50
60
0 10 20 30 40 50 60
Sub
nat
ion
al g
ove
rnm
en
t d
eb
t as
a %
of
pu
blic
de
bt
Subnational government debt as a % of GDP
