sustainability supplement 2013 –14 - forestry corporation · forestry corporation of nsw...
TRANSCRIPT
1
FORE
STRY
CO
RPO
RATI
ON
OF N
SW S
USTA
INAB
ILITY
SUP
PLEM
ENT
201
3 –
14
Indicator 1 – Social responsibility 2
Indicator 2 – Recreation and tourism 3
Indicator 3a – Research and education 4
Indicator 3b – Number of people participating in programs through Cumberland State Forest 4
Indicator 4 – Other forest products 5
Indicator 5 – Training 6
Indicator 6 – Management of cultural heritage 7
Indicator 7 – Extent of forest and tenure type 8
Indicator 8 – Native forest structure 10
Indicator 9 – Sightings of surveyed species 11
Indicator 10 – Estimated expenditure on pest animal and weed control 12
Indicator 11 – Plantation health 13
Indicator 12 – Fire fighting and prevention 15
Indicator 13 – Soil and water management 16
Indicator 14 – Regulatory compliance 17
Indicator 15a – Carbon sequestration in softwood planted forests 18
Indicator 15b - Carbon balance in hardwood forests 18
Indicator 16a – Energy consumption 19
Indicator 16b – Fleet 19
Indicator 17 – Volume of timber harvested 20
Indicator 18 – Forest management intent 21
Indicator 19a – Plantation harvesting, establishment and survival 22
Indicator 19b – Nursery production 22
Indicator 20 – Mean annual growth and stocking in planted forests 23
Indicator 21 – Hardwood and cypress forest harvest and regeneration 24
Indicator 22 – Committed timber harvested 25
Indicator 23 – Financial performance 26
Indicator 24 – Forest certification 27
Contents
Sustainability Supplement2013 –14This is a supplement to Forestry Corporation of NSW’s Annual Report and Business Sustainability Framework.
Forestry Corporation has a number of reporting obligations to satisfy organisational, state, national and international requirements for sustainable forest management. These are supported by the corporation’s Social Economic and Environment Database System.
Our forest-focused sustainability reporting is based on the international Montreal Process Criteria and Indicators, which were agreed at the state, national and international level in 1998 and reviewed in 2008.
2
FORE
STRY
CO
RPO
RATI
ON
OF N
SW S
USTA
INAB
ILITY
SUP
PLEM
ENT
201
3 –
14
Indicator 1 – Social responsibility
Year ended 30 June 2012 2013 2014
Sponsorships and donations $35 900 $16 500 $40 100
Our community
Kendall National Violin Competition and the Hello Koala sculpture exhibition on the mid north coast were the recipients of the largest sponsorship contributions during 2013–14. In total, around $30 000 was provided to local community events and initiatives and close to $7000 was invested in supporting industry events and conferences.
Community volunteering programsMajor volunteer programs included the Cumberland and Strickland State Forest bush regeneration programs and the Communities in Forests Program with Conservation Volunteers Australia (CVA).
During the year (between October 2013 and July 2014), CVA volunteers removed 1250 square metres of exotic weeds from native habitats to improve biodiversity values, repaired walking tracks to protect sensitive habitats and planted 3230 native trees, shrubs and grasses to restore habitat for native species over an area of 6100 square metres.
Volunteers committed a total 405 working days through the Cumberland and Strickland State Forest volunteer programs. Volunteers removed an estimated 10 tonnes of weeds from Cumberland State Forest, completed a new walking trail in Strickland State Forest and continued to digitise and catalogue Forestry Corporation’s historic photographic collection.
Back to contents
3
FORE
STRY
CO
RPO
RATI
ON
OF N
SW S
USTA
INAB
ILITY
SUP
PLEM
ENT
201
3 –
14
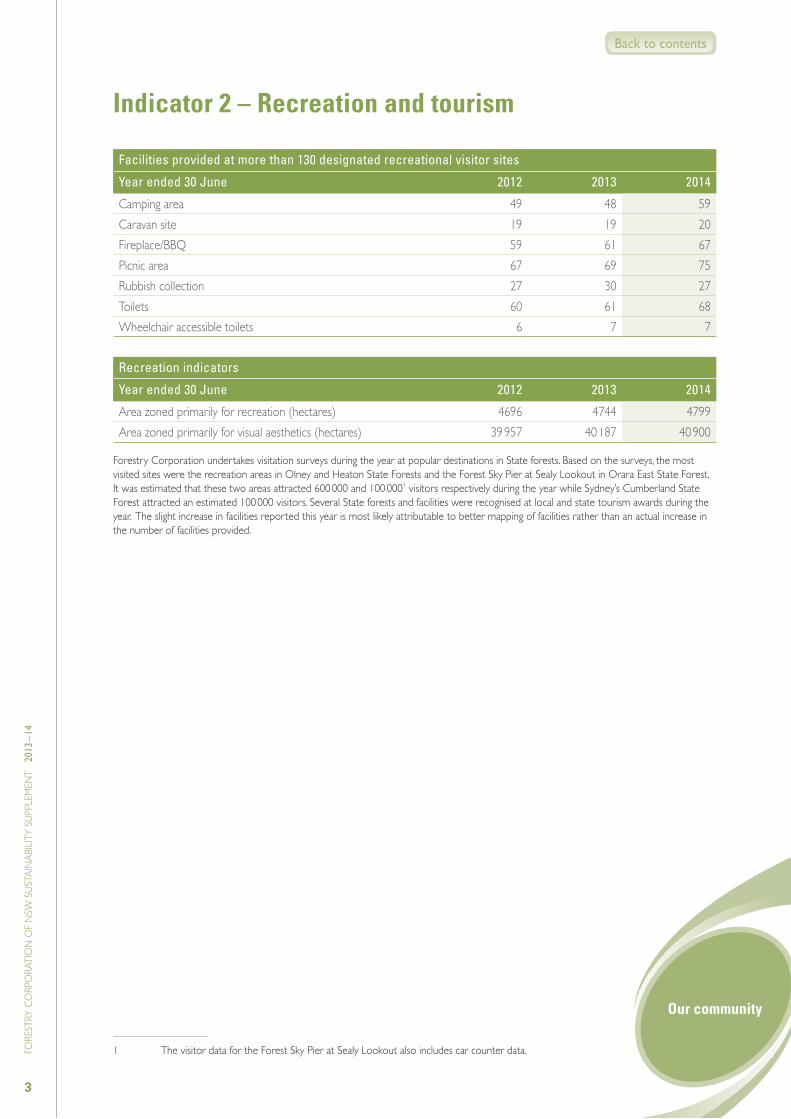
Facilities provided at more than 130 designated recreational visitor sites
Year ended 30 June 2012 2013 2014
Camping area 49 48 59Caravan site 19 19 20Fireplace/BBQ 59 61 67Picnic area 67 69 75Rubbish collection 27 30 27Toilets 60 61 68Wheelchair accessible toilets 6 7 7
Recreation indicators
Year ended 30 June 2012 2013 2014
Area zoned primarily for recreation (hectares) 4696 4744 4799Area zoned primarily for visual aesthetics (hectares) 39 957 40 187 40 900
Forestry Corporation undertakes visitation surveys during the year at popular destinations in State forests. Based on the surveys, the most visited sites were the recreation areas in Olney and Heaton State Forests and the Forest Sky Pier at Sealy Lookout in Orara East State Forest. It was estimated that these two areas attracted 600 000 and 100 0001 visitors respectively during the year while Sydney’s Cumberland State Forest attracted an estimated 100 000 visitors. Several State forests and facilities were recognised at local and state tourism awards during the year. The slight increase in facilities reported this year is most likely attributable to better mapping of facilities rather than an actual increase in the number of facilities provided.
1 The visitor data for the Forest Sky Pier at Sealy Lookout also includes car counter data.
Indicator 2 – Recreation and tourism
Our community
Back to contents
4
FORE
STRY
CO
RPO
RATI
ON
OF N
SW S
USTA
INAB
ILITY
SUP
PLEM
ENT
201
3 –
14
The NSW Department of Primary Industries (DPI) Forest Science group provides technical advice, research and development services to Forestry Corporation under a Memorandum of Understanding. This group has scientific and technical expertise in forest ecology and sustainability, forest health and resource assessment, carbon in forests, wood products and bioenergy, and biometrical services. Information about recent research activities is included in Forestry Corporation’s Annual Report.
Forestry Corporation is an active member of the Australian Forest Education Alliance, a network of forestry industry partners from across Australia that runs the ForestLearning education program. Through ForestLearning, Forestry Corporation contributes to the development and provision of curriculum–aligned education resources for teachers using forestry and forest and wood products as a pathway for meeting education outcomes for students. Work began this year on mapping existing education resources to the Australian Curriculum, developing new resources where required and building a new website to improve teacher access to resources.
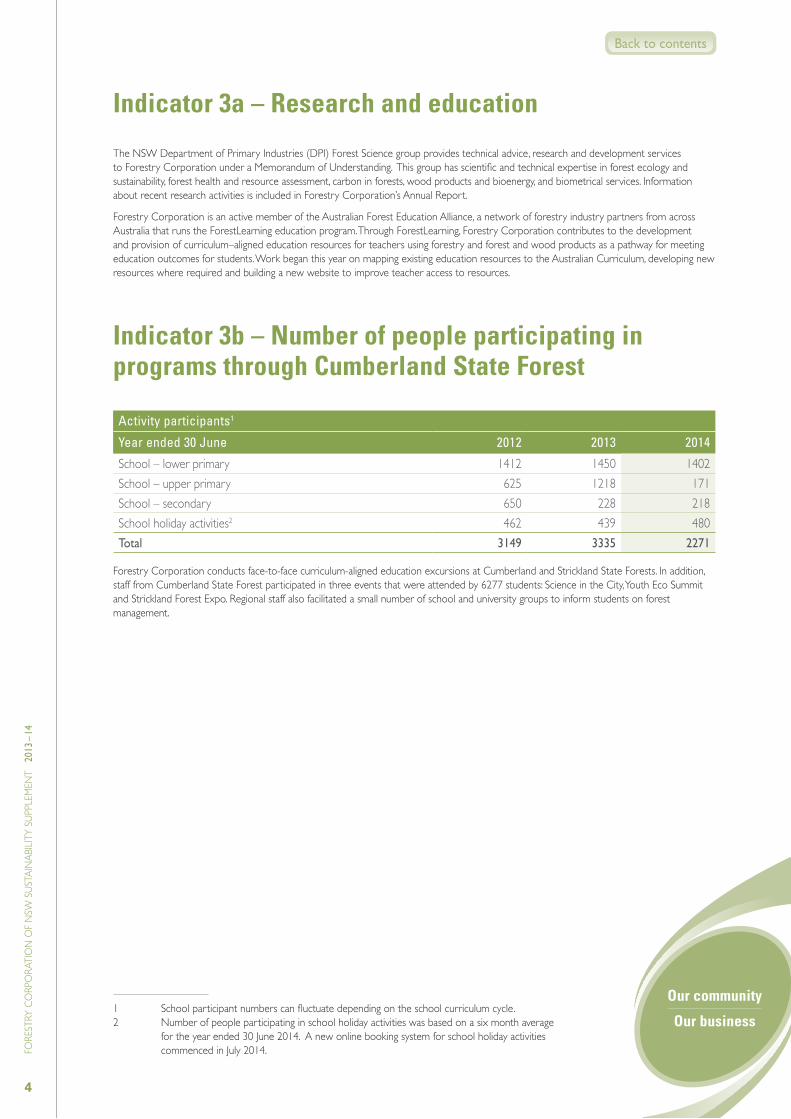
Indicator 3b – Number of people participating in programs through Cumberland State Forest
Activity participants1
Year ended 30 June 2012 2013 2014
School – lower primary 1412 1450 1402School – upper primary 625 1218 171School – secondary 650 228 218School holiday activities2 462 439 480Total 3149 3335 2271
Forestry Corporation conducts face-to-face curriculum-aligned education excursions at Cumberland and Strickland State Forests. In addition, staff from Cumberland State Forest participated in three events that were attended by 6277 students: Science in the City, Youth Eco Summit and Strickland Forest Expo. Regional staff also facilitated a small number of school and university groups to inform students on forest management.
1 School participant numbers can fluctuate depending on the school curriculum cycle.2 Number of people participating in school holiday activities was based on a six month average
for the year ended 30 June 2014. A new online booking system for school holiday activities commenced in July 2014.
Indicator 3a – Research and education
Our community
Our business
Back to contents
5
FORE
STRY
CO
RPO
RATI
ON
OF N
SW S
USTA
INAB
ILITY
SUP
PLEM
ENT
201
3 –
14
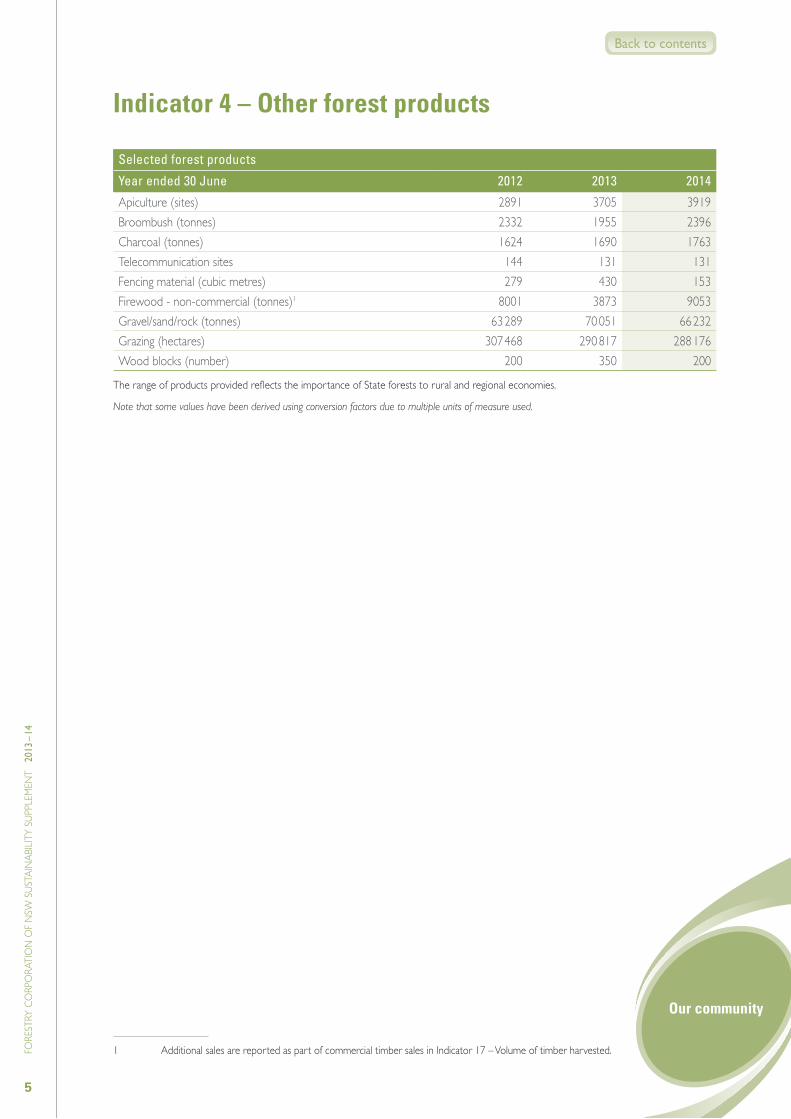
Selected forest products
Year ended 30 June 2012 2013 2014
Apiculture (sites) 2891 3705 3919Broombush (tonnes) 2332 1955 2396Charcoal (tonnes) 1624 1690 1763Telecommunication sites 144 131 131Fencing material (cubic metres) 279 430 153Firewood - non-commercial (tonnes)1 8001 3873 9053Gravel/sand/rock (tonnes) 63 289 70 051 66 232Grazing (hectares) 307 468 290 817 288 176Wood blocks (number) 200 350 200
The range of products provided reflects the importance of State forests to rural and regional economies.
Note that some values have been derived using conversion factors due to multiple units of measure used.
1 Additional sales are reported as part of commercial timber sales in Indicator 17 – Volume of timber harvested.
Indicator 4 – Other forest products
Our community
Back to contents

6
FORE
STRY
CO
RPO
RATI
ON
OF N
SW S
USTA
INAB
ILITY
SUP
PLEM
ENT
201
3 –
14
Indicator 5 – Training
Training categories
Year ended 30 June 2012 2013 2014
Assessors 3 36 16Business skills 38 10 48Computer skills 9 1 0Environmental and cultural 61 61 30Fire medical and fitness 329 129 132Fire resources protection 233 129 53Forest management 16 8 17Health and safety awareness 37 134 35Health and safety compliance 351 237 232Legal and administration 0 20 0Management and leadership 13 0 28Miscellaneous 0 0 6Plant and animal management 0 2 6Plant and machinery skills 38 32 112Safe driving and licensing 503 264 175Technical skills 224 149 70Tertiary and trade certificates 8 0 0Workshops 7 0 1Total 1870 1212 961
Our staff
Back to contents
7
FORE
STRY
CO
RPO
RATI
ON
OF N
SW S
USTA
INAB
ILITY
SUP
PLEM
ENT
201
3 –
14
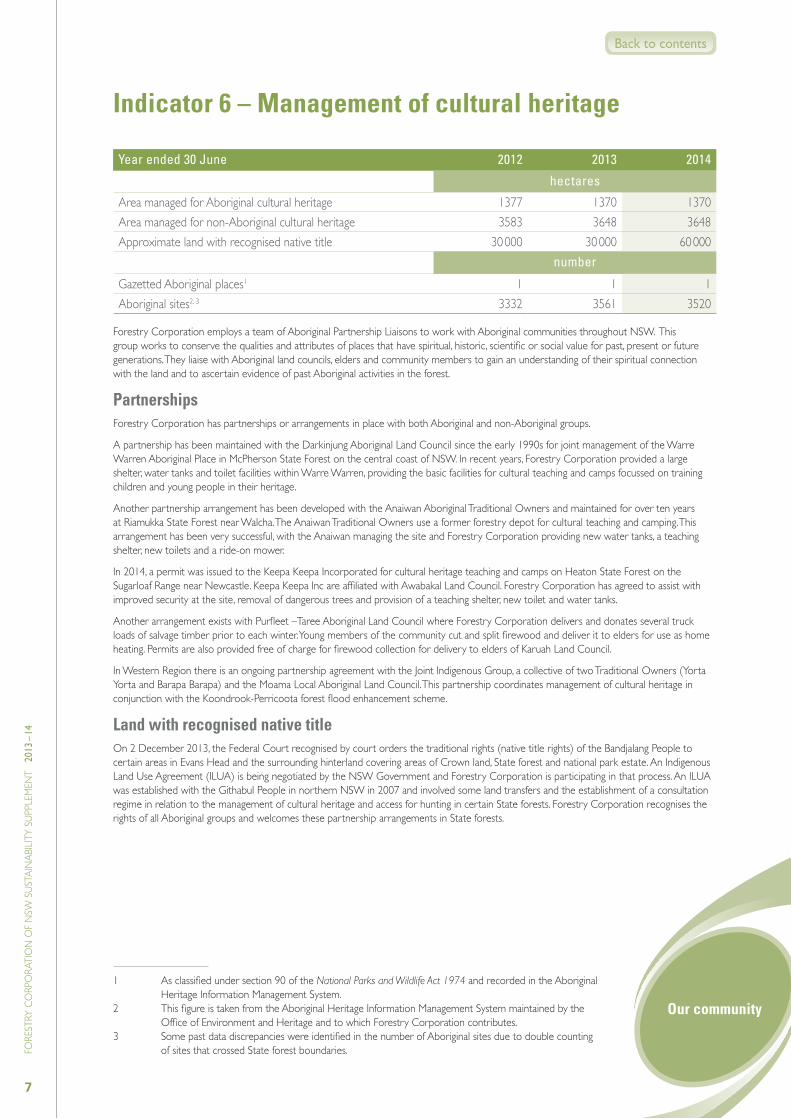
Year ended 30 June 2012 2013 2014
hectares
Area managed for Aboriginal cultural heritage 1377 1370 1370Area managed for non-Aboriginal cultural heritage 3583 3648 3648Approximate land with recognised native title 30 000 30 000 60 000
number
Gazetted Aboriginal places1 1 1 1Aboriginal sites2, 3 3332 3561 3520
Forestry Corporation employs a team of Aboriginal Partnership Liaisons to work with Aboriginal communities throughout NSW. This group works to conserve the qualities and attributes of places that have spiritual, historic, scientific or social value for past, present or future generations. They liaise with Aboriginal land councils, elders and community members to gain an understanding of their spiritual connection with the land and to ascertain evidence of past Aboriginal activities in the forest.
PartnershipsForestry Corporation has partnerships or arrangements in place with both Aboriginal and non-Aboriginal groups.
A partnership has been maintained with the Darkinjung Aboriginal Land Council since the early 1990s for joint management of the Warre Warren Aboriginal Place in McPherson State Forest on the central coast of NSW. In recent years, Forestry Corporation provided a large shelter, water tanks and toilet facilities within Warre Warren, providing the basic facilities for cultural teaching and camps focussed on training children and young people in their heritage.
Another partnership arrangement has been developed with the Anaiwan Aboriginal Traditional Owners and maintained for over ten years at Riamukka State Forest near Walcha. The Anaiwan Traditional Owners use a former forestry depot for cultural teaching and camping. This arrangement has been very successful, with the Anaiwan managing the site and Forestry Corporation providing new water tanks, a teaching shelter, new toilets and a ride-on mower.
In 2014, a permit was issued to the Keepa Keepa Incorporated for cultural heritage teaching and camps on Heaton State Forest on the Sugarloaf Range near Newcastle. Keepa Keepa Inc are affiliated with Awabakal Land Council. Forestry Corporation has agreed to assist with improved security at the site, removal of dangerous trees and provision of a teaching shelter, new toilet and water tanks.
Another arrangement exists with Purfleet –Taree Aboriginal Land Council where Forestry Corporation delivers and donates several truck loads of salvage timber prior to each winter. Young members of the community cut and split firewood and deliver it to elders for use as home heating. Permits are also provided free of charge for firewood collection for delivery to elders of Karuah Land Council.
In Western Region there is an ongoing partnership agreement with the Joint Indigenous Group, a collective of two Traditional Owners (Yorta Yorta and Barapa Barapa) and the Moama Local Aboriginal Land Council. This partnership coordinates management of cultural heritage in conjunction with the Koondrook-Perricoota forest flood enhancement scheme.
Land with recognised native titleOn 2 December 2013, the Federal Court recognised by court orders the traditional rights (native title rights) of the Bandjalang People to certain areas in Evans Head and the surrounding hinterland covering areas of Crown land, State forest and national park estate. An Indigenous Land Use Agreement (ILUA) is being negotiated by the NSW Government and Forestry Corporation is participating in that process. An ILUA was established with the Githabul People in northern NSW in 2007 and involved some land transfers and the establishment of a consultation regime in relation to the management of cultural heritage and access for hunting in certain State forests. Forestry Corporation recognises the rights of all Aboriginal groups and welcomes these partnership arrangements in State forests.
1 As classified under section 90 of the National Parks and Wildlife Act 1974 and recorded in the Aboriginal Heritage Information Management System.
2 This figure is taken from the Aboriginal Heritage Information Management System maintained by the Office of Environment and Heritage and to which Forestry Corporation contributes.
3 Some past data discrepancies were identified in the number of Aboriginal sites due to double counting of sites that crossed State forest boundaries.
Indicator 6 – Management of cultural heritage
Our community
Back to contents
8
FORE
STRY
CO
RPO
RATI
ON
OF N
SW S
USTA
INAB
ILITY
SUP
PLEM
ENT
201
3 –
14
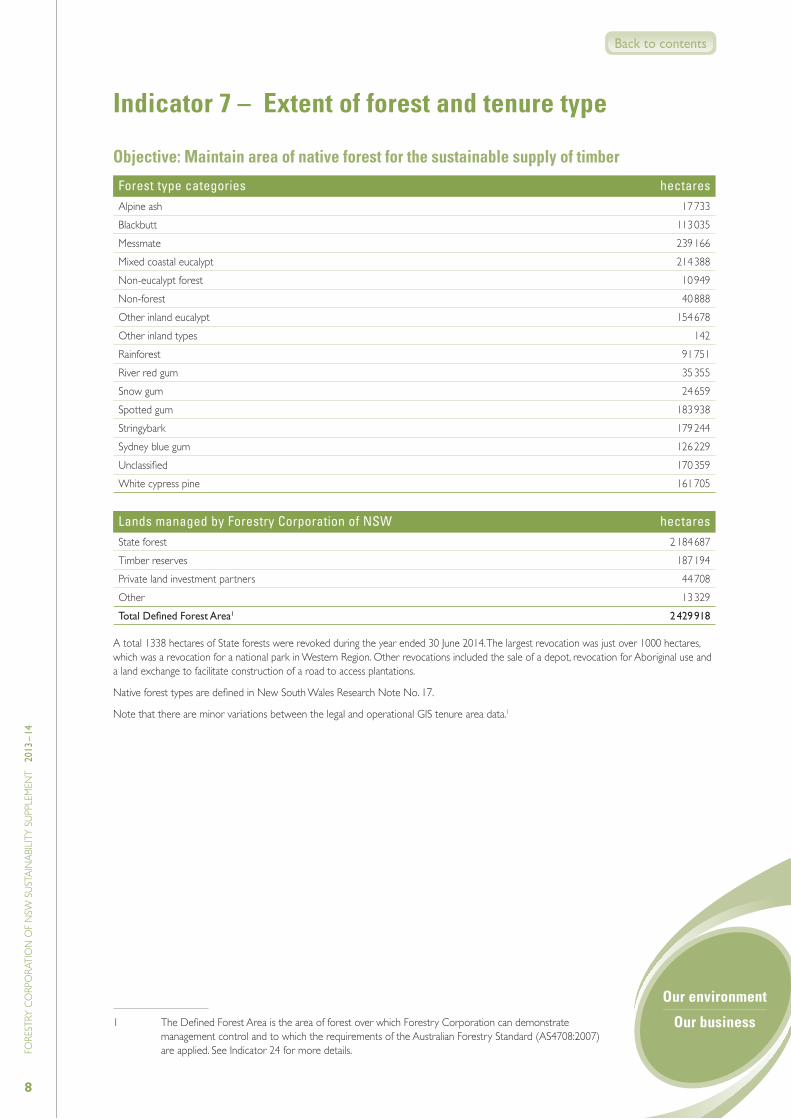
Indicator 7 – Extent of forest and tenure type
Objective: Maintain area of native forest for the sustainable supply of timber
Forest type categories hectaresAlpine ash 17 733Blackbutt 113 035Messmate 239 166Mixed coastal eucalypt 214 388Non-eucalypt forest 10 949Non-forest 40 888Other inland eucalypt 154 678Other inland types 142Rainforest 91 751River red gum 35 355Snow gum 24 659Spotted gum 183 938Stringybark 179 244Sydney blue gum 126 229Unclassified 170 359White cypress pine 161 705
Lands managed by Forestry Corporation of NSW hectaresState forest 2 184 687Timber reserves 187 194Private land investment partners 44 708Other 13 329Total Defined Forest Area1 2 429 918
A total 1338 hectares of State forests were revoked during the year ended 30 June 2014. The largest revocation was just over 1000 hectares, which was a revocation for a national park in Western Region. Other revocations included the sale of a depot, revocation for Aboriginal use and a land exchange to facilitate construction of a road to access plantations.
Native forest types are defined in New South Wales Research Note No. 17.
Note that there are minor variations between the legal and operational GIS tenure area data.1
1 The Defined Forest Area is the area of forest over which Forestry Corporation can demonstrate management control and to which the requirements of the Australian Forestry Standard (AS4708:2007) are applied. See Indicator 24 for more details.
Our environment
Our business
Back to contents
9
FORE
STRY
CO
RPO
RATI
ON
OF N
SW S
USTA
INAB
ILITY
SUP
PLEM
ENT
201
3 –
14
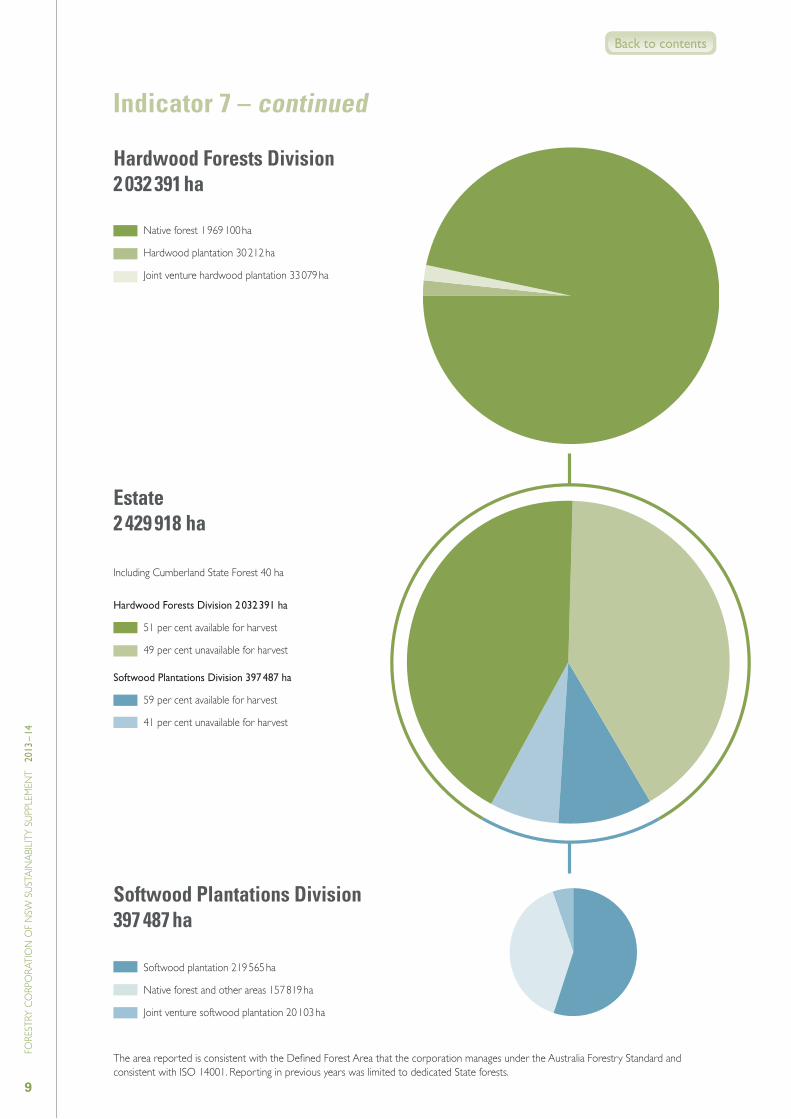
Indicator 7 – continued
Including Cumberland State Forest 40 ha
Estate 2 429 918 ha
Hardwood Forests Division 2 032 391 ha
51 per cent available for harvest
49 per cent unavailable for harvest
Softwood Plantations Division 397 487 ha
59 per cent available for harvest
41 per cent unavailable for harvest
Native forest 1 969 100 ha
Hardwood plantation 30 212 ha
Joint venture hardwood plantation 33 079 ha
Hardwood Forests Division 2 032 391 ha
Softwood plantation 219 565 ha
Native forest and other areas 157 819 ha
Joint venture softwood plantation 20 103 ha
Softwood Plantations Division 397 487 ha
The area reported is consistent with the Defined Forest Area that the corporation manages under the Australia Forestry Standard and consistent with ISO 14001. Reporting in previous years was limited to dedicated State forests.
Back to contents
10
FORE
STRY
CO
RPO
RATI
ON
OF N
SW S
USTA
INAB
ILITY
SUP
PLEM
ENT
201
3 –
14
Forest structure refers to the physical features of a forest that reflect its natural environment and management history. Largely determined by forest type, age and past disturbance such as timber harvesting and fire, forest structure is an important consideration when planning future management, including harvesting, of forests. The structure of the forest is reflected in the proportion of trees of different age and size over a given area.
Because the areas of forest growth stage categories do not change significantly over short periods, growth stages are not reported annually. Refer to the 2010 and 2013 Australian Government State of the Forests reports for additional growth stage information.
The sustainable wood supply modelling, which is represented in indicator 22, demonstrates that the forest estate is capable of providing for an ongoing sustainable yield at the current rate of production. This provides an indication that forest structure also relatively stable in producing this yield from a set area.
Indicator 8 – Native forest structure
Our environment
Our business
Back to contents
11
FORE
STRY
CO
RPO
RATI
ON
OF N
SW S
USTA
INAB
ILITY
SUP
PLEM
ENT
201
3 –
14
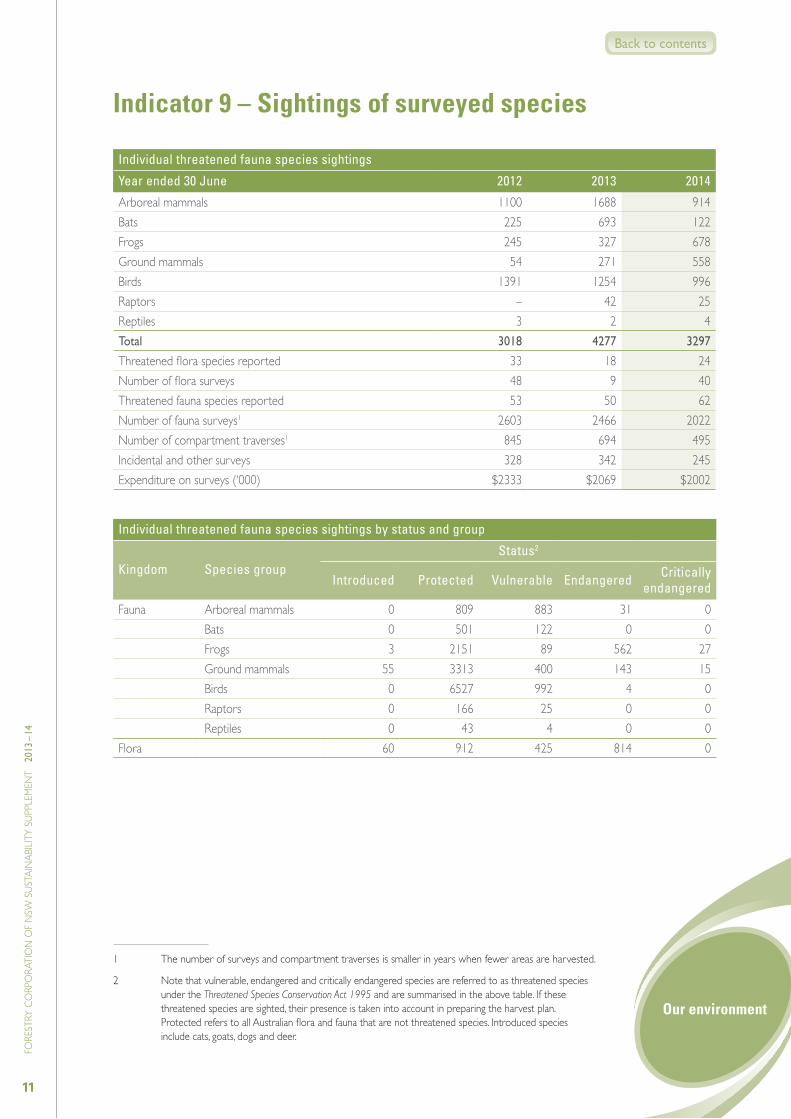
Individual threatened fauna species sightings
Year ended 30 June 2012 2013 2014
Arboreal mammals 1100 1688 914Bats 225 693 122Frogs 245 327 678Ground mammals 54 271 558Birds 1391 1254 996Raptors – 42 25Reptiles 3 2 4Total 3018 4277 3297
Threatened flora species reported 33 18 24Number of flora surveys 48 9 40Threatened fauna species reported 53 50 62Number of fauna surveys1 2603 2466 2022Number of compartment traverses1 845 694 495Incidental and other surveys 328 342 245Expenditure on surveys (‘000) $2333 $2069 $2002
Individual threatened fauna species sightings by status and group
Kingdom Species groupStatus2
Introduced Protected Vulnerable Endangered Critically endangered
Fauna Arboreal mammals 0 809 883 31 0Bats 0 501 122 0 0Frogs 3 2151 89 562 27Ground mammals 55 3313 400 143 15Birds 0 6527 992 4 0Raptors 0 166 25 0 0Reptiles 0 43 4 0 0
Flora 60 912 425 814 0
1 The number of surveys and compartment traverses is smaller in years when fewer areas are harvested.
2 Note that vulnerable, endangered and critically endangered species are referred to as threatened species under the Threatened Species Conservation Act 1995 and are summarised in the above table. If these threatened species are sighted, their presence is taken into account in preparing the harvest plan. Protected refers to all Australian flora and fauna that are not threatened species. Introduced species include cats, goats, dogs and deer.
Indicator 9 – Sightings of surveyed species
Our environment
Back to contents
12
FORE
STRY
CO
RPO
RATI
ON
OF N
SW S
USTA
INAB
ILITY
SUP
PLEM
ENT
201
3 –
14
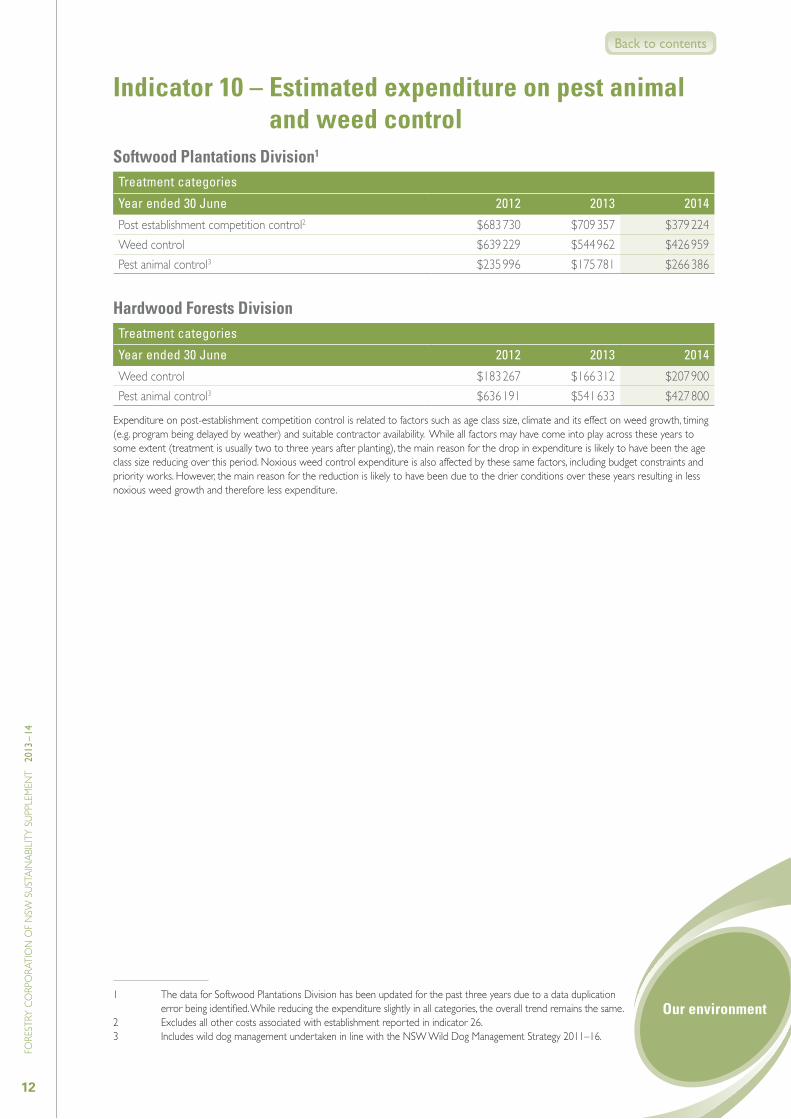
Softwood Plantations Division1
Treatment categories
Year ended 30 June 2012 2013 2014
Post establishment competition control2 $683 730 $709 357 $379 224Weed control $639 229 $544 962 $426 959Pest animal control3 $235 996 $175 781 $266 386
Hardwood Forests DivisionTreatment categories
Year ended 30 June 2012 2013 2014
Weed control $183 267 $166 312 $207 900Pest animal control3 $636 191 $541 633 $427 800
Expenditure on post-establishment competition control is related to factors such as age class size, climate and its effect on weed growth, timing (e.g. program being delayed by weather) and suitable contractor availability. While all factors may have come into play across these years to some extent (treatment is usually two to three years after planting), the main reason for the drop in expenditure is likely to have been the age class size reducing over this period. Noxious weed control expenditure is also affected by these same factors, including budget constraints and priority works. However, the main reason for the reduction is likely to have been due to the drier conditions over these years resulting in less noxious weed growth and therefore less expenditure.
1 The data for Softwood Plantations Division has been updated for the past three years due to a data duplication error being identified. While reducing the expenditure slightly in all categories, the overall trend remains the same.
2 Excludes all other costs associated with establishment reported in indicator 26.3 Includes wild dog management undertaken in line with the NSW Wild Dog Management Strategy 2011–16.
Indicator 10 – Estimated expenditure on pest animal and weed control
Our environment
Back to contents
13
FORE
STRY
CO
RPO
RATI
ON
OF N
SW S
USTA
INAB
ILITY
SUP
PLEM
ENT
201
3 –
14
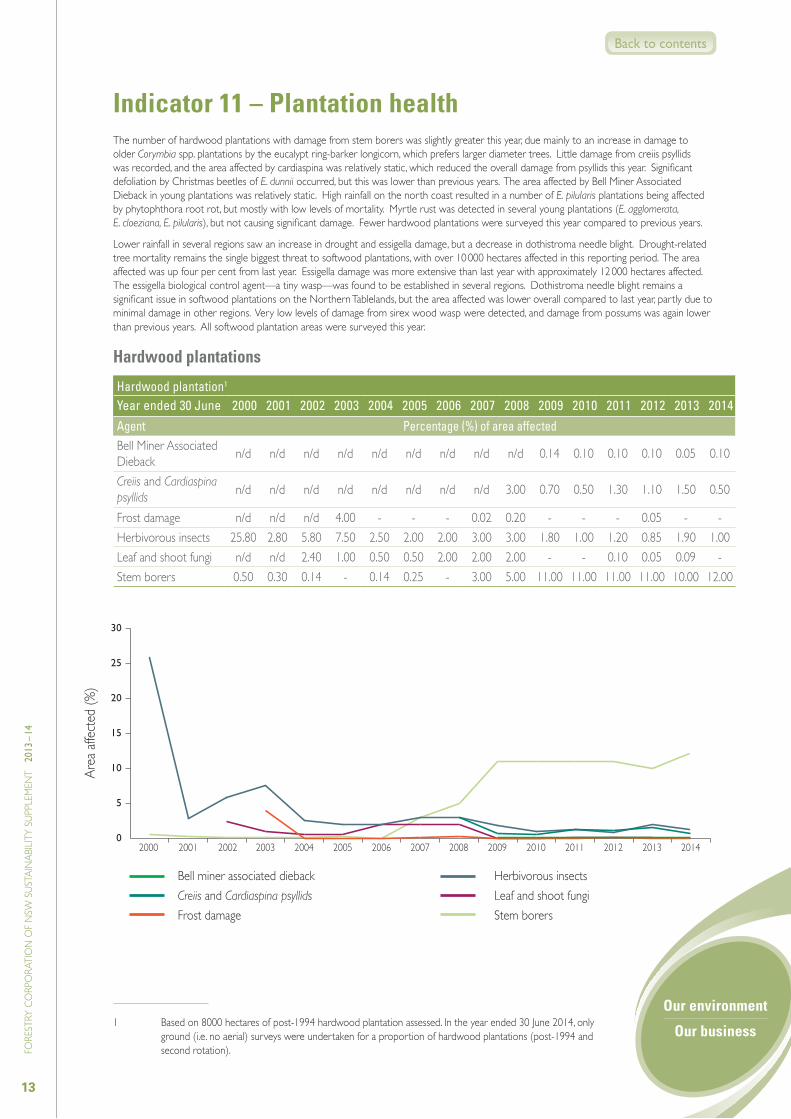
The number of hardwood plantations with damage from stem borers was slightly greater this year, due mainly to an increase in damage to older Corymbia spp. plantations by the eucalypt ring-barker longicorn, which prefers larger diameter trees. Little damage from creiis psyllids was recorded, and the area affected by cardiaspina was relatively static, which reduced the overall damage from psyllids this year. Significant defoliation by Christmas beetles of E. dunnii occurred, but this was lower than previous years. The area affected by Bell Miner Associated Dieback in young plantations was relatively static. High rainfall on the north coast resulted in a number of E. pilularis plantations being affected by phytophthora root rot, but mostly with low levels of mortality. Myrtle rust was detected in several young plantations (E. agglomerata, E. cloeziana, E. pilularis), but not causing significant damage. Fewer hardwood plantations were surveyed this year compared to previous years.
Lower rainfall in several regions saw an increase in drought and essigella damage, but a decrease in dothistroma needle blight. Drought-related tree mortality remains the single biggest threat to softwood plantations, with over 10 000 hectares affected in this reporting period. The area affected was up four per cent from last year. Essigella damage was more extensive than last year with approximately 12 000 hectares affected. The essigella biological control agent—a tiny wasp—was found to be established in several regions. Dothistroma needle blight remains a significant issue in softwood plantations on the Northern Tablelands, but the area affected was lower overall compared to last year, partly due to minimal damage in other regions. Very low levels of damage from sirex wood wasp were detected, and damage from possums was again lower than previous years. All softwood plantation areas were surveyed this year.
Hardwood plantations
Hardwood plantation1
Year ended 30 June 2000 2001 2002 2003 2004 2005 2006 2007 2008 2009 2010 2011 2012 2013 2014
Agent Percentage (%) of area affectedBell Miner Associated Dieback n/d n/d n/d n/d n/d n/d n/d n/d n/d 0.14 0.10 0.10 0.10 0.05 0.10
Creiis and Cardiaspina psyllids
n/d n/d n/d n/d n/d n/d n/d n/d 3.00 0.70 0.50 1.30 1.10 1.50 0.50
Frost damage n/d n/d n/d 4.00 - - - 0.02 0.20 - - - 0.05 - - Herbivorous insects 25.80 2.80 5.80 7.50 2.50 2.00 2.00 3.00 3.00 1.80 1.00 1.20 0.85 1.90 1.00 Leaf and shoot fungi n/d n/d 2.40 1.00 0.50 0.50 2.00 2.00 2.00 - - 0.10 0.05 0.09 - Stem borers 0.50 0.30 0.14 - 0.14 0.25 - 3.00 5.00 11.00 11.00 11.00 11.00 10.00 12.00
1 Based on 8000 hectares of post-1994 hardwood plantation assessed. In the year ended 30 June 2014, only ground (i.e. no aerial) surveys were undertaken for a proportion of hardwood plantations (post-1994 and second rotation).
0
5
10
15
20
25
30
Indicator 11 – Plantation health
Bell miner associated diebackCreiis and Cardiaspina psyllids
Frost damage
Herbivorous insectsLeaf and shoot fungiStem borers
Area
affec
ted
(%)
2000 2001 2002 2003 2004 2005 2006 2007 2008 2009 2010 2011 2012 2013 2014
Our environment
Our business
Back to contents

14
FORE
STRY
CO
RPO
RATI
ON
OF N
SW S
USTA
INAB
ILITY
SUP
PLEM
ENT
201
3 –
14
Indicator 11 – continued
Softwood plantationsSoftwood plantation1
Year ended 30 June 2000 2001 2002 2003 2004 2005 2006 2007 2008 2009 2010 2011 2012 2013 2014
Agent Percentage (%) of area affectedDothistroma septosporum (needle blight) 2.30 2.00 1.30 0.90 0.50 0.25 0.25 0.50 1.00 1.00 0.80 1.00 2.00 4.10 0.75
Diplodia pinea (fungus) & Ips grandicollis (bark beetle)
0.10 0.50 0.13 0.01 0.01 0.01 0.01 6.00 15.00 4.00 4.03 1.30 0.01 1.00 5.00
Essigella californica (Monterey pine aphid) n/d n/d n/d n/d n/d 15.00 25.00 40.00 47.00 32.00 21.25 9.00 1.50 7.10 6.00
Possum 0.20 0.23 0.20 0.18 0.10 0.50 0.01 1.00 6.00 6.00 0.85 0.10 0.35 0.22 0.10 Sirex noctilio (woodwasp) - 0.02 0.01 0.01 0.01 0.00 0.01 1.20 1.50 0.80 0.13 0.20 0.25 0.30 0.20
1 Based on 200 000 hectares of softwood plantation assessed.
0
10
20
30
40
50
Dothistroma septosporum (needle blight)Diplodia pinea (fungus) and lps grandicollis (bark beetle)
Essigella californica (Monterey pine aphid)PossumSirex noctilio (woodwasp)
Area
affec
ted
(%)
2000 2001 2002 2003 2004 2005 2006 2007 2008 2009 2010 2011 2012 2013 2014
Our environment
Our business
Back to contents

15
FORE
STRY
CO
RPO
RATI
ON
OF N
SW S
USTA
INAB
ILITY
SUP
PLEM
ENT
201
3 –
14
Wild fire
Year ended 30 June 2008 2009 2010 2011 2012 2013 2014
Proportion of total State forest estate (%) 0.30 0.06 1.60 0.03 0.10 1.92 2.20
Fuel management
Year ended 30 June 2008 2009 2010 2011 2012 2013 2014
Hazard reduction (hectares)1 32 474 24 988 35 069 36 931 28 451 20 734 18 081Grazing (hectares) 528 933 498 718 529 712 426 258 307 468 290 817 288 176
The year ended 30 June 2014 was a year of significant fire activity in NSW. Forestry Corporation took a role in managing major fires events including:
■ In October, the State Mine Fire affected a large area of the Blue Mountains. Forestry Corporation participated in incident management team (IMT) roles and protection of Newnes State Forest.
■ In December-January, Forestry Corporation supplied significant numbers of IMT staff and fire fighters over several weeks to control a fire in Putty State Forest.
■ In January, Forestry Corporation committed significant IMT and fire fighting resources to fires in the Tumut and Bathurst regions with approximately 2500 hectares of Forestry Corporation plantations affected.
■ In February, Forestry Corporation provided resources to assist contain fires in Victoria that threatened Forestry Corporation plantations on the NSW/Victorian border.
1 Includes pre and post harvest burning, broad area burns and establishment burns. Unusually hot and dry weather conditions in autumn and winter limited opportunities to safely complete hazard reduction burning during 2014. However, Forestry Corporation is tracking ahead of its five-year State target for hazard reduction burning following an effective program over the past two years and expects to increase hazard reduction burning in 2015, weather permitting.
Indicator 12 – Fire fighting and prevention
Our environment
Our business
Back to contents
16
FORE
STRY
CO
RPO
RATI
ON
OF N
SW S
USTA
INAB
ILITY
SUP
PLEM
ENT
201
3 –
14
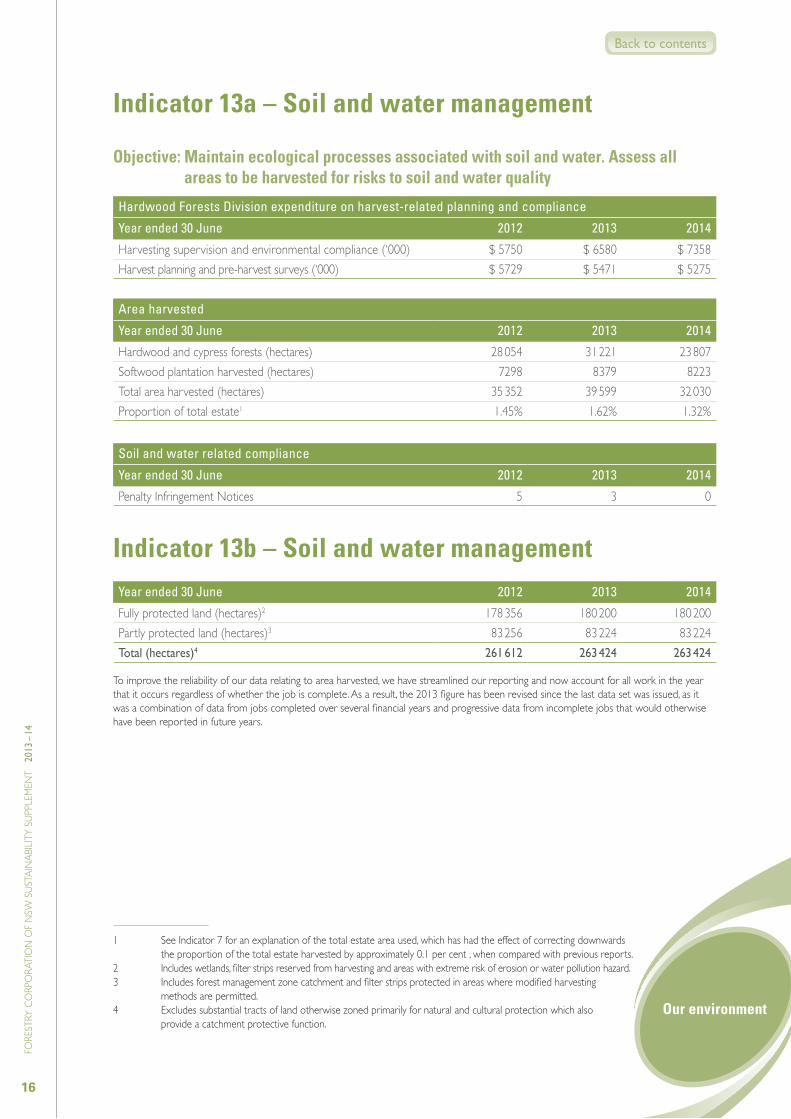
Indicator 13a – Soil and water management
Objective: Maintain ecological processes associated with soil and water. Assess all areas to be harvested for risks to soil and water quality
Hardwood Forests Division expenditure on harvest-related planning and compliance
Year ended 30 June 2012 2013 2014
Harvesting supervision and environmental compliance (‘000) $ 5750 $ 6580 $ 7358Harvest planning and pre-harvest surveys (‘000) $ 5729 $ 5471 $ 5275
Area harvested
Year ended 30 June 2012 2013 2014
Hardwood and cypress forests (hectares) 28 054 31 221 23 807Softwood plantation harvested (hectares) 7298 8379 8223Total area harvested (hectares) 35 352 39 599 32 030Proportion of total estate1 1.45% 1.62% 1.32%
Soil and water related compliance
Year ended 30 June 2012 2013 2014
Penalty Infringement Notices 5 3 0
Indicator 13b – Soil and water managementYear ended 30 June 2012 2013 2014
Fully protected land (hectares)2 178 356 180 200 180 200Partly protected land (hectares)3 83 256 83 224 83 224Total (hectares)4 261 612 263 424 263 424
To improve the reliability of our data relating to area harvested, we have streamlined our reporting and now account for all work in the year that it occurs regardless of whether the job is complete. As a result, the 2013 figure has been revised since the last data set was issued, as it was a combination of data from jobs completed over several financial years and progressive data from incomplete jobs that would otherwise have been reported in future years.
1 See Indicator 7 for an explanation of the total estate area used, which has had the effect of correcting downwards the proportion of the total estate harvested by approximately 0.1 per cent , when compared with previous reports.
2 Includes wetlands, filter strips reserved from harvesting and areas with extreme risk of erosion or water pollution hazard.3 Includes forest management zone catchment and filter strips protected in areas where modified harvesting
methods are permitted.4 Excludes substantial tracts of land otherwise zoned primarily for natural and cultural protection which also
provide a catchment protective function.Our environment
Back to contents

17
FORE
STRY
CO
RPO
RATI
ON
OF N
SW S
USTA
INAB
ILITY
SUP
PLEM
ENT
201
3 –
14
Compliance items
Year ended 30 June 2012 2013 2014Number of compliance check sheets conducted by Forestry Corporation supervisors Compliance monitoring 354 392 284Systems implementation 38 24 20
Number of medium or high severity non-compliances recorded by Forestry Corporation supervisors for corrective action relating to:1
Soil erosion and water quality 175 84 110Flora and fauna 32 61 25Fish habitat and passage 28 1 0Other non-compliance issues (e.g. safety) 150 86 36Total 385 232 171
Number of audits undertaken by regulators Office of Environment and Heritage/ Environment Protection Authority audits 39 20 24DPI - Fisheries audits 0 2 0DPI - Plantation Assessment Unit audits 5 9 6DPI - Office of Private Forestry audits 0 0 1
Number of clean-up notices issued to Forestry Corporation Clean-up notices 2 2 1
Number of fines (penalty infringement notices) issued to Forestry Corporation by regulatorsNational Parks and Wildlife Act 1974 5 8 2Protection of the Environment Operations Act 1997 5 3 0Fisheries Management Act 1994 0 0 0Plantations and Reafforestation Act 1999 0 0 0Total 10 11 2
Number of prosecutions recorded against Forestry Corporation under the:Threatened Species Conservation Act 1995 0 0 0National Parks and Wildlife Act 1974 0 0 0Protection of the Environment Operations Act 19972 0 0 1Fisheries Management Act 1994 0 0 0Plantations and Reafforestation Act 1999 0 0 0Total 0 0 1
On 10 July 2013 in the Land and Environment Court, Forestry Corporation was ordered to pay $35 000 under the Protection of the Environment Operations Act 1997 in relation to offences of polluting water and breaching its threatened species licence. Forestry Corporation pleaded guilty to the two offences which arose from a hazard reduction burn in 2011 in Mogo State Forest near Batemans Bay on the NSW south coast. The hazard reduction burn resulted in ash and soil entering water courses and burning within exclusion zones. By agreement with the Environment Protection Authority, the payment went towards an environmental project to identify and map an endangered ecological community in forests in the state’s south east.
1 The guidelines for internal reporting of non-conformance incidents have changed over the past four years.
A non-conformance incident that can be resolved within 24 hours and is not related to systematic failures is no longer recorded in the Non-Compliance Incident Reporting system. Similarly, minor incidents with low consequence or harm are no longer recorded. During the 2012 financial year,, the compliance system underwent a major modification to reduce the tiers of checks to three and to increase the focus on corrective and preventative action.
2 Forestry Corporation of NSW received one prosecution in relation to two offences - one offence under the Protection of the Environment Operations Act 1997 and one offence under the National Parks and Wildlife Act 1974.
Indicator 14 – Regulatory compliance
Our environment
Our business
Back to contents
18
FORE
STRY
CO
RPO
RATI
ON
OF N
SW S
USTA
INAB
ILITY
SUP
PLEM
ENT
201
3 –
14
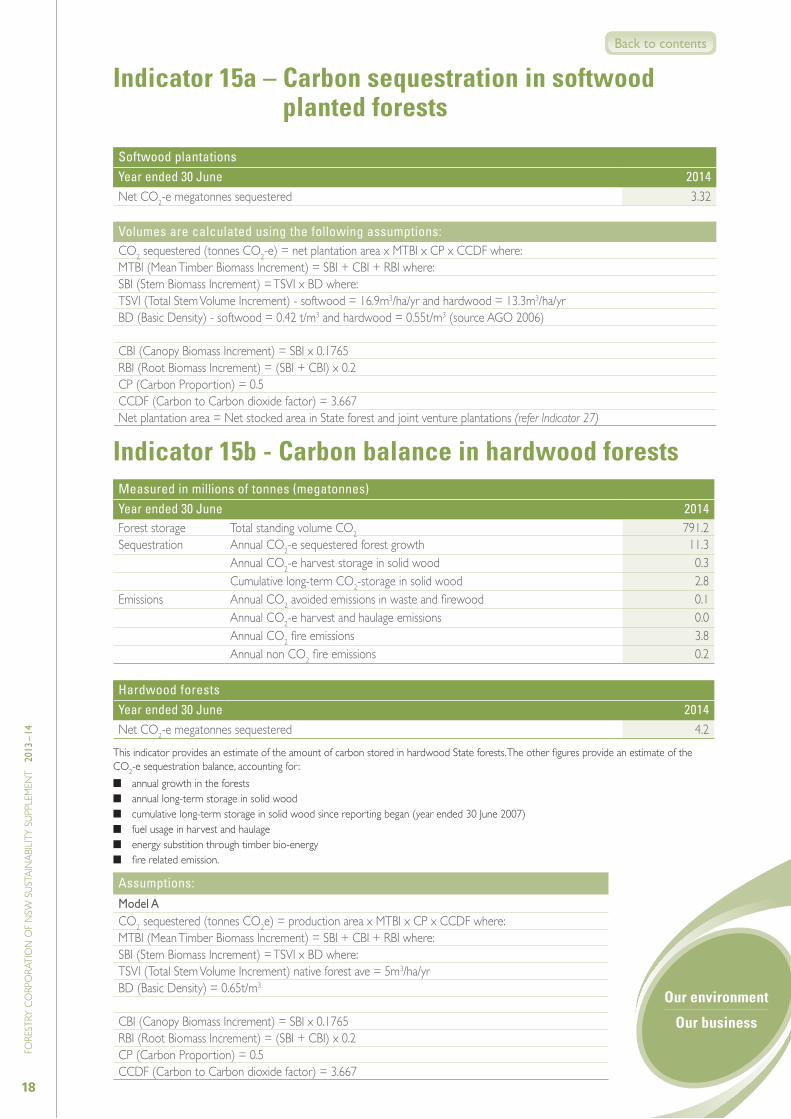
Softwood plantationsYear ended 30 June 2014Net CO2-e megatonnes sequestered 3.32
Volumes are calculated using the following assumptions:CO2 sequestered (tonnes CO2-e) = net plantation area x MTBI x CP x CCDF where:MTBI (Mean Timber Biomass Increment) = SBI + CBI + RBI where:SBI (Stem Biomass Increment) = TSVI x BD where:TSVI (Total Stem Volume Increment) - softwood = 16.9m3/ha/yr and hardwood = 13.3m3/ha/yrBD (Basic Density) - softwood = 0.42 t/m3 and hardwood = 0.55t/m3 (source AGO 2006)
CBI (Canopy Biomass Increment) = SBI x 0.1765RBI (Root Biomass Increment) = (SBI + CBI) x 0.2CP (Carbon Proportion) = 0.5CCDF (Carbon to Carbon dioxide factor) = 3.667Net plantation area = Net stocked area in State forest and joint venture plantations (refer Indicator 27)
Indicator 15b - Carbon balance in hardwood forestsMeasured in millions of tonnes (megatonnes)Year ended 30 June 2014Forest storage Total standing volume CO2 791.2Sequestration Annual CO2-e sequestered forest growth 11.3
Annual CO2-e harvest storage in solid wood 0.3Cumulative long-term CO2-storage in solid wood 2.8
Emissions Annual CO2 avoided emissions in waste and firewood 0.1Annual CO2-e harvest and haulage emissions 0.0Annual CO2 fire emissions 3.8Annual non CO2 fire emissions 0.2
Hardwood forestsYear ended 30 June 2014Net CO2-e megatonnes sequestered 4.2
This indicator provides an estimate of the amount of carbon stored in hardwood State forests. The other figures provide an estimate of the CO2-e sequestration balance, accounting for :
■ annual growth in the forests ■ annual long-term storage in solid wood ■ cumulative long-term storage in solid wood since reporting began (year ended 30 June 2007) ■ fuel usage in harvest and haulage ■ energy substition through timber bio-energy ■ fire related emission.
Assumptions:
Model ACO2 sequestered (tonnes CO2e) = production area x MTBI x CP x CCDF where:MTBI (Mean Timber Biomass Increment) = SBI + CBI + RBI where:SBI (Stem Biomass Increment) = TSVI x BD where:TSVI (Total Stem Volume Increment) native forest ave = 5m3/ha/yrBD (Basic Density) = 0.65t/m3
CBI (Canopy Biomass Increment) = SBI x 0.1765RBI (Root Biomass Increment) = (SBI + CBI) x 0.2CP (Carbon Proportion) = 0.5CCDF (Carbon to Carbon dioxide factor) = 3.667
Indicator 15a – Carbon sequestration in softwood planted forests
Our environment
Our business
Back to contents
19
FORE
STRY
CO
RPO
RATI
ON
OF N
SW S
USTA
INAB
ILITY
SUP
PLEM
ENT
201
3 –
14
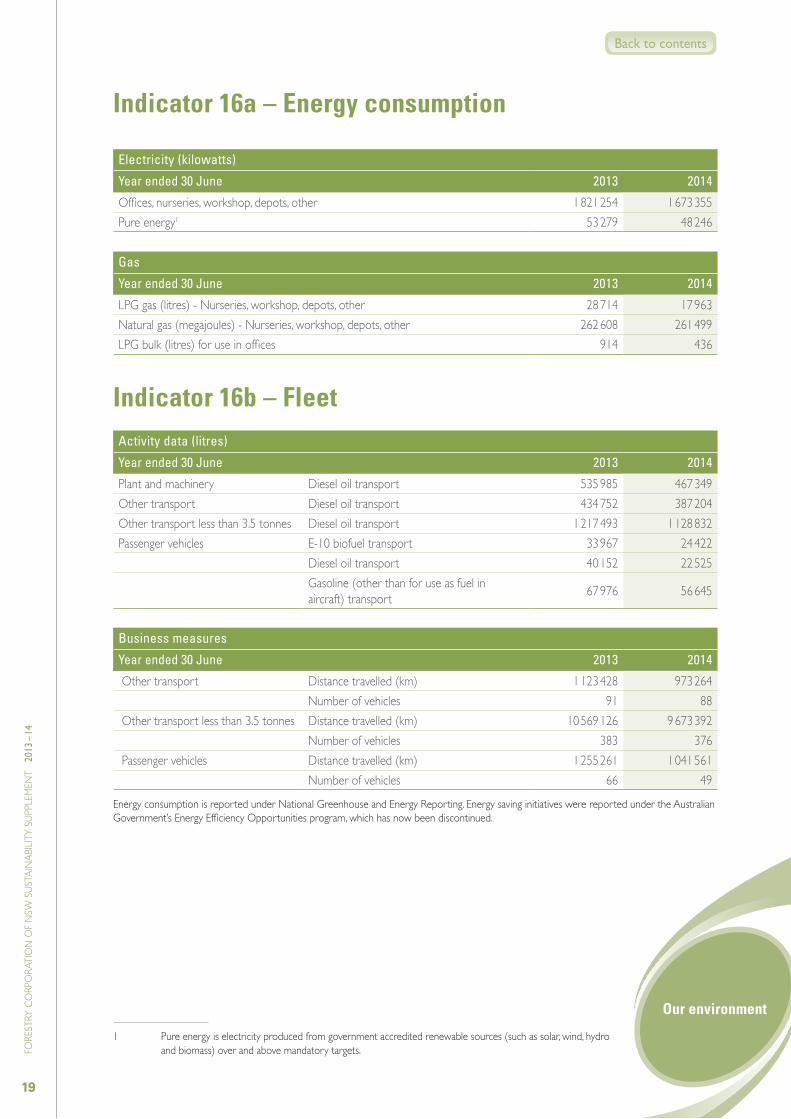
Indicator 16a – Energy consumption
Electricity (kilowatts)
Year ended 30 June 2013 2014
Offices, nurseries, workshop, depots, other 1 821 254 1 673 355Pure energy1 53 279 48 246
Gas
Year ended 30 June 2013 2014
LPG gas (litres) - Nurseries, workshop, depots, other 28 714 17 963Natural gas (megajoules) - Nurseries, workshop, depots, other 262 608 261 499LPG bulk (litres) for use in offices 914 436
Indicator 16b – FleetActivity data (litres)
Year ended 30 June 2013 2014
Plant and machinery Diesel oil transport 535 985 467 349Other transport Diesel oil transport 434 752 387 204Other transport less than 3.5 tonnes Diesel oil transport 1 217 493 1 128 832Passenger vehicles E-10 biofuel transport 33 967 24 422
Diesel oil transport 40 152 22 525Gasoline (other than for use as fuel in aircraft) transport 67 976 56 645
Business measures
Year ended 30 June 2013 2014
Other transport Distance travelled (km) 1 123 428 973 264Number of vehicles 91 88
Other transport less than 3.5 tonnes Distance travelled (km) 10 569 126 9 673 392Number of vehicles 383 376
Passenger vehicles Distance travelled (km) 1 255 261 1 041 561Number of vehicles 66 49
Energy consumption is reported under National Greenhouse and Energy Reporting. Energy saving initiatives were reported under the Australian Government’s Energy Efficiency Opportunities program, which has now been discontinued.
1 Pure energy is electricity produced from government accredited renewable sources (such as solar, wind, hydro and biomass) over and above mandatory targets.
Our environment
Back to contents
20
FORE
STRY
CO
RPO
RATI
ON
OF N
SW S
USTA
INAB
ILITY
SUP
PLEM
ENT
201
3 –
14
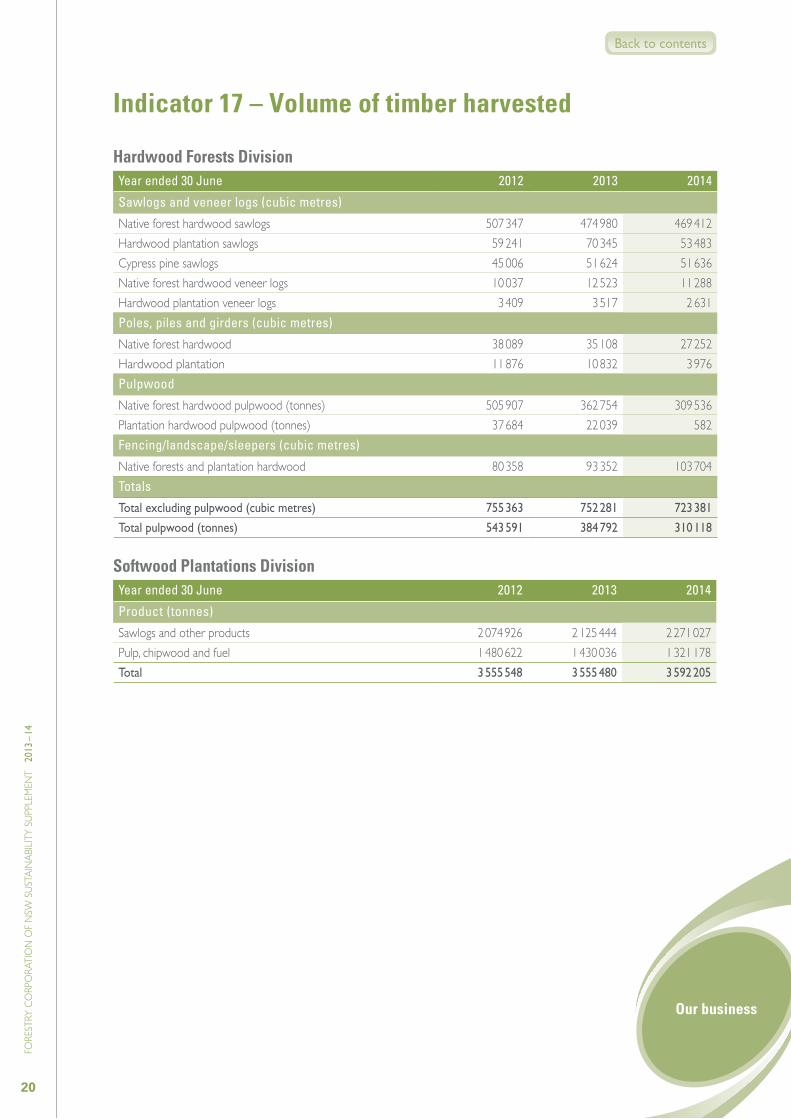
Hardwood Forests DivisionYear ended 30 June 2012 2013 2014
Sawlogs and veneer logs (cubic metres)
Native forest hardwood sawlogs 507 347 474 980 469 412Hardwood plantation sawlogs 59 241 70 345 53 483Cypress pine sawlogs 45 006 51 624 51 636Native forest hardwood veneer logs 10 037 12 523 11 288Hardwood plantation veneer logs 3 409 3 517 2 631Poles, piles and girders (cubic metres)
Native forest hardwood 38 089 35 108 27 252Hardwood plantation 11 876 10 832 3 976Pulpwood
Native forest hardwood pulpwood (tonnes) 505 907 362 754 309 536Plantation hardwood pulpwood (tonnes) 37 684 22 039 582Fencing/landscape/sleepers (cubic metres)
Native forests and plantation hardwood 80 358 93 352 103 704Totals
Total excluding pulpwood (cubic metres) 755 363 752 281 723 381
Total pulpwood (tonnes) 543 591 384 792 310 118
Softwood Plantations DivisionYear ended 30 June 2012 2013 2014
Product (tonnes)
Sawlogs and other products 2 074 926 2 125 444 2 271 027Pulp, chipwood and fuel 1 480 622 1 430 036 1 321 178Total 3 555 548 3 555 480 3 592 205
Indicator 17 – Volume of timber harvested
Our business
Back to contents
21
FORE
STRY
CO
RPO
RATI
ON
OF N
SW S
USTA
INAB
ILITY
SUP
PLEM
ENT
201
3 –
14
Land not available for harvesting (hectares)
Land available for harvesting (hectares)
Year ended 30 June 2000 2013 2014 2000 2013 2014
Forest management intent
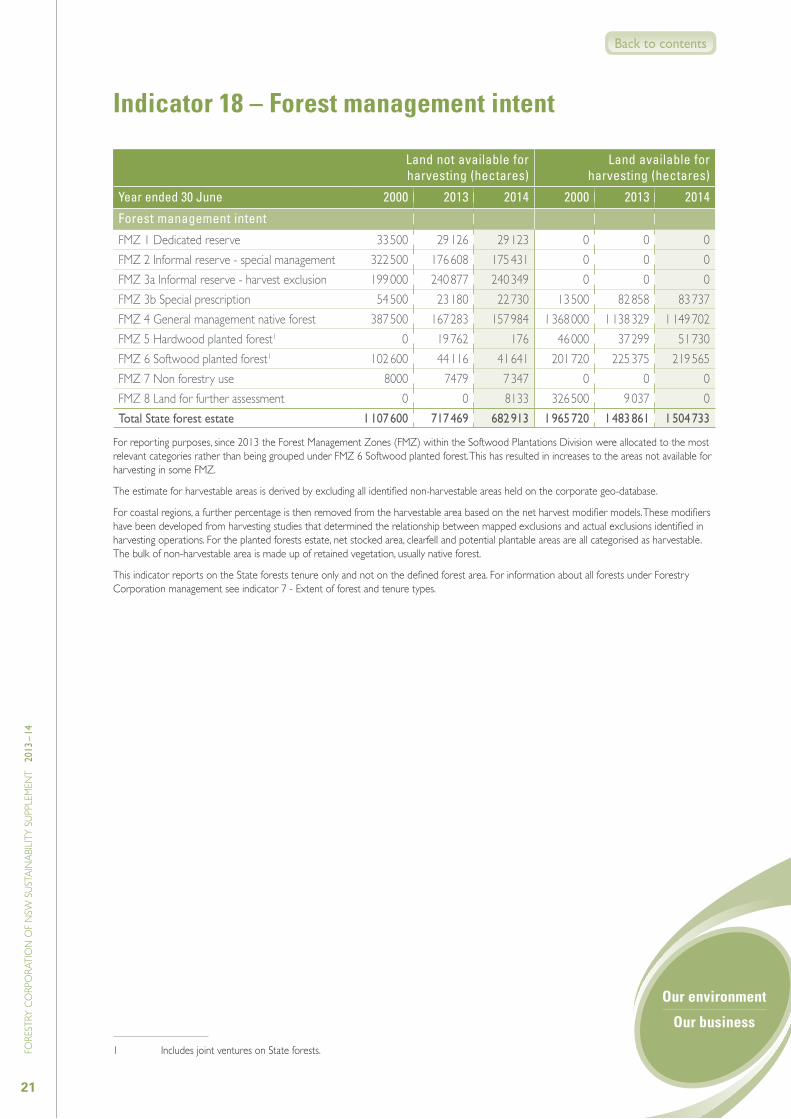
FMZ 1 Dedicated reserve 33 500 29 126 29 123 0 0 0FMZ 2 Informal reserve - special management 322 500 176 608 175 431 0 0 0FMZ 3a Informal reserve - harvest exclusion 199 000 240 877 240 349 0 0 0FMZ 3b Special prescription 54 500 23 180 22 730 13 500 82 858 83 737FMZ 4 General management native forest 387 500 167 283 157 984 1 368 000 1 138 329 1 149 702FMZ 5 Hardwood planted forest1 0 19 762 176 46 000 37 299 51 730FMZ 6 Softwood planted forest1 102 600 44 116 41 641 201 720 225 375 219 565FMZ 7 Non forestry use 8000 7479 7 347 0 0 0FMZ 8 Land for further assessment 0 0 8133 326 500 9 037 0Total State forest estate 1 107 600 717 469 682 913 1 965 720 1 483 861 1 504 733
For reporting purposes, since 2013 the Forest Management Zones (FMZ) within the Softwood Plantations Division were allocated to the most relevant categories rather than being grouped under FMZ 6 Softwood planted forest. This has resulted in increases to the areas not available for harvesting in some FMZ.
The estimate for harvestable areas is derived by excluding all identified non-harvestable areas held on the corporate geo-database.
For coastal regions, a further percentage is then removed from the harvestable area based on the net harvest modifier models. These modifiers have been developed from harvesting studies that determined the relationship between mapped exclusions and actual exclusions identified in harvesting operations. For the planted forests estate, net stocked area, clearfell and potential plantable areas are all categorised as harvestable. The bulk of non-harvestable area is made up of retained vegetation, usually native forest.
This indicator reports on the State forests tenure only and not on the defined forest area. For information about all forests under Forestry Corporation management see indicator 7 - Extent of forest and tenure types.
1 Includes joint ventures on State forests.
Indicator 18 – Forest management intent
Our environment
Our business
Back to contents
22
FORE
STRY
CO
RPO
RATI
ON
OF N
SW S
USTA
INAB
ILITY
SUP
PLEM
ENT
201
3 –
14
New plantation establishment
(hectares)
Re-establishment of plantations (hectares)
Cost of all plantation establishment1
Proportion requiring restocking after one
year
Age-class
Softwood plantation
Hardwood plantation
Softwood plantation
Hardwood plantation
Softwood plantation
Hardwood plantation
Softwood plantation
Hardwood plantation
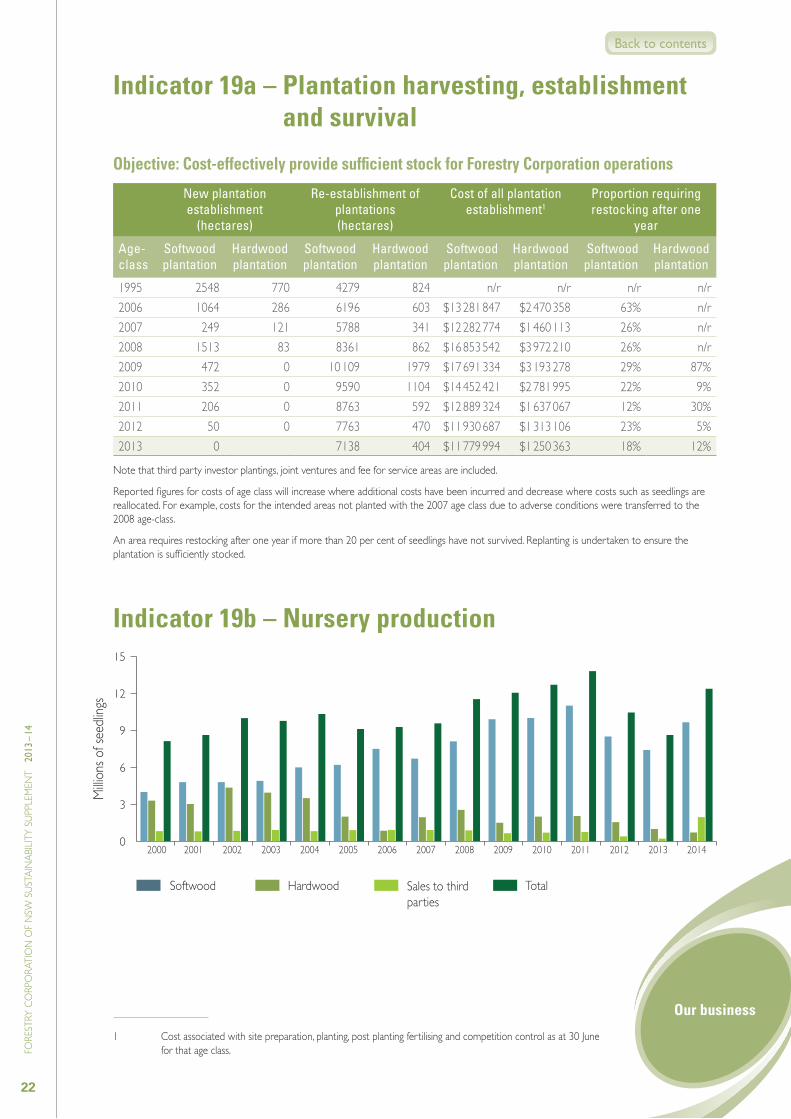
1995 2548 770 4279 824 n/r n/r n/r n/r2006 1064 286 6196 603 $13 281 847 $2 470 358 63% n/r2007 249 121 5788 341 $12 282 774 $1 460 113 26% n/r2008 1513 83 8361 862 $16 853 542 $3 972 210 26% n/r2009 472 0 10 109 1979 $17 691 334 $3 193 278 29% 87%2010 352 0 9590 1104 $14 452 421 $2 781 995 22% 9%2011 206 0 8763 592 $12 889 324 $1 637 067 12% 30%2012 50 0 7763 470 $11 930 687 $1 313 106 23% 5%2013 0 7138 404 $11 779 994 $1 250 363 18% 12%
Note that third party investor plantings, joint ventures and fee for service areas are included.
Reported figures for costs of age class will increase where additional costs have been incurred and decrease where costs such as seedlings are reallocated. For example, costs for the intended areas not planted with the 2007 age class due to adverse conditions were transferred to the 2008 age-class.
An area requires restocking after one year if more than 20 per cent of seedlings have not survived. Replanting is undertaken to ensure the plantation is sufficiently stocked.
Indicator 19b – Nursery production
1 Cost associated with site preparation, planting, post planting fertilising and competition control as at 30 June for that age class.
0
3
6
9
12
15
Indicator 19a – Plantation harvesting, establishment and survival
Objective: Cost-effectively provide sufficient stock for Forestry Corporation operations
Our business
Millio
ns o
f see
dling
s
20072001 20082002 20092003 20102004 20112005 20122006 2013 20142000
Softwood Sales to third parties
TotalHardwood
Back to contents
23
FORE
STRY
CO
RPO
RATI
ON
OF N
SW S
USTA
INAB
ILITY
SUP
PLEM
ENT
201
3 –
14
Softwood plantation
Year ended 30 June 2014
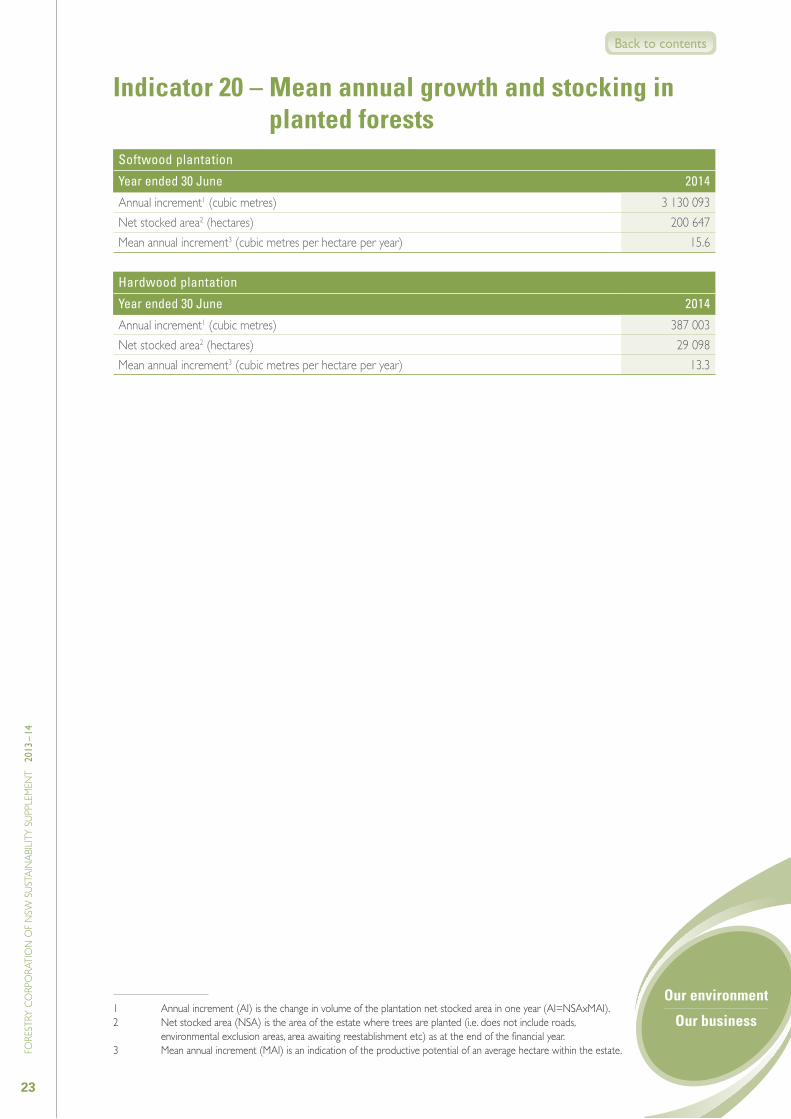
Annual increment1 (cubic metres) 3 130 093Net stocked area2 (hectares) 200 647Mean annual increment3 (cubic metres per hectare per year) 15.6
Hardwood plantation
Year ended 30 June 2014
Annual increment1 (cubic metres) 387 003Net stocked area2 (hectares) 29 098Mean annual increment3 (cubic metres per hectare per year) 13.3
1 Annual increment (AI) is the change in volume of the plantation net stocked area in one year (AI=NSAxMAI).2 Net stocked area (NSA) is the area of the estate where trees are planted (i.e. does not include roads,
environmental exclusion areas, area awaiting reestablishment etc) as at the end of the financial year.3 Mean annual increment (MAI) is an indication of the productive potential of an average hectare within the estate.
Indicator 20 – Mean annual growth and stocking in planted forests
Our environment
Our business
Back to contents

24
FORE
STRY
CO
RPO
RATI
ON
OF N
SW S
USTA
INAB
ILITY
SUP
PLEM
ENT
201
3 –
14
Hardwood forests Estimated area harvested (hectares)
Year ended 30 June 20121 2013 2014
Alternate coupe 1213 1258 1702Thinning 4014 4898 1630Single tree selection 15 906 15 355 13 791Cypress forests Estimated area harvested (hectares)
Year ended 30 June 20121 2013 2014
Release/thinning 6311 9710 6684Regeneration2 (%) 77 69 67
Expenditure associated with harvesting in Hardwood Forests Division
Year ended 30 June 20121 2013 2014
Compliance harvesting $3 809 111 $3 091 463 $4 988 769Compliance tree-marking $1 778 607 $2 423 896 $2 368 870Harvest planning $2 587 279 $3 206 238 $3 273 204Pre-harvest surveys $2 307 800 $2 069 493 $2 001 787Regulation licence charges $903 895 $613 607 $623 760
While natural regeneration of commercial species is usually achieved, in a minority of cases regeneration of commercial species may be insufficient. This is due to a number of factors including poor seed bank, unfavourable weather conditions and competition from weeds. Follow-up treatments such as hazard reduction burning, mechanical disturbance or enrichment planting are used to regenerate these areas successfully. Note that cypress forests of Western Region are generally regenerated before harvesting. Information about silvicultural techniques referred to in this table is available in the Native Forest Silviculture Manual, available on Forestry Corporation’s website.
1 Revised figures for 2012 based on standardised accounting methodology and amended scope.2 Proportion effectively regenerated with commercial species.
Indicator 21 – Hardwood and cypress forest harvest and regeneration
Our environment
Our business
Back to contents
25
FORE
STRY
CO
RPO
RATI
ON
OF N
SW S
USTA
INAB
ILITY
SUP
PLEM
ENT
201
3 –
14
Indicator 22 – Sustainable wood supply
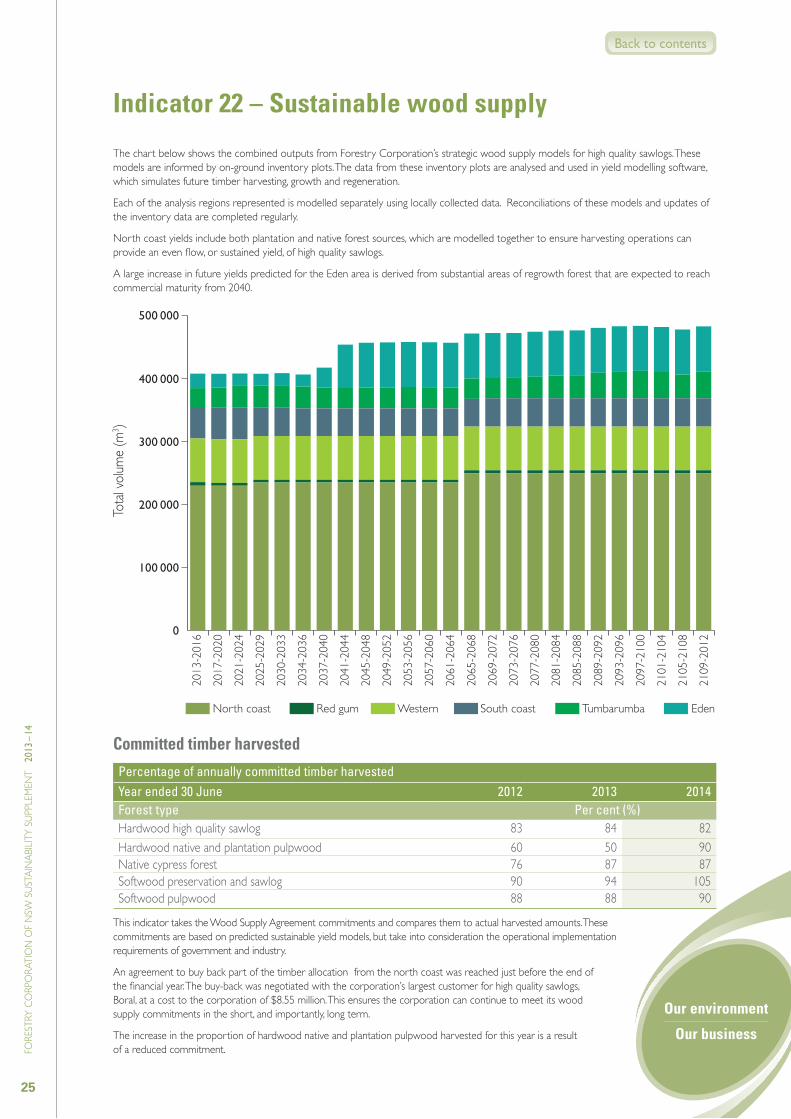
The chart below shows the combined outputs from Forestry Corporation’s strategic wood supply models for high quality sawlogs. These models are informed by on-ground inventory plots. The data from these inventory plots are analysed and used in yield modelling software, which simulates future timber harvesting, growth and regeneration.
Each of the analysis regions represented is modelled separately using locally collected data. Reconciliations of these models and updates of the inventory data are completed regularly.
North coast yields include both plantation and native forest sources, which are modelled together to ensure harvesting operations can provide an even flow, or sustained yield, of high quality sawlogs.
A large increase in future yields predicted for the Eden area is derived from substantial areas of regrowth forest that are expected to reach commercial maturity from 2040.
Committed timber harvested
Percentage of annually committed timber harvestedYear ended 30 June 2012 2013 2014Forest type Per cent (%)Hardwood high quality sawlog 83 84 82Hardwood native and plantation pulpwood 60 50 90Native cypress forest 76 87 87Softwood preservation and sawlog 90 94 105Softwood pulpwood 88 88 90
This indicator takes the Wood Supply Agreement commitments and compares them to actual harvested amounts. These commitments are based on predicted sustainable yield models, but take into consideration the operational implementation requirements of government and industry.
An agreement to buy back part of the timber allocation from the north coast was reached just before the end of the financial year. The buy-back was negotiated with the corporation’s largest customer for high quality sawlogs, Boral, at a cost to the corporation of $8.55 million. This ensures the corporation can continue to meet its wood supply commitments in the short, and importantly, long term.
The increase in the proportion of hardwood native and plantation pulpwood harvested for this year is a result of a reduced commitment.
0
100 000
200 000
300 000
400 000
500 000
Our environment
Our business
2013
-201
6
2017
-202
0
2021
-202
4
2025
-202
9
2030
-203
3
2034
-203
6
2037
-204
0
2041
-204
4
2045
-204
8
2049
-205
2
2053
-205
6
2057
-206
0
2061
-206
4
2065
-206
8
2069
-207
2
2073
-207
6
2077
-208
0
2081
-208
4
2085
-208
8
2089
-209
2
2093
-209
6
2097
-210
0
2101
-210
4
2105
-210
8
2109
-201
2
Total
volum
e (m
3 )
Tumbarumba EdenSouth coastWesternRed gumNorth coast
Back to contents
26
FORE
STRY
CO
RPO
RATI
ON
OF N
SW S
USTA
INAB
ILITY
SUP
PLEM
ENT
201
3 –
14
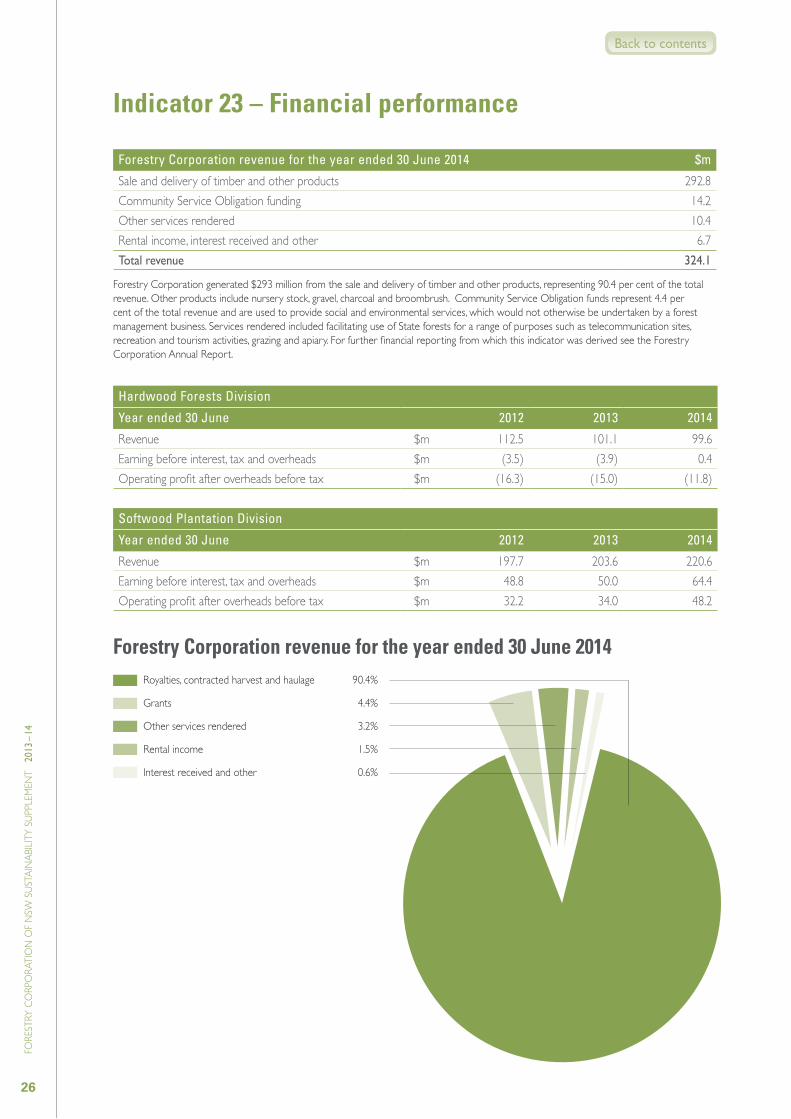
Forestry Corporation revenue for the year ended 30 June 2014 $m
Sale and delivery of timber and other products 292.8Community Service Obligation funding 14.2Other services rendered 10.4Rental income, interest received and other 6.7Total revenue 324.1
Forestry Corporation generated $293 million from the sale and delivery of timber and other products, representing 90.4 per cent of the total revenue. Other products include nursery stock, gravel, charcoal and broombrush. Community Service Obligation funds represent 4.4 per cent of the total revenue and are used to provide social and environmental services, which would not otherwise be undertaken by a forest management business. Services rendered included facilitating use of State forests for a range of purposes such as telecommunication sites, recreation and tourism activities, grazing and apiary. For further financial reporting from which this indicator was derived see the Forestry Corporation Annual Report.
Hardwood Forests Division
Year ended 30 June 2012 2013 2014
Revenue $m 112.5 101.1 99.6Earning before interest, tax and overheads $m (3.5) (3.9) 0.4Operating profit after overheads before tax $m (16.3) (15.0) (11.8)
Softwood Plantation Division
Year ended 30 June 2012 2013 2014
Revenue $m 197.7 203.6 220.6Earning before interest, tax and overheads $m 48.8 50.0 64.4Operating profit after overheads before tax $m 32.2 34.0 48.2
Indicator 23 – Financial performance
Forestry Corporation revenue for the year ended 30 June 2014Royalties, contracted harvest and haulage 90.4%
Grants 4.4%
Other services rendered 3.2%
Rental income 1.5%
Interest received and other 0.6%
Back to contents

27
FORE
STRY
CO
RPO
RATI
ON
OF N
SW S
USTA
INAB
ILITY
SUP
PLEM
ENT
201
3 –
14
Forestry Corporation was externally audited to check compliance with the Australian Forestry Standard (AS4708:2007) and Environmental Management System (ISO 14001:2004) in February 2014. Three regions and the corporate systems were audited to ensure we continued to meet and exceed the environmental, social, economic and sustainability criteria of these standards.
The Australian Forestry Standard sets criteria that our forestry management must meet, including: ■ undertaking forestry activities in a systematic manner that addresses a range of forest values ■ providing for public participation and fostering productive community relationships, particularly with neighbours ■ protecting and maintaining the biological diversity of forests, including their successional stages across the regional landscape ■ maintaining the productive capacity of forests ■ maintaining forest ecosystem health and vitality ■ protecting soil and water resources ■ maintaining forests’ contribution to carbon cycles ■ protecting and maintaining the natural, cultural, social, religious and spiritual heritage values of Indigenous and non-Indigenous people ■ maintaining and enhancing long-term social and economic benefits.
Indicator 24 – Forest certification
Forestry Corporation of NSW
Back to contents