suzaku observations of hess j1616 evidence for a dark ... · atsushi senda,3 motohide kokubun,8...
TRANSCRIPT

PASJ: Publ. Astron. Soc. Japan 59, S199–S208, 2007 January 25c© 2007. Astronomical Society of Japan.
Suzaku Observations of HESS J1616−508:Evidence for a Dark Particle Accelerator
Hironori MATSUMOTO,1 Masaru UENO,2 Aya BAMBA,3 Yoshiaki HYODO,1 Hideyuki MORI,1
Hideki UCHIYAMA,1 Takeshi Go TSURU,1 Katsuji KOYAMA,1 Jun KATAOKA,2 Hideaki KATAGIRI,4
Tadayuki TAKAHASHI,5 Junko HIRAGA,3 Shigeo YAMAUCHI,6 John P. HUGHES,7
Atsushi SENDA,3 Motohide KOKUBUN,8 Takayoshi KOHMURA,9 and Frederick S. PORTER10
1Department of Physics, Graduate School of Science, Kyoto University, Sakyo-ku, Kyoto [email protected]
2Department of Physics, Faculty of Science, Tokyo Institute of Technology, 2-12-1 Ookayama, Meguro-ku, Tokyo 152-85513RIKEN, Cosmic radiation group, 2-1 Hirosawa, Wako, Saitama 351-0198
4Department of Physics, Graduate School of Science, Hiroshima University, 1-3-1 Kagamiyama, Higashi-Hiroshima, Hiroshima 739-85265Institute of Space and Astronautical Science, Japan Aerospace Exploration Agency, 3-1-1 Yoshinodai, Sagamihara, Kanagawa 229-8510
6Faculty of Humanities and Social Sciences, Iwate University, 3-18-34 Ueda, Morioka, Iwate 020-85507Department of Physics and Astronomy, Rutgers University, 136 Frelinghuysen Road, Piscataway, NJ 08854-8019, USA
8Department of Physics, The University of Tokyo, 7-3-1 Hongo, Bunkyo-ku, Tokyo 113-00339Department of General Education, Kogakuin University, 2665-1 Nakano-Cho, Hachioji, Tokyo 192-0015
10NASA Goddard Space Flight Center, Laboratory for High Energy Astrophysics, Code 662, Greenbelt, MD 20771, USA
(Received 2006 July 28; accepted 2006 August 16)
Abstract
We observed the bright unidentified TeV γ -ray source HESS J1616−508 with the X-ray Imaging Spectrometersonboard the Suzaku satellite. No X-ray counterpart was found to a limiting flux of 3.1 × 10⁻¹³ erg s−1 cm−2 inthe 2–10 keV band, which is some 60-times below the γ -ray flux in the 1–10 TeV band. This object is bright inTeV γ -rays, but very dim in the X-ray band, and thus is one of the best examples in the Galaxy of a “dark particleaccelerator.” We also detected soft thermal emission with kT ∼ 0.3–0.6keV near the location of HESS J1616−508.This may be due to a dust-grain scattering halo from the nearby bright supernova remnant RCW 103.
Key words: acceleration of particles — X-rays: individual (HESS J1616−508) — X-rays: ISM
1. Introduction
Since the discovery of cosmic rays, the origin of these high-energy particles has been a mystery. Recent observationalstudies have revealed that some supernova remnants (SNRs)have non-thermal X-ray emission (e.g., Koyama et al. 1995;Hwang et al. 2002; Bamba et al. 2003b; Vink, Laming 2003;Bamba et al. 2005), which can be interpreted as synchrotronradiation from electrons with energies approaching E ∼1014 eV. TeV γ -rays have also been detected from some ofthese non-thermal shell-type SNRs. Such very high energy(VHE) gamma-rays have been explained by either (1) Inverse-Compton (IC) upscattering of cosmic microwave background(or other lower frequency) photons by the same high-energyelectrons giving rise to the X-ray synchrotron emission or(2) the decay of neutral pions that originate in collisionsbetween high-energy protons and dense interstellar matter(e.g., Pannuti et al. 2003; Lazendic et al. 2004; Katagiri et al.2005). Thus, the combination of VHE gamma-ray and non-thermal X-ray emission is expected to be a key observationalfeature of high-energy particle accelerators. A high-sensitivitysurvey of the galactic plane in VHE γ -rays has been conductedby the High Energy Stereoscopic System (HESS) team, whichdiscovered fourteen new VHE γ -ray sources (Aharonian et al.2005a, 2006). HESS J1616−508 (hereafter HESS J1616) isone of the brightest of these new sources and, furthermore,
is spatially extended with an angular diameter of ∼ 16′ in theHESS data. Three known objects, the young hard X-ray pulsarPSR J1617−5055, the SNR RCW 103 (G332.4−0.4), and theSNR Kes 32 (G322.4 + 0.1), are in the vicinity of HESS J1616(∼ 10′–15′ away from it), but none provides a convincingidentification (Aharonian et al. 2005a, 2006).
Before the HESS galactic plane survey, a few extendedγ -ray objects with no clear counterpart in other wavebands hadbeen found. These objects have been denoted “dark particleaccelerators” (Aharonian et al. 2005a; Ubertini et al. 2005).They are of interest since they may be indicating the accel-eration of nucleons; on the other hand, if the TeV emissioncomes from electrons, peculiar conditions, such as extremelylow magnetic fields, may be necessary, due to the short radia-tive lifetimes of high-energy electrons (Yamazaki et al. 2006).TeV 2032 + 410, discovered by the High Energy Gamma-RayAstronomy (HEGRA) collaboration (Aharonian et al. 2002),was the first object of this kind. In spite of several multi-wavelength follow-up studies, no compelling counterpart hasbeen found from radio to X-ray wavelengths (Mukherjee et al.2003; Butt et al. 2003, 2006). HESS J1303−631 is anotherexample (Aharonian et al. 2004a). Mukherjee et al. (2003)observed this target with the Chandra X-ray Observatory for5 ks, and placed an upper limit of < 5.4× 10⁻¹² ergs−1 cm−2
to its diffuse hard X-ray flux in the 2–10 keV band.HESS J1616 is brighter than both TeV 2032 + 410 and
S200 H. Matsumoto et al. [Vol. 59,
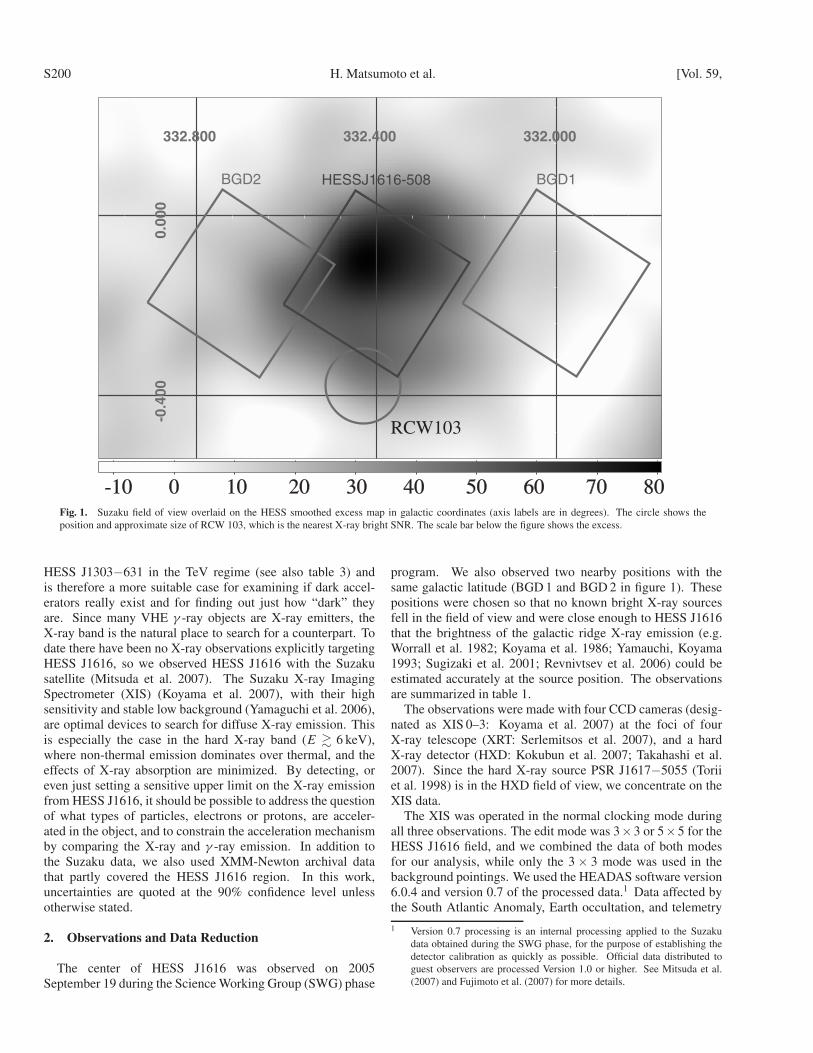
Fig. 1. Suzaku field of view overlaid on the HESS smoothed excess map in galactic coordinates (axis labels are in degrees). The circle shows theposition and approximate size of RCW 103, which is the nearest X-ray bright SNR. The scale bar below the figure shows the excess.
HESS J1303−631 in the TeV regime (see also table 3) andis therefore a more suitable case for examining if dark accel-erators really exist and for finding out just how “dark” theyare. Since many VHE γ -ray objects are X-ray emitters, theX-ray band is the natural place to search for a counterpart. Todate there have been no X-ray observations explicitly targetingHESS J1616, so we observed HESS J1616 with the Suzakusatellite (Mitsuda et al. 2007). The Suzaku X-ray ImagingSpectrometer (XIS) (Koyama et al. 2007), with their highsensitivity and stable low background (Yamaguchi et al. 2006),are optimal devices to search for diffuse X-ray emission. Thisis especially the case in the hard X-ray band (E � 6 keV),where non-thermal emission dominates over thermal, and theeffects of X-ray absorption are minimized. By detecting, oreven just setting a sensitive upper limit on the X-ray emissionfrom HESS J1616, it should be possible to address the questionof what types of particles, electrons or protons, are acceler-ated in the object, and to constrain the acceleration mechanismby comparing the X-ray and γ -ray emission. In addition tothe Suzaku data, we also used XMM-Newton archival datathat partly covered the HESS J1616 region. In this work,uncertainties are quoted at the 90% confidence level unlessotherwise stated.
2. Observations and Data Reduction
The center of HESS J1616 was observed on 2005September 19 during the Science Working Group (SWG) phase
program. We also observed two nearby positions with thesame galactic latitude (BGD 1 and BGD 2 in figure 1). Thesepositions were chosen so that no known bright X-ray sourcesfell in the field of view and were close enough to HESS J1616that the brightness of the galactic ridge X-ray emission (e.g.Worrall et al. 1982; Koyama et al. 1986; Yamauchi, Koyama1993; Sugizaki et al. 2001; Revnivtsev et al. 2006) could beestimated accurately at the source position. The observationsare summarized in table 1.
The observations were made with four CCD cameras (desig-nated as XIS 0–3: Koyama et al. 2007) at the foci of fourX-ray telescope (XRT: Serlemitsos et al. 2007), and a hardX-ray detector (HXD: Kokubun et al. 2007; Takahashi et al.2007). Since the hard X-ray source PSR J1617−5055 (Toriiet al. 1998) is in the HXD field of view, we concentrate on theXIS data.
The XIS was operated in the normal clocking mode duringall three observations. The edit mode was 3×3 or 5×5 for theHESS J1616 field, and we combined the data of both modesfor our analysis, while only the 3 × 3 mode was used in thebackground pointings. We used the HEADAS software version6.0.4 and version 0.7 of the processed data.1 Data affected bythe South Atlantic Anomaly, Earth occultation, and telemetry1 Version 0.7 processing is an internal processing applied to the Suzaku
data obtained during the SWG phase, for the purpose of establishing thedetector calibration as quickly as possible. Official data distributed toguest observers are processed Version 1.0 or higher. See Mitsuda et al.(2007) and Fujimoto et al. (2007) for more details.

No. 1] Dark Accelerator HESS J1616−508 S201
Table 1. Log of Suzaku observations.
Name Position (degree) Start time End time Effective exposure (ks)l b XIS 0 XIS 1 XIS 2 XIS 3
HESS J1616 332.400 −0.150 2005/9/19 12:09:58 2005/9/20 19:37:50 45.0 45.4 45.0 45.0BGD 1 332.000 −0.150 2005/9/18 22:56:14 2005/9/19 10:59:02 21.1 23.7 21.2 21.7BGD 2 332.700 −0.150 2005/9/20 19:37:50 2005/9/21 07:28:46 23.5 23.7 23.5 23.5
Fig. 2. Suzaku XIS images of the HESS J1616 field in the soft (left: 0.6–3 keV) and hard (right: 3–12 keV) energy bands. Lines of constant galacticlatitude and longitude are plotted. The scale bars under the figures show the photon count. The images were smoothed using a Gaussian function witha sigma of 0.′42. Vignetting correction was applied after subtracting non-X-ray backgrounds, as described in the text. The dotted lines in the left figureshow the regions used for the photon-count profiles shown in figure 3. The dotted circle with a radius of 5′ in the right figure shows the region where weextracted the XIS spectra.
saturation were excluded. Hot and flickering pixels were alsoremoved. We did not screen the data with the elevation anglefrom the bright Earth in order to maximize the statistics in thehard X-ray band; more than 99% of the contamination from thebright Earth consists of the O Kα and N Kα lines originatingin the atmosphere, and the data above 0.6 keV are not affectedby the contamination. In the following analysis we use the XISdata from 0.6 keV to 12 keV. After data screening, the effectiveexposures were 45 ks, 21 ks, and 24 ks for the HESS J1616,BGD 1, and BGD 2 regions, respectively.
3. Analysis and Results
3.1. XIS Image
We concentrate on the front-illuminated (FI) CCD data inthis imaging analysis, since non-X-ray background (NXB)dominates the data of the back-illuminated (BI) CCD (XIS1)in the high-energy band, especially above 8 keV. In figure 2,XIS images of the HESS J1616 region are shown for thesoft (0.6–3.0 keV) and hard (3.0–12.0 keV) energy bands. Weexcluded the corners of the chips that were illuminated bythe 55Fe calibration sources, and images from the three FI
CCDs (XIS 0, XIS 2, and XIS 3) were summed. Images ofthe NXB were constructed from night Earth data provided bythe XIS team and subtracted from the HESS J1616 images.After NXB subtraction, vignetting corrections were done asfollows. We produced simulated XIS images assuming auniform surface brightness, using the XRT + XIS simulatorxissim ver. 2006-05-28 (Ishisaki et al. 2007). We assumedmonochromatic X-rays of energy 1.49 or 8.05 keV, where thevignetting function is best calibrated (Serlemitsos et al. 2007).The simulated images were normalized so that pixels at theoptical axis had values of ∼ 1. We divided the soft andhard HESS J1616 images by the simulated 1.49 and 8.05 keVimages. Finally, the resulting images were rebinned by a factorof 8 and smoothed using a Gaussian function with a sigma of0.′42.
Since the lower left corner of the field of view marginallyoverlaps the bright SNR RCW 103, corresponding brightemission can be seen in the soft band image. On the otherhand, there is no such structure in the hard band image.Furthermore, there is no apparent X-ray structure suggestingan X-ray counterpart of HESS J1616 both in the soft and hardband images. To examine this more quantitatively, we made

S202 H. Matsumoto et al. [Vol. 59,
Fig. 3. Photon count profiles of the XIS images along the strips AA′ (a) and BB′ (b) shown in figure 2. The errors are estimated at the 1σ confidencelevel. The curve in the figures shows the Gaussian function of σ = 8.′2, which expresses the TeV γ -ray profile of HESS J1616.
photon count profiles along the strips AA′ and BB′ with a widthof 4.′2 in figure 2; the profiles are shown in figure 3.
In the soft energy band, the photon count graduallydecreases along both the X and Y axes, which shows theinfluence of RCW 103. A similar trend can be seen even inthe hard energy band along the X axis, but we do not seeit along the Y axis. The trend in the hard energy band mayhave a different origin from the soft band profile; the hardX-ray pulsar PSR J1617−5055 or fluctuations of the galacticridge emission may explain the hard band profile. We see nosystematic trend in either the hard or soft X-ray profiles consis-tent with the TeV γ -ray profile of HESS J1616, which can bedescribed by a Gaussian function with σ = 8.′2 (Aharonian et al.2006). In summary, according to our imaging analysis, there isno apparent X-ray counterpart to HESS J1616.
3.2. XIS Spectrum
We made the XIS spectrum of the HESS J1616 regionfrom each XIS sensor by extracting X-ray events fromwithin a 5′ radius of the center of the field of view. Wealso tried to extract spectra for the BGD 1 and BGD 2regions in the same way as for the HESS J1616 region,but we discovered several X-ray sources in the extractionregions; there is an X-ray object in the BGD 1 region (desig-nated Suzaku J1614−5114) at (l, b) = (331.◦98, −0.◦22),and two X-ray sources are found in the BGD 2 region at(l, b) = (332.◦67,−0.◦19) and (332.◦77,−0.◦20) (designatedSuzaku J1617−5044 and Suzaku J1618−5040, respectively).According to the SIMBAD Astronomical Database operated atCDS, Strasbourg, France,2 Suzaku J1614−5114 and SuzakuJ1618−5040 are positionally coincident with the B-type starCD−50 10270 and the infrared source IRAS 16145−5033,respectively. We were unable to identify the counterpart toSuzaku J1617−5044. We excluded these sources from theBGD 1 and BGD 2 spectra using 2′ radius circular regions. Thespectra from the FI CCDs were combined after extraction.
These spectra contain the NXB. For the most accurate NXB2 〈http://simbad.u-strasbg.fr/Simbad/〉.
estimate, we filtered the night Earth data so that the cut-offrigidity distribution was the same for the HESS J1616, BGD 1and BGD 2 spectra (Koyama et al. 2007), and extracted theNXB spectra using the same regions in detector coordinates(DETX/Y). The thus-made NXB spectra were subtracted fromthe HESS J1616, BGD 1, and BGD 2 spectra; the resultingspectra are plotted in figure 4, where the BGD 1 and BGD 2spectra are renormalized to compensate for the difference inthe area of the spectral extraction regions.
Figure 5 is the ratio of the spectrum of the HESS J1616region to those of the background regions. The ratio is largerthan unity below 4 keV, while it is close to unity in the 4–8 keVband. The ratio becomes noisy above 8 keV, where the NXBdominates the high-energy band.
The most likely origin for the soft band excess in theHESS J1616 region is the nearby SNR RCW 103. Here,we consider whether instrumental effects, i.e., the tail of thepoint spread function (PSF) and stray light of the XRT, mightbe the cause. The HESS J1616 region spectrum exhibitsemission lines at 0.83 keV, 0.92 keV, 1.02 keV, and 1.35 keV,which are attributed to Fe XVII, Ne IX, Ne X, and Mg XI, respec-tively, and strongly indicate thermal plasma emission. Thistype of soft spectrum resembles that of RCW 103. Usingxissim we simulated how many photons would fall into theHESS J1616 region from RCW 103, which has a radius of∼ 5′ and is centered 13′ from the HESS J1616 region. In thesimulation, we employed a nonequilibrium ionization plasmamodel with temperature kT = 0.3 keV, column density NH =7× 1021 cm−2, and ionization parameter nt = 6× 103 cm−3 yrfor the spectrum of RCW 103 (Gotthelf et al. 1997). As forthe metal abundances, we set them to 0.5-times the cosmicvalues (Anders, Grevesse 1989). The flux of RCW 103 was setto 1.8 × 10⁻¹⁰ erg s−1 cm−2 in the 0.6–2.0 keV band (Tuohy,Garmire 1980) and the Chandra ACIS image of RCW 103(from ObsID 123) was used as the input surface brightnessdistribution. The simulation predicted count rates of 1.6 ×10⁻³ c s−1 (FI) and 2.4 × 10⁻³ c s−1 (BI) in the 0.6–2.0 keVband. The measured FI count rate from the HESS J1616spectrum is 4.6×10⁻² cs−1 with an error of ±0.1×10⁻² cs−1

No. 1] Dark Accelerator HESS J1616−508 S203
Fig. 4. XIS spectra from the HESS J1616, BGD 1, and BGD 2 regions: (a) combined FI spectra (XIS 0 + XIS 2 + XIS 3), and (b) BI spectra (XIS 1).Non-X-ray backgrounds were subtracted as described in the text. Error bars on the data points are plotted at the 1σ confidence level.
S204 H. Matsumoto et al. [Vol. 59,
Fig. 5. Ratio of the spectra shown in figure 4. Errors on the datapoints are 1σ .
Table 2. Best-fit parameters for the model fitting.
Background∗ BGD 1 BGD 2
NH (1021 cm−2) 1.68 + 0.47−0.49 4.13 + 0.45
−0.45
kT (keV) 0.59 + 0.019−0.017 0.30 + 0.018
−0.015
Abundance (cosmic) 0.50 (fixed) 0.50 (fixed)f APEC
x (0.6–2 keV)† 7.05× 10⁻¹³ 7.55× 10⁻¹³
Γ‡ 2.0 (fixed) 2.0 (fixed)Normalization (10−5)§ 7.74 + 2.73
−2.83 9.00 + 2.88−2.92
χ2/d.o.f . 273.11/232 276.45/232∗ Data used for background in the spectral fitting.† Flux (erg s−1 cm−2) of the APEC model in the 0.6–2 keV band (uncor-
rected for absorption).‡ Photon index of the power-law model.§ Normalization of the power-law model defined as the differential photon
number flux (i.e., photons keV−1 s−1 cm−2) at 1 keV. Errors are quotedat the 99% confidence level.
depending on the background data set used. The BI countrate is 9.4 × 10⁻² c s−1 with the same uncertainty. These aremore than a factor of 10 higher than predicted from the instru-mental effects alone, suggesting that the observed soft emissionin the HESS J1616 region may have an astrophysical origin.However, the current calibrations of the PSF tail and straylight at large off-axis angles have large systematic errors. Amore detailed understanding of the XRT will be needed beforedrawing more definitive conclusions about the putative softemission, and that is beyond the scope of this paper.
Since the spectral ratio becomes noisy above 8 keV, weexamined the ratio of HESS J1616 to BGDs from 4 to8 keV. The average of the ratio and its 99% confidencerange is found to be 1.10 + 0.11
−0.11 and 1.07 + 0.12−0.11 in the cases of
HESS J1616/BGD 1 and HESS J1616/BGD 2, respectively.Thus we cannot conclude a positive detection of hard X-rayemission from HESS J1616 at the 99% confidence level withthe current statistics of the Suzaku XIS data.
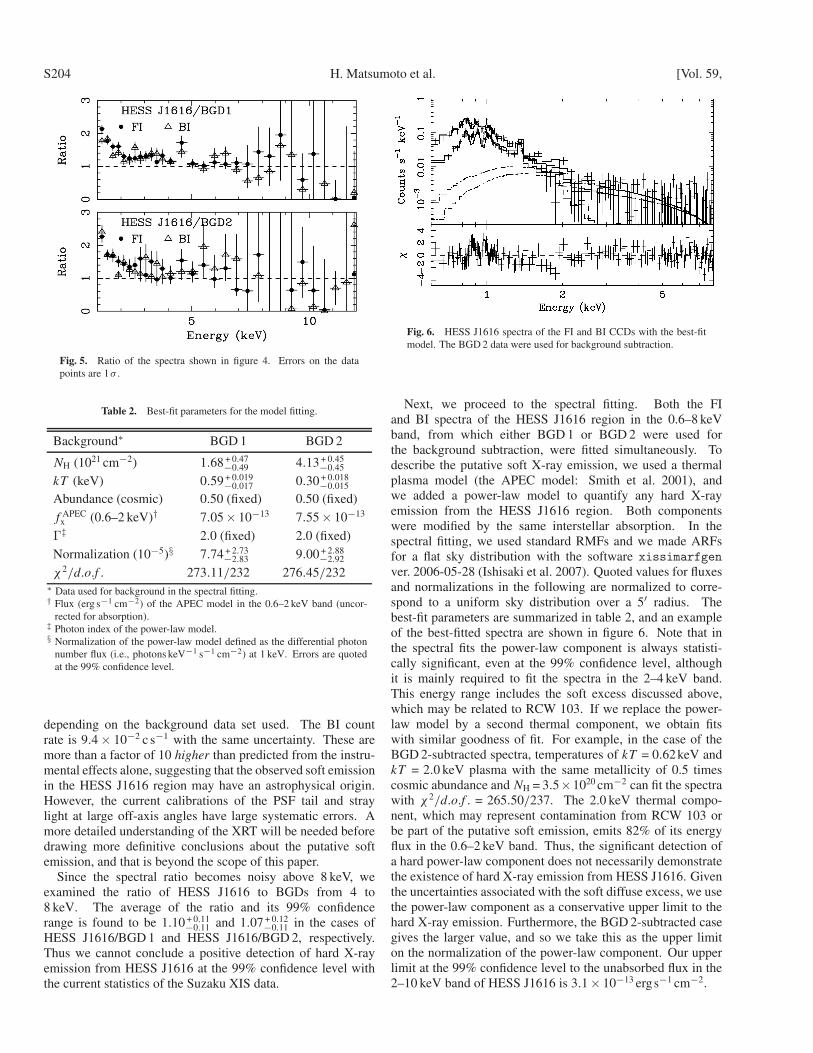
Fig. 6. HESS J1616 spectra of the FI and BI CCDs with the best-fitmodel. The BGD 2 data were used for background subtraction.
Next, we proceed to the spectral fitting. Both the FIand BI spectra of the HESS J1616 region in the 0.6–8 keVband, from which either BGD 1 or BGD 2 were used forthe background subtraction, were fitted simultaneously. Todescribe the putative soft X-ray emission, we used a thermalplasma model (the APEC model: Smith et al. 2001), andwe added a power-law model to quantify any hard X-rayemission from the HESS J1616 region. Both componentswere modified by the same interstellar absorption. In thespectral fitting, we used standard RMFs and we made ARFsfor a flat sky distribution with the software xissimarfgenver. 2006-05-28 (Ishisaki et al. 2007). Quoted values for fluxesand normalizations in the following are normalized to corre-spond to a uniform sky distribution over a 5′ radius. Thebest-fit parameters are summarized in table 2, and an exampleof the best-fitted spectra are shown in figure 6. Note that inthe spectral fits the power-law component is always statisti-cally significant, even at the 99% confidence level, althoughit is mainly required to fit the spectra in the 2–4 keV band.This energy range includes the soft excess discussed above,which may be related to RCW 103. If we replace the power-law model by a second thermal component, we obtain fitswith similar goodness of fit. For example, in the case of theBGD 2-subtracted spectra, temperatures of kT = 0.62keV andkT = 2.0 keV plasma with the same metallicity of 0.5 timescosmic abundance and NH = 3.5×1020 cm−2 can fit the spectrawith χ2/d.o.f . = 265.50/237. The 2.0 keV thermal compo-nent, which may represent contamination from RCW 103 orbe part of the putative soft emission, emits 82% of its energyflux in the 0.6–2 keV band. Thus, the significant detection ofa hard power-law component does not necessarily demonstratethe existence of hard X-ray emission from HESS J1616. Giventhe uncertainties associated with the soft diffuse excess, we usethe power-law component as a conservative upper limit to thehard X-ray emission. Furthermore, the BGD 2-subtracted casegives the larger value, and so we take this as the upper limiton the normalization of the power-law component. Our upperlimit at the 99% confidence level to the unabsorbed flux in the2–10 keV band of HESS J1616 is 3.1× 10⁻¹³ ergs−1 cm−2.

No. 1] Dark Accelerator HESS J1616−508 S205
Fig. 7. MOS 1 + 2 2.0–7.0 keV image smoothed with a Gaussian kernel of σ = 10′′. Lines of constant galactic latitude and longitude are plotted andlabeled in the interior of the figure. Plotted are the FOVs of the XIS observations (dashed-line squares), the XIS spectral region (thick circle), detectedpoint sources (plus marks), and the source and background spectral regions (solid and dashed thin circles, respectively). Projection profile in figure 8 ismade along the strip AA′.
3.3. XMM-Newton Analysis
XMM-Newton (Aschenbach et al. 2000) pointed at theX-ray pulsar, PSR J1617−5055, on 2001 September 3(ObsID: 0113050701), and this observation partly covered theHESS J1616 region with the EPIC instrument (Struder et al.2001; Turner et al. 2001). We also analyzed the XMM-Newtondata to check for consistency with the Suzaku results.
The pn camera was operated in the timing mode during thisobservation, and the data had no imaging information. Onthe other hand, the MOS 1 and MOS 2 cameras were operatedin the standard full-frame mode using the medium filter. Wetherefore analyzed only the MOS data. We used the StandardAnalysis System (SAS) software version 6.0.5 for event selec-tion. From the detected MOS events, we selected those withPATTERN keywords between 0 and 12 as valid X-ray events.Time intervals of high and flaring background were rejectedby removing times when the 10–12 keV count rate was higherthan 0.15cs−1 in the full field of view. The resultant exposuretime was 13 ks for each MOS camera.
Figure 7 shows the combined MOS 1 and MOS 2 image inthe 2.0–7.0 keV band. We see no significant excess emission
at the position of HESS J1616. Because of its higher spatialresolution, the EPIC observation is more sensitive to pointsources than the XIS observation even given the shorterexposure time. We therefore searched for X-ray point sourcesin the combined MOS 1 + MOS 2 2.0–7.0 keV image usingemldetect in the SAS software package. In the emldetectsoftware, the source significance was determined by comparingthe numbers of photons in 68% encircled energy regions tothose in the background map, which was prepared using theesplinemap software. The likelihood limit was taken to be10, corresponding roughly to 4σ detection. The detected pointsources, excluding those within RCW 103, are shown withplus marks in figure 7. Only one point source was detectedat the edge of the XIS spectral region for HESS J1616, butits flux in the 2–10 keV band is 2.2 × 10⁻¹⁴ erg s−1 cm−2,which is smaller than the XIS upper limit for the hard X-rayemission from HESS J1616 by more than a factor of 10.A source was also found at around the center of the BGD 2region, but we had already excluded it from the XIS analysisas Suzaku J1617−5044.
The detection limit, Slim, in the 2–10 keV band of this searchfor point sources at the 4 σ confidence level was calculated

S206 H. Matsumoto et al. [Vol. 59,
Fig. 8. MOS 1 + 2 projection profiles in the 0.6–3 keV and 3–7 keVbands along the strip AA′ in figure 7.
using the formula Slim ≤ (4r√
πb)/
(0.68f T ), where b isthe surface brightness of the background map, r is the radiusof the 68% encircled region, f is a counts-to-flux conver-sion factor (ECF) of 3.8 × 10¹⁰ c cm−2 erg−1, and T is the“effective” exposure-time corrected for the vignetting. Forpoint sources, we obtained Slim = 2×10⁻¹⁴ ergs−1 cm−2 at thecenter of the XMM field of view, while at the center of theXIS field of view, which is ∼ 9′ away from the optical axis,Slim = 3× 10⁻¹⁴ ergs−1 cm−2.
We made photon count profiles along the strip AA′ infigure 7 in the 0.6–3 keV and 3–7 keV band (figure 8). Note thatNXB subtraction and vignetting corrections were not appliedto the profile. As a reference, we also plot the PSF 3 at theposition of the RCW 103 rim (∼ 6′ away from the optical axis)plus constant profile in the figure. The difference between thesoft and hard band profiles shows an extended soft X-ray halosurrounding RCW 103, qualitatively supporting the soft excessseen in the Suzaku data.
We also searched for larger scale X-ray emission at theposition of HESS J1616 in the EPIC data. Source andbackground spectra were extracted from the circular regions(5′ radii) shown in figure 7 (the solid and dashed thin circles,respectively). The background region was chosen to be atthe same galactic latitude as the source region so that differ-ences in galactic diffuse emission (Kaneda et al. 1997) wouldbe minimized. The point sources detected in the sourceand background region were excluded with 2′′ radius circles.MOS 1 and MOS 2 spectra were co-added. To avoid anyinfluence of the putative soft emission, we ignored the databelow 3 keV and fitted the spectrum in the 3–7 keV bandwith a power-law model of a photon index Γ = 2. The 99%confidence limit on the power-law normalization is < 2.66 ×10⁻⁴. The XMM-Newton data thus set an upper limit of6.9×10−13 ergs−1 cm−2 on the flux of the hard X-ray emissionfrom HESS J1616 in the 2–10 keV band. This upper limit istwo-times larger than the Suzaku result.3 In XMM-SOC-CAL-TN-0022 at 〈http://xmm.esac.esa.int/external/
xmm sw cal/calib/documentation/index.shtml#XRT〉.
4. Discussion
Neither the Suzaku nor the XMM-Newton data provideevidence for hard X-ray emission from HESS J1616; the XISsets the most stringent upper limit of 3.1× 10⁻¹³ ergs−1 cm−2
in the 2–10 keV band. The differential photon flux in the TeVγ -ray regime can be represented by a power-law of photonindex of Γ = 2.35 with a total photon flux of (43.3 ± 2.0) ×10−12 cm−2 s−1 above 200 GeV (Aharonian et al. 2006). Thiscorresponds to an energy flux of 1.7 × 10⁻¹¹ erg s−1 cm−2 inthe 1–10 TeV band. The ratio of the TeV γ -ray flux to theX-ray flux (fTeV/fX) is therefore more than ∼ 55. Table 3 isa list of spatially extended VHE objects with X-ray observa-tions that we extracted from the H.E.S.S. source catalog.4 Wealso added TeV J2032 + 4130 (Aharonian et al. 2002) to the list.Although recent Swift observations found possible counter-parts of HESS 1614−518 and HESS J1834−087 (Landi et al.2006), we do not include them in table 3, since their X-raydata are not statistically enough for spectroscopy. Note thatthe X-ray counterparts in the list are not secure. For example,AX J1838.0−0655 is the most promising candidate counter-part of HESS J1837−069 (Aharonian et al. 2005a, 2006), butit is slightly outside of the HESS source extension (Landiet al. 2006). HESS J1616 has the most stringent X-ray fluxupper limit among the VHE objects; yet of more import is itsextremely large flux ratio, fTeV/fX, compared to the others.Evidently HESS J1616 is a very peculiar object. The brightTeV γ -ray emission strongly suggests the presence of someparticle acceleration processes there; however HESS J1616emits little X-ray (or lower frequency radiation) emissionand thus remained undiscovered prior to the HESS survey.HESS J1616 is thus a strong candidate for being a “darkparticle accelerator.”
Assuming the origin of the TeV γ -rays to be IC scatteringof the cosmic microwave background by accelerated electrons,we can calculate the synchrotron emission from these electronsassuming magnetic field values of B = 10, 1, and 0.1 µG(figure 9). The Suzaku flux limit requires that the magneticfield in HESS J1616 be less than a few microgauss, which is thetypical interstellar value, and far below the estimated magneticfield values in other HESS sources, such as RX J0852−4622and RX J1713.7−3946. Thus, other mechanisms for the TeVemission may be required. Aharonian et al. (2006) proposed anasymmetric undetected pulsar wind nebula (PWN) powered bythe young pulsar PSR J1617−505, which is ∼ 13′ away fromHESS J1616, to explain the TeV emission. The spin-downluminosity of PSR J1617−505 is 1.6×1037 ergs−1 (Torii et al.1998), and in this case the luminosity of the PWN is expectedto be ∼ 1034 ergs−1 (Cheng et al. 2004) in the 2–10 keV band.Assuming the pulsar distance to be 3.3 kpc (Torii et al. 1998),we obtain an unabsorbed flux of 7.6×10⁻¹² ergs−1 cm−2 in the2–10 keV band. To reconcile this high flux and the XIS upperlimit, we would need an absorption of NH > 2× 1024 cm−2 fora photon index of 2. Since the column density is more than10-times the absorption to the galactic center (Baganoff et al.2003), this seems to be an unlikely scenario to explain X andTeV emission. The high fTeV/fX ratio might be explained if4 〈http://www.mpi-hd.mpg.de/hfm/HESS/public/HESS catalog.htm〉.

No. 1] Dark Accelerator HESS J1616−508 S207
Table 3. Spatially extended VHE objects with X-ray observations.
Name Possible counterpart Type∗ ΓTeV† fTeV
‡ NH§ ΓX
‖ fX# fTeV/fX References∗∗
HESS J0852−463 RX J0852−4622 SNR 2.1 6.9 4 2.6 ∼ 10 ∼ 0.7 1, 2, 3HESS J1303−631 · · · ? 2.4 1.0 20 2.0 < 0.64 > 1.6 4, 5HESS J1514−591 PSR B1509−58 PWN 2.3 1.6 8.6 2.0 3.2 0.5 6, 7HESS J1632−478 AX J1631.9−4752 HMXB? 2.1 1.7 210 1.6 1.7 1.0 8, 9HESS J1640−465 G338.3−0.0 SNR 2.4 0.71 96 3.0 0.30 2.4 8, 10HESS J1713−397 RX J1713.7−3946 SNR 2.2 3.5 8 2.4 54 0.065 11, 12HESS J1804−216 Suzaku J1804−2142 ? 2.7 1.0 2 −0.3 0.025 40 8, 13HESS J1804−216 Suzaku J1804−2140 ? 2.7 1.0 110 1.7 0.043 23 8, 13HESS J1813−178 AX J1813−178 ? 2.1 0.89 110 1.8 0.70 1.3 8, 14HESS J1837−069 AX J1838.0−0655 ? 2.3 1.4 40 0.8 1.3 1.1 8, 15TeV J2032 + 4130 · · · ? 1.9 0.20 ? ? < 0.20 > 1.0 16
HESS J1616−508 · · · ? 2.4 1.7 4.1 2.0 < 0.031 > 55 This work∗ SNR = supernova remnant, PWN = pulsar wind nebula, HMXB = high mass X-ray binary.† Photon index of TeV spectra.‡ Unabsorbed flux in the 1–10 TeV band (in 10−11 ergs−1 cm−2).§ Column density for X-ray spectra (in 1021 cm−2).‖ Photon index of X-ray spectra.# Unabsorbed flux in the 2–10 keV band (in 10−11 ergs−1 cm−2).∗∗ (1) Aharonian et al. (2005c), (2) Slane et al. (2001), (3) our analysis of the ASCA archival data, (4) Aharonian et al. (2004a), (5) Mukherjee, Halpern (2005),
(6) Aharonian et al. (2005b), (7) DeLaney et al. (2006), (8) Aharonian et al. (2006), (9) Rodriguez et al. (2003), (10) Sugizaki et al. (2001), (11) Aharonianet al. (2004b), (12) Slane et al. (1999), (13) Bamba et al. (2007), (14) Brogan et al. (2005), (15) Bamba et al. (2003a), and (16) Aharonian et al. (2002).
Fig. 9. Spectral energy distribution of HESS J1616 from the X-rayto TeV γ -ray bands. The synchrotron radiation from acceleratedelectrons, which boost the 3 K background up to the TeV energy range,is plotted toward the left for three different values of the magnetic field.
HESS J1616 is an old SNR, since TeV and X-ray emissionsare dominated by hadronic processes and synchrotron radiationfrom secondary electrons, respectively (Yamazaki et al. 2006).In any case, it remains highly desirable to obtain detailed dataof the HESS J1616 region at other wavelengths, especially theradio band, to detect the synchrotron emission from the accel-erated electrons.
We found extended soft X-ray emission, suggesting athermal plasma with kT ∼ 0.5 keV both in the Suzaku andXMM spectra. Both the temperature and the projection profilesof the soft band images (figures 3 and 8) imply a close
relationship between the soft emission and RCW 103. Thebest-fit NH of 2–4 × 1021 cm−2 in table 2 also support theconnection, since these values are close to those obtained withthe ASCA spectra (Gotthelf et al. 1997). The XMM-Newtonprofile (figure 8) suggests that it extends up to 15′ from thecentral point source, 1E 161348−5055, which is two-times aslarge as the radius of RCW 103. Although we cannot fullyreject this possibility, at least for the Suzaku data, that thissoft emission can be explained by an instrumental effect, thepresence of this emission in the XMM-Newton data arguesstrongly for an astrophysical origin.
Many bright X-ray sources in the galactic plane havespatially extended X-ray halos, caused by the scattering ofX-rays into our line of sight by interstellar dust between usand the object (Predehl, Schmitt 1995). The fact that the hardband profile of XMM-Newton does not extend beyond the rimof RCW 103 may support the dust halo hypothesis, since thescattering cross section (σdust) depends strongly on the photonenergy as σdust ∝E−2 (Predehl, Schmitt 1995). We will addressthe soft emission again in the future when the calibrations havebecome much robust. With careful work it may be possibleto model the soft extended contamination over the region ofHESS J1616 and further reduce the hard band X-ray flux limit.
5. Summary
We observed a bright TeV γ -ray object, HESS J1616, withthe Suzaku XIS for 45 ks. There was no positive detec-tion of hard X-ray emission, and we set an upper limit of3.1 × 10−13 erg s−1 cm−2 to the 2–10 keV band flux. Wealso analyzed the XMM-Newton data of a 13 ks observa-tion, and obtained a two-times higher upper limit of 6.9 ×10⁻¹³ ergs−1 cm−2. The deeper exposure and low background

S208 H. Matsumoto et al.
performance of Suzaku explain this difference. The unusuallyhigh value of fTeV/fX > 55 makes HESS J1616 a very peculiarobject. We also found diffuse X-rays consistent with thermalemission at kT ∼ 0.3–0.6keV extending over this region fromthe SNR RCW 103. This emission is likely to be the result ofscattering of X-rays from RCW 103 by interstellar dust.
The authors are grateful to Professors W. Hoffman andS. Funk for kindly providing the HESS image. We thank
Professors H. Kunieda for his useful comments. We alsothank all Suzaku members. This work is supported by aGrant-in-Aid for the 21st Century COE “Center for Diversityand Universality in Physics” from the Ministry of Education,Culture, Sports, Science and Technology (MEXT). HMis also supported by the MEXT, Grant-in-Aid for YoungScientists (B), 1874015, 2006. JPH acknowledges supportfrom NASA grant NNG05GP87G.
References
Aharonian, F., et al. 2002, A&A, 393, L37Aharonian, F., et al. 2004a, A&A, 425, L13Aharonian, F., et al. 2005a, Science, 307, 1938Aharonian, F., et al. 2005b, A&A, 435, L17Aharonian, F., et al. 2005c, A&A, 437, L7Aharonian, F., et al. 2006, ApJ, 636, 777Aharonian, F. A., et al. 2004b, Nature, 432, 75Anders, E., & Grevesse, N. 1989, Geochim. Cosmochim. Acta, 53,
197Aschenbach, B., et al. 2000, Proc. SPIE, 4012, 731Baganoff, F. K., et al. 2003, ApJ, 591, 891Bamba, A., et al. 2007, PASJ, 59, S209Bamba, A., Ueno, M., Koyama, K., & Yamauchi, S. 2003a, ApJ, 589,
253Bamba, A., Yamazaki, R., Ueno, M., & Koyama, K. 2003b, ApJ, 589,
827Bamba, A., Yamazaki, R., Yoshida, T., Terasawa, T., & Koyama, K.
2005, ApJ, 621, 793Brogan, C. L., Gaensler, B. M., Gelfand, J. D., Lazendic, J. S., Lazio,
T. J. W., Kassim, N. E., & McClure-Griffiths, N. M. 2005, ApJ,629, L105
Butt, Y. M., et al. 2003, ApJ, 597, 494Butt, Y. M., Drake, J., Benaglia, P., Combi, J. A., Dame, T., Miniati,
F., & Romero, G. E. 2006, ApJ, 643, 238Cheng, K. S., Taam, R. E., & Wang, W. 2004, ApJ, 617, 480DeLaney, T., Gaensler, B. M., Arons, J., & Pivovaroff, M. J. 2006,
ApJ, 640, 929Fujimoto, R., et al. 2007, PASJ, 59, S133Gotthelf, E. V., Petre, R., & Hwang, U. 1997, ApJ, 487, L175Hwang, U., Decourchelle, A., Holt, S. S., & Petre, R. 2002, ApJ, 581,
1101Ishisaki, Y., et al. 2007, PASJ, 59, S113Kaneda, H., Makishima, K., Yamauchi, S., Koyama, K., Matsuzaki,
K., & Yamasaki, N. Y. 1997, ApJ, 491, 638Katagiri, H., et al. 2005, ApJ, 619, L163Kokubun, M., et al. 2007, PASJ, 59, S53Koyama, K., et al. 2007, PASJ, 59, S23Koyama, K., Makishima, K., Tanaka, Y., & Tsunemi, H. 1986, PASJ,
38, 121
Koyama, K., Petre, R., Gotthelf, E. V., Hwang, U., Matsuura, M.,Ozaki, M., & Holt, S. S. 1995, Nature, 378, 255
Landi, R., et al. 2006, ApJ, 651, 190Lazendic, J. S., Slane, P. O., Gaensler, B. M., Reynolds, S. P.,
Plucinsky, P. P., & Hughes, J. P. 2004, ApJ, 602, 271Mitsuda, K., et al. 2007, PASJ, 59, S1Mori, H., et al. 2005, PASJ, 57, 245Mukherjee, R., & Halpern, J. P. 2005, ApJ, 629, 1017Mukherjee, R., Halpern, J. P., Gotthelf, E. V., Eracleous, M., &
Mirabal, N. 2003, ApJ, 589, 487Pannuti, T. G., Allen, G. E., Houck, J. C., & Sturner, S. J. 2003, ApJ,
593, 377Predehl, P., & Schmitt, J. H. M. M. 1995, A&A, 293, 889Revnivtsev, M., Sazonov, S., Gilfanov, M., Churazov, E., & Sunyaev,
R. 2006, A&A, 452, 169Rodriguez, J., Tomsick, J. A., Foschini, L., Walter, R., Goldwurm, A.,
Corbel, S., & Kaaret, P. 2003, A&A, 407, L41Serlemitsos, P. J., et al. 2007, PASJ, 59, S9Slane, P., Gaensler, B. M., Dame, T. M., Hughes, J. P., Plucinsky, P. P.,
& Green, A. 1999, ApJ, 525, 357Slane, P., Hughes, J. P., Edgar, R. J., Plucinsky, P. P., Miyata, E.,
Tsunemi, H., & Aschenbach, B. 2001, ApJ, 548, 814Smith, R. K., Brickhouse, N. S., Liedahl, D. A., & Raymond, J. C.
2001, ApJ, 556, L91Struder, L., et al. 2001, A&A, 365, L18Sugizaki, M., Mitsuda, K., Kaneda, H., Matsuzaki, K., Yamauchi, S.,
& Koyama, K. 2001, ApJS, 134, 77Takahashi, T., et al. 2007, PASJ, 59, S35Torii, K., et al. 1998, ApJ, 494, L207Tuohy, I., & Garmire, G. 1980, ApJ, 239, L107Turner, M. J. L., et al. 2001, A&A, 365, L27Ubertini, P., et al. 2005, ApJ, 629, L109Vink, J., & Laming, J. M. 2003, ApJ, 584, 758Worrall, D. M., Marshall, F. E., Boldt, E. A., & Swank, J. H. 1982,
ApJ, 255, 111Yamaguchi, H., et al. 2006, Proc. SPIE, 6266, 121Yamauchi, S., & Koyama, K. 1993, ApJ, 404, 620Yamazaki, R., Kohri, K., Bamba, A., Yoshida, T., Tsuribe, T., &
Takahara, F. 2006, MNRAS, 371, 1975