techniques from red hat performance analysispeople.redhat.com/jeder/201503-trilug.pdf · red hat...
TRANSCRIPT

Red Hat Performance Engineering | Jeremy Eder
Performance Analysis Techniques from Red Hat
@jeremyeder
Red Hat Performance Engineering | Jeremy Eder
Agenda
● Who we are● Approach to Performance Analysis● Evolution of Performance in RHEL● Subsystem Analysis● Tuned● Future Plans

Who we are
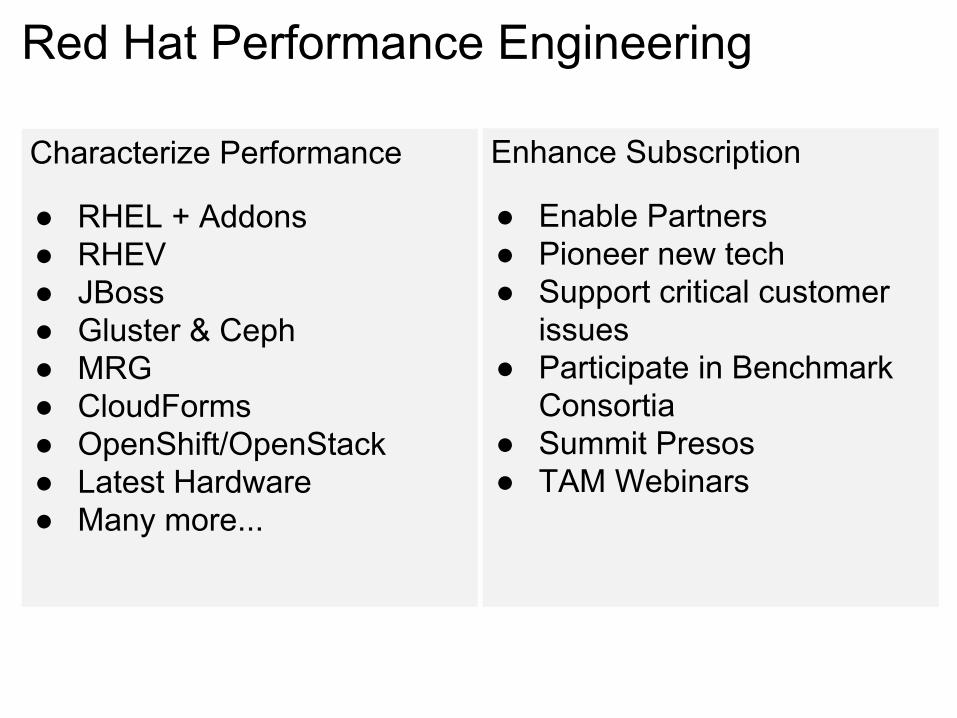
Red Hat Performance Engineering
Enhance Subscription
● Enable Partners● Pioneer new tech● Support critical customer
issues● Participate in Benchmark
Consortia● Summit Presos● TAM Webinars
Characterize Performance
● RHEL + Addons● RHEV● JBoss● Gluster & Ceph● MRG● CloudForms● OpenShift/OpenStack● Latest Hardware● Many more...

Partner with Engineering teams
● Evaluate experimental patches, upstream backports [slab/slub, pre-warm migrate, loopback bypass]
● Provide feedback to developers on what's working and what's not
● Provide guidance in early planning/dev phase, embedded in team [kvm, RHS, OpenShift]

Approach toPerformance Analysis

Red Hat Performance Engineering | Jeremy Eder
Approach to Performance Analysis
Red Hat Performance Engineering | Jeremy Eder
Approach to Performance Analysis
● Test for limits● Quantify overheads● See what breaks● Assemble/ship and document tuning advice● Adapt tests to container-friendly patterns
Red Hat Performance Engineering | Jeremy Eder
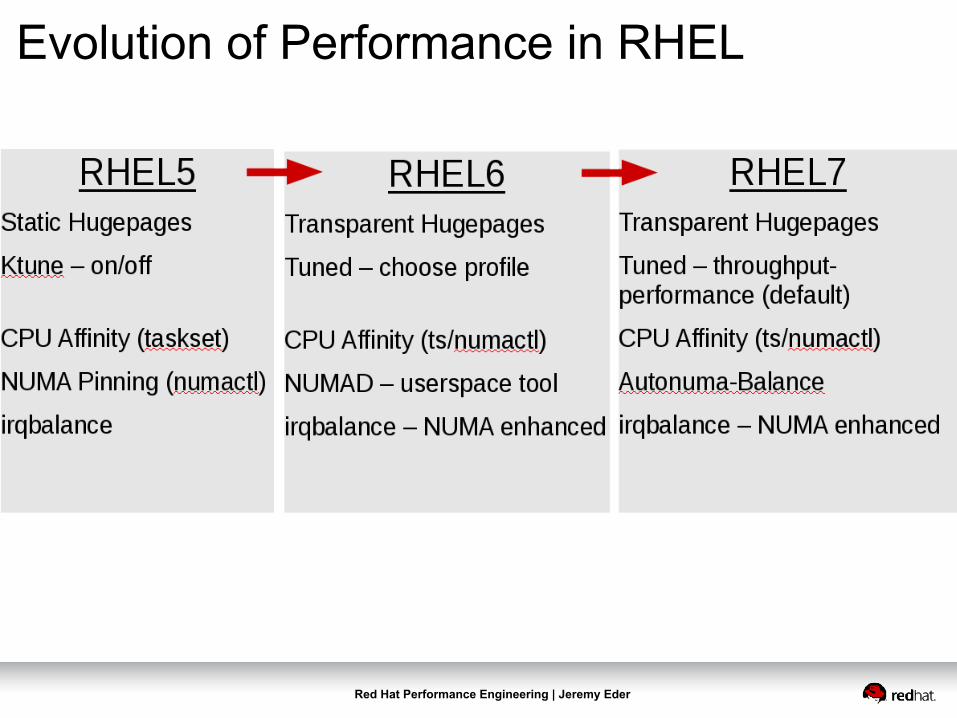
Evolution of Performance in RHEL

Subsystem Analysis

Red Hat Performance Engineering | Jeremy Eder
NUMA Topology: lstopo

Red Hat Performance Engineering | Jeremy Eder
Subsystem Analysis: Disk# iostat -N 1Linux 3.10.0-229.el7.x86_64 (jerms-lab7.perf.lab.eng.rdu.redhat.com)
03/12/2015 _x86_64_ (24 CPU)
avg-cpu: %user %nice %system %iowait %steal %idle 0.03 0.00 0.01 0.00 0.00 99.95
Device: tps kB_read/s kB_wrtn/s kB_read kB_wrtnvda 5.42 17.19 59.87 19633224 68398872vdb 0.46 0.98 5.48 1119751 6263272vg0-swap 0.00 0.00 0.00 1008 0vg0-root 5.46 17.18 59.87 19625293 68396764
avg-cpu: %user %nice %system %iowait %steal %idle 0.04 0.00 0.71 3.31 0.00 95.94
Device: tps kB_read/s kB_wrtn/s kB_read kB_wrtnvda 7043.00 0.00 12326.00 0 12326vdb 0.00 0.00 0.00 0 0vg0-swap 0.00 0.00 0.00 0 0vg0-root 7042.00 0.00 12322.00 0 12322

Red Hat Performance Engineering | Jeremy Eder
Subsystem Analysis: Memory# vmstat 1
procs -----------memory---------- ---swap-- -----io---- -system-- ------cpu----- r b swpd free buff cache si so bi bo in cs us sy id wa st 2 0 0 25554152 986896 13833932 0 0 0 0 307 266 0 1 99 0 0 1 0 0 24454408 986896 13833932 0 0 0 0 1286 548 0 4 96 0 0 1 0 0 23428300 986896 13833932 0 0 0 0 1288 508 0 4 96 0 0 1 0 0 22371768 986896 13833932 0 0 0 8 1120 150 0 4 96 0 0 1 0 0 21571872 986896 13833932 0 0 0 0 1162 305 1 4 96 0 0 1 0 0 21571872 986896 13833932 0 0 0 0 1040 67 4 0 96 0 0 1 0 0 21571872 986896 13833932 0 0 0 0 1067 90 4 0 96 0 0 1 0 0 21571872 986896 13833932 0 0 0 0 1045 70 4 0 96 0 0 0 0 0 25773696 986896 13833932 0 0 0 24 487 130 2 0 98 0 0
Red Hat Performance Engineering | Jeremy Eder
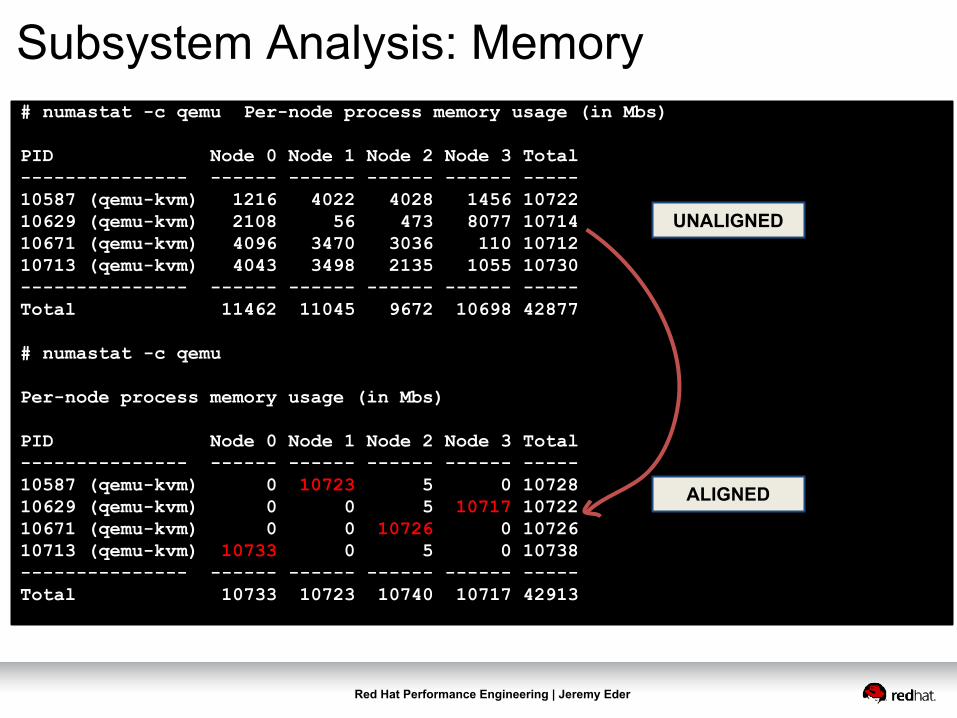
Subsystem Analysis: Memory# numastat -c qemu Per-node process memory usage (in Mbs)
PID Node 0 Node 1 Node 2 Node 3 Total--------------- ------ ------ ------ ------ -----10587 (qemu-kvm) 1216 4022 4028 1456 1072210629 (qemu-kvm) 2108 56 473 8077 1071410671 (qemu-kvm) 4096 3470 3036 110 1071210713 (qemu-kvm) 4043 3498 2135 1055 10730--------------- ------ ------ ------ ------ -----Total 11462 11045 9672 10698 42877
# numastat -c qemu
Per-node process memory usage (in Mbs)
PID Node 0 Node 1 Node 2 Node 3 Total--------------- ------ ------ ------ ------ -----10587 (qemu-kvm) 0 10723 5 0 1072810629 (qemu-kvm) 0 0 5 10717 1072210671 (qemu-kvm) 0 0 10726 0 1072610713 (qemu-kvm) 10733 0 5 0 10738--------------- ------ ------ ------ ------ -----Total 10733 10723 10740 10717 42913
UNALIGNED
ALIGNED

Red Hat Performance Engineering | Jeremy Eder
Subsystem Analysis: Memory# numastat -mczs
Per-node system memory usage (in MBs): Node 0 Node 1 Node 2 Node 3 Node 4 Node 5 Node 6 Node 7 Total ------ ------ ------ ------ ------ ------ ------ ------ ------MemTotal 32766 32768 32768 32768 32768 32768 32768 32752 262126MemFree 31863 31965 32120 32086 32098 32080 32114 32062 256388MemUsed 903 803 648 682 670 688 654 690 5738FilePages 11 26 8 37 21 18 9 45 176Slab 25 16 7 10 12 36 10 10 126Active 5 13 4 25 10 9 6 41 113Active(file) 4 11 3 23 8 6 3 40 99SUnreclaim 19 10 6 6 9 33 7 7 97Inactive 7 15 4 14 12 12 6 6 76Inactive(file) 7 15 4 14 12 12 6 6 76SReclaimable 7 6 2 4 3 3 3 2 29Active(anon) 2 1 1 2 2 2 3 2 14AnonPages 2 1 1 2 2 2 3 2 14Mapped 0 0 0 1 4 3 1 1 11KernelStack 9 0 0 0 0 0 0 0 10PageTables 0 0 0 0 1 1 0 1 3Shmem 0 0 0 0 0 0 0 0 0Inactive(anon) 0 0 0 0 0 0 0 0 0

Red Hat Performance Engineering | Jeremy Eder
Subsystem Analysis: CPU
# mpstat -P 1 104:27:56 PM CPU %usr %nice %sys %iowait %irq %soft %steal %guest %gnice %idle04:27:57 PM 1 0.00 0.00 0.00 0.00 0.00 0.00 0.00 0.00 0.00 100.0004:27:58 PM 1 73.27 0.00 0.00 0.00 0.00 0.00 0.00 0.00 0.00 26.7304:27:59 PM 1 100.00 0.00 0.00 0.00 0.00 0.00 0.00 0.00 0.00 0.0004:28:00 PM 1 100.00 0.00 0.00 0.00 0.00 0.00 0.00 0.00 0.00 0.0004:28:01 PM 1 100.00 0.00 0.00 0.00 0.00 0.00 0.00 0.00 0.00 0.0004:28:02 PM 1 100.00 0.00 0.00 0.00 0.00 0.00 0.00 0.00 0.00 0.0004:28:03 PM 1 26.00 0.00 1.00 0.00 0.00 0.00 0.00 0.00 0.00 73.0004:28:04 PM 1 0.00 0.00 0.00 0.00 0.00 0.00 0.00 0.00 0.00 100.00

Red Hat Performance Engineering | Jeremy Eder
Subsystem Analysis: Network

Red Hat Performance Engineering | Jeremy Eder
Subsystem Analysis: ALL
#<--------CPU--------> <----------Disks-----------> <----------Network---------> #<-----------Memory----------->
#cpu sys inter ctxsw KBRead Reads KBWrit Writes KBIn PktIn KBOut PktOut #Free Buff Cach Inac Slab Map
0 0 210 179 0 0 64 18 2 17 0 1 32355M 13M 52M 91M 63M 44M 0 0 202 150 0 0 32 10 1 14 0 1 32355M 13M 52M 92M 63M 44M 4 1 1678 2073 6876 650 108 14 10 50 5 33 32346M 14M 57M 98M 63M 44M 17 0 2348 183 0 0 36 10 2 14 0 3 32346M 14M 57M 98M 63M 44M 17 0 2361 216 0 0 32 10 1 17 0 1 32346M 14M 57M 98M 63M 44M 7 1 1760 1629 272 20 88356 282 11 63 6 46 32345M 14M 58M 96M 63M 44M 3 2 1691 2526 40 10 795720 2336 0 11 0 2 32344M 14M 58M 96M 63M 44M 3 2 1875 2856 28 7 924736 2714 2 18 0 3 32344M 14M 58M 96M 63M 44M 2 1 5137 5383 460 40 288836 851 35127 2583 161 2473 32345M 15M 58M 96M 63M 44M 4 3 16997 28627 0 0 56 10 245172 17629 1101 17088 32344M 15M 58M 96M 63M 44M 3 2 15619 28062 0 0 44 12 242954 17508 1087 16871 32345M 15M 58M 96M 63M 44M 6 2 4495 7098 104 3 80 9 51692 3781 240 3675 31804M 15M 58M 96M 63M 44M 17 5 2380 187 0 0 20 5 1 12 0 3 28287M 15M 59M 96M 64M 44M 17 5 2349 188 0 0 52 15 1 13 0 1 24805M 15M 59M 96M 64M 44M 17 5 2356 214 0 0 32 10 2 16 0 1 21284M 15M 59M 96M 64M 44M 17 5 2348 197 0 0 32 10 0 9 0 1 17436M 15M 59M 96M 64M 44M 9 3 1366 225 0 0 32 10 2 20 0 4 24766M 15M 59M 96M 64M 44M 1 0 465 516 8 2 992 169 2 25 1 15 32344M 15M 59M 96M 64M 44M 1 0 236 205 0 0 32 10 1 10 0 1 32344M 15M 59M 96M 64M 44M 0 0 217 185 0 0 32 10 1 14 0 1 32344M 15M 59M 96M 64M 44M
CPU
IOPS
NET
MEM

tuned
Red Hat Performance Engineering | Jeremy Eder
Tuned
● What is tuned...pronounced “tune-D”● Why was it created…
○ Why you should care ?● Tuned in Red Hat products● Tuned Profile Overview● Improve User Experience for your App
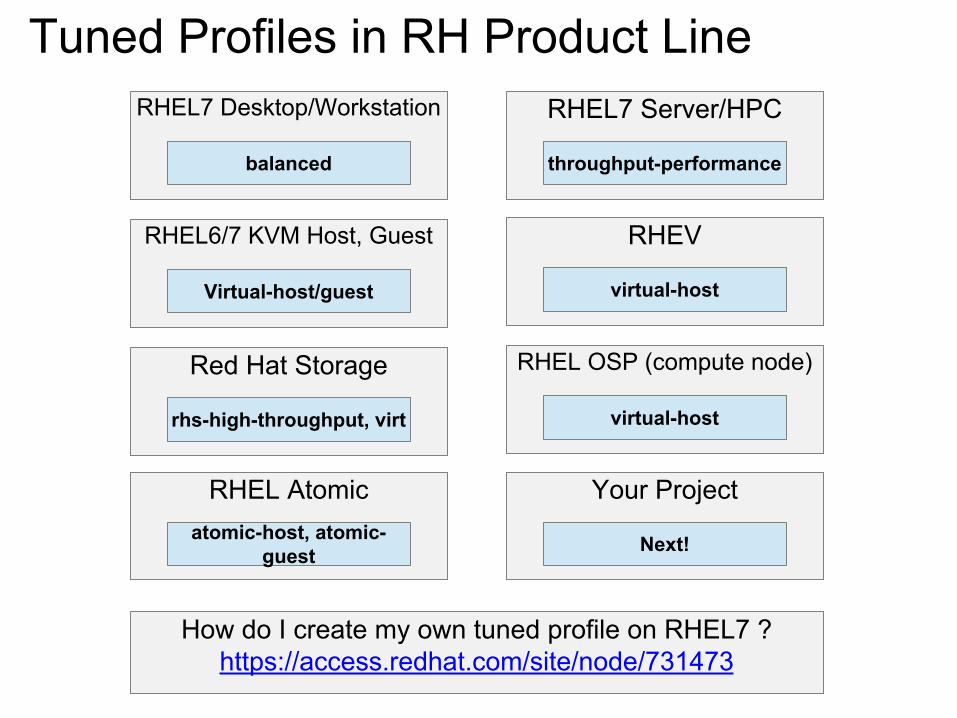
Tuned Profiles in RH Product LineRHEL7 Desktop/Workstation
balanced
RHEL6/7 KVM Host, Guest
Virtual-host/guest
Red Hat Storage
rhs-high-throughput, virt
RHEL Atomicatomic-host, atomic-
guest
RHEL7 Server/HPC
throughput-performance
RHEV
virtual-host
RHEL OSP (compute node)
virtual-host
Your Project
Next!
How do I create my own tuned profile on RHEL7 ?https://access.redhat.com/site/node/731473
Tuned: Updates for RHEL7
● Installed by default!● Profiles automatically set based on variant
(recommend.conf)● Optional hook/callout capability● Concept of Inheritance (just like httpd.conf)● Profiles updated for RHEL7 features and
characteristics● Added bash-completion :-)

Children
Parents
Tuned: Your Custom Profiles
latency-performancethroughput-performance
network-latencynetwork-throughput
virtual-host
virtual-guest
balanced
desktop
Your Database ProfileYour Web Profile Your Middleware Profile
Children/Grandchildren

Red Hat Performance Engineering | Jeremy Eder
Tuned Profile Inheritance

Overview of Performance Analysis Utilities
perf
perf
Userspace tool to read CPU counters and kernel tracepoints

perf list● List counters/tracepoints available
on your system

perf list● grep for something interesting,
maybe to see what numabalance is doing ?
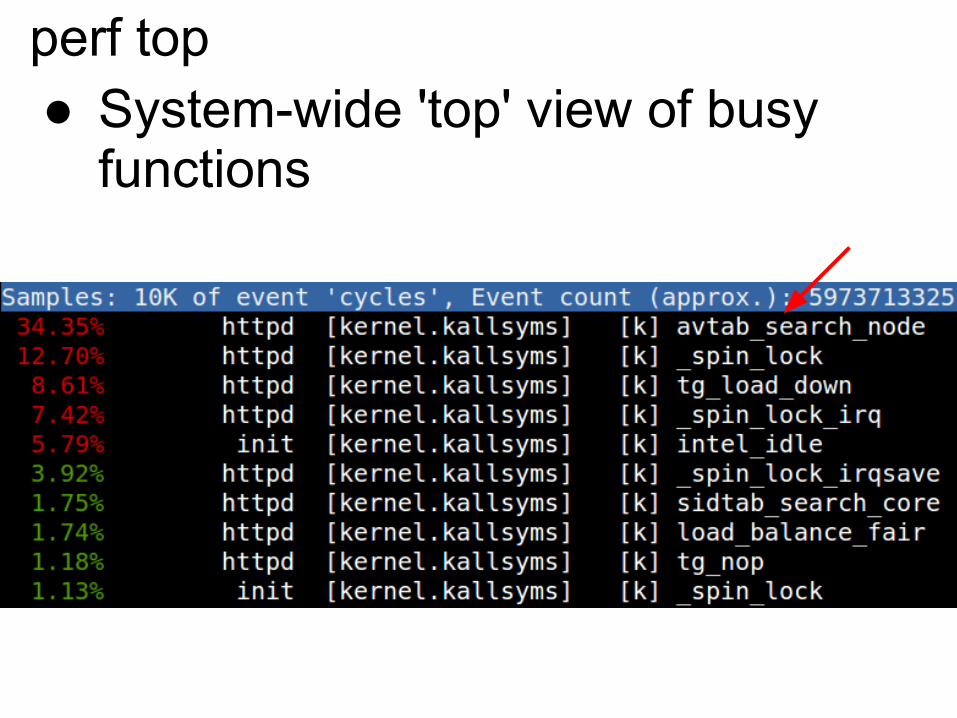
perf top● System-wide 'top' view of busy
functions
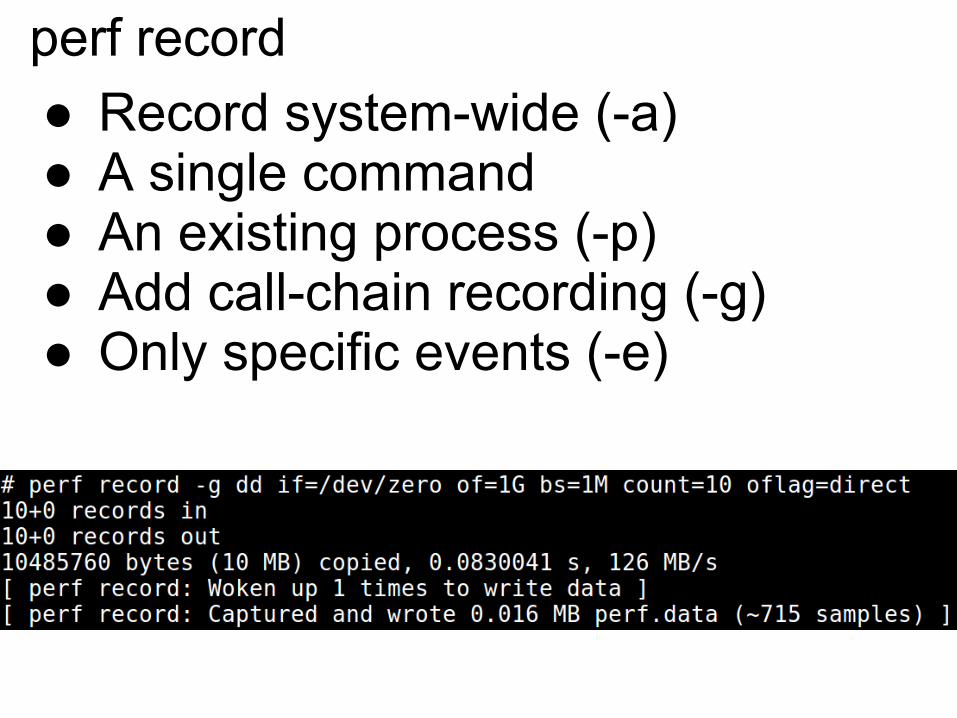
perf record● Record system-wide (-a)● A single command● An existing process (-p)● Add call-chain recording (-g)● Only specific events (-e)
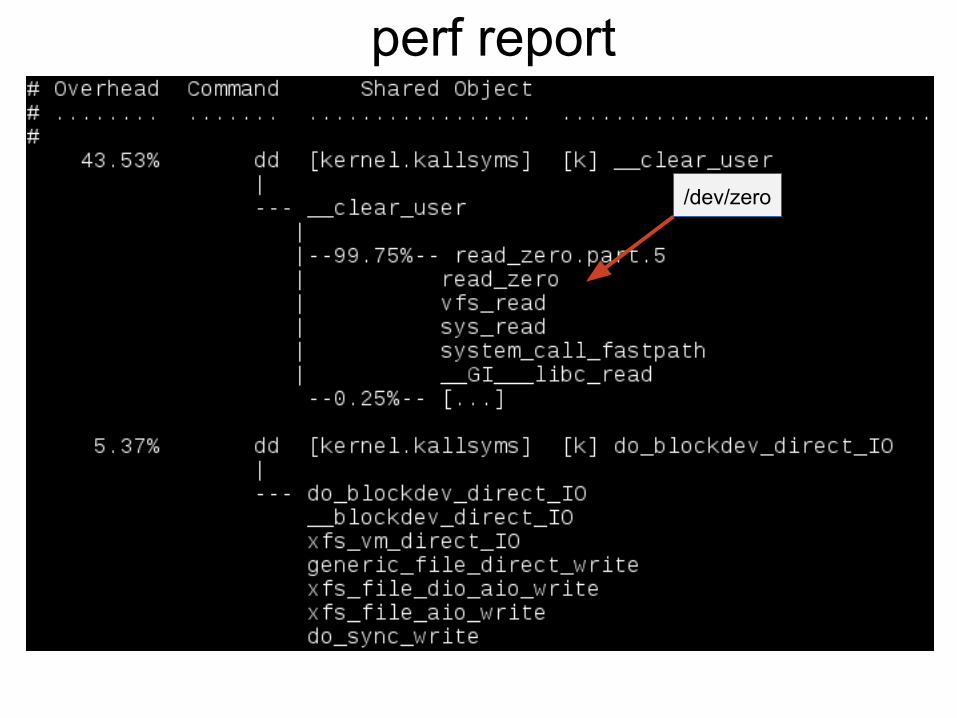
perf report
/dev/zero
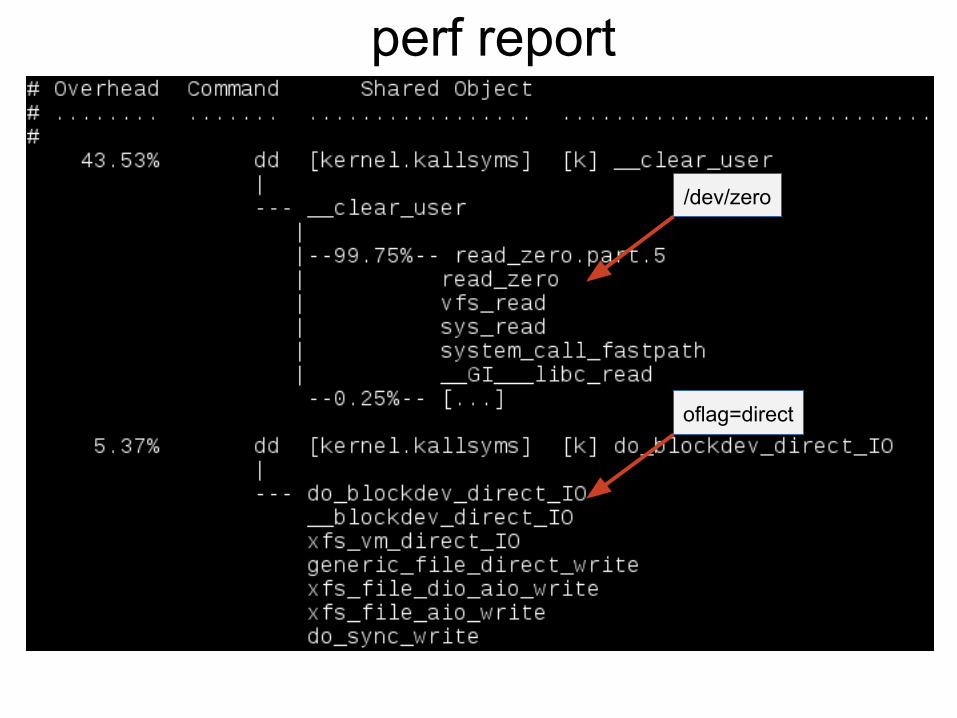
perf report
/dev/zero
oflag=direct

perf diff● Compare 2 perf recordings


Red Hat Performance Engineering | Jeremy Eder
Questions