the bank of nagoya, ltd. - 名古屋銀行 statements of cash flows 19 notes to consolidated...
TRANSCRIPT

Established 1949 Number of Employees 2,011 (As of March 31, 2014)
Subsidiaries
Nagoya Lease Co., Ltd. Nagoya Business Service Co., Ltd. Meigin Real Property Research Co., Ltd. Nagoya Card Co., Ltd. Nagoya MC Card Co., Ltd.
THE BANK OF NAGOYA, LTD. 19-17 Nishiki 3-chome, Naka-ku,
Nagoya City, Aichi 460-0003 Japan Tel: +81 52 962 9520 Fax: +81 52 961 6605 http://www.meigin.com/

Domestic Branches Number of Branches: 110 (As of March 31, 2014)
Overseas Nantong Branch
2nd Floor, Business Service Outsourcing Center, Building C, 188 Tongsheng Road, Economic and Technological Development Area, Nantong, Jiangsu, China Tel +86 513 89192280 Fax +86 513 89192281
Shanghai Representative Office Room 1809, Shanghai International Trade Center, 2201 Yan-an Road (West), Shanghai, China Tel +86 21 62754207 Fax +86 21 62759461
2 branches in Shizuoka
1 branch in Osaka
1 branch in Tokyo
104 branches in Aichi (54 branches in Nagoya City)
2 branches in Gifu
2 branches in Shizuoka
Contents
Message from the Management 1
Operating Environment 2
Operating Results (Nonconsolidated basis) 3
Medium- and Long-term Management Strategies 5
Issues to Address 6
Breakdown of Loans (Nonconsolidated basis) 8 Balance of problem loans under the Banking Act (risk monitored loans) 8 Balance of problem loans under the Financial Revitalization Act 9
Unrealized Gains on Securities (Nonconsolidated basis) 10
Capital Adequacy Ratio 10
Rating 10
Organization of the Bank 11
Board of Directors and Audit and Supervisory Board 12
Principal Shareholders 12
Independent Auditors’ Report 13
Consolidated Balance Sheets 14
Consolidated Statements of Income 16
Consolidated Statements of Changes in Net Assets 18
Consolidated Statements of Cash Flows 19
Notes to Consolidated Financial Statements 20

1
Message from the Management
We would first like to extend our sincere gratitude to all our stakeholders for their patronage to the Bank of Nagoya.
We will carry out the key points and the strategies of the 19th management plan “Change! Making Changes! A Fresh Start!”—Becoming a Bank Overflowing with Satisfaction, which we launched in the fiscal year ending March 31, 2015. Going forward, we will strive to provide even more useful information while responding to your opinions and requests. Also, in order to become a bank that treats customers with more sincerity than any other bank, cares about its customers more than any other bank, and is liked by everyone, all of the Bank’s executive officers and employees will make concentrated efforts to foster regional prosperity.
We will act suitably as a regional financial institution, and carry out stringent compliance and conduct business as people would expect of a bank like the Bank of Nagoya. As such, we greatly appreciate your even stronger support as we move forward.
June 2014
Kazumaro Kato Chairman Masahiro Nakamura
President

2
Operating Environment
In the final fiscal year of the 18th management plan, “Reform & Challenge—Aiming to be the Region’s Top Bank,” we advanced many new initiatives aimed at contributing to the region.
To begin with, we upgraded our core banking system, which the Bank develops on its own, and as a part of our effort to improve our level of customer service, we enabled customers to access their accounts almost 24 hours a day at convenience store ATMs as well as Japan Post Bank ATMs. Going forward, we will continue to flexibly and proactively offer services aimed at increasing the level of convenience for our customers.
Next, in order to invigorate the region’s economy, we launched the Bank of Nagoya Motto-Jimoto Startup Support Team, a one-stop service to provide financing and advice to customers who are launching a new business. Customers have told us that they want to first talk to us when they start a new business, and this has also raised our visibility.
The region is not only a center for manufacturing, but agriculture, forestry, and fisheries are also vibrant in this area. Aiming to support the further development of such industries, we teamed with seven local credit unions and others to establish the Aichi-Jimoto Fund for Agriculture, Forestry and Fisheries Investment Limited Partnership, which will support business diversification. Leveraging the distinct features of financial institutions with strengths in producers, processers, or retailers, we are aiming to expand markets and create new markets, and develop agriculture as a growth field. Even looking throughout Japan, it is quite rare for a large number of financial institutions to jointly establish an agricultural fund, and going forward we will work together to help the region.
In Aichi Prefecture, the Bank’s home, a number of large projects are scheduled to get underway over the next few years. One of these projects is the linear Chuo Shinkansen, which is slated to start service in 2027. This train will make it possible to travel from Shinagawa to Nagoya in roughly 40 minutes, will likely result in an even more dynamic flow of people and goods than before, and is expected to greatly contribute to the growth of the region. The Bank will keep its feet firmly planted in Aichi Prefecture, which appears to have a bright future in terms of both the economy and population, and will leverage the branch network of 104 branches in the prefecture. In addition, the roughly 2,800 executives and employees of the Bank will work as one and aim to be a bank needed by the region, using an “all-hands-in sales platform” that enables us to meet the diverse needs of our customers.
3
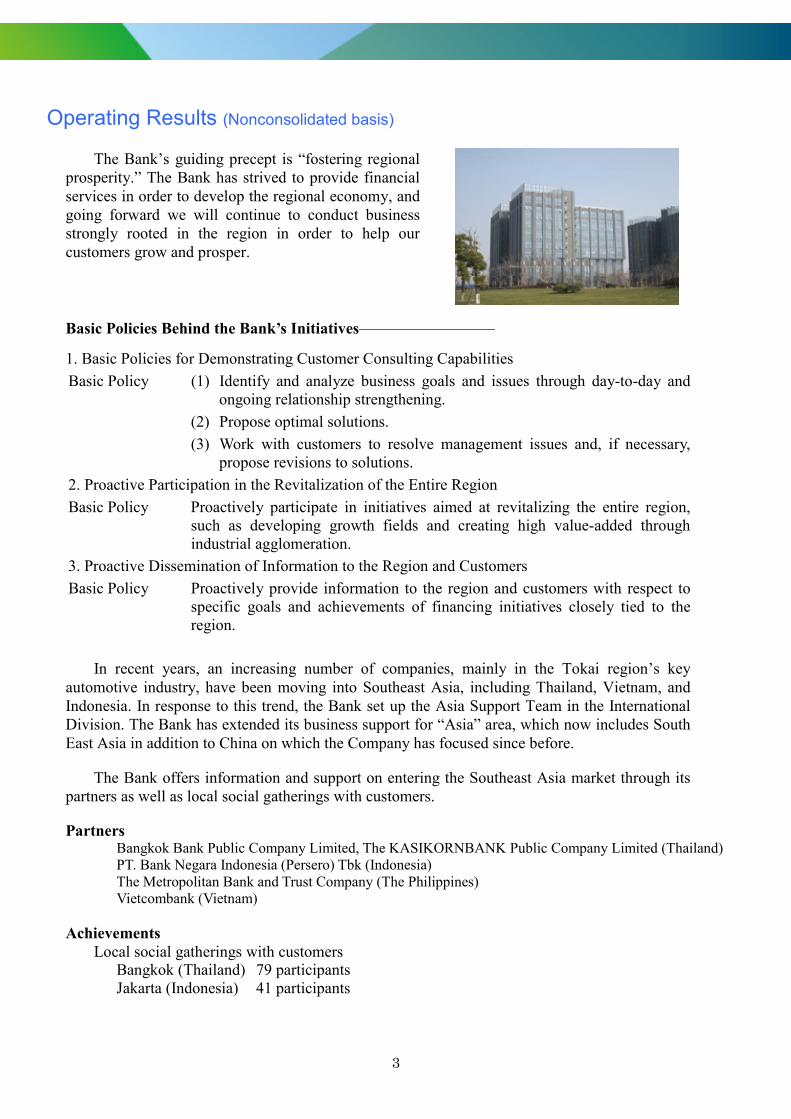
Operating Results (Nonconsolidated basis)
The Bank’s guiding precept is “fostering regional prosperity.” The Bank has strived to provide financial services in order to develop the regional economy, and going forward we will continue to conduct business strongly rooted in the region in order to help our customers grow and prosper.
Basic Policies Behind the Bank’s Initiatives–––––––––––––––––
1. Basic Policies for Demonstrating Customer Consulting Capabilities Basic Policy (1) Identify and analyze business goals and issues through day-to-day and
ongoing relationship strengthening. (2) Propose optimal solutions. (3) Work with customers to resolve management issues and, if necessary,
propose revisions to solutions. 2. Proactive Participation in the Revitalization of the Entire Region Basic Policy Proactively participate in initiatives aimed at revitalizing the entire region,
such as developing growth fields and creating high value-added through industrial agglomeration.
3. Proactive Dissemination of Information to the Region and Customers Basic Policy Proactively provide information to the region and customers with respect to
specific goals and achievements of financing initiatives closely tied to the region.
In recent years, an increasing number of companies, mainly in the Tokai region’s key
automotive industry, have been moving into Southeast Asia, including Thailand, Vietnam, and Indonesia. In response to this trend, the Bank set up the Asia Support Team in the International Division. The Bank has extended its business support for “Asia” area, which now includes South East Asia in addition to China on which the Company has focused since before.
The Bank offers information and support on entering the Southeast Asia market through its partners as well as local social gatherings with customers.
Partners Bangkok Bank Public Company Limited, The KASIKORNBANK Public Company Limited (Thailand) PT. Bank Negara Indonesia (Persero) Tbk (Indonesia) The Metropolitan Bank and Trust Company (The Philippines) Vietcombank (Vietnam)
Achievements Local social gatherings with customers
Bangkok (Thailand) 79 participants Jakarta (Indonesia) 41 participants

4
Bank of Nagoya Asia Business Club
The Bank operates the Bank of Nagoya Asia Business Club as an organization supporting customers conducting business in Asia.
* Club membership totaled 576 as of March 31, 2014
Nantong Branch
The Nantong Branch offers services including lending, deposits, and remittances, to customers’ local subsidiaries in China.
We utilize the Nantong Branch and the Shanghai Representative Office to provide support to customers entering the Chinese market. In September 2013, we held the “Factorynetwork Business Conference @ Shanghai.”
Achievements Number of participating companies: 603 (of which 17 companies from the Bank’s customer base) Number of visitors: 8,500
The Bank’s banking profit, which is the profit derived from its core operations, fell by ¥463 million year on year, to ¥9,079 million. The increase in income from government bonds and others as well as the reduction in expenses were offset by the decline in loan yields. Ordinary profit increased by ¥1,875 million year on year, to ¥8,966 million, owing to a decrease in credit-related expenses and an increase in gains on sales of stocks and other securities. Net income fell by ¥705 million, to ¥5,014 million, due to the posting of an extraordinary gain in the previous fiscal year in conjunction with the revision of the retirement benefit plan.

5
Medium- and Long-term Management Strategies We have established a shared vision as a part of the three-year 19th management plan
“Change! Making Changes! A Fresh Start!”—Becoming a Bank Overflowing with Satisfaction” starting in April 2014. In order to become a bank that treats customers with more sincerity than any other bank, cares about its customers more than any other bank, and is liked by everyone, all of the Bank’s executive officers and employees will make concentrated efforts to foster regional prosperity. Our main initiatives are as follows:
Building an All-Hands-In Sales Platform Through BPR
(1) Strengthen financial services functions (a) Strategy closely tied to the region (b) Non-face-to-face channel strategy (c) Branch strategy
(2) Enhance sales and consulting capabilities (a) CS strategy (b) Personnel development / ES strategy (c) Securities investment strategy

6
Issues to Address
In the 19th management plan which started from the fiscal year ending March 31, 2015, and to be more loyal to the Bank’s guiding precepts and principles, we decided to devote ourselves to a strategy of co-existing with the local community as a precondition for sustainable co-existence with society. We will aim to accurately identify customers’ needs and reform the Bank as a whole into a stronger, more flexible organization in which actions can be driven from the sales side.
Based on the principle of “fostering regional prosperity,” the Bank’s current challenge is to resolve a variety of issues and work symbiotically with the region to become a bank that is truly needed in the area. With this, and backed by the trust of the region, our market share will increase, and we will aim to secure growth that will last into the future.
Management Policy
Based on the guiding precept of “fostering regional prosperity—which shall both develop the Bank and bring happiness to bank employees,” the Bank’s management policy comprises the following five matters which cover the overall image of what the Bank aims to be: “Contribute to the regional community,” “Strengthen our earnings power and ensure thoroughness in risk management,” “Provide financial services that suit the needs of the customers,” “Put compliance into practice” and “Establish a free and open-minded corporate climate.” In accordance with this basic policy, we will strive to further increase our corporate value as a regional financial institution which fosters regional prosperity. At the same time, we will work to fulfill this duty and earn the unshakeable support and trust of our shareholders and all other stakeholders.

7
The Bank’s Corporate Governance
At the Bank of Nagoya, enhancing corporate governance is one of the most important management challenges. While striving to further enhance our corporate value as a regional financial institution that fosters regional prosperity, we shall fulfill our responsibilities as a corporate citizen and work to establish unshakeable support and trust from all stakeholders, particularly the shareholders.
Based on this principle, the Bank’s guiding precept is to “foster regional prosperity—which shall both develop the Bank and bring happiness to bank employees” through (1) good service—a sincere, considerate and speedy service; (2) good people—lift people, broaden people and create a cheery workplace; and (3) good management—sound and richly innovative management that seeks full participation from employees. To this end, we shall strive to share the basic sense of values and ethics of directors and employees of the Bank, and to ensure that these are reflected in the Bank’s operations. We have formulated a “Code of Ethics for Bank of Nagoya Directors and Employees” and “Regulations for Complying with Laws and Regulations etc.” and through this we are striving to raise corporate value.
Risk Management System
The Bank has enhanced its risk management system by establishing the Asset Liability Management (ALM) Committee to oversee credit risk, liquidity risk, and market risk, and the Operational Risk Management Committee to oversee risks related to internal operations, such as system risk and administrative risk. The Bank also considers compliance as a top priority and aims to establish a system of checks and balances and tighten internal controls by, for example, establishing a Compliance Committee that includes members from outside the Bank, such as attorneys at law. Status of all risks the Bank should address is covered by monthly meetings of these three committees, which will be then reported to the Board of Directors. This consolidated reporting system is designed in the way to enhance the Board of Directors’ ability to monitor the Bank’s risk control functions.

8
Breakdown of Loans (Nonconsolidated basis) Balance of problem loans under the Banking Act (risk monitored loans)
(As of March 31)
2014 (Millions of yen)
2013 (Millions of yen)
Rate of change (%)
Total loans and bills discounted 2,110,088 2,073,987 1.74
Claims to borrowers in bankruptcy *1
2,363 4,740 -50.15
Past due loans *2 62,192 61,166 1.67
Accruing loans past due three months or more *3 104 376 -72.20
Restructured loans *4 19,020 22,219 -14.39
Ratio of risk monitored loans to total loans and bills discounted
3.97% 4.27% -0.30%
*1 Claims to borrowers in bankruptcy
Of non-accrual loans for which there is no prospect of payment or collection of principal and/or interest, for reasons such as the delay in payment of interest or principal having continued for a considerable period of time, those are subject to the following grounds set forth in the Order for Enforcement of the Corporation Tax Act of Japan: (a) Petition for commencement of reorganization proceedings pursuant to the provisions of the Corporate Reorganization
Act or Act on Special Treatment of Corporate Reorganization Proceedings and Other Insolvency Proceedings of Financial Institutions.
(b) Petition for commencement of rehabilitation proceedings pursuant to the provisions of the Civil Rehabilitation Act. (c) Petition for commencement of bankruptcy proceedings pursuant to the provisions of the Bankruptcy Act. (d) Petition for commencement of special liquidation proceedings pursuant to the provisions of the Companies Act. (e) Suspension of transactions through a clearing house (including bank syndicates that undertake clearing in the relevant
regions when there is no clearing house) (f) Should there be a significant decrease in the economic value of monetary claims against foreign governments, central
banks, and local governments, due to long-term delays in the performance of obligations, and should the receipt of payment be recognized as being extremely difficult.
*2 Past due loans These are non-accrual loans other than claims to borrowers in bankruptcy and loans for which interest payments are deferred in order to assist the financial recovery of borrowers in financial difficulties.
*3 Accruing loans past due three months or more These are loans for which the payment of the principal and/or interest is past due three months or more from the day following contractual payment date, excluding claims to borrowers in bankruptcy and past due loans.
*4 Restructured loan These are loans for which the Bank has relaxed the lending conditions for borrowers in financial difficulties—such as by a reduction of the original rate, forbearance of interest and/or principal payment, granting a maturity date extension—in order to support their financial recovery or restructuring. These exclude claims to borrowers in bankruptcy, past due loans and accruing loans past due three months or more.

9
Balance of problem loans under the Financial Revitalization Act
(As of March 31)
2014 (Millions of yen)
2013 (Millions of yen)
Rate of change (%)
Bankrupt and quasi-bankrupt *5 8,807 12,887 -31.65
Doubtful *6 55,962 53,233 5.12
Need of special attention *7 19,125 22,596 -15.36
Normal *8 2,052,864 2,014,842 1.88
*5 Bankrupt and quasi-bankrupt
These are loans to borrowers who are currently in legal bankruptcy procedures, including bankruptcy, liquidation, corporate reorganization, and rearrangement, and borrowers who are not currently in legal bankruptcy, but in quasi-bankruptcy.
*6 Doubtful These are loans to borrowers who are not currently in bankruptcy, but in difficult financial situations and with a possibility of higher default risk.
*7 Need of special attention These are accruing loans past due 3 months or more (excluding those under *5 and *6), and restructured loans (excluding those under *5 and *6 and accruing loans past due three months or more).
*8 Normal These are loans to borrowers not having particular problems regarding their financial situations and operating conditions, and excluding loans classified as “Bankrupt and quasi-bankrupt,” “Doubtful” and “Need of special attention.”
At March 31, 2014, the ratio of problem loans under the Financial Reconstruction Law was 3.93%.

10
Unrealized Gains on Securities (Nonconsolidated basis)
(As of March 31)
2014 (Billions of yen)
2013 (Billions of yen)
Equity securities 48.2 35.2
Bonds and others 8.9 13.7
Total 57.2 48.9
Capital Adequacy Ratio
A credit rating is a symbol provided by a credit rating agency indicating the degree of certainty that the principle and interest on an individual bond issued by a company will be paid. It is strongly related to the evaluation of a company’s creditworthiness, and in a broad sense expresses the level of confidence in a bank.
The Bank has obtained a credit rating of “A+” from Japan Credit Rating Agency, Ltd. (JCR) with respect to the Bank’s long-term preferred debt. This rating indicates that the debt is investment grade, and is a high rating among Japanese financial institutions.
Rating
Japan Credit Rating Agency, Ltd. (JCR) A+ A high level of capacity to honor the financial commitment on the obligation.
(Billions of yen)
50.0
40.0
30.0
20.0
10.0
0
Equity securities
Bonds and others
2014 2013
11
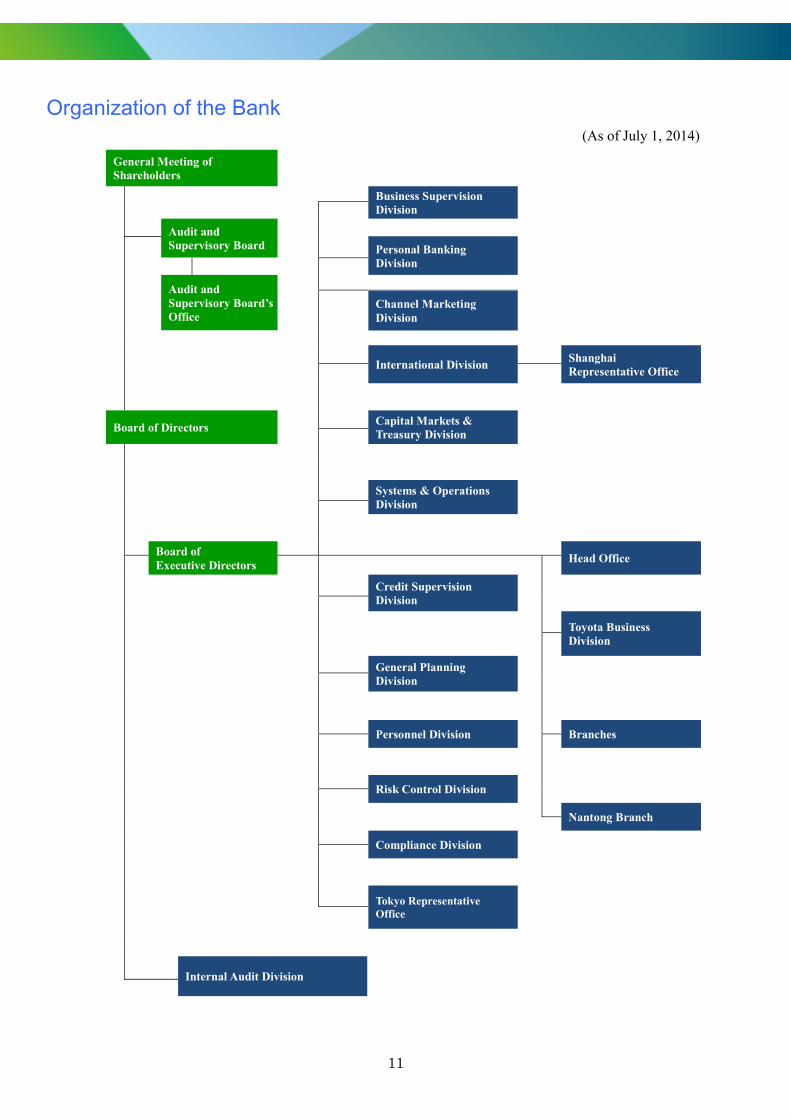
Organization of the Bank (As of July 1, 2014)
General Meeting of Shareholders
Business Supervision Division
Audit and Supervisory Board
Personal Banking
Division
Audit and Supervisory Board’s Office
Channel Marketing
Division
International Division Shanghai
Representative Office
Board of Directors Capital Markets &
Treasury Division
Systems & Operations Division
Board of Executive Directors
Head Office Credit Supervision
Division
Toyota Business
Division General Planning
Division
Personnel Division Branches
Risk Control Division
Nantong Branch
Compliance Division
Tokyo Representative
Office
Internal Audit Division

12
Board of Directors and Audit and Supervisory Board (As of June 27, 2014)
Chairman Kazumaro Kato
President Masahiro Nakamura
Deputy President Ichiro Fujiwara
Senior Managing Director Yasuhisa Yamamoto
Managing Directors Tetsundo Nakamura Chiharu Kozakai Shinichi Yokota
Directors Yasuhisa Furumoto Hideharu Ishii Koji Kurachi Shougo Ukai Itaru Iyoda Naoto Sugita Toshi Saeki* *Outside director
Audit and Supervisory Board MembersAkio Oguri Tadashi Takeuchi Hideji Aoyama Toshiro Goto
Senior Advisor Yukio Yanase
Executive Officers Shunji Asami Kiyoshi Imaoka Masakazu Kitagawa Takayuki Yogo Satoru Hattori
Principal Shareholders (As of March 31, 2014) Sumitomo Mitsui Banking Corporation 5.03% Japan Trustee Services Bank, Ltd. (Trust Account) 4.16% Mizuho Bank, Ltd. 4.11% The Bank of Nagoya Employees’ Shareholding Association (Meigin Minori-kai) 3.81% Nippon Life Insurance Company 3.54% Meiji Yasuda Life Insurance Company 3.54% The Master Trust Bank of Japan, Ltd. (Toyota Motor Corporation Account) 2.84% SUMITOMO LIFE INSURANCE COMPANY 2.51% Mitsui Sumitomo Insurance Company, Limited 2.19% The Juroku Bank, Ltd. 1.98%
Notes 1. Shares held by Japan Trustee Services Bank, Ltd. (Trust Account) and The Master Trust Bank of Japan, Ltd. (Toyota Motor Corporation Account) are shares in association with their trust business.
2. On July 1, 2013, Mizuho Corporate Bank, Ltd. which was a principal shareholder in the previous year conducted a merger with Mizuho Bank, Ltd. changing the company name to Mizuho Bank, Ltd.


14
The Bank of Nagoya, Ltd. and Consolidated Subsidiaries Consolidated Balance Sheets March 31, 2014 and 2013
Millions of yen
Thousands of U.S. dollars
2014 2013 2014 Assets: Cash and due from banks (Note 3) ¥ 152,950 ¥ 174,814 $ 1,486,110 Call loans and bills purchased (Note 3) 806 1,668 7,840 Trading account securities (Notes 3 and 4) 16 100 158 Securities (Notes 3, 4, 7 and 11) 948,744 908,294 9,218,267 Loans and bills discounted (Notes 3, 5, 13 and 17) 2,109,774 2,072,332 20,499,171 Foreign exchanges 5,145 3,423 49,992
Lease receivables and investments in leased assets
(Note 13) 22,584 22,411 219,436 Other assets (Note 7) 15,564 26,390 151,232 Tangible fixed assets (Note 6) 36,258 35,918 352,297 Intangible fixed assets 2,145 1,730 20,845 Employee retirement benefit asset (Note 10) 13,919 - 135,244 Deferred tax assets (Note 15) 1,118 1,277 10,864
Customers’ liabilities for acceptances and
guarantees (Note 11) 11,327 12,229 110,060 Reserve for possible loan losses (21,248) (24,163) (206,457)
Total assets ¥ 3,299,106 ¥ 3,236,427 $ 32,055,059(Continued)
See accompanying Notes to Consolidated Financial Statements.

15
The Bank of Nagoya, Ltd. and Consolidated Subsidiaries Consolidated Balance Sheets March 31, 2014 and 2013
Millions of yen
Thousands of U.S. dollars
2014 2013 2014 Liabilities: Deposits (Notes 3, 7 and 8) ¥ 3,001,814 ¥ 2,956,057 $ 29,166,487 Call money and bills sold (Notes 3) 7,204 6,583 70,000
Payables under securities lending transactions
(Notes 3 and 7) 4,086 2,879 39,703 Borrowed money (Notes 3, 7 and 9) 20,062 18,070 194,937 Foreign exchanges 79 152 772 Other liabilities (Notes 9 and 15) 21,738 23,690 211,214 Reserve for employee bonuses 1,109 1,122 10,783 Reserve for executive bonuses 62 55 607 Reserve for employee retirement benefits (Note 10) - 6,002 -
Employee retirement benefit liability (Note 10) 5,725 - 55,628 Reserve for executive retirement benefits 615 676 5,976
Reserve for losses on repayments of dormant bank
accounts 386 352 3,760 Reserve for contingent loss 3,434 3,933 33,370 Reserve for loss on interest repayment 237 247 2,307 Deferred tax liabilities (Note 15) 10,538 5,130 102,396 Deferred tax liabilities for revaluation (Note 6) 3,793 3,832 36,862 Acceptances and guarantees (Note 11) 11,327 12,229 110,060 Total liabilities 3,092,217 3,041,016 30,044,862
Net assets (Notes 12 and 18): Common stock 25,090 25,090 243,790 Capital surplus 18,645 18,645 181,168 Retained earnings 115,725 111,561 1,124,424 Less treasury stock, at cost (239) (231) (2,326) Total shareholders’ equity 159,223 155,066 1,547,056 Accumulated other comprehensive income 43,671 36,602 424,327 Minority interests 3,994 3,742 38,814 Total net assets 206,889 195,410 2,010,197
Total liabilities and net assets ¥ 3,299,106 ¥ 3,236,427 $ 32,055,059

16
The Bank of Nagoya, Ltd. and Consolidated Subsidiaries Consolidated Statements of Income For the Years Ended March 31, 2014 and 2013
Millions of yen
Thousands of U.S. dollars
2014 2013 2014 Income: Interest income: Interest on loans and discounts ¥ 28,191 ¥ 30,294 $ 273,915 Interest and dividends on securities 8,694 7,885 84,476 Other interest income 142 156 1,385 Total interest income 37,028 38,336 359,776 Fees and commissions 7,674 7,852 74,563 Other operating income 15,384 15,776 149,476 Gain on sales of stocks and other securities 790 72 7,680 Gain on revision of retirement benefit plan - 2,255 -
Compensation income from expropriation - 336 -
Other income 1,146 614 11,143 Total income (Note 19) 62,023 65,244 602,638Expenses: Interest expense: Interest on deposits 1,595 1,867 15,503 Interest on borrowings and rediscounts 155 193 1,508 Other interest expense 135 89 1,321 Total interest expenses 1,886 2,150 18,332 Fees and commissions 2,211 2,471 21,489 Other operating expenses 11,541 12,429 112,144 General and administrative expenses 34,084 34,123 331,176 Provision for possible loan losses - 639 -
Loss on devaluation of stocks and other securities 197 130 1,915 Impairment loss on fixed assets 330 256 3,209 Other expenses 1,990 2,274 19,338 Total expenses 52,242 54,477 507,603
Income before income taxes and
minority interests (Note 19) 9,781 10,767 95,035 Income taxes (Note 15) 4,084 4,246 39,686 Income before minority interests 5,696 6,520 55,349 Less minority interests in net income of subsidiaries 256 296 2,491 Net income ¥ 5,440 ¥ 6,223 $ 52,858 Yen U.S. dollars Per share: Net income ¥ 26.58 ¥ 30.41 $ 0.26 Cash dividends 6.50 6.50 0.06
See accompanying Notes to Consolidated Financial Statements.

17
The Bank of Nagoya, Ltd. and Consolidated Subsidiaries Consolidated Statements of Comprehensive Income For the Years Ended March 31, 2014 and 2013
Millions of yen
Thousands of U.S. dollars
2014 2013 2014 Income before minority interests ¥ 5,696 ¥ 6,520 $ 55,349 Other comprehensive income (Note 16):
Net change in unrealized gains on available-for-sale
securities 5,360 17,567 52,082 Net change in deferred losses on hedging instruments 0 (0) 1 Total other comprehensive income 5,360 17,567 52,083 Comprehensive income ¥ 11,056 ¥ 24,087 $ 107,432 Comprehensive income attributable to: Owners of the parent ¥ 10,801 ¥ 23,787 $ 104,949 Minority interests 255 300 2,483 Total comprehensive income ¥ 11,056 ¥ 24,087 $ 107,432
See accompanying Notes to Consolidated Financial Statements.

18
The Bank of Nagoya, Ltd. and Consolidated Subsidiaries Consolidated Statements of Changes in Net Assets For the Years Ended March 31, 2014 and 2013 Millions of yen Shareholders’ equity Accumulated other comprehensive income
Common
stock Capital surplus
Retained earnings
Treasury stock
Total shareholders’
equity
Net unrealized gains on
available-for-sale securities
Net deferred losses on hedging
instruments
Land revaluation
excess
Retirement benefit
adjustments
Total
accumulated other
comprehensive income
Minority interests
Total net assets
Balance at April 1, 2012 ¥ 25,090 ¥ 18,645 ¥ 106,698 ¥ (227) ¥ 150,207 ¥ 14,974 ¥ (0) ¥ 4,034 ¥ – ¥ 19,008 ¥ 3,444 ¥ 172,661Net income for the year – – 6,223 – 6,223 – – – – – – 6,223Cash dividends – – (1,330) – (1,330) – – – – – – (1,330)Purchases of treasury stock – – – (6) (6) – – – – – – (6)Disposition of treasury stock – (1) – 2 1 – – – – – – 1Reversal of land revaluation
excess – – (29) – (29) – – – –
– – (29)Transfer from retained
earnings to capital surplus – 1 (1) – – – – – –
– – –Net changes of items other
than shareholders’ equity – – – – – 17,563 (0) 29 –
17,593 297 17,890
Balance at March 31, 2013 25,090 18,645 111,561 (231) 155,066 32,538 (0) 4,064 – 36,602 3,742 195,410Net income for the year – – 5,440 – 5,440 – – – – – – 5,440Cash dividends – – (1,330) – (1,330) – – – – – – (1,330)Purchases of treasury stock – – – (9) (9) – – – – – – (9)Disposition of treasury stock – (0) – 2 1 – – – – – – 1Reversal of land revaluation
excess – – 55 – 55 – – – –
– – 55Transfer from retained
earnings to capital surplus – 0 (0) – – – – – –
– – –Net changes of items other
than shareholders’ equity – – – – – 5,361 0 (55) 1,763
7,069 252 7,321
Balance at March 31, 2014 ¥ 25,090 ¥ 18,645 ¥ 115,725 ¥ (239) ¥ 159,223 ¥ 37,899 ¥ (0) ¥ 4,009 ¥ 1,763 ¥ 43,671 ¥ 3,994 ¥ 206,889 Thousands of U.S. dollars
Balance at March 31, 2013 $ 243,790 $ 181,168 $ 1,083,960 $ (2,251) $ 1,506,667 $ 316,150 $ (1) $ 39,491 $ – $ 355,640 $ 36,359 $ 1,898,666Net income for the year – – 52,858 – 52,858 – – – – – – 52,858Cash dividends – – (12,924) – (12,924) – – – – – – (12,924)Purchases of treasury stock – – – (97) (97) – – – – – – (97)Disposition of treasury stock – (8) – 22 14 – – – – – – 14Reversal of land revaluation
excess – – 538 – 538 – – – –
– – 538Transfer from retained
earnings to capital surplus – 8 (8) – – – – – –
– – –Net changes of items other
than shareholders’ equity – – – – – 52,090 1 (538) 17,134
68,687 2,455 71,142
Balance at March 31, 2014 $ 243,790 $ 181,168 $ 1,124,424 $ (2,326) $ 1,547,056 $ 368,240 $ (0) $ 38,953 $ 17,134 $ 424,327 $ 38,814 $ 2,010,197 See accompanying Notes to Consolidated Financial Statements.

19
The Bank of Nagoya, Ltd. and Consolidated Subsidiaries Consolidated Statements of Cash Flows For the Years Ended March 31, 2014 and 2013
Millions of yen
Thousands of U.S. dollars
2014 2013 2014 Cash flows from operating activities:
Income before income taxes and minority interests ¥ 9,781 ¥ 10,767 $ 95,035 Adjustments for:
Depreciation and amortization 2,360 1,949 22,931 Impairment loss on fixed assets 330 256 3,209 Decrease in reserve for possible loan losses (2,914) (42) (28,320) (Decrease) increase in reserve for executive retirement benefits (61) 30 (595) (Decrease) increase in reserve for contingent loss (498) 462 (4,848) Interest income recognized on statement of income (37,028) (38,336) (359,776) Interest expenses recognized on statement of income 1,886 2,150 18,332 Net gains on securities (1,138) (68) (11,058) Foreign exchange gains, net (4,418) (5,645) (42,929) Net decrease in call loans and bills purchased and others 862 134 8,376 Net (increase) decrease in loans and bills discounted (37,442) 13,824 (363,801)
Net (increase) decrease in lease receivables and investments in leased
assets (173) 749 (1,684)
Net increase in deposits 45,757 36,926 444,595 Net increase in call money and bills sold 620 8 6,033 Net increase in payables under securities lending transactions 1,206 2,879 11,723
Net increase (decrease) in borrowed money (excluding subordinated
borrowings)
1,992 (6,680)
19,364 Interest income received 37,942 38,617 368,663 Interest expenses paid (3,171) (2,952) (30,813) Others, net (1,781) (1,714) (17,308) Subtotal 14,113 53,320 137,129
Income taxes paid (3,688) (2,240) (35,839) Net cash provided by operating activities 10,424 51,079 101,290 Cash flows from investing activities: Purchases of securities (288,476) (261,663) (2,802,924) Proceeds from sales and maturities of securities 261,448 228,364 2,540,303 Purchases of tangible fixed assets (3,101) (2,217) (30,135) Proceeds from sales of tangible fixed assets 212 141 2,062 Payments of asset retirement obligations - (3) - Purchases of intangible fixed assets (870) (779) (8,459) Net cash used in investing activities (30,788) (36,158) (299,153) Cash flows from financing activities:
Dividends paid to shareholders (1,329) (1,330) (12,921)
Dividends paid to minority shareholders (2) (2) (28) (Purchase) disposition of treasury stock, net (8) (5) (83) Net cash used in financing activities (1,341) (1,338) (13,032) Effect of exchange rate changes on cash and cash equivalents 18 41 177 Net (decrease) increase in cash and cash equivalents (21,687) 13,624 (210,718) Cash and cash equivalents at beginning of year 173,410 159,786 1,684,906 Cash and cash equivalents at end of year (Note 2(b)) ¥ 151,723 ¥ 173,410 $ 1,474,188
See accompanying Notes to Consolidated Financial Statements.
20
The Bank of Nagoya, Ltd. and Consolidated Subsidiaries Notes to Consolidated Financial Statements 1. Basis of Consolidated Financial Statements
The accompanying consolidated financial statements of The Bank of Nagoya, Ltd. (the “Bank”) and its consolidated subsidiaries (together with the Bank, the “Group”) have been prepared in conformity with accounting principles generally accepted in Japan (“Japanese GAAP”), which are different in certain respects as to application and disclosure requirements from the International Financial Reporting Standards. The accompanying consolidated financial statements have been restructured and translated into English from the consolidated financial statements of the Bank prepared in accordance with Japanese GAAP and filed with the appropriate Local Finance Bureau of the Ministry of Finance as required by the Financial Instruments and Exchange Act of Japan. Certain supplementary information included in the statutory Japanese language consolidated financial statements, but not required for fair presentation, has not been presented in the accompanying consolidated financial statements. The amounts in Japanese yen are presented in millions of yen and are rounded down to the nearest million. Accordingly, the totals shown in the accompanying consolidated financial statements and the notes thereto may not exactly equal to the sum of the individual amounts. The translation of the Japanese yen amounts into U.S. dollar amounts is included solely for the convenience of readers outside Japan, using the prevailing exchange rate at March 31, 2014, which was ¥102.92 to US$1.00. Such translation should not be construed as representation that the Japanese yen amounts have been, could have been or could in the future be converted into U.S. dollars at such or any other rate of exchange. Certain comparative figures have been reclassified to conform to the current year’s presentation.
2. Summary of Significant Accounting Policies (a) Principles of consolidation
The accompanying consolidated financial statements include the accounts of the Bank and its significant subsidiaries. Both at March 31, 2014 and at March 31, 2013, the Bank had five consolidated subsidiaries primarily engaged in the business of providing a wide range of financial services to customers. A subsidiary, Aichi-Jimoto Fund for Agriculture, Forestry and Fisheries Investment Limited Partnership that was established in 2014, is excluded from the scope of consolidation as well as the scope of application of the equity method since its net income, retained earnings, accumulated other comprehensive income (each in proportion to the Bank’s interests) and assets are immaterial to the Group’s consolidated financial statements. The Bank had no affiliates at March 31, 2014 and 2013. The difference between the cost of investments in subsidiaries and the underlying equity in their net assets adjusted based on fair value at the time of acquisition is deferred as goodwill and amortized over five years using the straight-line method. Negative goodwill resulting from the acquisition, measured as the excess of the underlying equity in the net assets over the acquisition cost, is charged to income. In consolidation, all intercompany transactions and accounts have been eliminated. In addition, all significant unrealized profits included in assets resulting from transactions within the Group have been eliminated.

21
(b) Cash and cash equivalents
For the purpose of the consolidated statements of cash flows, cash and cash equivalents consisted of cash and dues from banks with original maturity of three months or less at March 31, 2014 and 2013 as follows.
Thousands of Millions of yen U.S. dollars 2014 2013 2014 Cash and due from banks ¥ 152,950 ¥ 174,814 $ 1,486,110
Less due from banks whose period exceeds three months (1,227) (1,403) (11,922)
Cash and cash equivalents ¥ 151,723 ¥ 173,410 $ 1,474,188
(c) Trading account securities
Trading account securities are stated at fair value at the fiscal year-end. Related gains and losses, both realized and unrealized, are included in current earnings. Accrued interest on trading account securities is included in “other assets.”
(d) Securities
Debt securities for which the Group has both the intent and the ability to hold to maturity are classified as held-to-maturity debt securities and are stated at amortized cost. In principle, available-for-sale securities other than those classified as trading or held-to-maturity debt securities are carried at fair value based on their market prices at the applicable fiscal year-end, with net unrealized gains or losses reported as component of accumulated other comprehensive income in net assets, net of applicable income taxes. Available-for-sale securities whose fair values are extremely difficult to determine are stated at moving average cost. The carrying values of individual securities are reduced, if necessary, through write-downs to reflect other-than-temporary declines in value. Gains and losses on disposal of securities are principally computed based on the moving average method. Accrued interest on securities is included in “other assets.”
(e) Derivatives and hedge accounting
The Bank uses various derivative instruments. Derivatives are recorded at fair value, with changes in fair values included in the consolidated statements of income for the period in which they arise, except for derivatives that are designated as hedging instruments and qualify for hedge accounting. The Bank applies the deferral method of hedge accounting for hedging foreign exchange risks associated with various foreign currency denominated monetary assets and liabilities in accordance with the Industry Audit Committee Report No. 25, entitled the “Treatment of Accounting and Auditing concerning Accounting for Foreign Currency Transactions in Banking Industry” issued by the Japanese Institute of Certified Public Accountants (“JICPA”). The effectiveness of the currency swap transactions, foreign exchange swap transactions and similar transactions that hedge foreign exchange risks of monetary receivables and payables denominated in foreign currencies as described above is assessed based on the comparison of the hedged monetary receivables and payables denominated in foreign currencies and the foreign currency positions of the corresponding hedging instruments.
(f) Loans and bills discounted and reserve for possible loan losses
The reserve for possible loan losses is established based on the Bank’s management’s judgment and assessment of future losses. The Bank implements a self-assessment system for its asset quality. The quality of all loans is assessed by each of the Bank’s branches and business units, and is
22
subsequently examined by the Bank’s Credit Supervision Division in accordance with the Bank’s policy and rules for self-assessment of asset quality. The Bank has established a credit rating system under which customers are classified into five categories. All loans are classified for self-assessment purposes into the following categories: “legal bankruptcy;” “de facto bankruptcy”; “bankruptcy risk”; “under observation”; and “normal.” The Bank provides a reserve for possible loan losses at an amount deemed necessary to cover possible future losses. For claims against borrowers in legal bankruptcy and de facto bankruptcy, a reserve is provided based on the amounts of such claims, net of the amounts expected to be collected through disposal of collateral or from guarantees. For claims against borrowers who have bankruptcy risk, a reserve is provided in the amounts considered necessary based on the overall solvency assessment performed for the amounts of such claims, net of the amounts expected to be collected through disposal of collateral or from guarantees. For claims against borrowers in the “under observation” and “normal” category, a reserve is provided based on the historical loss experience of the Bank for a certain past period. The reserve amounts recorded by consolidated subsidiaries are provided at the aggregate amount of estimated credit losses based on the individual financial review approach for doubtful or troubled claims. For other claims, an amount deemed necessary is provided as reserve taking into consideration the historical loss experience.
(g) Tangible fixed assets and depreciation (except for leases)
Tangible fixed assets are principally stated at cost less accumulated depreciation. Depreciation is computed by the declining-balance method over the estimated useful life of the asset, except for buildings (excluding facilities attached thereto) acquired on or after April 1, 1998, which are depreciated using the straight-line method. The useful lives of tangible fixed assets range as follows.
2014 and 2013 Buildings 15 years to 50 years Equipment and other 4 years to 20 years
Tangible fixed assets of the consolidated subsidiaries are mainly depreciated using the straight-line method over the estimated useful lives of such assets.
(Change in accounting policy with the amendment of respective law or regulation that is not distinguishable from change in accounting estimate) Effective from the year ended March 31, 2013, in accordance with the amendment in Corporation Tax Law of Japan, the Group has changed its depreciation method to the method based on the amended Corporation Tax Law for tangible fixed assets acquired on or after April 1, 2012. This change had no material impact on the consolidated statements of income.
(h) Intangible fixed assets and amortization (except for leases)
Intangible fixed assets are amortized using the straight-line method. Costs of computer software developed or obtained for internal use are principally capitalized and amortized using the straight-line method over the estimated useful life of five years.
(i) Leases
(Accounting for leases as lessee) The Group, as lessee, capitalizes the assets used under finance leases that do not transfer ownership and whose commencement day falls on or after April 1, 2008, except for certain immaterial or short-term finance leases accounted for as operating leases. Depreciation of leased assets capitalized in finance lease transactions is computed by the straight-line method over the lease term, as useful life, with the assumption of having no residual value unless residual value is guaranteed by the corresponding lease contracts.

23
(Accounting for leases as lessor) A certain consolidated subsidiary engaged in leasing operations, as lessor, recognizes as “investments in leased assets” finance leases that do not transfer ownership of the leased assets to the lessee, and recognizes as “lease receivables” finance leases that transfer ownership in a manner similar to the accounting treatment for ordinary sale transactions. The total amount equivalent to interest is allocated over the lease term using the interest method, and such subsidiary recognizes as income lease payments received from customers at the time of receipt and related costs, net of imputed interest, as permitted by the accounting standard. With respect to finance leases commenced prior to April 1, 2008, the appropriate book values of fixed assets, net of accumulated depreciation, as of March 31, 2008 are recognized as the values of investments in such leased assets at April 1, 2008, and the total amount equivalent to interest is allocated over the lease term using the straight-line method. Although the revised accounting standard generally requires the use of the interest method as the principal method of calculation, it permits the use of the straight-line method during the transitional period. As a result, revenues from interests for the years ended March 31, 2014 and 2013 were ¥122 million ($1,188 thousand) and ¥227 million more, respectively, than the amount that would have been calculated using the interest method.
(j) Impairment of fixed assets A fixed asset is reviewed for impairment whenever events or changes in circumstances indicate that the carrying amount of such asset may not be recoverable. An impairment loss is recognized in the income statement by reducing the carrying amount of the impaired asset or a group of assets to the recoverable amount, measured at the higher of the asset’s net selling price or value in use. Fixed assets include land, buildings and other forms of property, as well as intangible assets, and are grouped at the lowest level at which there are identifiable cash flows separate from other groups of assets. For the purpose of recognition and measurement of an impairment loss, fixed assets, other than idle or unused property, of the Bank are grouped into cash generating units, such as operating branches and the like, and fixed assets of the consolidated subsidiaries are grouped into respective units which manage and determine income and expenses relating to such assets. The Group recognized impairment loss on fixed assets amounting to ¥330 million ($3,209 thousand) and ¥256 million for unprofitable operating branches for the years ended March 31, 2014 and 2013, respectively. Recoverable amounts of the assets were measured based on their net selling prices, which were based on appraisal values or expected selling amounts less estimated costs of disposal. Accumulated impairment loss is deducted from the net book value of each asset.
(k) Foreign currency translation
The Group’s assets and liabilities denominated in foreign currencies, as well as the accounts of its foreign branches, are translated into Japanese yen at the exchange rate prevailing at the fiscal year-end. Revenues and expenses are translated at the exchange rate prevailing on the applicable transaction dates. Gains and losses resulting from transactions are included in the determination of net income.
(l) Reserve for employee bonuses A reserve for employee bonuses is provided based on the estimated amount of future payments attributable to the respective year.
(m) Reserve for executive bonuses
A reserve for executive bonuses is provided for the payment of bonuses to directors and audit and supervisory board members based on the estimated amount of the payments attributable to the respective year.
(n) Reserve for employee retirement benefits Employees who terminate their services with the Group are entitled to retirement benefits which are generally determined based on the current basic rate of pay, length of service and conditions under which the termination has occurred.

24
The Group has principally recognized retirement benefits based on the actuarial present value of the retirement benefit obligation using the actuarial appraisal approach and the fair value of pension plan assets available for benefits at the respective fiscal year-end.
Effective from the year ended March 31, 2014, the Group has applied the “Accounting Standard for Retirement Benefits” (Accounting Standards Boards of Japan (“ASBJ”) Statement No. 26, revised on May 17, 2012 (hereinafter, “Statement No. 26”)) and the “Guidance on Accounting Standard for Retirement Benefits” (ASBJ Guidance No. 25, revised on May 17, 2012, (hereinafter, “Guidance No. 25”)), with the exception of Article 35 of Statement No. 26 and Article 67 of Guidance No. 25, and, accordingly, actuarial differences and past service costs that are yet to be recognized in profit or loss have been recognized as retirement benefit adjustments of accumulated other comprehensive income within the net assets section, after adjusting for tax effects, and the difference between retirement benefit obligation and plan assets has been recognized as employee retirement benefit asset or liability in the balance sheet. In accordance with Article 37 of Statement No. 26, this accounting change has not been retrospectively applied to the financial statements in prior years, and the effect of the change in accounting policies arising from initial application has been recognized in retirement benefit adjustments under accumulated other comprehensive income.
As a result, as of March 31, 2014, the Group has recognized employee retirement benefit asset of ¥13,919 million ($135,244 thousand) and employee retirement benefit liability of ¥5,725 million ($55,628 thousand). Also, deferred tax assets decreased by ¥962 million ($9,348 thousand), and retirement benefit adjustments of ¥1,763 million ($17,134 thousand) were recorded as accumulated other comprehensive income at March 31, 2014. Until the year ended March 31, 2013, unrecognized actuarial differences and unrecognized past service costs were not recognized in the balance sheet under the previous standard, and the difference between retirement benefit obligation and plan assets, adjusted by such unrecognized amounts, was recorded as “reserve for employee retirement benefits” in the balance sheet. In the calculation of retirement benefit obligation, the expected retirement benefits are attributed to the period up to the end of the respective fiscal year based on the straight-line method. Past service costs are amortized by the straight-line method over a certain period within the average remaining years of service of employees. Actuarial differences arising from changes in the retirement benefit obligation or value of plan assets not anticipated by previous assumptions or from changes in the assumptions themselves are amortized on a straight-line basis over a certain period within the average remaining years of service of employees, measured from the year following the year in which such differences arise. In respect of the amortization period for past service costs and actuarial differences, the Bank recognizes an amortization period of 13 years as the period within the average remaining years of services of employees. (Additional information) Effective from April 1, 2012, the Bank revised its retirement benefit plans and transferred a part of its defined benefit pension plan to a lump-sum retirement benefit plan. Effective from April 2, 2012, the Bank transferred a part of the lump-sum retirement benefit plan to a defined contribution pension plan. In line with the above changes and in accordance with ASBJ Guidance No. 1, entitled the “Guidance on Accounting for Transfers between Retirement Benefit Plans,” the Bank recorded the effect of such changes as “gain on revision of retirement benefit plan” in the amount of ¥2,255 million for the year ended March 31, 2013.
In addition, on April 2, 2012, the Bank also revised such provisions as in regard to benefit levels for the defined benefit pension plan and the lump-sum retirement benefit plan and the like. These revisions resulted in a credit balance of unrecognized past service costs of ¥1,884 million, which has been and will be amortized as reduction of expenses using the straight-line method over 13 years, a certain period within the average remaining years of services of employees, started from the year ended March 31, 2013.
25
(o) Reserve for executive retirement benefits
A reserve for executive retirement benefits is provided based on the Group’s internal rules in the amount that would be payable assuming the directors and audit and supervisory board members terminate their services at the balance sheet date.
(p) Reserve for losses on repayments of dormant bank accounts
In order to cover possible losses on claims from customers for repayment of dormant bank accounts which were previously recognized as income, the Bank provides a reserve to the extent of the estimated losses based on the historical loss experience taking into consideration the repayment conditions for a certain past period. A reserve for losses on repayments of dormant bank accounts was included in “other expenses” and amounted to ¥146 million ($1,421 thousand) and ¥125 million for the years ended March 31, 2014 and 2013, respectively.
(q) Reserve for contingent loss
A reserve for contingent loss is provided at an amount deemed necessary to cover possible future losses from default of loans under the responsibility-sharing system on guarantees of loans with the Credit Guarantee Corporation based on the historical default loss experience. A reversal of reserve for contingent loss of ¥498 million ($4,848 thousand) was included in “other income” for the year ended March 31, 2014, whereas a provision of reserve for contingent loss of ¥462 million was recorded in “other expenses” for the year ended March 31, 2013.
(r) Reserve for loss on interest repayment In order to cover possible losses on the repayment of interests to be received from customers that exceed the upper limit of interest rates prescribed under the Interest Rate Restriction Act, two consolidated subsidiaries provide a reserve for loss on interest repayment to the extent of the estimated losses that may be incurred from repayment claims against customers for which court settlements have not been reached. Such estimated losses are based on the historical loss experience taking into consideration the repayment conditions for a certain past period.
(s) Income taxes Income taxes are accounted for under the asset and liability method. Deferred tax assets and liabilities are recognized as future tax consequences attributable to differences between the financial statement carrying amounts of existing assets and liabilities and their respective tax bases and operating loss carry-forwards. Deferred tax assets and liabilities are measured using the enacted tax rates expected to apply to taxable income in the years in which those temporary differences are expected to be recovered or settled. The effect of a change in tax rates on deferred tax assets and liabilities is recognized in the period that includes the promulgation date.
(t) Appropriation of retained earnings Cash dividends are recorded in the fiscal year when a proposed appropriation of retained earnings is approved by the Bank’s Board of Directors and/or shareholders.
(u) Per share data Net income per share is computed by dividing income available to common shareholders by the weighted-average number of shares of common stock outstanding during the respective year. Diluted net income per share was not disclosed as the Group had no diluted common shares for the years ended March 31, 2014 and 2013. Cash dividends per share shown in the accompanying consolidated statements of income represent dividends declared applicable to the respective years shown.

26
(v) New accounting standards not yet adopted by the Group
ASBJ Statement No. 26 and ASBJ Guidance No. 25 have been issued but not yet adopted in the accompanying consolidated financial statements.
(1) Overview:
From the viewpoint of improvements to financial reporting and international convergence, the standard and guidance require changes mainly with regard to accounting treatments for unrecognized actuarial differences and past service costs, methods for calculating retirement benefit obligation and current service costs, and enhancement of disclosures.
(2) Effective date: The Bank will adopt the revised standard in relation to methods for calculating retirement benefit obligation and current service costs from the beginning of the fiscal year ending March 31, 2015.
(3) Effects of application: The application of the revised standard is expected to result in an increase of retained earnings by ¥642 million ($6,242 thousand) at the beginning of the fiscal year ending March 31, 2015.
3. Financial Instruments and Related Disclosures (a) Qualitative information on financial instruments
(1) Group policy for financial instruments
The Group undertakes deposit, loan and investment operations. Since the Group has financial assets and liabilities which mainly involve interest rate risk, the Bank has adopted the Asset Liability Management (“ALM”) system to avoid any unfavorable influence from interest rate fluctuations. Derivative transactions are also used as part of ALM.
(2) Nature of financial instruments and related risks Financial assets held by the Group mainly comprise loans to domestic corporate entities and individuals and securities. Loans are subject to customer credit risk arising from default by borrowers. There is a possibility that the borrowers will not perform their obligations in accordance with the applicable contract terms due to economic circumstances or the like. Securities, which primarily comprise equity securities, bonds and investment trusts, are held for investment and business promotion purposes. These securities are exposed to credit risk of issuers, interest rate fluctuation risk and/or market price fluctuation risk. For securities denominated in foreign currencies, bonds denominated in foreign currencies are basically purchased at the amount up to the corresponding amount of deposits and fund procurement from the market in foreign currencies to avoid foreign exchange fluctuation risk. Financial liabilities mainly include deposits from customers and are subject to liquidity risk. Deposits with variable interest rates are exposed to interest rate fluctuation risk. Derivative transactions include, among others, interest rate swaps and forward foreign exchange contracts. The Group uses derivative transactions in line with ALM in order to avoid interest rate fluctuation risk in relation to deposits and loans and to fulfill the customers’ hedging requirements for foreign exchange fluctuation risk. Hedge accounting is applied to certain transactions which offset market fluctuations or fix cash flows and fulfill preliminary and subsequent requirements. Derivative transactions which do not meet the hedge accounting criteria are exposed to foreign exchange fluctuation risk and interest rate fluctuation risk.
(3) Risk management for financial instruments (i) Credit risk management
The Group manages its credit risk by maintaining a credit exposure management system in relation to loans in accordance with its “Credit Policy” which stipulates basic concepts in relation to credit exposure management and administrative rules regarding credit risk. The system includes credit

27
administration of loans and credit lines, administration of credit records and internal ratings as well as establishment of guarantees or collateral and handling of doubtful loans. These credit exposure management procedures are performed by each of the Group’s sales branches and loan departments and are reported to the Board of Executive Directors and/or Board of Directors on a routine basis.
Credit risk of issuers of securities and counterparty risk of derivative transactions are managed by the Bank’s Capital Markets and Treasury Division which monitors credit information and fair values on a regular basis.
(ii) Market risk management (a) Interest risk management
The Group has established the ALM committee for the purpose of recognizing and managing interest rate fluctuation risk comprehensively and pursuing appropriate ALM. Risk control methods and procedures are stipulated in the ALM committee codes, and the ALM committee operates in accordance with the management policy of ALM determined at the Board of Directors’ meeting. The status of implementation is monitored, and actions to be taken in the future are discussed at the Board of Directors’ meeting. On a daily basis, the Bank’s Risk Control Division comprehensively checks interest rates and periods of financial assets and liabilities, monitors risks using gap analysis and interest rate sensitivity analysis and reports to the ALM committee and Board of Directors monthly. Interest rate swap transactions are also used under the ALM system to avoid interest rate fluctuation risk.
(b) Foreign exchange risk management
The Group manages foreign exchange fluctuation risk by transaction and enters into forward foreign exchange contracts to avoid foreign exchange fluctuation risk on transactions with customers.
(c) Market price fluctuation risk management The Group holds investment products including securities based on marketable securities investment planning determined by the Board of Executive Directors in accordance with basic market fluctuation risk management rules of the Board of Directors. Since the Bank’s Capital Markets and Treasury Division purchases investment products from outside, market price fluctuation risk is reduced through consecutive monitoring as well as preliminary review and setup of investment limits. Most of the equity securities managed by the Bank’s Planning Division are for business promotion purposes, and market conditions and financial statuses of customers are monitored and reported to the Board of Executive Directors on a regular basis.
(d) Derivative transactions
For derivative transactions, an internal checking system has been established through segregating the operation, custody and evaluation of hedge effectiveness.
(e) Quantitative information on market risk
i) Financial instruments for trading purposes
The Group uses the historical simulation method (based on the assumptions of a holding period of 120 business days, 99% confidence level and observation period of 1,200 business days) for the calculation of interest-related Value at Risk (VaR) of trading account securities. As of March 31, 2014 and 2013, the market risk exposures (the expected maximum loss) of the Group’s trading operation amounted to ¥0 million ($2 thousand) and ¥1 million, respectively.
ii) Financial instruments other than for trading purposes

28
Market risk is the primary risk factor to the Group. The major financial instruments subject to market risk are “loans and bills discounted,” debt and equity securities and investment trusts included in “securities” and “deposits” and interest rate swaps included in “derivatives.” The historical simulation method (based on the assumptions of a holding period of 120 business days, 99% confidence level and observation period of 1,200 business days) is used for the calculation of VaR of these financial assets and liabilities. As of March 31, 2014 and 2013, the market risk exposures (the expected maximum loss) of the Bank’s banking operations were as follows.
Value at Risk
Millions of yen Thousands of U.S. dollars
2014 2013 2014 Securities for investment purposes (*1) ¥ 9,659 ¥ 13,792 $ 93,854Strategically held equity securities 18,326 31,560 178,065Loans and deposits (*2) 7,101 7,341 69,002Notes: (*1) Securities for investment purposes: yen bonds, foreign bonds, equity securities for
investment purposes, investment trusts and OTC options (*2) Loans and deposits: deposits, negotiable certificates of deposit, loans and bills discounted,
interest rate swaps for ALM hedging purposes, call loans, dues from banks and others iii) Supplementary explanation about quantitative information on market risk
The Group evaluates the effectiveness of its measurement model by performing back-testing procedures to compare VaR calculated by the measurement system with actual gain or loss. VaR provides information regarding market risk exposure, which is statistically calculated under certain probability based on historical market fluctuations; therefore, it may not be able to measure risks under a situation where the market environment changes extraordinarily.
(iii) Management of liquidity risk associated with fund raising
The Group regards stable fund raising as its top priority and conducts fund management on a timely basis. In addition, the Group manages liquidity risk by diversifying means of fund raising and adjusting the balances of long-term and short-term accounts taking into consideration the market condition.
(4) Supplementary explanation on fair values
The fair values of financial instruments are based on their market prices. If a market price is not available, another rational valuation technique is used instead. Since certain assumptions are used when calculating fair values, different assumptions may lead to different fair values.

29
(b) Fair values of financial instruments
The carrying values and fair values of financial instruments at March 31, 2014 and 2013 were as follows.
Millions of yen 2014
Carrying
value Fair
value Difference Cash and due from banks ¥ 152,950 ¥ 152,950 ¥ –Call loans and bills purchased 806 806 –Trading account securities 16 16 –Securities - Available-for-sale securities (*1) 944,412 944,412 –Loans and bills discounted: 2,109,774 Reserve for possible loan losses (*2) (20,099) Loans and bills discounted – subtotal 2,089,675 2,111,720 22,045
Total ¥ 3,187,861 ¥ 3,209,906 ¥ 22,045Deposits ¥ 3,001,814 ¥ 3,002,779 ¥ 964Call money and bills sold 7,204 7,204 –Payables under securities lending transactions 4,086 4,086 –Borrowed money 20,062 20,098 35
Total ¥ 3,033,168 ¥ 3,034,168 ¥ 1,000
Derivative transactions (*3): To which hedge accounting is not applied ¥ (1,456) ¥ (1,456) ¥ –To which hedge accounting is applied (8) (8) –
Total ¥ (1,464) ¥ (1,464) ¥ – Millions of yen 2013
Carrying
value Fair
value Difference Cash and due from banks ¥ 174,814 ¥ 174,814 ¥ –Call loans and bills purchased 1,668 1,668 –Trading account securities 100 100 –Securities - Available-for-sale securities (*1) 903,945 903,945 –Loans and bills discounted: 2,072,332 Reserve for possible loan losses (*2) (22,956) Loans and bills discounted – subtotal 2,049,376 2,073,046 23,669
Total ¥ 3,129,904 ¥ 3,153,574 ¥ 23,669Deposits ¥ 2,956,057 ¥ 2,956,970 ¥ 913Call money and bills sold 6,583 6,583 –Payables under securities lending transactions 2,879 2,879 –Borrowed money 18,070 18,118 48
Total ¥ 2,983,590 ¥ 2,984,551 ¥ 961
Derivative transactions (*3): To which hedge accounting is not applied ¥ (1,704) ¥ (1,704) ¥ –To which hedge accounting is applied (40) (40) –
Total ¥ (1,745) ¥ (1,745) ¥ –
30
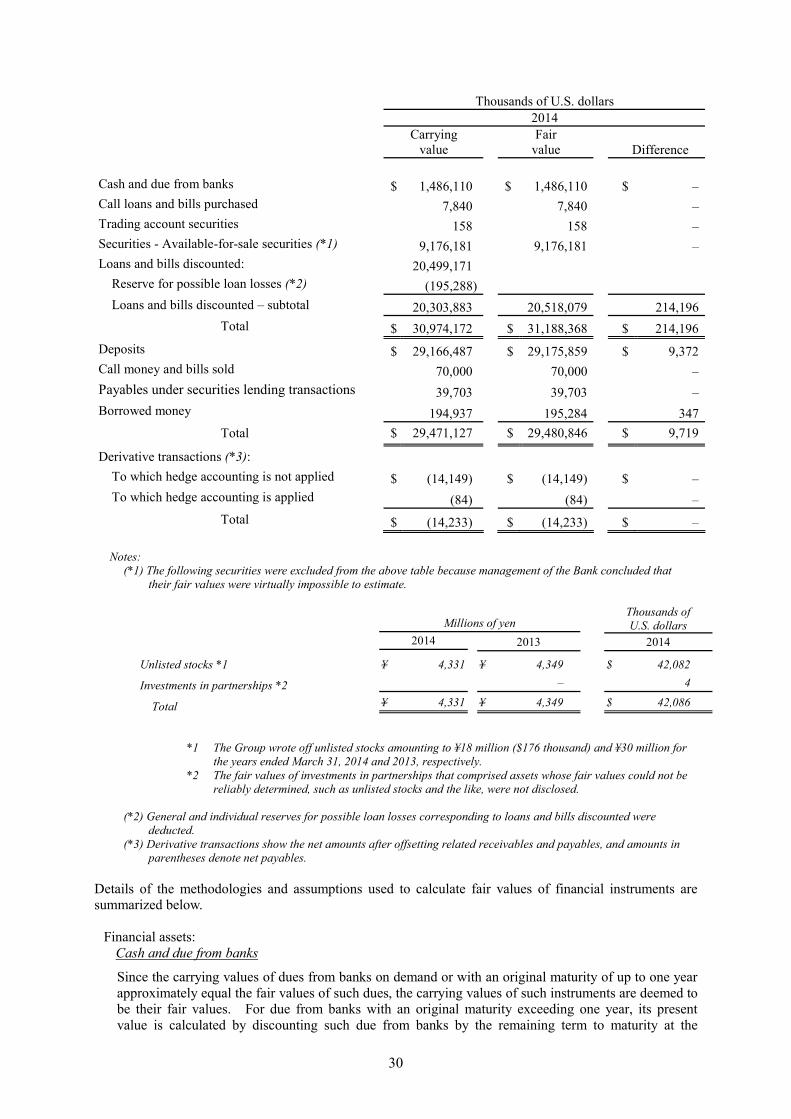
Thousands of U.S. dollars 2014
Carrying
value Fair
value Difference
Cash and due from banks $ 1,486,110 $ 1,486,110 $ –Call loans and bills purchased 7,840 7,840 –Trading account securities 158 158 –Securities - Available-for-sale securities (*1) 9,176,181 9,176,181 –Loans and bills discounted: 20,499,171
Reserve for possible loan losses (*2) (195,288) Loans and bills discounted – subtotal 20,303,883 20,518,079 214,196
Total $ 30,974,172 $ 31,188,368 $ 214,196Deposits $ 29,166,487 $ 29,175,859 $ 9,372Call money and bills sold 70,000 70,000 –Payables under securities lending transactions 39,703 39,703 –Borrowed money 194,937 195,284 347
Total $ 29,471,127 $ 29,480,846 $ 9,719
Derivative transactions (*3): To which hedge accounting is not applied $ (14,149) $ (14,149) $ –To which hedge accounting is applied (84) (84) –
Total $ (14,233) $ (14,233) $ –
Notes: (*1) The following securities were excluded from the above table because management of the Bank concluded that
their fair values were virtually impossible to estimate.
Millions of yen Thousands of U.S. dollars
2014 2013 2014
Unlisted stocks *1 ¥ 4,331 ¥ 4,349 $ 42,082
Investments in partnerships *2 – 4
Total ¥ 4,331 ¥ 4,349 $ 42,086
*1 The Group wrote off unlisted stocks amounting to ¥18 million ($176 thousand) and ¥30 million for
the years ended March 31, 2014 and 2013, respectively. *2 The fair values of investments in partnerships that comprised assets whose fair values could not be
reliably determined, such as unlisted stocks and the like, were not disclosed.
(*2) General and individual reserves for possible loan losses corresponding to loans and bills discounted were deducted.
(*3) Derivative transactions show the net amounts after offsetting related receivables and payables, and amounts in parentheses denote net payables.
Details of the methodologies and assumptions used to calculate fair values of financial instruments are summarized below.
Financial assets:
Cash and due from banks
Since the carrying values of dues from banks on demand or with an original maturity of up to one year approximately equal the fair values of such dues, the carrying values of such instruments are deemed to be their fair values. For due from banks with an original maturity exceeding one year, its present value is calculated by discounting such due from banks by the remaining term to maturity at the

31
corresponding rate applicable to the Group for a new transaction. Call loans and bills purchased
The carrying values of call loans and bills purchased approximate their fair values because of their short maturities (original maturities of up to one year). Trading account securities
The fair values of trading account securities held for trading operation are based on the price published by Japan Securities Dealers Association (“JSDA”) or provided by the applicable contracted financial institution. Securities
The fair values of equity securities, bonds and investment trusts are based on the quoted market price at the applicable exchange, the price published by JSDA or provided by the applicable contracted financial institution and publicly available net asset value, respectively. The fair values of privately-placed bonds are determined by discounting the estimated future cash flows at the risk free rate plus credit spread or the like. The fair values of securities issued by issuers in legal bankruptcy or de facto bankruptcy, or who have bankruptcy risk, are calculated based on the present value of estimated future cash flows or the amount expected to be collected through disposal of collateral or from guarantees. Loans and bills discounted
The fair values of commercial bills, loans on bills and overdrafts which have short maturities (original maturities of up to one year) are approximately equal to their carrying values unless the credit status of the borrower has changed dramatically after execution thereof because of quick reflection of market interest rates to such change. Therefore, the carrying values of these instruments are deemed to be their fair values. The fair values of loans on deeds are determined by discounting the estimated future cash flows at the risk free rate plus credit spread or the like, or at the corresponding rate applicable to the Group for a similar new loan, depending on the nature of such loans. The fair values of structured loans are determined by considering the value calculated by using the option pricing model, in addition to using the method applicable to measuring the fair values of loans on deeds as mentioned above. For loans to borrowers in legal bankruptcy or de facto bankruptcy, or who have bankruptcy risk, a reserve for possible loan losses is estimated based on the present value of estimated future cash flows or the amount expected to be collected through disposal of collateral or from guarantees. Thus, the fair values of such loans approximate the carrying amounts of receivables minus the corresponding amount of reserve for possible loan losses on the consolidated balance sheets at the closing date. Therefore, such carrying amounts are deemed to be the fair values of such loans. The carrying values of loans and bills discounted without repayment terms due to characteristics, such as limitations on loans to the range of collateral assets and the like, are deemed to be their fair values since such carrying values approximately equal their fair values when considering the expected repayment period and interest rate conditions for such loans and bills discounted without repayment terms.
Financial liabilities: Deposits
The fair values of demand deposits in Japanese yen are deemed to be the amounts to be paid (carrying amounts) on the assumption that the Group is demanded to pay on the consolidated balance sheet date. The fair values of time deposits in Japanese yen and negotiable certificates of deposit are determined by discounting future cash flows by the term to maturity at the corresponding rate used for accepting a new deposit. For all deposits in foreign currencies, original maturities are short (within one year) and their carrying values approximate their fair values. Thus, such carrying values are deemed to be the fair values of such deposits in foreign currencies.

32
Call money and bills sold
The original maturities of call money and bills sold are short (within one year) and their carrying values approximate their fair values. Thus, such carrying values are deemed to be the fair values of such call money and bills sold. Payables under securities lending transactions
The original maturities of payables under securities lending transactions are short (within one year) and their carrying values approximate their fair values. Thus, such carrying values are deemed to be the fair values of such payables under securities lending transactions.
Borrowed money
The carrying value of borrowed money with variable interest rate is deemed to be the fair value since such carrying value approximates the fair value. This is due to the quick reflection of market interest rates and immaterial changes in the credit status of the Bank and the subsidiaries after execution of such borrowing. The fair value of borrowed money with a fixed interest rate is the present value determined by discounting the sum of principal and interest by the term to maturity at the corresponding rate for a similar borrowing. For borrowed money with a short maturity (original maturity of up to one year), the carrying value is deemed to be the fair value since such carrying value approximates the fair value.

33
(c) Maturity analysis for monetary claims and securities with contractual maturities as of March 31, 2014
Millions of yen 2014
Due in one year or less
Due after one year through
three years
Due after three years
through five years
Due after five years through
seven years
Due after seven years
through ten years
Due after ten years
Due from banks ¥ 114,927 ¥ – ¥ – ¥ – ¥ – ¥ –Call loans and bills
purchased 806 – – – – –Securities: Available-for-sale securities with maturities (*1)
National government bonds 62,000 119,800 81,100 47,300 12,000 –
Local government bonds 13,176 32,454 26,952 17,139 6,159 –
Bonds and debentures 36,487 92,546 110,244 76,819 18,583 1,199
Others (*2) 5,484 27,425 26,100 10,630 1,543 –Securities - total 117,148 272,226 244,397 151,889 38,286 1,199Loans and bills
discounted (*3) 703,778 395,403 267,079 139,981 178,017 360,844Total ¥ 936,661 ¥ 667,630 ¥ 511,477 ¥ 291,871 ¥ 216,304 ¥ 362,043
Thousands of U.S. dollars
Due from banks $ 1,116,666 $ – $ – $ – $ – $ –Call loans and bills
purchased 7,840 – – – – –Securities: Available-for-sale securities with maturities (*1) National
government bonds 602,410 1,164,011 787,991 459,580 116,595 –
Local government bonds 128,025 315,338 261,880 166,529 59,843 –
Bonds and debentures 354,525 899,210 1,071,163 746,405 180,562 11,650
Others (*2) 53,291 266,475 253,601 103,290 15,000 –
Securities - total 1,138,251 2,645,034 2,374,635 1,475,804 372,000 11,650Loans and bills
discounted (*3) 6,838,111 3,841,849 2,595,023 1,360,099 1,729,671 3,506,064Total $ 9,100,868 $ 6,486,883 $ 4,969,658 $ 2,835,903 $ 2,101,671 $ 3,517,714
Notes: (*1) Amounts of securities were stated on the basis of scheduled redemption amounts regarding the principal and do not match
the amounts shown in the consolidated balance sheets. (*2) “Others” include Samurai bonds, Euro-Yen bonds and foreign currency bonds. (*3) The portion whose timing of collection is unforeseeable, such as loans to “legal bankruptcy” borrowers, loans to “de facto
bankruptcy” borrowers and loans to “bankruptcy risk” borrowers, amounting to ¥64,670 million ($628,354 thousand), was not included in the above table.

34
(d) Repayment schedule for borrowed money and other debts with contractual maturities as of March 31, 2014
Millions of yen 2014
Due in one year or less
Due after one year through
three years
Due after three years
through five years
Due after five years through
seven years
Due after seven years
through ten years
Due after ten years
Deposits (*1) ¥ 2,803,475 ¥ 104,424 ¥ 91,915 ¥ 961 ¥ 1,038 ¥ –Call money and
bills sold 7,204 – – – – –Borrowed money 10,162 7,150 2,750 – – –
Total ¥ 2,820,842 ¥ 111,574 ¥ 94,665 ¥ 961 ¥ 1,038 ¥ –
Thousands of U.S. dollars Deposits (*1) $ 27,239,365 $ 1,014,618 $ 893,077 $ 9,338 $ 10,089 $ –Call money and
bills sold 70,000 – – – – –Borrowed money 98,746 69,471 26,720 – – –
Total $ 27,408,111 $ 1,084,089 $ 919,797 $ 9,338 $ 10,089 $ –Note:
(*1) Demand deposits were included in “due in one year or less.” 4. Trading Account Securities and Securities
At March 31, 2014 and 2013, securities consisted of the following.
Thousands of
Millions of yen U.S. dollars 2014 2013 2014 National government bonds ¥ 327,076 ¥ 345,156 $ 3,177,966Local government bonds 97,607 95,476 948,383Bonds and debentures 340,910 313,204 3,312,385Equity securities 104,052 90,790 1,011,002Other securities 79,097 63,666 768,531 ¥ 948,744 ¥ 908,294 $ 9,218,267
Securities are classified as trading, held-to-maturity or available-for-sale securities. Such classification determines the respective accounting method to be applied as stipulated under the accounting standard for financial instruments. Trading account securities and securities in the accompanying consolidated balance sheets include marketable securities traded on stock exchanges.

35
At March 31, 2014 and 2013, the carrying values of trading account securities and the related valuation differences included in the consolidated statements of income were as follows.
Millions of yen Thousands of U.S. dollars
2014 2013 2014
Carrying
value Valuation difference
Carrying value
Valuation difference
Carrying value
Valuation difference
Trading
account securities ¥ 16 ¥ 0 ¥ 100 ¥ 0 $ 158 $ 0
At March 31, 2014 and 2013, gross unrealized gains and losses on available-for-sale securities with fair values were summarized as follows.
Millions of yen
Acquisition cost
Gross unrealized
gains
Gross unrealized
losses
Fair and carrying
value Available-for-sale securities with fair values at March 31, 2014: Equity securities ¥ 51,415 ¥ 49,377 ¥ (1,072) ¥ 99,721 Bonds: National government bonds 324,112 2,971 (7) 327,076 Local government bonds 96,075 1,537 (5) 97,607 Bonds and debentures 336,542 4,433 (65) 340,910 Others 78,999 648 (551) 79,096 ¥ 887,145 ¥ 58,969 ¥ (1,701) ¥ 944,412
Available-for-sale securities with fair values at March 31, 2013: Equity securities ¥ 51,168 ¥ 36,530 ¥ (1,258) ¥ 86,441 Bonds: National government bonds 340,442 4,719 (5) 345,156 Local government bonds 93,347 2,129 – 95,476 Bonds and debentures 307,617 5,715 (128) 313,204 Others 62,370 1,386 (89) 63,666 ¥ 854,945 ¥ 50,481 ¥ (1,482) ¥ 903,945
Thousands of U.S. dollars Available-for-sale securities with fair value at March 31, 2014: Equity securities $ 499,569 $ 479,770 $ (10,418) $ 968,921 Bonds: National government bonds 3,149,168 28,875 (77) 3,177,966 Local government bonds 933,495 14,941 (53) 948,383 Bonds and debentures 3,269,943 43,075 (633) 3,312,385 Others 767,581 6,300 (5,355) 768,526 $ 8,619,756 $ 572,961 $ (16,536) $ 9,176,181

36
At March 31, 2014 and 2013, net unrealized gains on available-for-sale securities, net of applicable income taxes and minority interests, included in accumulated other comprehensive income of net assets on the accompanying consolidated balance sheets were as follows.
Millions of yen Thousands of U.S. dollars
2014 2013 2014 Unrealized gains ¥ 57,267 ¥ 48,999 $ 556,425 Deferred tax liabilities (19,365) (16,458) (188,162)Minority interests portion (2) (3) (23)
Net unrealized gains in net assets ¥ 37,899 ¥ 32,538 $ 368,240 During the years ended March 31, 2014 and 2013, the Group sold available-for-sale securities and recorded gains of ¥1,673 million ($16,260 thousand) and ¥775 million, respectively, and losses of ¥337 million ($3,284 thousand) and ¥576 million, respectively, in the accompanying consolidated statements of income. For the years ended March 31, 2014 and 2013, the Group recorded losses on write-downs of available-for-sale securities with fair values due to other-than-temporary declines in value amounting to ¥179 million ($1,742 thousand) and ¥100 million, respectively.
5. Loans and Bills Discounted
At March 31, 2014 and 2013, loans and bills discounted consisted of the following.
Millions of yen
Thousands of U.S. dollars
2014 2013 2014 Bills discounted ¥ 46,359 ¥ 53,136 $ 450,445Loans on bills 144,473 152,567 1,403,745Loans on deeds 1,664,557 1,609,723 16,173,313Overdrafts 248,008 251,633 2,409,726Others 6,375 5,269 61,942 ¥ 2,109,774 ¥ 2,072,332 $ 20,499,171
Bills discounted are accounted for as finance transactions in accordance with JICPA Industry Audit Committee Report No. 24, entitled the “Treatment of Accounting and Auditing concerning Application of Accounting Standard for Financial Instruments in Banking Industry.” The Group has rights to sell or pledge (repledge) bankers’ acceptances, commercial bills, documentary bills and foreign bills bought without restrictions. The total face values of these bills amounted to ¥47,312 million ($459,705 thousand) and ¥54,430 million at March 31, 2014 and 2013, respectively. Claims against borrowers in bankruptcy and past due loans are included in “loans and bills discounted” and amounted to ¥64,681 million ($628,465 thousand) and ¥66,028 million at March 31, 2014 and 2013, respectively. Loans are generally placed on non-accrual status when there is substantial doubt about the ultimate collectability of either the principal or interest because such principal or interest is past due for a considerable period or for other reasons. Accrued interest is not recorded when loans are classified as claims against borrowers in bankruptcy or past due loans. Claims against borrowers in bankruptcy represent non-accrual loans after charge-off against legally bankrupt borrowers as defined in Article 96, Paragraph 1, Subparagraphs 3 and 4 of the Order for Enforcement of the
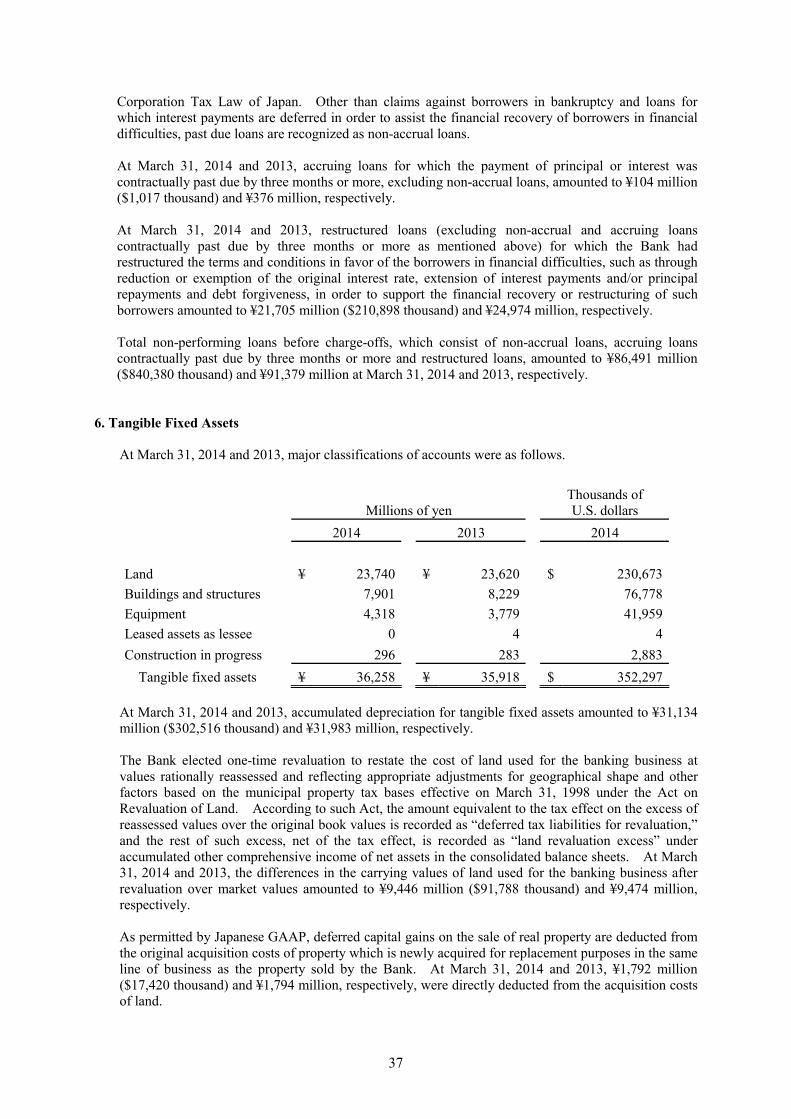
37
Corporation Tax Law of Japan. Other than claims against borrowers in bankruptcy and loans for which interest payments are deferred in order to assist the financial recovery of borrowers in financial difficulties, past due loans are recognized as non-accrual loans. At March 31, 2014 and 2013, accruing loans for which the payment of principal or interest was contractually past due by three months or more, excluding non-accrual loans, amounted to ¥104 million ($1,017 thousand) and ¥376 million, respectively. At March 31, 2014 and 2013, restructured loans (excluding non-accrual and accruing loans contractually past due by three months or more as mentioned above) for which the Bank had restructured the terms and conditions in favor of the borrowers in financial difficulties, such as through reduction or exemption of the original interest rate, extension of interest payments and/or principal repayments and debt forgiveness, in order to support the financial recovery or restructuring of such borrowers amounted to ¥21,705 million ($210,898 thousand) and ¥24,974 million, respectively. Total non-performing loans before charge-offs, which consist of non-accrual loans, accruing loans contractually past due by three months or more and restructured loans, amounted to ¥86,491 million ($840,380 thousand) and ¥91,379 million at March 31, 2014 and 2013, respectively.
6. Tangible Fixed Assets
At March 31, 2014 and 2013, major classifications of accounts were as follows.
Millions of yen Thousands of U.S. dollars
2014 2013 2014 Land ¥ 23,740 ¥ 23,620 $ 230,673Buildings and structures 7,901 8,229 76,778Equipment 4,318 3,779 41,959Leased assets as lessee 0 4 4Construction in progress 296 283 2,883
Tangible fixed assets ¥ 36,258 ¥ 35,918 $ 352,297 At March 31, 2014 and 2013, accumulated depreciation for tangible fixed assets amounted to ¥31,134 million ($302,516 thousand) and ¥31,983 million, respectively. The Bank elected one-time revaluation to restate the cost of land used for the banking business at values rationally reassessed and reflecting appropriate adjustments for geographical shape and other factors based on the municipal property tax bases effective on March 31, 1998 under the Act on Revaluation of Land. According to such Act, the amount equivalent to the tax effect on the excess of reassessed values over the original book values is recorded as “deferred tax liabilities for revaluation,” and the rest of such excess, net of the tax effect, is recorded as “land revaluation excess” under accumulated other comprehensive income of net assets in the consolidated balance sheets. At March 31, 2014 and 2013, the differences in the carrying values of land used for the banking business after revaluation over market values amounted to ¥9,446 million ($91,788 thousand) and ¥9,474 million, respectively. As permitted by Japanese GAAP, deferred capital gains on the sale of real property are deducted from the original acquisition costs of property which is newly acquired for replacement purposes in the same line of business as the property sold by the Bank. At March 31, 2014 and 2013, ¥1,792 million ($17,420 thousand) and ¥1,794 million, respectively, were directly deducted from the acquisition costs of land.

38
7. Pledged Assets
The carrying amounts of assets pledged as collateral and related collateralized debt at March 31, 2014 and 2013 were as follows.
Millions of yen
Thousands of U.S. dollars
2014 2013 2014 Assets pledged: Securities ¥ 37,042 ¥ 35,429 $ 359,912 Other assets 20 20 199 Related collateralized debts: Deposits ¥ 16,144 ¥ 4,176 $ 156,865
Payables under securities
lending transactions 4,086 2,879 39,703 Borrowed money 3,337 1,970 32,433
In addition, securities amounting to ¥64,781 million ($629,437 thousand) and ¥65,870 million at March 31, 2014 and 2013, respectively, were pledged as collateral for the settlement of exchange and other transactions.
8. Deposits
At March 31, 2014 and 2013, deposits consisted of the following.
Millions of yen
Thousands of U.S. dollars
2014 2013 2014 Demand deposits ¥ 1,650,388 ¥ 1,623,787 $ 16,035,647Time deposits 1,247,938 1,240,566 12,125,327Other deposits 50,482 45,363 490,501
Subtotal 2,948,809 2,909,717 28,651,475Negotiable certificates of
deposit 53,005 46,340 515,012 ¥ 3,001,814 ¥ 2,956,057 $ 29,166,487
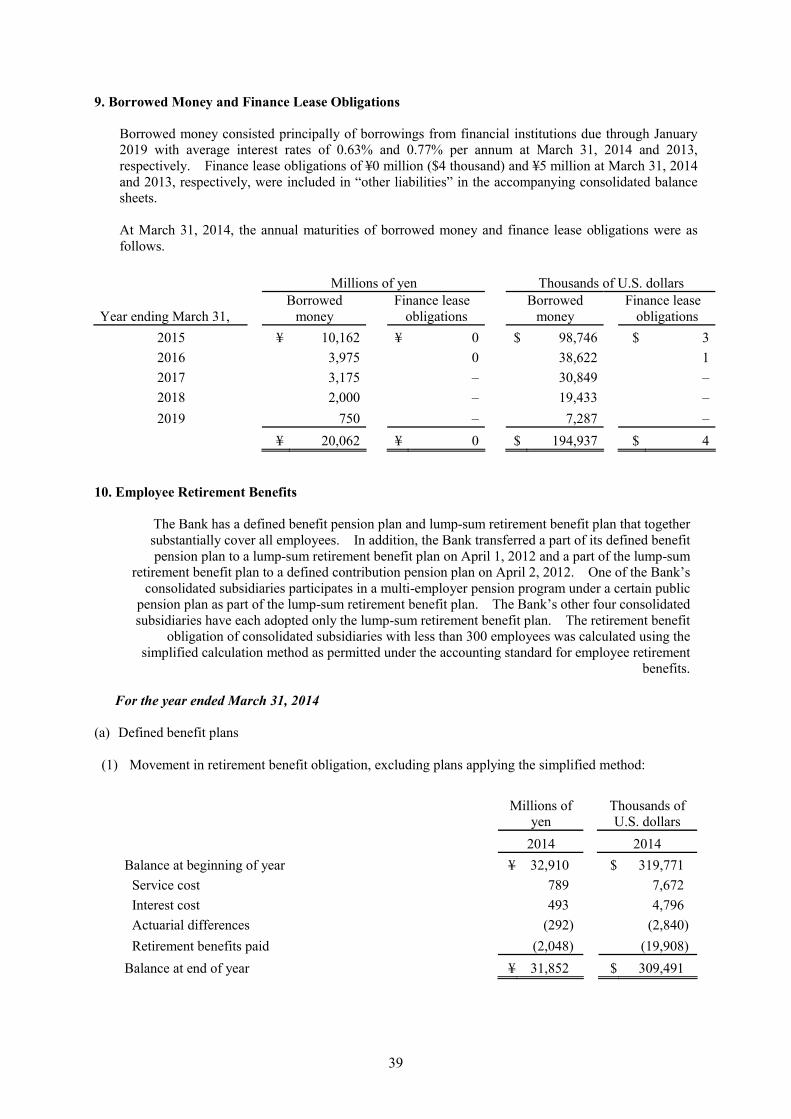
39
9. Borrowed Money and Finance Lease Obligations Borrowed money consisted principally of borrowings from financial institutions due through January 2019 with average interest rates of 0.63% and 0.77% per annum at March 31, 2014 and 2013, respectively. Finance lease obligations of ¥0 million ($4 thousand) and ¥5 million at March 31, 2014 and 2013, respectively, were included in “other liabilities” in the accompanying consolidated balance sheets. At March 31, 2014, the annual maturities of borrowed money and finance lease obligations were as follows.
Millions of yen Thousands of U.S. dollars Borrowed Finance lease Borrowed Finance lease Year ending March 31, money obligations money obligations 2015 ¥ 10,162 ¥ 0 $ 98,746 $ 3 2016 3,975 0 38,622 1 2017 3,175 – 30,849 – 2018 2,000 – 19,433 – 2019 750 – 7,287 – ¥ 20,062 ¥ 0 $ 194,937 $ 4
10. Employee Retirement Benefits
The Bank has a defined benefit pension plan and lump-sum retirement benefit plan that together substantially cover all employees. In addition, the Bank transferred a part of its defined benefit pension plan to a lump-sum retirement benefit plan on April 1, 2012 and a part of the lump-sum
retirement benefit plan to a defined contribution pension plan on April 2, 2012. One of the Bank’s consolidated subsidiaries participates in a multi-employer pension program under a certain public
pension plan as part of the lump-sum retirement benefit plan. The Bank’s other four consolidated subsidiaries have each adopted only the lump-sum retirement benefit plan. The retirement benefit
obligation of consolidated subsidiaries with less than 300 employees was calculated using the simplified calculation method as permitted under the accounting standard for employee retirement
benefits.
For the year ended March 31, 2014
(a) Defined benefit plans
(1) Movement in retirement benefit obligation, excluding plans applying the simplified method:
Millions of
yen Thousands of U.S. dollars
2014 2014 Balance at beginning of year ¥ 32,910 $ 319,771
Service cost 789 7,672 Interest cost 493 4,796 Actuarial differences (292) (2,840)Retirement benefits paid (2,048) (19,908)
Balance at end of year ¥ 31,852 $ 309,491
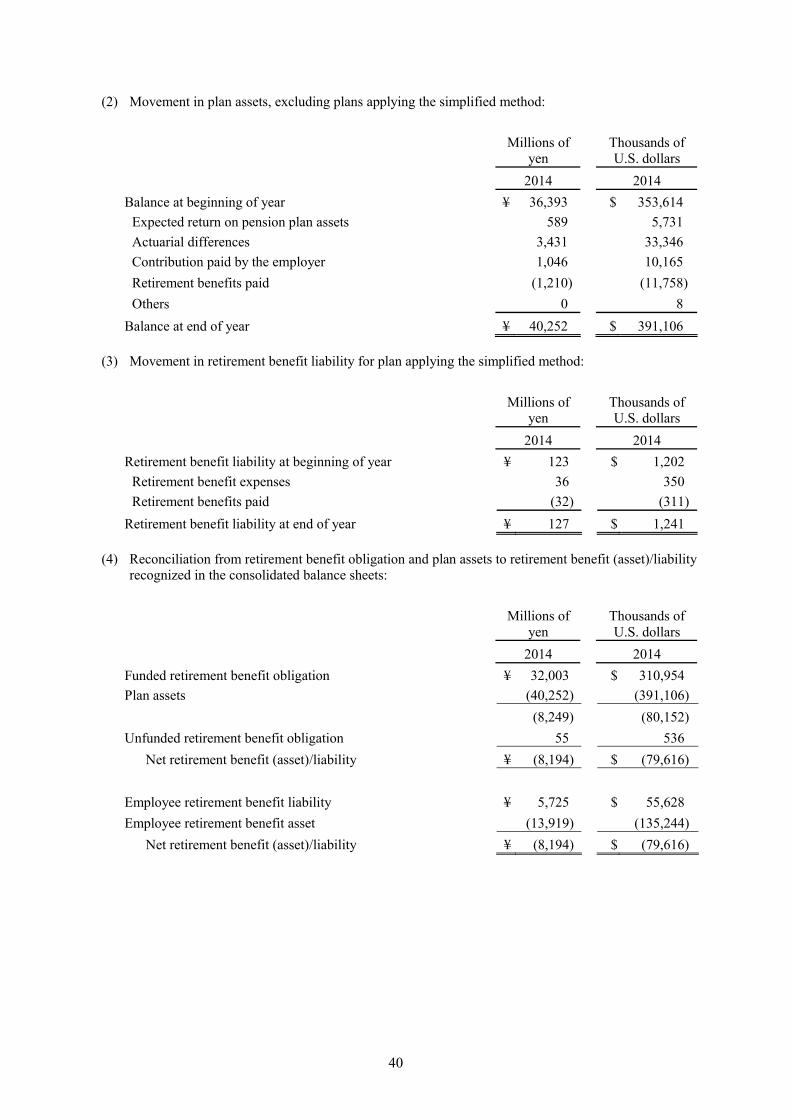
40
(2) Movement in plan assets, excluding plans applying the simplified method:
Millions of
yen Thousands of U.S. dollars
2014 2014 Balance at beginning of year ¥ 36,393 $ 353,614
Expected return on pension plan assets 589 5,731 Actuarial differences 3,431 33,346 Contribution paid by the employer 1,046 10,165 Retirement benefits paid (1,210) (11,758)Others 0 8
Balance at end of year ¥ 40,252 $ 391,106
(3) Movement in retirement benefit liability for plan applying the simplified method:
Millions of
yen Thousands of U.S. dollars
2014 2014 Retirement benefit liability at beginning of year ¥ 123 $ 1,202
Retirement benefit expenses 36 350 Retirement benefits paid (32) (311)
Retirement benefit liability at end of year ¥ 127 $ 1,241
(4) Reconciliation from retirement benefit obligation and plan assets to retirement benefit (asset)/liability recognized in the consolidated balance sheets:
Millions of
yen Thousands of U.S. dollars
2014 2014 Funded retirement benefit obligation ¥ 32,003 $ 310,954 Plan assets (40,252) (391,106)
(8,249) (80,152)Unfunded retirement benefit obligation 55 536
Net retirement benefit (asset)/liability ¥ (8,194) $ (79,616) Employee retirement benefit liability ¥ 5,725 $ 55,628 Employee retirement benefit asset (13,919) (135,244)
Net retirement benefit (asset)/liability ¥ (8,194) $ (79,616)

41
(5) Net periodic retirement benefit expense and its breakdown:
Millions of
yen Thousands of U.S. dollars
2014 2014 Service cost ¥ 789 $ 7,672 Interest cost 493 4,797 Expected return on plan assets (589) (5,731)Amortization of actuarial differences 927 9,007 Amortization of past service costs (90) (876)Retirement benefit expenses for plans applying the simplified method 36 350
Net periodic retirement benefit expense of defined benefit plans ¥ 1,566 $ 15,219
(6) Retirement benefit adjustments in accumulated other comprehensive income, before tax effects:
Millions of
yen Thousands of U.S. dollars
2014 2014 Unrecognized past service costs ¥ 1,594 $ 15,494 Unrecognized actuarial differences 1,130 10,988
Total ¥ 2,725 $ 26,482
(7) Plan assets (i) Plan assets comprise:
2014 Debt securities 41% Equity securities 41% Cash and deposits 7% General accounts 11%
Total * 100%
Note: 44% of plan assets consisted of retirement benefit trusts that are set up for the defined benefit pension plan and lump-sum retirement benefit plan.
(ii) Determination of long-term expected rate of return on plan assets
In determining the long-term expected rate of return on plan assets, the Group considers the current and target asset allocations as well as the current and expected long-term rate of return on various asset categories comprising plan assets.
(8) Actuarial assumptions at end of year:
2014
Discount rate 1.5% Long-term expected rate of return on plan assets 2.5%

42
(b) Defined contribution plan
The required contribution of the Bank and its consolidated subsidiaries to the defined contribution plan amounted to ¥157 million ($1,533 thousand) for the year ended March 31, 2014.
For the year ended March 31, 2013
The following table reconciles the benefit liabilities and net periodic retirement benefit expense as of and for the year ended March 31, 2013.
Millions of yen 2013 Reconciliation of benefit liabilities: Retirement benefit obligation ¥ 33,103 Less fair value of pension plan assets at end of year (36,393)
Pension plan assets in excess of retirement benefit obligation (3,290) Unrecognized actuarial differences (3,520) Unrecognized prior service cost 1,684
Net amounts of reserve for employee retirement benefits (5,126) Prepaid pension cost 11,128
Reserve for employee retirement benefits recognized in the consolidated balance sheets ¥ 6,002
Millions of yen 2013 Components of net periodic retirement benefit expense:
Service cost ¥ 859 Interest cost 502 Expected return on pension plan assets (531) Amortization of past service costs (90) Amortization of actuarial differences 1,233 Others, including contributions to defined contribution benefit plan 163
Net periodic retirement benefit expense ¥ 2,137 Major assumptions used in the calculation of the above information for the year ended March 31, 2013 are as follows.
2013
Method attributing the projected benefits to periods of services Straight-line method Discount rate 1.50% Expected rate of return on plan assets 2.50% Amortization period of past service costs 13 years Amortization period of actuarial differences 13 years

43
11. Acceptances and Guarantees
The Bank provides guarantees with respect to liabilities of its customers for payment of loans or other liabilities with other financial institutions. As a contra account, “customers’ liabilities for acceptances and guarantees” has been shown in assets on the accompanying consolidated balance sheets, indicating the Bank’s right of indemnity from customers.
Guarantees are provided on certain privately-placed bonds included in securities in accordance with Article 2, Paragraph 3 of the Financial Instruments and Exchange Act of Japan. The guarantees amounted to ¥13,443 million ($130,625 thousand) and ¥14,982 million at March 31, 2014 and 2013, respectively.
12. Net Assets
At both March 31, 2014 and 2013, the authorized number of shares of common stock without par value was 500 million shares, and the number of shares of common stock issued was 205,054,873 shares. At March 31, 2014 and 2013, the number of shares of treasury stock held by the Group was 436 thousand and 412 thousand shares, respectively. Under Japanese laws and regulations, the entire amount paid for new shares is required to be designated as common stock. However, a company may, by a resolution of the Board of Directors, designate an amount not exceeding one-half of the issue price of the new shares as additional paid-in capital, which is included in capital surplus.
Capital surplus consists principally of additional paid-in capital. The Banking Act of Japan provides that an amount equivalent to at least 20% of the cash payments as appropriation of retained earnings shall be appropriated as legal earnings reserve until the total amount of additional paid-in capital and such reserve equals 100% of common stock. The legal earnings reserve has been included in the retained earnings in the accompanying consolidated balance sheets. Under such Act, the legal earnings reserve and additional paid-in capital can be used to eliminate or reduce a deficit by a resolution at the shareholders’ meeting. The additional paid-in capital and legal earnings reserve may not be distributed as dividends. All additional paid-in capital and legal earnings reserve may be transferred to other capital surplus and retained earnings, respectively, which may become available for distribution as dividends. Both at March 31, 2014 and 2013, the legal earnings reserve amounted to ¥8,029 million ($78,021 thousand).
The maximum amount that the Bank can distribute as dividends is calculated based on the nonconsolidated financial statements of the Bank in accordance with Japanese laws and regulations.
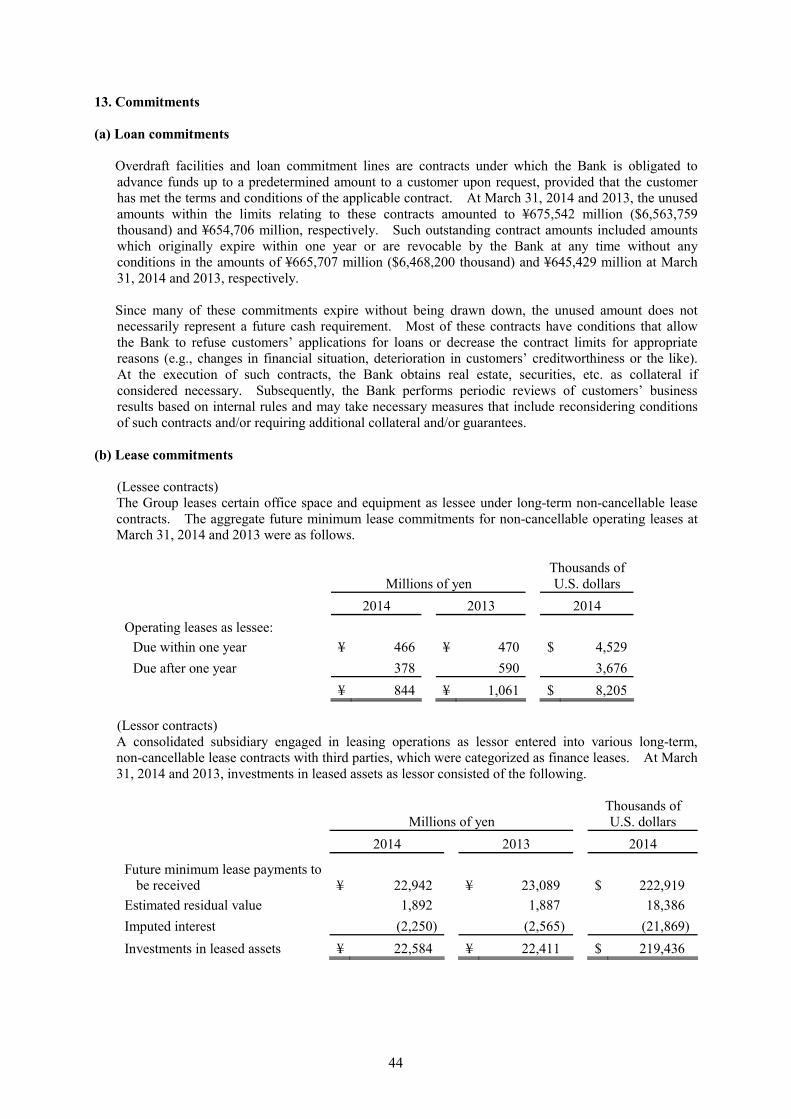
44
13. Commitments
(a) Loan commitments
Overdraft facilities and loan commitment lines are contracts under which the Bank is obligated to advance funds up to a predetermined amount to a customer upon request, provided that the customer has met the terms and conditions of the applicable contract. At March 31, 2014 and 2013, the unused amounts within the limits relating to these contracts amounted to ¥675,542 million ($6,563,759 thousand) and ¥654,706 million, respectively. Such outstanding contract amounts included amounts which originally expire within one year or are revocable by the Bank at any time without any conditions in the amounts of ¥665,707 million ($6,468,200 thousand) and ¥645,429 million at March 31, 2014 and 2013, respectively. Since many of these commitments expire without being drawn down, the unused amount does not necessarily represent a future cash requirement. Most of these contracts have conditions that allow the Bank to refuse customers’ applications for loans or decrease the contract limits for appropriate reasons (e.g., changes in financial situation, deterioration in customers’ creditworthiness or the like). At the execution of such contracts, the Bank obtains real estate, securities, etc. as collateral if considered necessary. Subsequently, the Bank performs periodic reviews of customers’ business results based on internal rules and may take necessary measures that include reconsidering conditions of such contracts and/or requiring additional collateral and/or guarantees.
(b) Lease commitments
(Lessee contracts) The Group leases certain office space and equipment as lessee under long-term non-cancellable lease contracts. The aggregate future minimum lease commitments for non-cancellable operating leases at March 31, 2014 and 2013 were as follows.
Thousands of Millions of yen U.S. dollars 2014 2013 2014 Operating leases as lessee:
Due within one year ¥ 466 ¥ 470 $ 4,529 Due after one year 378 590 3,676
¥ 844 ¥ 1,061 $ 8,205 (Lessor contracts) A consolidated subsidiary engaged in leasing operations as lessor entered into various long-term, non-cancellable lease contracts with third parties, which were categorized as finance leases. At March 31, 2014 and 2013, investments in leased assets as lessor consisted of the following.
Thousands of
Millions of yen U.S. dollars 2014 2013 2014
Future minimum lease payments to be received ¥ 22,942 ¥ 23,089 $ 222,919
Estimated residual value 1,892 1,887 18,386 Imputed interest (2,250) (2,565) (21,869)Investments in leased assets ¥ 22,584 ¥ 22,411 $ 219,436

45
The aggregate annual maturities of future minimum lease payments to be received related to investments in leased assets at March 31, 2014 were as follows.
Thousands of Year ending March 31, Millions of yen U.S. dollars 2015 ¥ 7,578 $ 73,639 2016 5,711 55,491 2017 4,286 41,652 2018 2,895 28,134 2019 1,551 15,071 2020 and thereafter 919 8,932 ¥ 22,942 $ 222,919
At March 31, 2014 and 2013, future lease payments to be received for non-cancellable operating leases were as follows.
Thousands of
Millions of yen U.S. dollars 2014 2013 2014 Operating leases as lessor:
Due within one year ¥ 84 ¥ 135 $ 820Due after one year 75 86 731
¥ 159 ¥ 221 $ 1,551

46
14. Derivative Instruments
At March 31, 2014 and 2013, derivative instruments, other than those to which hedge accounting was applied, were stated at fair value with valuation gains and losses recognized as current earnings in the accompanying consolidated statements of income as follows.
Millions of yen
Notional principals or contract amounts
Total Over one
year Fair value * Valuation gain/(loss)
At March 31, 2014: Interest rate swaps ¥ 20,000 ¥ 20,000 ¥ (1,085) ¥ (1,085)Currency swaps 26,393 – (356) (356)Forward foreign exchange contracts 5,183 – (14) (14)
At March 31, 2013:
Interest rate swaps ¥ 20,000 ¥ 20,000 ¥ (1,311) ¥ (1,311)Currency swaps 14,212 – (361) (361)Forward foreign exchange contracts 2,518 – (31) (31)
Thousands of U.S. dollars At March 31, 2014:
Interest rate swaps $ 194,326 $ 194,326 $ (10,544) $ (10,544)Currency swaps 256,446 – (3,461) (3,461)Forward foreign exchange contracts 50,365 – (144) (144)
Note: Fair values were calculated based on the discounted cash flow method, etc.
Derivative instruments to which hedge accounting was applied at March 31, 2014 and 2013 were as follows.
Millions of yen Notional principals or
contract amounts
Hedged
item Total Over one
year Fair
value *
Currency swap contracts:
As of March 31, 2014 Loans in foreign currencies ¥ 329 ¥ – ¥ (8)
As of March 31, 2013 Loans in foreign currencies 680 – (40)
Thousands of U.S. dollars Currency swap contracts:
As of March 31, 2014 Loans in foreign currencies $ 3,198 $ – $ (84)
Note: Fair values were calculated based on the discounted cash flow method, etc.

47
15. Income Taxes
Income taxes for the years ended March 31, 2014 and 2013 consisted of the following.
Millions of yen
Thousands of U.S. dollars
2014 2013 2014 Income taxes:
Current ¥ 2,424 ¥ 3,963 $ 23,561 Deferred 1,659 283 16,125
¥ 4,084 ¥ 4,246 $ 39,686 At March 31, 2014 and 2013, income taxes (including enterprise taxes) payable amounting to ¥1,912 million ($18,580 thousand) and ¥3,188 million, respectively, were included in “other liabilities” in the accompanying consolidated balance sheets. The tax effects of temporary differences that gave rise to a significant portion of deferred tax assets and liabilities at March 31, 2014 and 2013 were as follows.
Thousands of
Millions of yen U.S. dollars 2014 2013 2014 Deferred tax assets: Reserve for possible loan losses ¥ 6,993 ¥ 8,126 $ 67,949 Reserve for employee retirement benefits – 3,766 – Employee retirement benefit (asset)/liability 2,600 – 25,263 Loss on devaluation of stocks and other
securities 2,994 3,038 29,094 Reserve for contingent loss 1,212 1,431 11,779 Depreciation 881 988 8,562 Others 3,599 3,730 34,979 Less valuation allowance (4,910) (4,775) (47,712) Subtotal 13,370 16,307 129,914Deferred tax liabilities: Unrealized gains on available-for-sale
securities (19,365) (16,458) (188,162) Gain on transfer of securities to trusts for
retirement benefit plan (3,325) (3,601) (32,309) Others (100) (100) (975) Subtotal (22,791) (20,159) (221,446) Net deferred tax assets(liabilities) ¥ (9,420) ¥ (3,852) $ (91,532)
At March 31, 2014 and 2013, deferred tax assets and liabilities were as follows.
Thousands of
Millions of yen U.S. dollars 2014 2013 2014
Deferred tax assets ¥ 1,118 ¥ 1,277 $ 10,864
Deferred tax liabilities (10,538) (5,130) (102,396)

48
In assessing the realizability of deferred tax assets, management of the Group considers whether some portion or all of the deferred tax assets will not be realized. The ultimate realization of deferred tax assets is dependent upon the generation of future taxable income during the periods in which those temporary differences become deductible. At both March 31, 2014 and 2013, a valuation allowance was provided to reduce the deferred tax assets to amounts that management believed would be realizable. The Group is subject to Japanese national and local income taxes which in the aggregate resulted in an effective statutory tax rate of approximately 37.7% for the years ended March 31, 2014 and 2013. Information about reconciliation between the Japanese statutory effective tax rate and the actual effective income tax rate on pre-tax income reflected in the accompanying consolidated statements of income for the year ended March 31, 2013 was not disclosed as their difference was less than 5% of the statutory tax rate for the year ended March 31, 2013. Reconciliation between the Japanese statutory effective tax rate and the actual effective income tax rate on pre-tax income reflected in the accompanying consolidated statements of income for the year ended March 31, 2014 is as follows.
Percentage of
pre-tax income 2014 Japanese statutory effective tax rate 37.7 % Increase (decrease) due to: Permanently non-deductible expenses 1.0 Tax exempt income (4.7) Local minimum taxes - per capita basis 0.7 Changes in valuation allowance 1.5 Effects of income tax rate change 4.0 Others 1.5
Actual effective tax rate 41.8 %
Following the promulgation on March 31, 2014 of the “Act for Partial Revision of the Income Tax Act, etc.” (Act No. 10 of 2014), a special surtax to be applied to restoration work in connection with the Great East Japan Earthquake has been abolished from the fiscal year beginning on or after April 1, 2014. In line with this revision, the Bank has changed the statutory tax rate used to calculate deferred tax assets and liabilities from 37.7% to 35.3% for temporary differences expected to be reversed in the fiscal year beginning on April 1, 2014. As a result of this tax rate change, deferred tax assets decreased by ¥344 million ($3,351 thousand) as of March 31, 2014 and deferred income taxes increased by ¥344 million ($3,351 thousand) for the year ended March 31, 2014.

49
16. Comprehensive Income
Amounts reclassified to net income (loss) in the current period that were recognized in other comprehensive income in the current or previous periods and tax effects for each component of other comprehensive income for the years ended March 31, 2014 and 2013 were as follows.
Millions of yen Thousands of U.S. dollars
2014 2013 2014 Net change in unrealized gains on
available-for-sale securities:
Increase during the year ¥ 9,743 ¥ 26,681 $ 94,673 Reclassification adjustments (1,476) (153) (14,343) Pre-tax amount 8,267 26,527 80,330 Tax effect amount (2,907) (8,960) (28,248)
Net change in unrealized gains on available-for-sale securities, net of tax 5,360 17,567 52,082
Net change in deferred losses on hedging instruments:
Decrease during the year (18) (25) (176) Reclassification adjustments 18 25 177 Pre-tax amount 0 (0) 1 Tax effect amount (0) 0 (0)
Net change in deferred losses on hedging instruments, net of tax 0 (0) 1
Total other comprehensive
income ¥ 5,360 ¥ 17,567 $ 52,083 17. Related Party Transactions
During the years ended March 31, 2014 and 2013, the Bank had significant transactions with the Bank’s directors and audit and supervisory board members, and their immediate family members and/or the companies in which they hold a majority voting interest. A summary of the significant related party transactions as of and for the years ended March 31, 2014 and 2013 is as follows.
Millions of yen Thousands of U.S. dollars
2014 2013 2014 For the year: Number of related parties 5 7
Amount of lending loan transactions
(average balance) ¥ 92 ¥ 98 $ 898 At year-end: Loans and bills discounted ¥ 91 ¥ 82 $ 892
50
18. Subsequent Events
Appropriation of retained earnings
Shareholders of the Bank approved the following appropriation of retained earnings at the annual general meeting held on June 27, 2014.
Millions of
yen Thousands of U.S. dollars
Cash dividends at ¥3.50 per share ($0.03 per share) ¥ 716 $ 6,959
19. Segment Information (a) General information about reportable segments
The Group defines a reportable segment as a component of the Group for which separate financial information is available and whose operating results are regularly reviewed by the Board of Directors to make decisions about resources to be allocated to such segment and assess its performance. The Group engages in financial services primarily in banking and also in comprehensive finance leasing services and credit card services. The reportable segments of the Group are determined based on the types of financial services as follows.
“Banking” –– head office and branches
• Deposits and loans • Domestic and foreign exchange transactions • Securities investments • Trading of trading account securities • Underwriting and registration of corporate bonds
“Leasing” –– Nagoya Lease Co., Ltd., a domestic subsidiary of the Bank
• Comprehensive finance leasing business
“Credit Card” –– Nagoya Card Co., Ltd. and Nagoya MC Card Co., Ltd., domestic subsidiaries of the Bank
• Credit card business
(b) Basis of measurement for segment profit, segment assets, segment liabilities and other material items for each reportable segment
The measurement basis for reportable segment information follows the accounting principles used in the consolidated financial statements as described in Note 2, entitled the “Summary of Significant Accounting Policies.” The segment profit is based on “ordinary income,” which is defined as total income less certain special gains and certain special losses included in the accompanying consolidated statements of income, and intersegment income is accounted for based on prices of ordinary transactions with independent third parties.
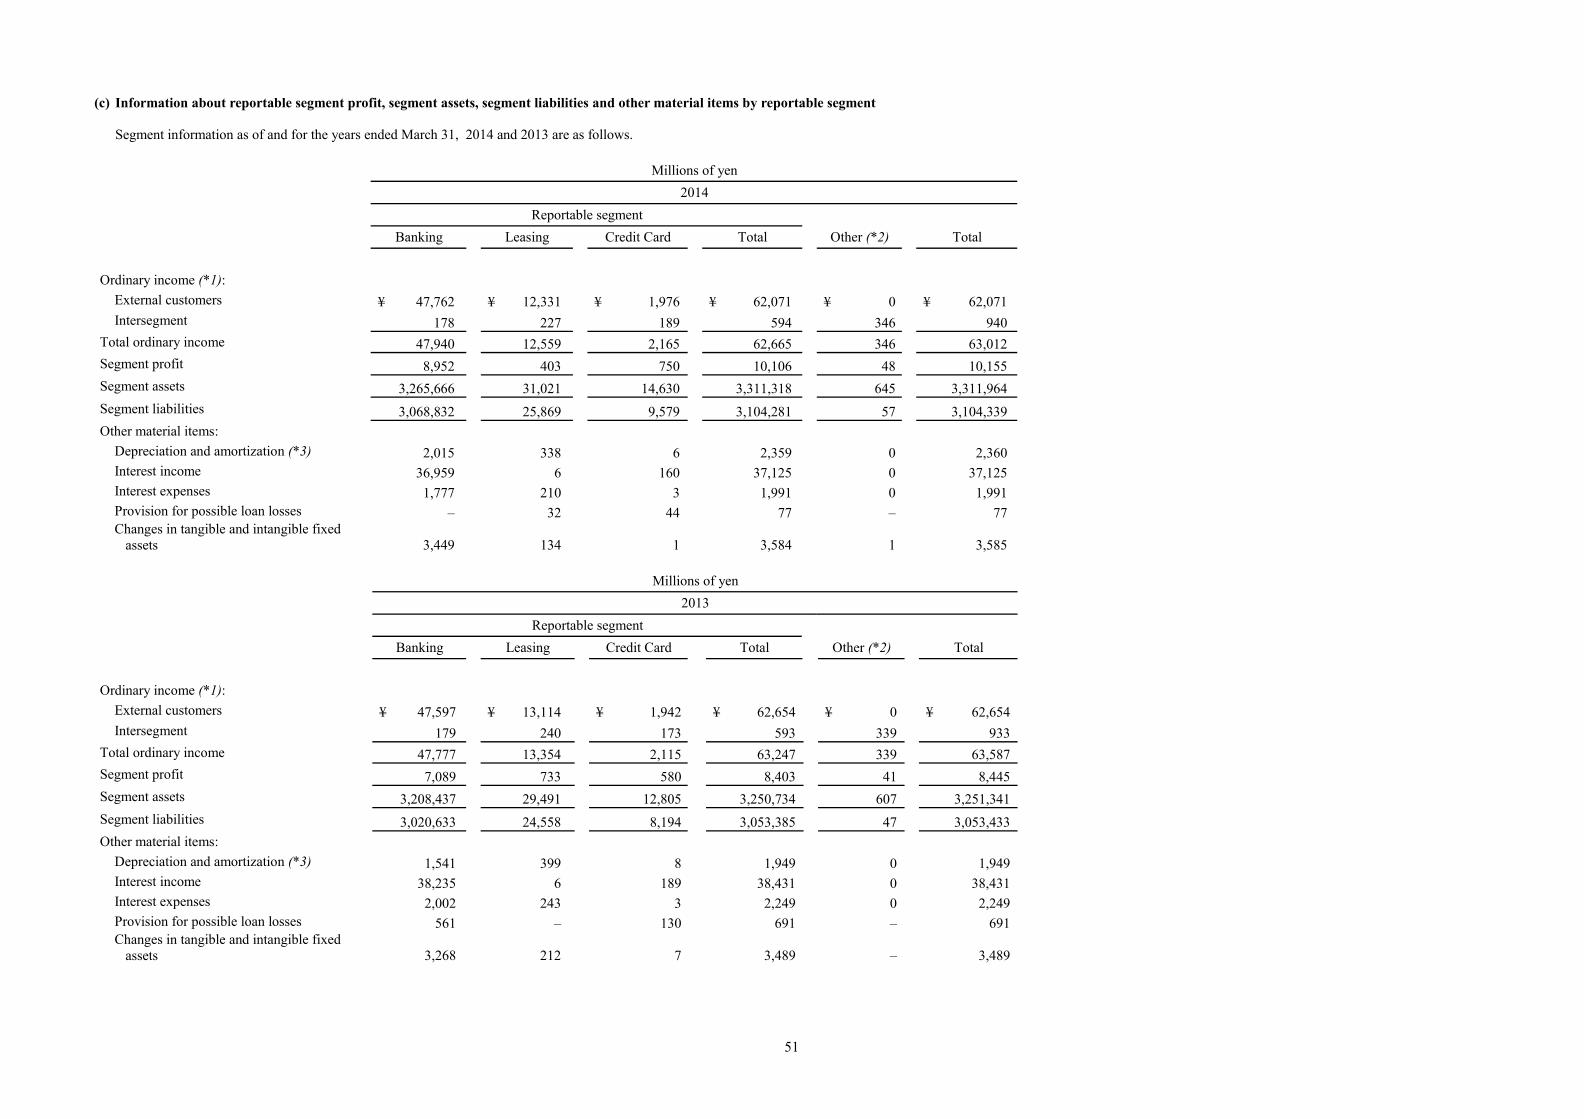
51
(c) Information about reportable segment profit, segment assets, segment liabilities and other material items by reportable segment Segment information as of and for the years ended March 31, 2014 and 2013 are as follows. Millions of yen 2014 Reportable segment
Banking Leasing Credit Card Total Other (*2) Total Ordinary income (*1):
External customers ¥ 47,762 ¥ 12,331 ¥ 1,976 ¥ 62,071 ¥ 0 ¥ 62,071Intersegment 178 227 189 594 346 940
Total ordinary income 47,940 12,559 2,165 62,665 346 63,012Segment profit 8,952 403 750 10,106 48 10,155Segment assets 3,265,666 31,021 14,630 3,311,318 645 3,311,964Segment liabilities 3,068,832 25,869 9,579 3,104,281 57 3,104,339Other material items:
Depreciation and amortization (*3) 2,015 338 6 2,359 0 2,360Interest income 36,959 6 160 37,125 0 37,125Interest expenses 1,777 210 3 1,991 0 1,991Provision for possible loan losses – 32 44 77 – 77Changes in tangible and intangible fixed
assets
3,449 134 1 3,584 1 3,585 Millions of yen 2013 Reportable segment
Banking Leasing Credit Card Total Other (*2) Total Ordinary income (*1):
External customers ¥ 47,597 ¥ 13,114 ¥ 1,942 ¥ 62,654 ¥ 0 ¥ 62,654Intersegment 179 240 173 593 339 933
Total ordinary income 47,777 13,354 2,115 63,247 339 63,587Segment profit 7,089 733 580 8,403 41 8,445Segment assets 3,208,437 29,491 12,805 3,250,734 607 3,251,341Segment liabilities 3,020,633 24,558 8,194 3,053,385 47 3,053,433Other material items:
Depreciation and amortization (*3) 1,541 399 8 1,949 0 1,949Interest income 38,235 6 189 38,431 0 38,431Interest expenses 2,002 243 3 2,249 0 2,249Provision for possible loan losses 561 – 130 691 – 691Changes in tangible and intangible fixed
assets
3,268 212
7 3,489 – 3,489

52
Thousands of U.S. dollars 2014 Reportable segment
Banking Leasing Credit Card Total Other (*2) Total Ordinary income (*1):
External customers $ 464,076 $ 119,820 $ 19,208 $ 603,104 $ 2 $ 603,106Intersegment 1,732 2,208 1,837 5,777 3,365 9,142
Total ordinary income 465,808 122,028 21,045 608,881 3,367 612,248Segment profit 86,985 3,922 7,292 98,199 474 98,673Segment assets 31,730,149 301,416 142,151 32,173,716 6,272 32,179,988Segment liabilities 29,817,650 251,353 93,081 30,162,084 563 30,162,647Other material items:
Depreciation and amortization (*3) 19,580 3,286 61 22,927 4 22,931Interest income 359,105 60 1,561 360,726 0 360,726Interest expenses 17,273 2,047 34 19,354 0 19,354Provision for possible loan losses – 318 434 752 – 752Changes in tangible and intangible fixed
assets
33,513 1,302
10 34,825 12 34,837
Notes: 1. “Ordinary income” represents total income less certain special gains included in the accompanying consolidated statements of income.
2. The “other” business segment includes principally the clerical outsourcing business.
3. Depreciation and amortization include amounts relating to information technology investments.

53
(d) Reconciliations of the totals of each segment item to corresponding Group amounts
Millions of yen
Thousands of U.S. dollars
2014 2013 2014 Ordinary income:
Total reportable segments ¥ 62,665 ¥ 63,247 $ 608,881 Other 346 339 3,367 Intersegment elimination (940) (933) (9,142)Gain on reversal of reserve for possible
loan losses (77) (51) (752) 61,994 62,602 602,354
Special gains 29 2,642 284 Total income on consolidated statements of income ¥ 62,023 ¥ 65,244 $ 602,638
Segment profit:
Total reportable segments ¥ 10,106 ¥ 8,403 $ 98,199 Other 48 41 474 Intersegment elimination (15) (11) (149) 10,140 8,433 98,524 Special gains (losses), net (359) 2,333 (3,489)
Income before income taxes and minority interests on consolidated statements of income ¥ 9,781 ¥ 10,767 $ 95,035
Segment assets:
Total reportable segments ¥ 3,311,318 ¥ 3,250,734 $ 32,173,716 Other 645 607 6,272 Intersegment elimination (15,468) (14,914) (150,296)Adjustment of retirement benefit asset 2,610 – 25,367
Total assets on consolidated balance sheets ¥ 3,299,106 ¥ 3,236,427 $ 32,055,059
Segment liabilities:
Total reportable segments ¥ 3,104,281 ¥ 3,053,385 $ 30,162,084Other 57 47 563Intersegment elimination (12,969) (12,416) (126,018)Adjustment of retirement benefit liability 847 – 8,233
Total liabilities on consolidated balance sheets ¥ 3,092,217 ¥ 3,041,016 $ 30,044,862

54
Millions of yen 2014
Other material items:
Total reportable segments Other Reconciliation Consolidated
Depreciation and amortization ¥ 2,359 ¥ 0 ¥ – ¥ 2,360Interest income 37,125 0 (97) 37,028Interest expenses 1,991 0 (105) 1,886Provision for possible loan losses 77 – (77) –Changes in tangible and intangible fixed assets
3,584
1
–
3,585
Millions of yen 2013
Other material items:
Total reportable segments Other Reconciliation Consolidated
Depreciation and amortization ¥ 1,949 ¥ 0 ¥ – ¥ 1,949Interest income 38,431 0 (94) 38,336Interest expenses 2,249 0 (98) 2,150Provision for possible loan losses 691 – (51) 639Changes in tangible and intangible fixed assets
–
–
3,489
Thousands of U.S. dollars 2014
Other material items:
Total reportable segments Other Reconciliation Consolidated
Depreciation and amortization $ 22,927 $ 4 $ – $ 22,931Interest income 360,726 0 (950) 359,776Interest expenses 19,354 0 (1,022) 18,332Provision for possible loan losses 752 – (752) –Changes in tangible and intangible fixed assets
34,825
12
–
34,837

55
(e) Related information for enterprise-wide disclosure
(1) Information by service
Millions of yen Service
Loans Security
investments Leasing Other Total Ordinary income from
external customers:
For the year ended March 31, 2014 ¥ 28,167 ¥ 10,363 ¥ 12,331 ¥ 11,208 ¥ 62,071
For the year ended March 31, 2013 30,170
8,652
13,114
10,716 62,654
Thousands of U.S. dollars
Ordinary income from external customers:
For the year ended March 31, 2014 $ 273,685 $ 100,699 $ 119,820 $ 108,902 $ 603,106
(2) Information by geographical area for the years ended March 31, 2014 and 2013 was omitted since
income accounted for in Japan was more than 90% of total consolidated income, and tangible fixed assets in Japan was more than 90% of tangible fixed assets on the consolidated balance sheets.
(3) Information by major customer for the years ended March 31, 2014 and 2013 was omitted since there was no single external customer accounting for 10% or more of consolidated income.
(f) Information about impairment loss on fixed assets by reportable segment
Millions of yen Reportable segment
Banking LeasingCredit Card Total Other Total
Impairment loss on fixed assets: For the year ended
March 31, 2014 ¥ 330 ¥ – ¥ – ¥ 330 ¥ – ¥ 330For the year ended March 31, 2013 256 – – 256 – 256
Thousands of U.S. dollars Impairment loss on fixed assets:
For the year ended March 31, 2014 $ 3,209 $ – $ – $ 3,209 $ – $ 3,209
(g) Information with regard to goodwill by reportable segment: None.