the booz allen ‘earned schedule’ experience pe e ce allen earned... · the booz allen ‘earned...
TRANSCRIPT

The Booz Allen ‘Earned Schedule’ ExperienceHow we’ve applied it; what we’ve learned
pe e ce
Lisa D Wolf, EVP, PMP
Michelle Jones, EVP, PMP
Booz | Allen |Hamilton
Discussion PointsIntroduction – How Booz Allen Was Introduced to Earned ScheduleB i f O i f Wh E d S h d l IBrief Over view of What Earned Schedule IsInitial Case Studies (Previously Presented)N d C S di NRONamed Case Studies: NROSamples of How to Report the DataI l t ti TiImplementation Tips
2

E d S h d l I d iEarned Schedule Introduction
December, 2007 – PMI SeminarsWorld, San DiegoCourse regarding IT EVM included an introduction to Earned Sched leEarned Schedule
February, 2009 – Brought Mr. Kym Henderson to Booz Allen corporate headquarters to introduceBooz Allen corporate headquarters to introduce Earned Schedule to client-based staffMarch, 2009 – Booz Allen began introducing ES to g gits major government clients
3
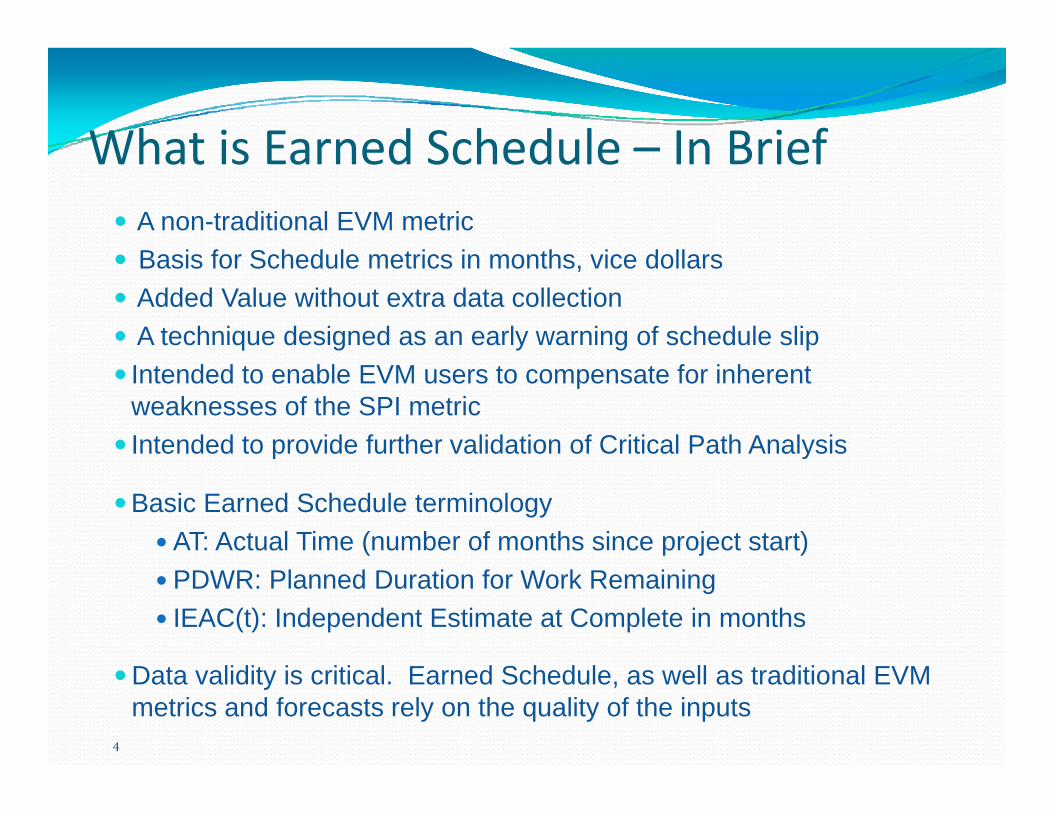
What is Earned Schedule – In BriefWhat is Earned Schedule – In BriefA non-traditional EVM metricB i f S h d l t i i th i d llBasis for Schedule metrics in months, vice dollarsAdded Value without extra data collectionA technique designed as an early warning of schedule slipIntended to enable EVM users to compensate for inherent weaknesses of the SPI metricIntended to provide further validation of Critical Path Analysisp y
Basic Earned Schedule terminologyAT: Actual Time (number of months since project start)PDWR: Planned Duration for Work RemainingIEAC(t): Independent Estimate at Complete in months
4
Data validity is critical. Earned Schedule, as well as traditional EVMmetrics and forecasts rely on the quality of the inputs
Earned Schedule Model OutputsEarned Schedule Model Outputs
Baseline Schedule Duration v.
245.6
169.4
IEAC2(t)
IEAC3(t)
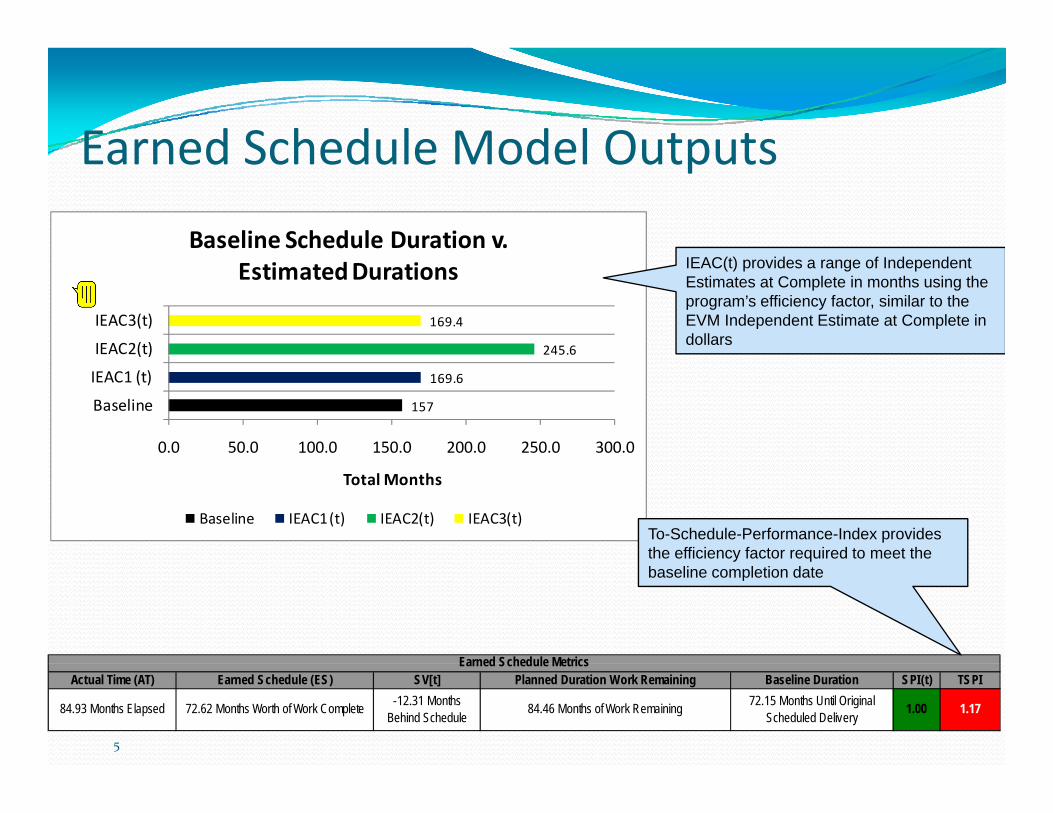
Estimated Durations IEAC(t) provides a range of Independent Estimates at Complete in months using the program’s efficiency factor, similar to the EVM Independent Estimate at Complete in dollars
157
169.6
0.0 50.0 100.0 150.0 200.0 250.0 300.0
Baseline
IEAC1 (t)
( )
Total Months
Baseline IEAC1 (t) IEAC2(t) IEAC3(t)To-Schedule-Performance-Index provides the efficiency factor required to meet the y qbaseline completion date
Earned Schedule Metrics
5
Actual Time (AT) Earned Schedule (ES) SV[t] Planned Duration Work Remaining Baseline Duration SPI(t) TSPI
84.93 Months Elapsed 72.62 Months Worth of Work Complete -12.31 Months Behind Schedule 84.46 Months of Work Remaining 72.15 Months Until Original
Scheduled Delivery 1.00 1.17
Earned Schedule Metrics
Earned Schedule Basic Concept
$ Time Now
Earned Schedule Basic Concept
The idea is to determine the
A SVc
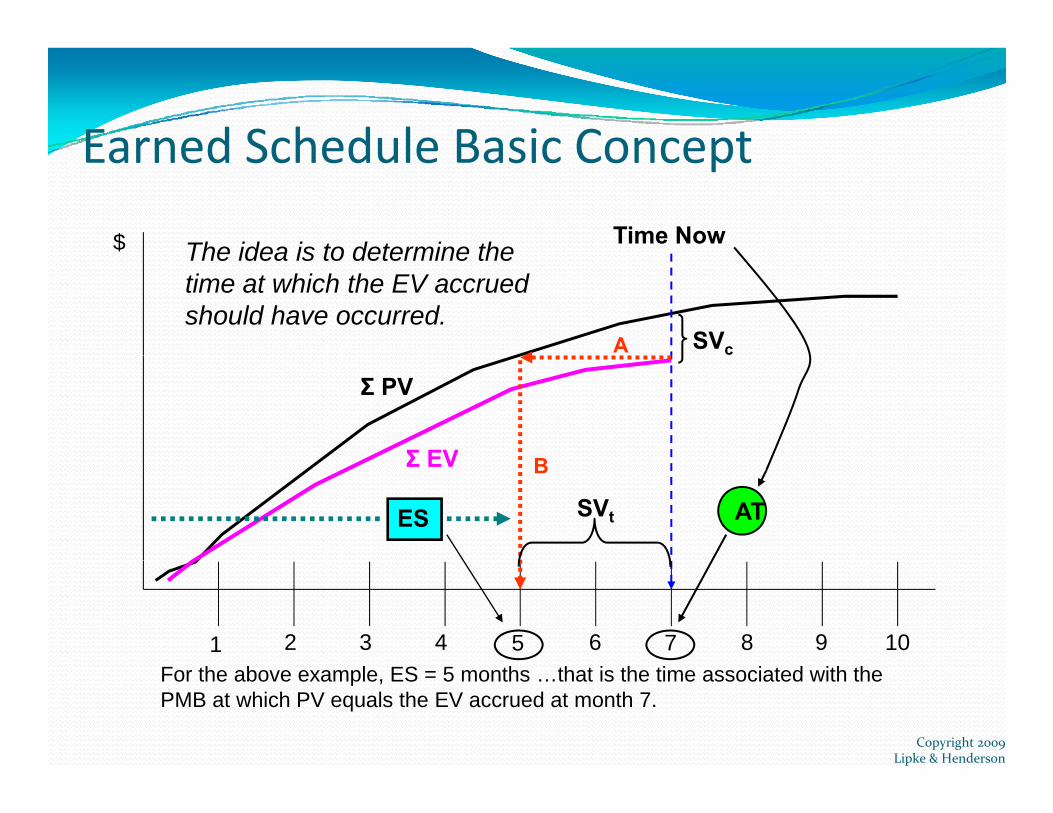
The idea is to determine the time at which the EV accrued should have occurred.
Σ PV
Σ EV BΣ EV B
SVtES AT
5 71 2 3 4 6 8 9 10For the above example, ES = 5 months …that is the time associated with thePMB at which PV equals the EV accrued at month 7.
Copyright 2009 Lipke & Henderson
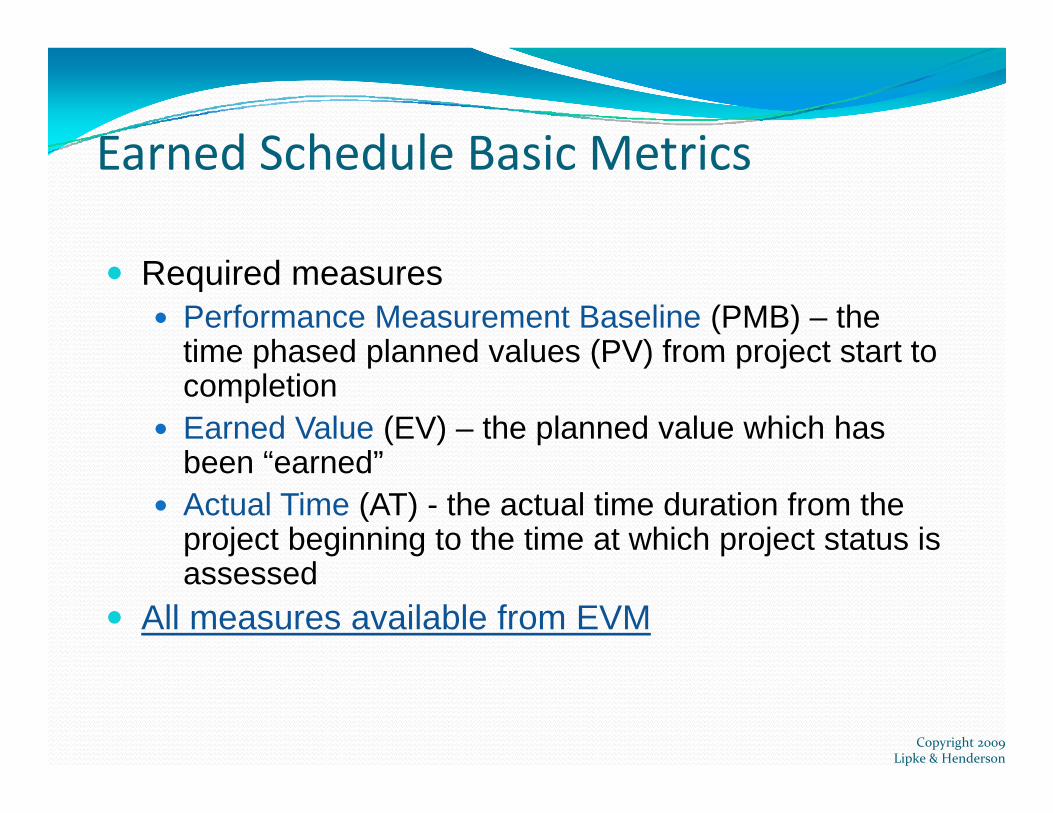
Earned Schedule Basic MetricsEarned Schedule Basic Metrics
Required measuresPerformance Measurement Baseline (PMB) – the time phased planned values (PV) from project start totime phased planned values (PV) from project start to completionEarned Value (EV) – the planned value which has been “earned”been earned Actual Time (AT) - the actual time duration from the project beginning to the time at which project status is assessed
All measures available from EVM
Copyright 2009 Lipke & Henderson
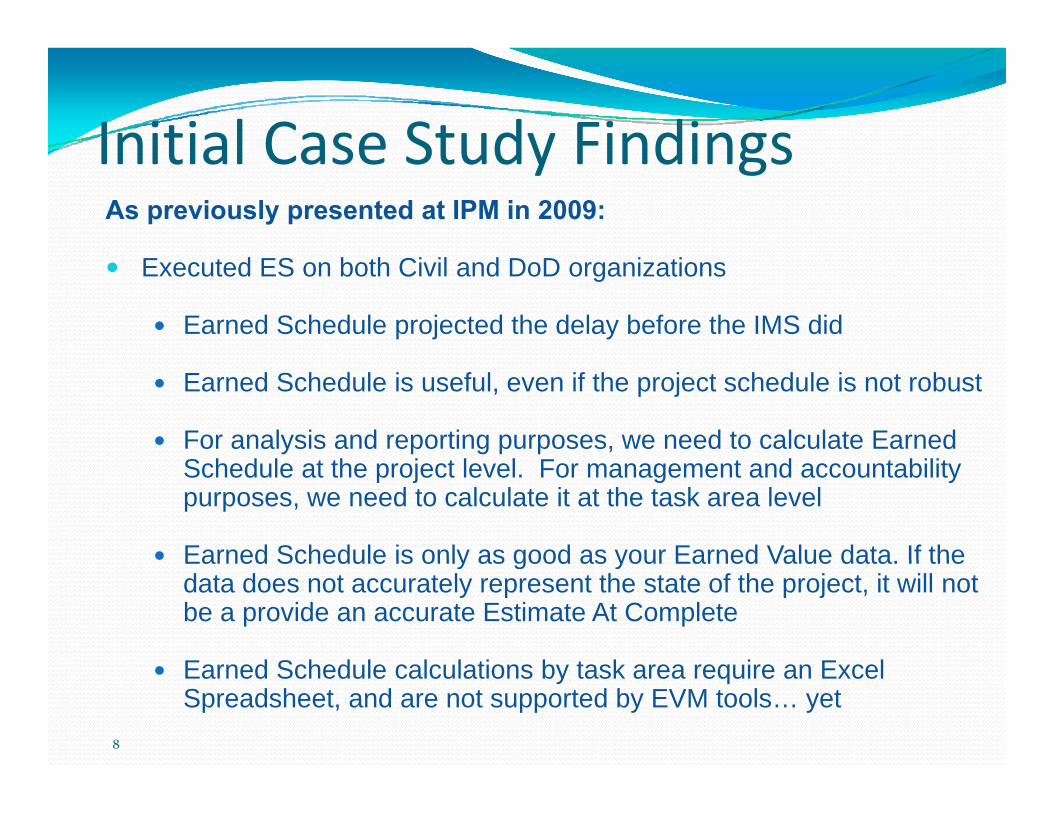
Initial Case Study FindingsInitial Case Study FindingsAs previously presented at IPM in 2009:
Executed ES on both Civil and DoD organizations
Earned Schedule projected the delay before the IMS did
Earned Schedule is useful, even if the project schedule is not robust
For analysis and reporting purposes, we need to calculate Earned Schedule at the project level. For management and accountability purposes, we need to calculate it at the task area level
Earned Schedule is only as good as your Earned Value data If theEarned Schedule is only as good as your Earned Value data. If the data does not accurately represent the state of the project, it will not be a provide an accurate Estimate At Complete
E d S h d l l l ti b t k i E l
8
Earned Schedule calculations by task area require an Excel Spreadsheet, and are not supported by EVM tools… yet

Earned ScheduleCase StudyCase Study
This research was jointly sponsored by Booz Allen and the National Reconnaissance Office Cost Analysis Improvement Group (NRO CAIG) However the views expressed in this article are those of Analysis Improvement Group (NRO CAIG). However, the views expressed in this article are those of the authors and do not necessarily reflect the official policy or position of the NRO CAIG or any other organization of the U.S. government.
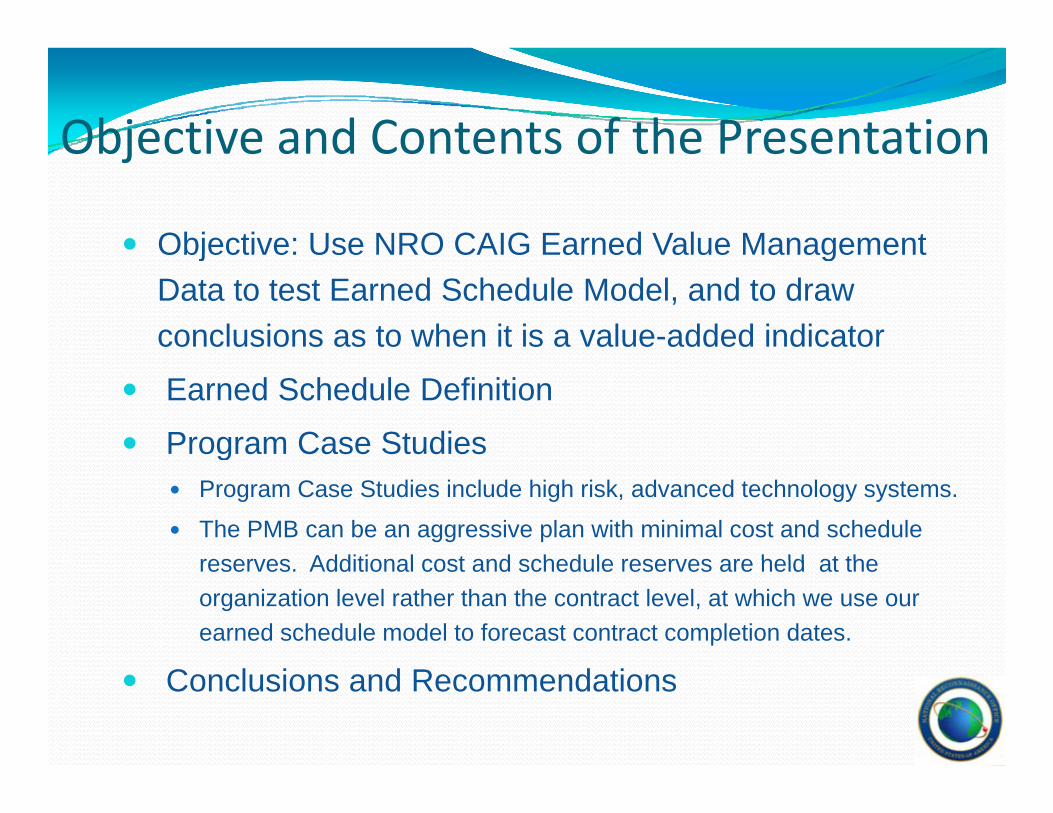
Objective and Contents of the PresentationObjective and Contents of the Presentation
Objective: Use NRO CAIG Earned Value ManagementObjective: Use NRO CAIG Earned Value Management Data to test Earned Schedule Model, and to draw conclusions as to when it is a value-added indicator
Earned Schedule Definition
Program Case StudiesgProgram Case Studies include high risk, advanced technology systems.
The PMB can be an aggressive plan with minimal cost and schedule reserves Additional cost and schedule reserves are held at thereserves. Additional cost and schedule reserves are held at the organization level rather than the contract level, at which we use our earned schedule model to forecast contract completion dates.
Conclusions and Recommendations
Summary of Program Case StudiesSummary of Program Case Studies
P C St di Insig
htfu
lCo
nsist
ent
Misl
eadi
ng
Program Case Studies In Co M
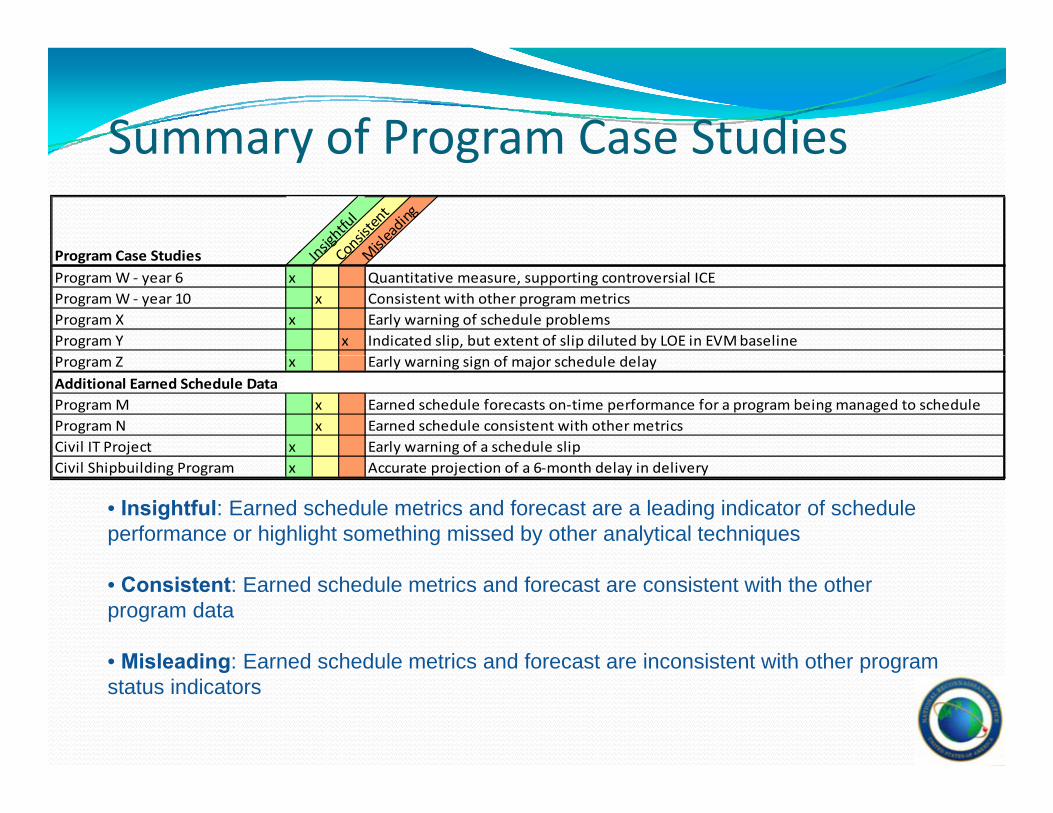
Program W ‐ year 6 x Quantitative measure, supporting controversial ICE Program W ‐ year 10 x Consistent with other program metricsProgram X x Early warning of schedule problemsProgram Y x Indicated slip, but extent of slip diluted by LOE in EVM baselineProgram Z x Early warning sign of major schedule delayAdditional Earned Schedule DataProgram M x Earned schedule forecasts on‐time performance for a program being managed to scheduleProgram N x Earned schedule consistent with other metricsCivil IT Project x Early warning of a schedule slipCivil Shipbuilding Program x Accurate projection of a 6‐month delay in delivery
• Insightful: Earned schedule metrics and forecast are a leading indicator of schedule performance or highlight something missed by other analytical techniques
• Consistent: Earned schedule metrics and forecast are consistent with the other program data
• Misleading: Earned schedule metrics and forecast are inconsistent with other program• Misleading: Earned schedule metrics and forecast are inconsistent with other program status indicators
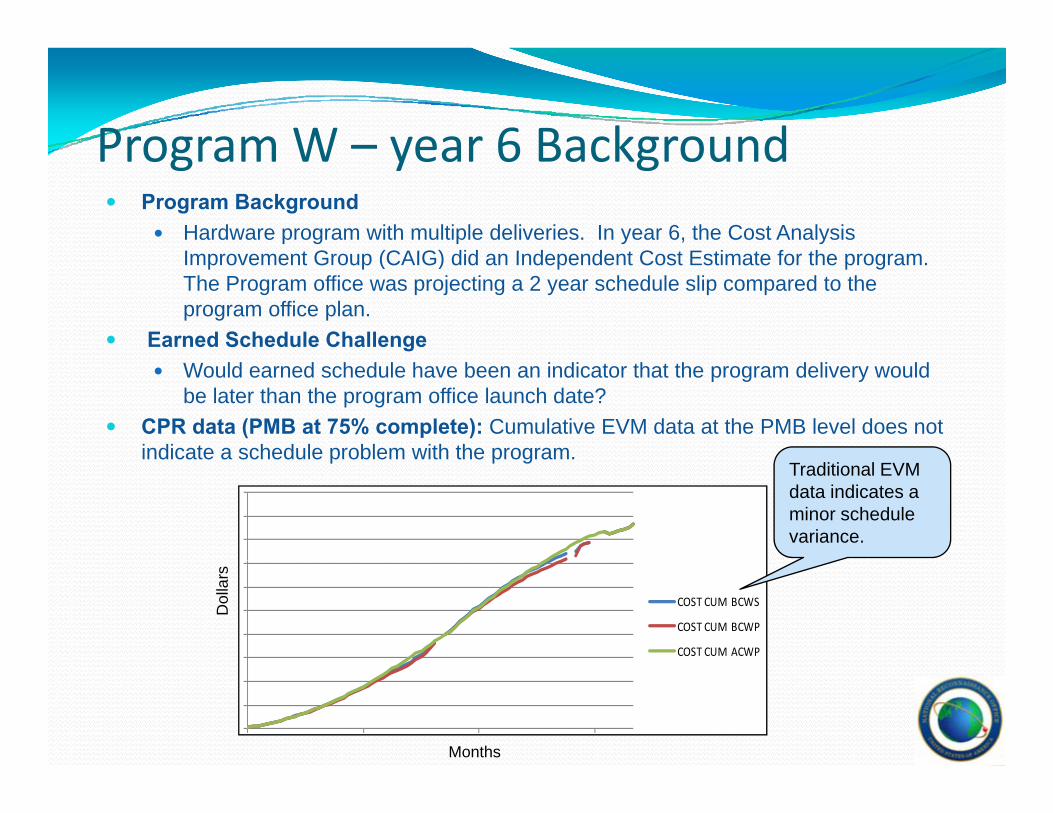
ProgramW – year 6 BackgroundProgram W year 6 BackgroundProgram Background
Hardware program with multiple deliveries. In year 6, the Cost Analysis I t G (CAIG) did I d d t C t E ti t f thImprovement Group (CAIG) did an Independent Cost Estimate for the program. The Program office was projecting a 2 year schedule slip compared to the program office plan.
Earned Schedule ChallengeWould earned schedule have been an indicator that the program delivery would be later than the program office launch date?
CPR data (PMB at 75% complete): Cumulative EVM data at the PMB level does not indicate a schedule problem with the program.indicate a schedule problem with the program.
Traditional EVMdata indicates a minor schedule variance.
COST CUM BCWS
COST CUM BCWP
COST CUM ACWP
Dol
lars
Months
Program W – year 6 Earned Schedule
0.95
1.00
1.05
Cumulative SPI(t) vs. SPI($)
169.4IEAC3(t)
Baseline Schedule Duration v.Estimated Durations
0.70
0.75
0.80
0.85
0.90
SPI(t)
SPI($)
Target SPI
157
169.6
245.6
0.0 50.0 100.0 150.0 200.0 250.0 300.0
Baseline
IEAC1 (t)
IEAC2(t)
T t l M th
0.60
0.65
Total Months
Baseline IEAC1 (t) IEAC2(t) IEAC3(t)
Months
A t l Ti (AT) E d S h d l (ES) SV[t] Pl d D ti W k R i i B li D ti SPI(t) TSPIEarned Schedule Metrics
• SPI(t) has a downward trend that was not apparent in SPI($) Earned schedule forecasts
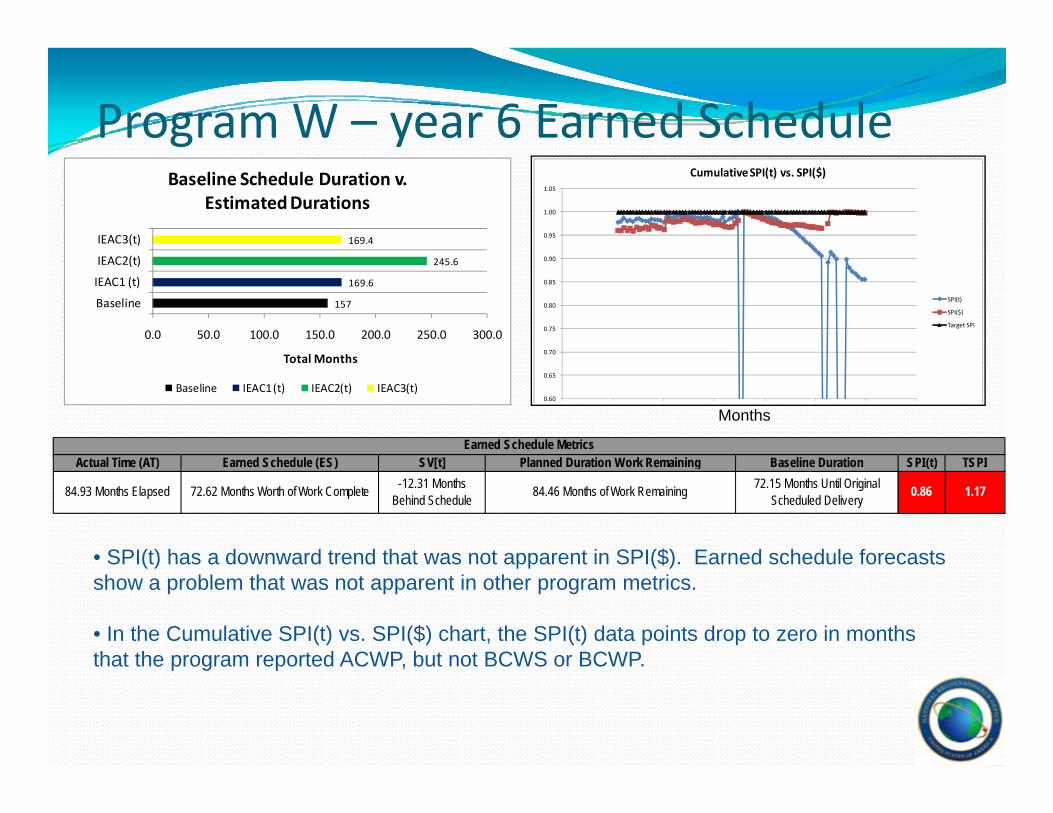
Actual Time (AT) Earned Schedule (ES) SV[t] Planned Duration Work Remaining Baseline Duration SPI(t) TSPI
84.93 Months Elapsed 72.62 Months Worth of Work Complete -12.31 Months Behind Schedule 84.46 Months of Work Remaining 72.15 Months Until Original
Scheduled Delivery 0.86 1.17
SPI(t) has a downward trend that was not apparent in SPI($). Earned schedule forecasts show a problem that was not apparent in other program metrics.
• In the Cumulative SPI(t) vs. SPI($) chart, the SPI(t) data points drop to zero in months that the program reported ACWP but not BCWS or BCWPthat the program reported ACWP, but not BCWS or BCWP.
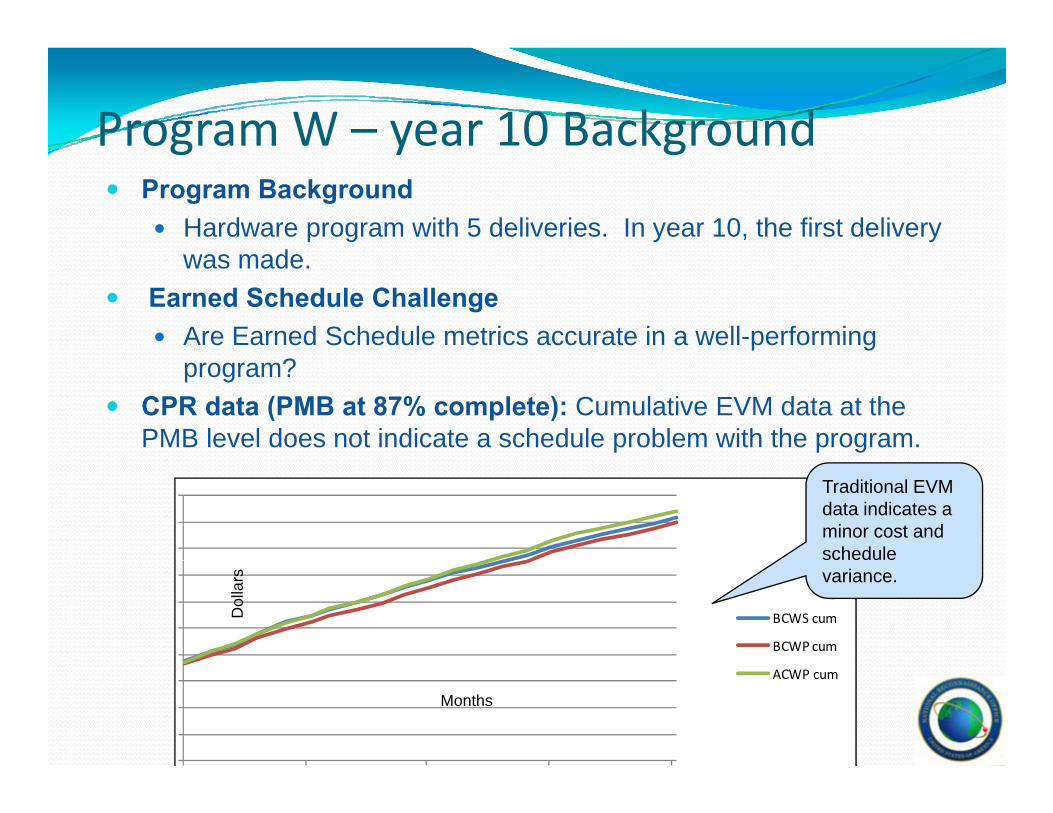
Program W – year 10 Backgroundg y gProgram Background
Hardware program with 5 deliveries. In year 10, the first delivery dwas made.
Earned Schedule ChallengeAre Earned Schedule metrics accurate in a well-performing program?
CPR data (PMB at 87% complete): Cumulative EVM data at the PMB level does not indicate a schedule problem with the program.
Traditional EVMdata indicates a minor cost and schedule
BCWS cum
BCWP cum
variance.
Dol
lars
ACWP cum
Months
Program W – year 10 Earned Scheduleg y
1 00
1.05
Cumulative SPI(t) vs. SPI($)Baseline Schedule Duration v.Estimated Durations
0 75
0.80
0.85
0.90
0.95
1.00
SPI(t)
SPI($)
78
79.8
79.0
78.9
77 0 77 5 78 0 78 5 79 0 79 5 80 0
Baseline
IEAC1 (t)
IEAC2(t)
IEAC3(t)
0.60
0.65
0.70
0.75 SPI($)
Target SPI
Earned Schedule Metrics
77.0 77.5 78.0 78.5 79.0 79.5 80.0
Total Months
Baseline IEAC1 (t) IEAC2(t) IEAC3(t) Months
• The program is on target according to both traditional EVM and Earned
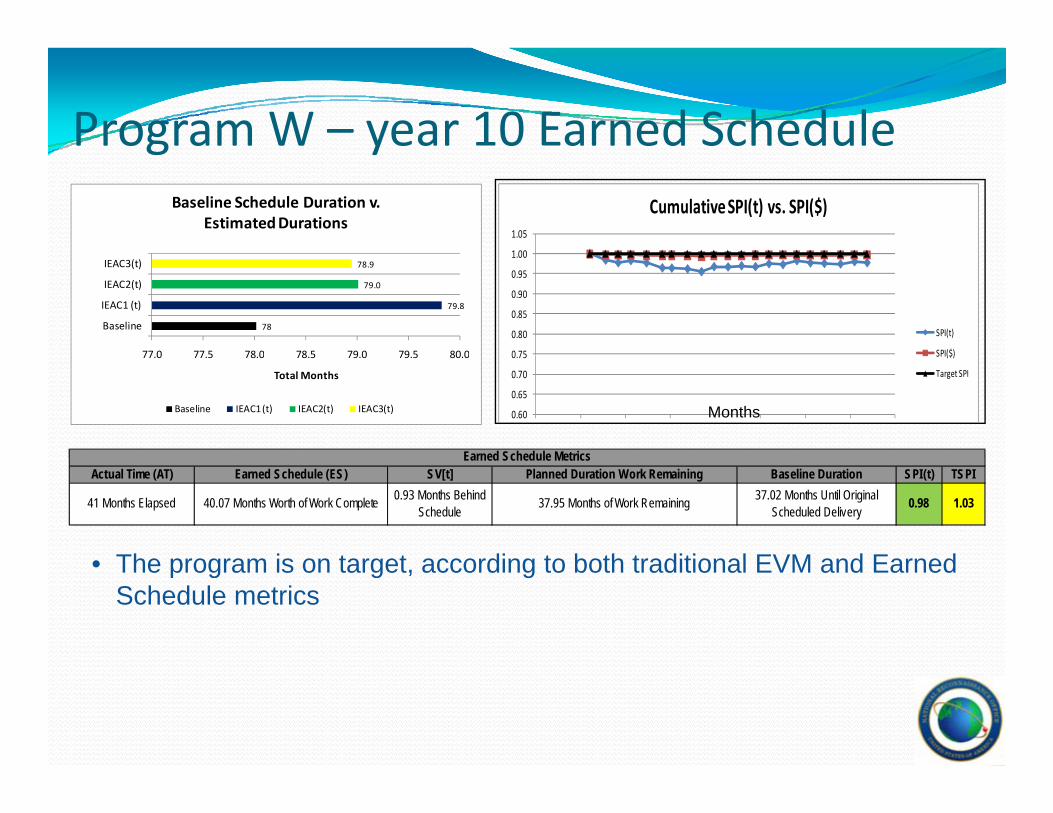
Actual Time (AT) Earned Schedule (ES) SV[t] Planned Duration Work Remaining Baseline Duration SPI(t) TSPI
41 Months Elapsed 40.07 Months Worth of Work Complete 0.93 Months Behind Schedule 37.95 Months of Work Remaining 37.02 Months Until Original
Scheduled Delivery 0.98 1.03
Earned Schedule Metrics
• The program is on target, according to both traditional EVM and Earned Schedule metrics
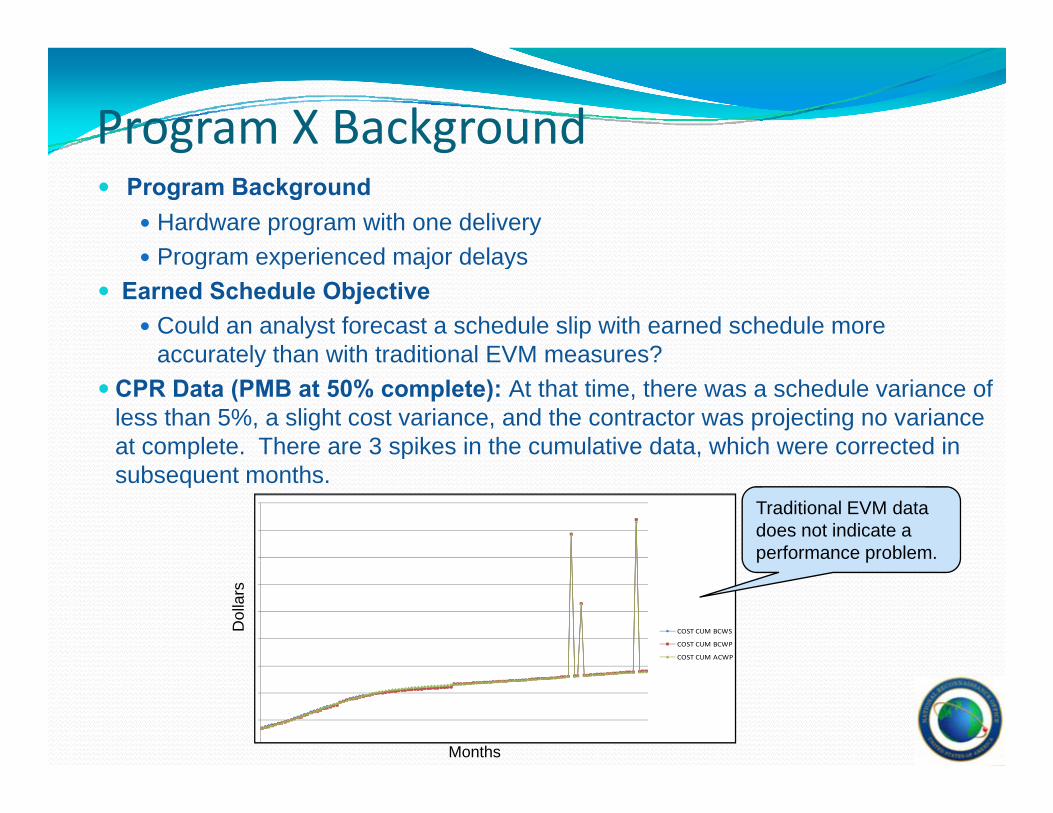
Program X Backgroundg gProgram Background
Hardware program with one deliveryProgram experienced major delaysProgram experienced major delays
Earned Schedule ObjectiveCould an analyst forecast a schedule slip with earned schedule more accurately than with traditional EVM measures?accurately than with traditional EVM measures?
CPR Data (PMB at 50% complete): At that time, there was a schedule variance of less than 5%, a slight cost variance, and the contractor was projecting no variance at complete. There are 3 spikes in the cumulative data, which were corrected in p psubsequent months.
Traditional EVM data does not indicate a performance problem.
COST CUM BCWS
COST CUM BCWP
COST CUM ACWP
p p
Dol
lars
Months
Program X Earned Schedule
0 90
0.95
1.00
1.05
Cumulative SPI(t) vs. SPI($)
IEAC2(t)
IEAC3(t)
Baseline Schedule Duration v.Estimated Durations
0 60
0.65
0.70
0.75
0.80
0.85
0.90
SPI(t)
SPI($)
Target SPI
0 20 40 60 80 100
Baseline
IEAC1 (t)
Total Months
Baseline IEAC1 (t) IEAC2(t) IEAC3(t)
Th i d j d l C l ti 4 l t th th b li
0.60
Earned Schedule MetricsActual Time (AT) Earned Schedule (ES) SV[t] Planned Duration Work Remaining Baseline Duration SPI(t) TSPI
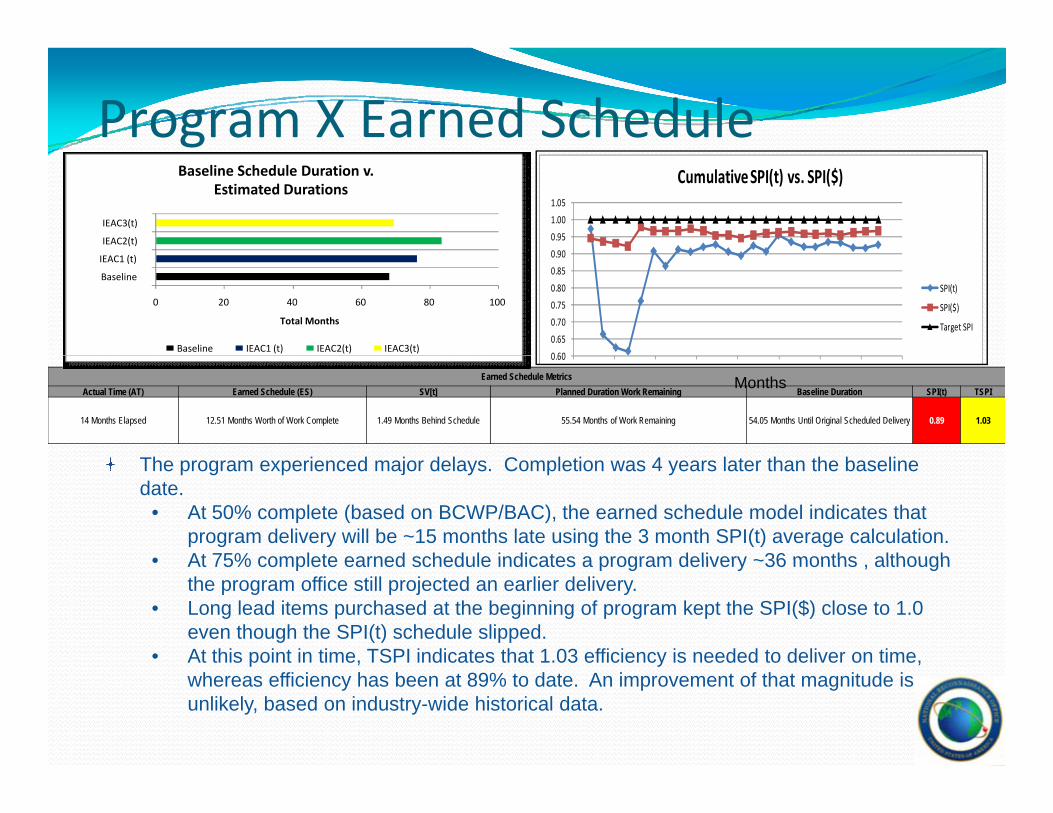
14 Months Elapsed 12.51 Months Worth of Work Complete 1.49 Months Behind Schedule 55.54 Months of Work Remaining 54.05 Months Until Original Scheduled Delivery 0.89 1.03
Months
The program experienced major delays. Completion was 4 years later than the baseline date.
• At 50% complete (based on BCWP/BAC), the earned schedule model indicates that program delivery will be ~15 months late using the 3 month SPI(t) average calculation.
• At 75% complete earned schedule indicates a program delivery ~36 months although• At 75% complete earned schedule indicates a program delivery ~36 months , although the program office still projected an earlier delivery.
• Long lead items purchased at the beginning of program kept the SPI($) close to 1.0 even though the SPI(t) schedule slipped.
• At this point in time, TSPI indicates that 1.03 efficiency is needed to deliver on time, p , y ,whereas efficiency has been at 89% to date. An improvement of that magnitude is unlikely, based on industry-wide historical data.
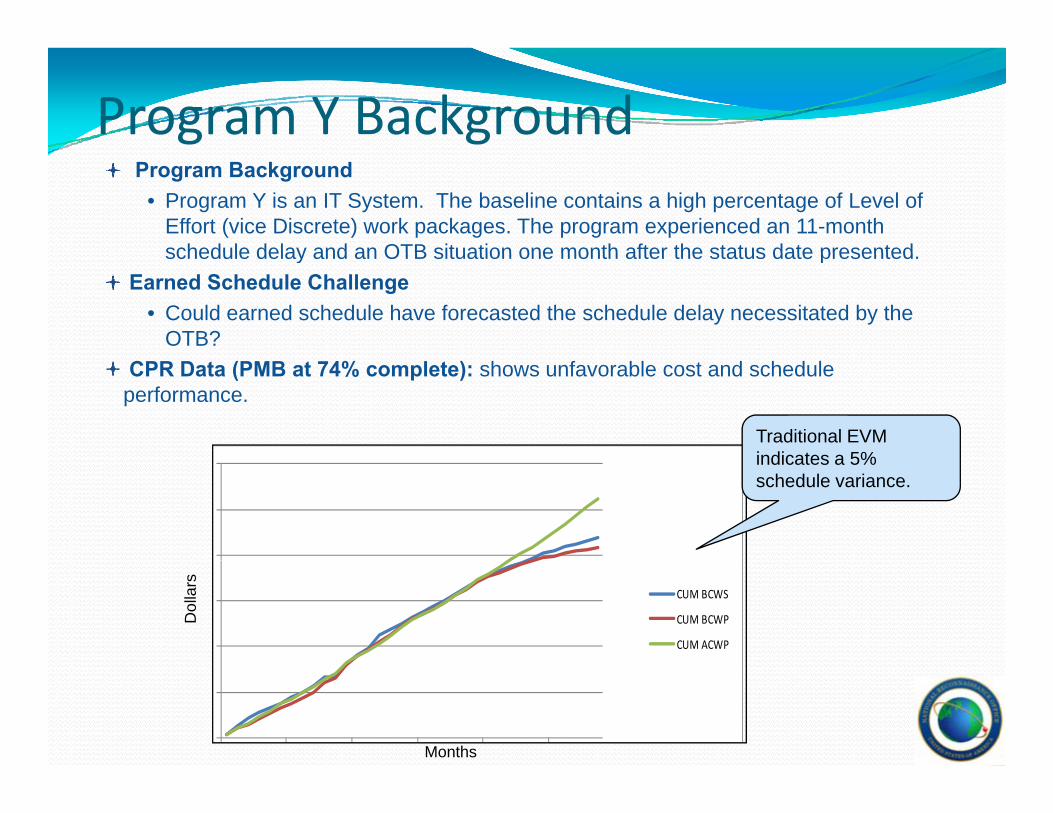
Program Y BackgroundProgram Background
• Program Y is an IT System. The baseline contains a high percentage of Level of Effort (vice Discrete) work packages. The program experienced an 11-month schedule delay and an OTB situation one month after the status date presentedschedule delay and an OTB situation one month after the status date presented.
Earned Schedule Challenge• Could earned schedule have forecasted the schedule delay necessitated by the
OTB? CPR Data (PMB at 74% complete): shows unfavorable cost and schedule performance.
Traditional EVMindicates a 5%indicates a 5% schedule variance.
CUM BCWS
CUM BCWP
CUM ACWP
Dol
lars
Months
Program Y Earned Schedule
0 95
1.00
1.05
Cumulative SPI(t) vs. SPI($)
IEAC3(t)
Baseline Schedule Duration v.Estimated Durations
0 70
0.75
0.80
0.85
0.90
0.95
SPI(t)
SPI($)
Target SPI
31 32 33 34 35 36 37
Contractor
IEAC1 (t)
IEAC2(t)
T t l M th
0.60
0.65
0.70 Target SPITotal Months
Contractor IEAC1 (t) IEAC2(t) IEAC3(t)
Actual Time (AT) Earned Schedule (ES) SV[t] Planned Duration Work Remaining Baseline Duration SPI(t) TSPI3 26 Months Behind -1 82 Months Until Original
Earned Schedule Metrics Months
SPI(t) was less favorable than SPI($) and the schedule forecast is 3 months
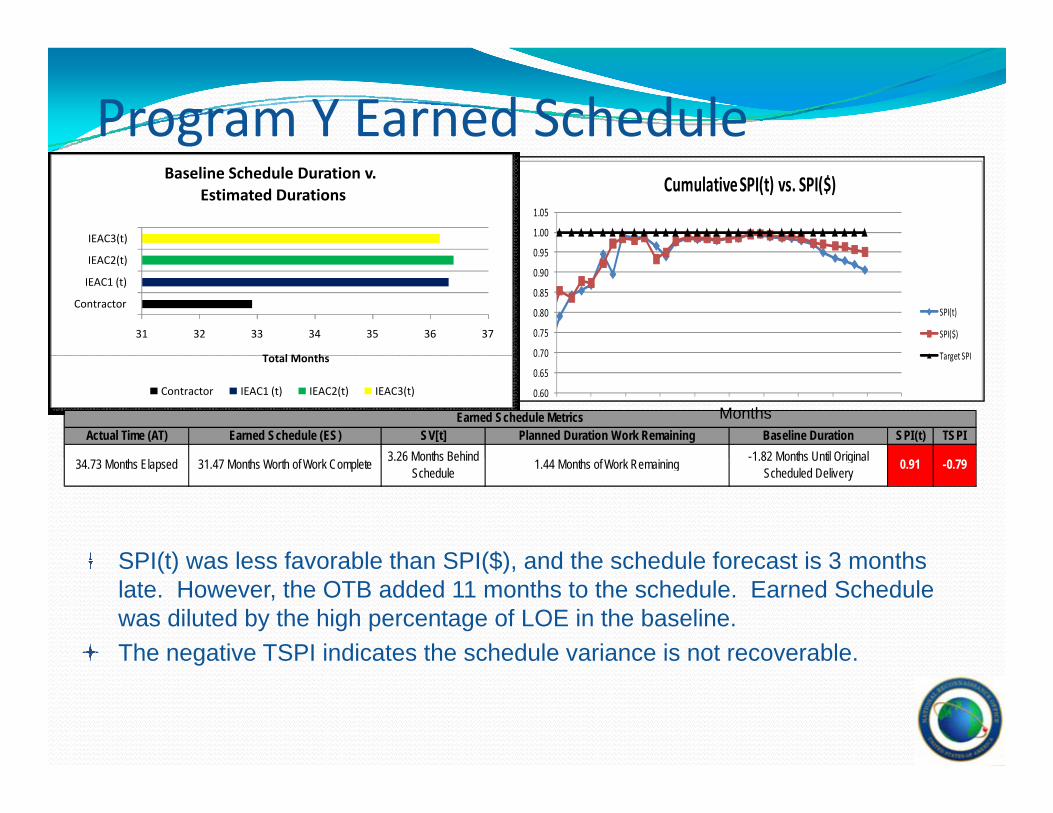
34.73 Months Elapsed 31.47 Months Worth of Work Complete 3.26 Months Behind Schedule 1.44 Months of Work Remaining 1.82 Months Until Original
Scheduled Delivery 0.91 -0.79
SPI(t) was less favorable than SPI($), and the schedule forecast is 3 months late. However, the OTB added 11 months to the schedule. Earned Schedule was diluted by the high percentage of LOE in the baseline.The negative TSPI indicates the schedule variance is not recoverable.g
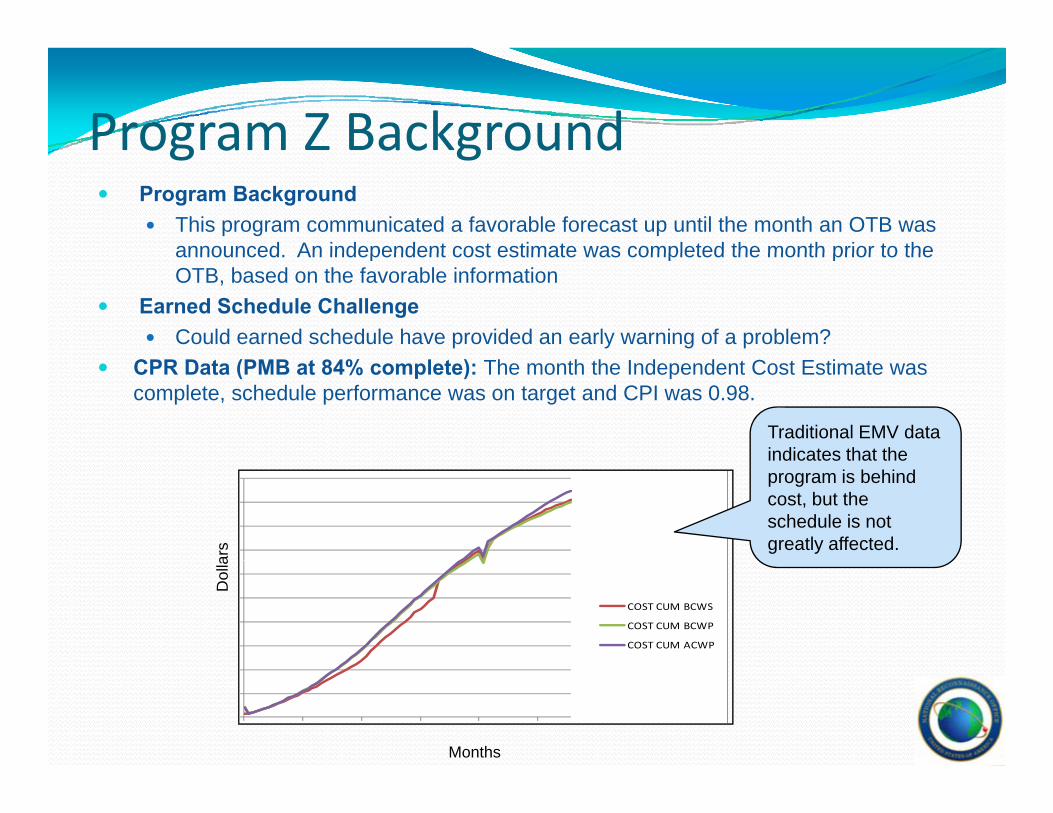
Program Z Backgroundog a ac g ou dProgram Background
This program communicated a favorable forecast up until the month an OTB was announced An independent cost estimate was completed the month prior to theannounced. An independent cost estimate was completed the month prior to the OTB, based on the favorable information
Earned Schedule ChallengeCould earned schedule have provided an early warning of a problem?
CPR Data (PMB at 84% complete): The month the Independent Cost Estimate was complete, schedule performance was on target and CPI was 0.98.
Traditional EMV data indicates that theindicates that the program is behind cost, but the schedule is not greatly affected.
ars
COST CUM BCWS
COST CUM BCWP
COST CUM ACWP
Dol
la
Months
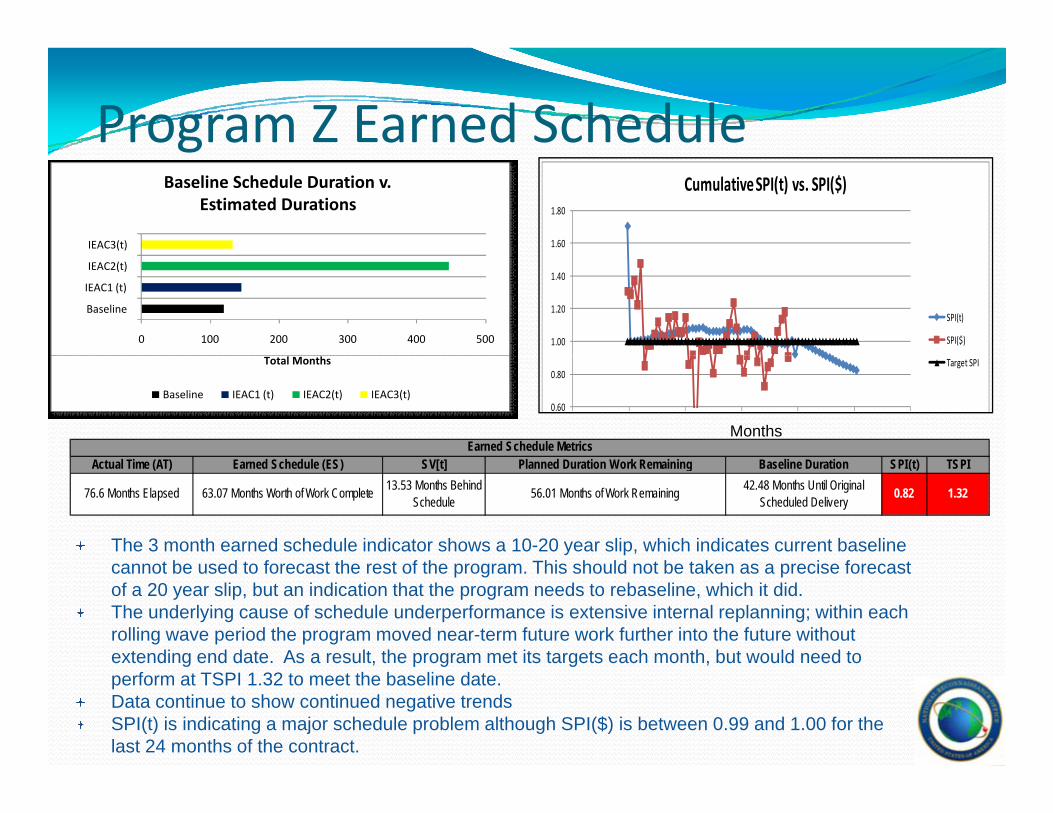
Program Z Earned Scheduleg
1.60
1.80
Cumulative SPI(t) vs. SPI($)
IEAC3(t)
Baseline Schedule Duration v.Estimated Durations
1.00
1.20
1.40
SPI(t)
SPI($)0 100 200 300 400 500
Baseline
IEAC1 (t)
IEAC2(t)
0.60
0.80Target SPI
Earned Schedule Metrics
Total Months
Baseline IEAC1 (t) IEAC2(t) IEAC3(t)
Months
The 3 month earned schedule indicator shows a 10-20 year slip, which indicates current baseline b d f h f h Thi h ld b k i f
Actual Time (AT) Earned Schedule (ES) SV[t] Planned Duration Work Remaining Baseline Duration SPI(t) TSPI
76.6 Months Elapsed 63.07 Months Worth of Work Complete 13.53 Months Behind Schedule 56.01 Months of Work Remaining 42.48 Months Until Original
Scheduled Delivery 0.82 1.32
cannot be used to forecast the rest of the program. This should not be taken as a precise forecast of a 20 year slip, but an indication that the program needs to rebaseline, which it did.The underlying cause of schedule underperformance is extensive internal replanning; within each rolling wave period the program moved near-term future work further into the future without extending end date. As a result, the program met its targets each month, but would need to e te d g e d date s a esu t, t e p og a et ts ta gets eac o t , but ou d eed toperform at TSPI 1.32 to meet the baseline date.Data continue to show continued negative trendsSPI(t) is indicating a major schedule problem although SPI($) is between 0.99 and 1.00 for the last 24 months of the contract.
NRO Case Study ConclusionsNRO Case Study Conclusions
For programs with major schedule delays, earned schedule can highlight p g j y , g gschedule problems using EVM data, to a greater extent than traditional EVMmetrics. SPI(t) has been shown to exceed reporting thresholds before SPI($), providing earlier indication of schedule problems.
For programs without major schedule variance, earned schedule metrics were consistent with other program metrics.
If a program contains a significant amount of LOE, Earned Schedule analysis should be performed at a lower level of the WBS, or the forecast will be diluted.will be diluted.

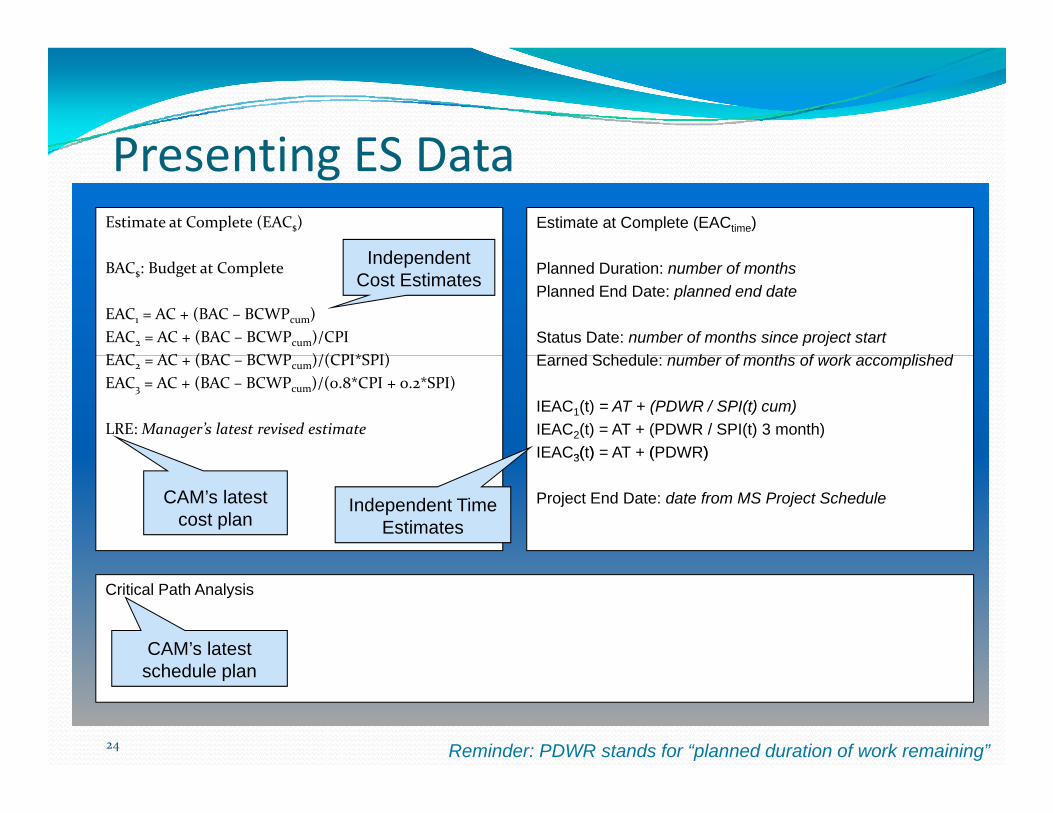
Presenting ES DataPresenting ES DataEstimate at Complete (EAC$) Estimate at Complete (EACtime)
I d d tBAC$: Budget at Complete
EAC1 = AC + (BAC – BCWPcum)EAC2 = AC + (BAC – BCWPcum)/CPIEAC AC (BAC BCWP )/(CPI*SPI)
Planned Duration: number of monthsPlanned End Date: planned end date
Status Date: number of months since project startE d S h d l b f th f k li h d
Independent Cost Estimates
EAC2 = AC + (BAC – BCWPcum)/(CPI*SPI)EAC3 = AC + (BAC – BCWPcum)/(0.8*CPI + 0.2*SPI)
LRE: Manager’s latest revised estimate
Earned Schedule: number of months of work accomplished
IEAC1(t) = AT + (PDWR / SPI(t) cum)IEAC2(t) = AT + (PDWR / SPI(t) 3 month)IEAC3(t) = AT + (PDWR)3( ) ( )
Project End Date: date from MS Project ScheduleCAM’s latest cost plan
Independent Time Estimates
Critical Path Analysis
CAM’s latest
24
schedule plan
Reminder: PDWR stands for “planned duration of work remaining”
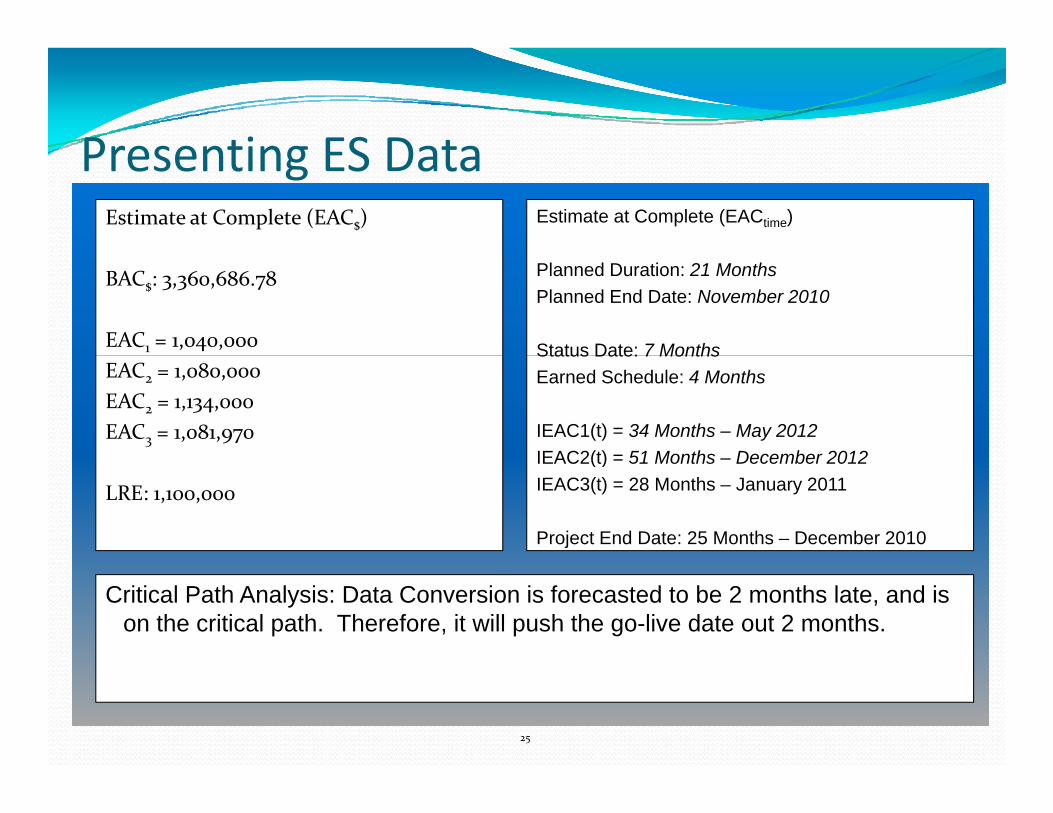
Presenting ES DataPresenting ES DataEstimate at Complete (EAC$) Estimate at Complete (EACtime)
BAC$: 3,360,686.78
EAC1 = 1,040,000
Planned Duration: 21 MonthsPlanned End Date: November 2010
Status Date: 7 MonthsEAC2 = 1,080,000EAC2 = 1,134,000EAC3 = 1,081,970
Status Date: 7 MonthsEarned Schedule: 4 Months
IEAC1(t) = 34 Months – May 2012IEAC2(t) = 51 Months December 2012
LRE: 1,100,000
IEAC2(t) = 51 Months – December 2012IEAC3(t) = 28 Months – January 2011
Project End Date: 25 Months – December 2010
Critical Path Analysis: Data Conversion is forecasted to be 2 months late, and is on the critical path. Therefore, it will push the go-live date out 2 months.
25

Resources for Adopting Earned ScheduleResources for Adopting Earned Schedule
Earned Schedule Website, including papers and training resources
http://www.earnedschedule.com/Home.shtml
Wiki di SitWikipedia Sitehttp://en.wikipedia.org/wiki/Earned_ScheduleThird tier bullets
26
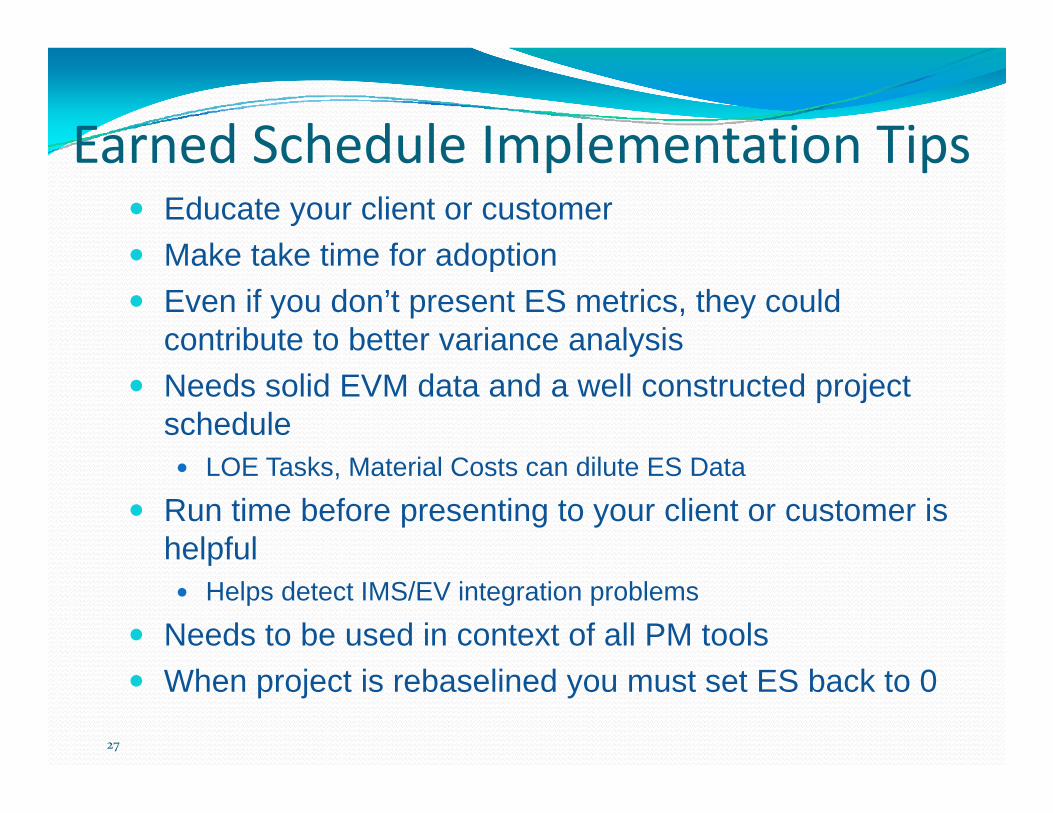
Earned Schedule Implementation TipsEarned Schedule Implementation TipsEducate your client or customerMake take time for adoptionMake take time for adoptionEven if you don’t present ES metrics, they could contribute to better variance analysisyNeeds solid EVM data and a well constructed project schedule
LOE T k M t i l C t dil t ES D tLOE Tasks, Material Costs can dilute ES Data
Run time before presenting to your client or customer is helpfulp
Helps detect IMS/EV integration problems
Needs to be used in context of all PM tools
27
When project is rebaselined you must set ES back to 0
What We DiscussedWhat We Discussed
How Booz Allen Was Introduced to Earned Schedule
Brief Over view of What Earned Schedule Is
Case StudiesCase Studies
Data Reporting
Implementation TipsImplementation Tips
28

Michelle Jones, EVP, PMPLead Associate,
Lisa D Wolf, EVP, PMPEVM Focal Point,
Booz Allen Hamilton703‐633‐2130
Booz Allen Hamilton301‐825‐7478
29