the development of education in malawi … development of education in malawi 2004 report prepared...
TRANSCRIPT
THE DEVELOPMENT OF EDUCATION IN MALAWI
2004 Report
Prepared For The 47th Session Of The International Conference On Education
07TH – 11TH SEPTEMBER, 2004
COMPILED BY:
THE MINISTRY OF EDUCATION AND THE MALAWI NATIONAL
COMMISSION FOR UNESCO
TABLE OF CONTENTS
Page
List of Tables and Figures ………………………………………………………………… 4 Foreword ……………………………………………………………………………………….. 5 Basic Data …………………………………………………………………………….…………. 6 Abbreviations …………………………………………………………………………….…..… 7 1.0 Introduction ……………………………………………………………………… .... 8 1.1 Socio-economic context ………………………………………………... 8 1.2 Political context …………………………………………………………….. 9 1.3 Gender ……………………………………………………………………….. 9 2.0 Educational Policies and Reform .…………………………………….…………10 2.1.1 Primary ……………………………………………………………………. ……12
2.1.2 Secondary ……………………………………………………………………...12 2.1.3 Non-formal Education …………………………………………………….. 13 2.1.4 Tertiary Education …………………………………………………………. 13
2.1.4.1 Teacher Training ……………………………………….…13 2.1.4.2 Technical Entrepreneurship and
Vocational Training ……………………………………. 13 2.1.4.3 University Education……………………………………..14
3.0 Structures and Organization of the education system …………………..14 4.0 Administration of the Education System ……………………………………..16 5.0 The Financing of Education ……………………………………………………… 17 6.0 The Education Process ……………………………………………………………..20
6.1 Curriculum. 6.1.1 Pre-school Education ……………………………………………. 20 6.1.2 Primary Education …………………………………………….……20 6.1.3 Secondary Education ………………………………………………20 6.1.4 Medium of Instruction ……………………………………….……20
6.2 Access …………………………………………………………………………….21 6.2.1 Primary …………………………………………………………….…..21 6.2.2 Secondary ……………………………….……………….…..……22 6.2.3 Tertiary Education……………………….……………….…….…..23
6.3 Internal Efficiency ………………..………………………………………….25 6.3.1 Primary Education…………………..………………………………26
6.4 Quality ……………………………………………………………………………28
6.4.1 Primary Education …………… …………………………… ….. 28 6.4.2 Secondary Education………………………………….……… .. 29
2
6.5 Evaluation System ……………………………………..…………..30
7.0 Special Education ……………….…………………………………………..30 8.0 Private Providers of Education ……………………………………….…32 9.0 Non-formal Education……………………………………………………… .32 10.0 Development Partners support………………………………………..….33 References …………………………………………..……………..…………………...34
3
LIST OF TABLES AND FIGURES
A. List of Tables Page Table 5.1: Government Expenditure on Education on the Revenue
Account, 1993/94 ………………………………………………………………………… 18 Table 5.2: The Education Sector Budget (1999/2000) …..……………………..……………19 Table 5.3: The Education Sector Budget (1999/2000) – Percentages …………………..20 Table 6.1: Primary School Enrolment 1991 to 2000………………………………………..…..22 Table 6.2: Secondary School Enrolment 1996 to 2000 ……………………………………… 23 Table 6.3: Enrolment on Technical and Vocational Colleges by course of
study, 1994 –1999 …………………………………………………………………………. 24 Table 6.4: Enrolment at University of Malawi Colleges 1993 to 1999 …………………. 25 Table 6.5: Total Enrolment of Student Teachers by sex and by
Course of Study …………………………………………………………………………… 26
Table 6.6: Primary School Repetition and dropout rate 1994 – 2000 ……………………. 27 Table 6.7 Repetition rates by standard by sex …………………………………………………. 27
List of Figures Fig. 1. The Structure of Malawi Education System ……………………………………………….. 16 Fig. 2. Primary School Enrolment 1991 to 1999 …………………………………………………….. 22
4
FOREWORD
This report presents an outline of educational development in Malawi. It has been prepared for the 47th Session of the International Conference on Education, Geneva, 7th to 11th September 2004. Attempts have been made to ensure that the report adheres to the outline suggested by the International Bureau of Education (IBE). Attempts have also been made to clarify important innovations and to describe changes in understandable and objective way. For this reason, emerging problems have not been avoided. A lot has taken place in education in the recent past. This is not a coincidence, but rather a result of favourable conditions brought about by the democratic environment that Malawi has been enjoying since 1994 and it is due to the support that the education sector is getting from cooperating development partners (donors), the civil society organisations and the entire Malawian community. The implementation of education programmes is facing some challenges as outlined in this report, but the challenges are not insurmountable. Government is already addressing some of them. For example, Government has developed, and in some cases is already implementing, strategies such as the HIV/AIDS education sector response strategy, the National Teacher Education and Development Strategy, the Primary Curriculum Assessment and Review, among others. Government acknowledges with appreciation the support it is getting from all development partners in the fulfillment of its commitments and in meeting its targets as stipulated in policy and strategy documents like the Policy and Investment Framework(PIF) for Education sector, the Malawi Poverty Reduction Strategy, and the (draft) Education for All action plan.
Simeon Hau, PhD Secretary for Education, Human Resources and Development
5
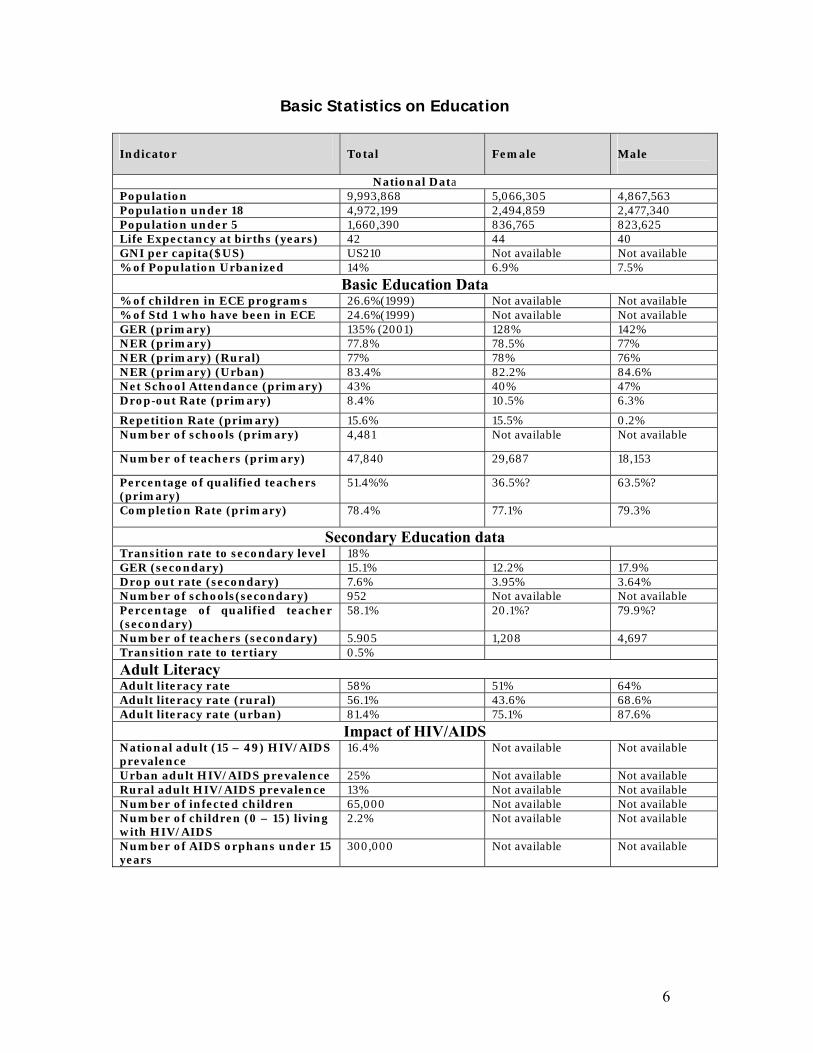
Basic Statistics on Education Indicator
Total
Female
Male
National Data Population 9,993,868 5,066,305 4,867,563 Population under 18 4,972,199 2,494,859 2,477,340 Population under 5 1,660,390 836,765 823,625 Life Expectancy at births (years) 42 44 40 GNI per capita($US) US210 Not available Not available % of Population Urbanized 14% 6.9% 7.5%
Basic Education Data % of children in ECE programs 26.6%(1999) Not available Not available % of Std 1 who have been in ECE 24.6%(1999) Not available Not available GER (primary) 135% (2001) 128% 142% NER (primary) 77.8% 78.5% 77% NER (primary) (Rural) 77% 78% 76% NER (primary) (Urban) 83.4% 82.2% 84.6% Net School Attendance (primary) 43% 40% 47% Drop-out Rate (primary) 8.4% 10.5% 6.3%
Repetition Rate (primary) 15.6% 15.5% 0.2% Number of schools (primary) 4,481 Not available Not available
Number of teachers (primary) 47,840 29,687 18,153
Percentage of qualified teachers (primary)
51.4%% 36.5%? 63.5%?
Completion Rate (primary) 78.4% 77.1% 79.3%
Secondary Education data Transition rate to secondary level 18% GER (secondary) 15.1% 12.2% 17.9% Drop out rate (secondary) 7.6% 3.95% 3.64% Number of schools(secondary) 952 Not available Not available Percentage of qualified teacher (secondary)
58.1% 20.1%? 79.9%?
Number of teachers (secondary) 5.905 1,208 4,697 Transition rate to tertiary 0.5%
Adult Literacy Adult literacy rate 58% 51% 64% Adult literacy rate (rural) 56.1% 43.6% 68.6% Adult literacy rate (urban) 81.4% 75.1% 87.6%
Impact of HIV/AIDS National adult (15 – 49) HIV/AIDS prevalence
16.4% Not available Not available
Urban adult HIV/AIDS prevalence 25% Not available Not available Rural adult HIV/AIDS prevalence 13% Not available Not available Number of infected children 65,000 Not available Not available Number of children (0 – 15) living with HIV/AIDS
2.2% Not available Not available
Number of AIDS orphans under 15 years
300,000 Not available Not available
6
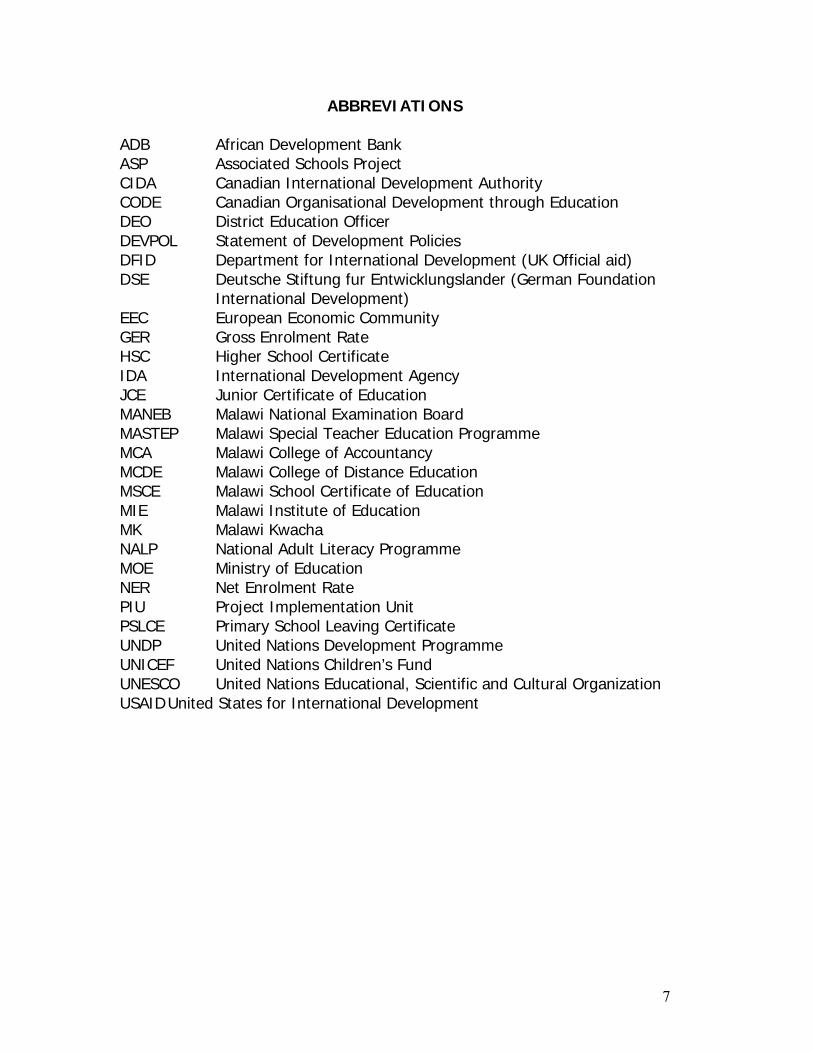
ABBREVIATIONS ADB African Development Bank ASP Associated Schools Project CIDA Canadian International Development Authority CODE Canadian Organisational Development through Education DEO District Education Officer DEVPOL Statement of Development Policies DFID Department for International Development (UK Official aid) DSE Deutsche Stiftung fur Entwicklungslander (German Foundation
International Development) EEC European Economic Community GER Gross Enrolment Rate HSC Higher School Certificate IDA International Development Agency JCE Junior Certificate of Education MANEB Malawi National Examination Board MASTEP Malawi Special Teacher Education Programme MCA Malawi College of Accountancy MCDE Malawi College of Distance Education MSCE Malawi School Certificate of Education MIE Malawi Institute of Education MK Malawi Kwacha NALP National Adult Literacy Programme MOE Ministry of Education NER Net Enrolment Rate PIU Project Implementation Unit PSLCE Primary School Leaving Certificate UNDP United Nations Development Programme UNICEF United Nations Children’s Fund UNESCO United Nations Educational, Scientific and Cultural Organization USAID United States for International Development
7
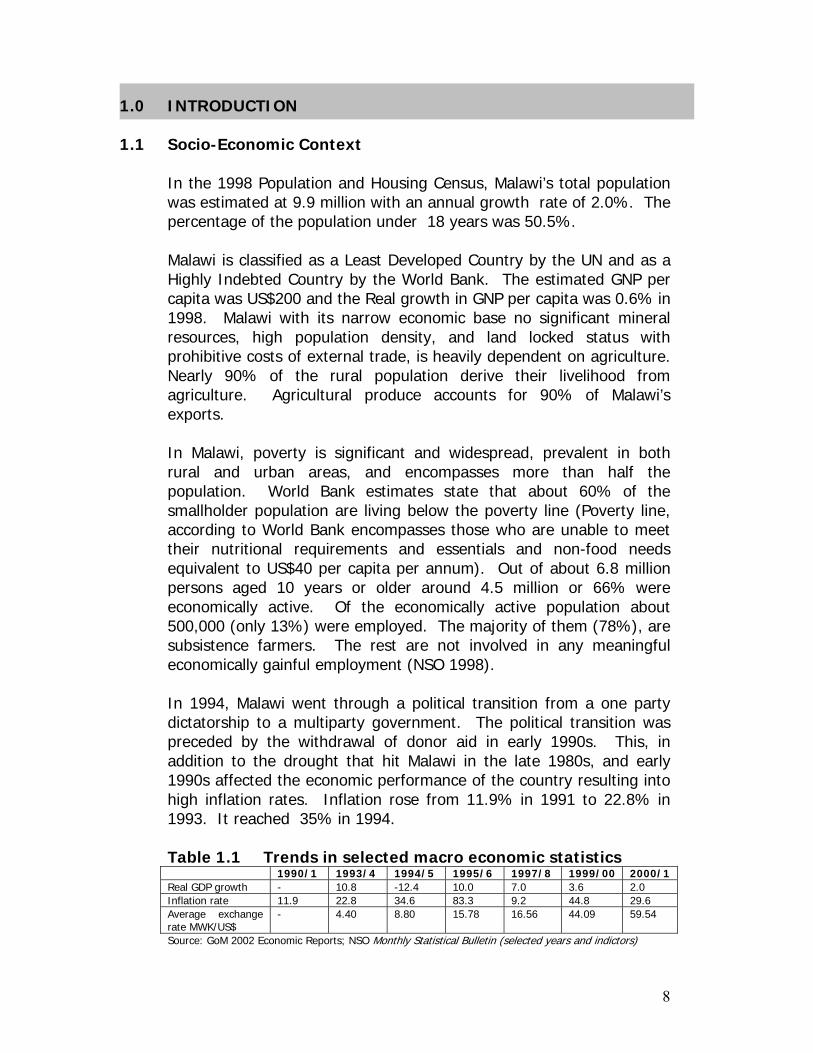
1.0 INTRODUCTION 1.1 Socio-Economic Context
In the 1998 Population and Housing Census, Malawi’s total population was estimated at 9.9 million with an annual growth rate of 2.0%. The percentage of the population under 18 years was 50.5%. Malawi is classified as a Least Developed Country by the UN and as a Highly Indebted Country by the World Bank. The estimated GNP per capita was US$200 and the Real growth in GNP per capita was 0.6% in 1998. Malawi with its narrow economic base no significant mineral resources, high population density, and land locked status with prohibitive costs of external trade, is heavily dependent on agriculture. Nearly 90% of the rural population derive their livelihood from agriculture. Agricultural produce accounts for 90% of Malawi’s exports. In Malawi, poverty is significant and widespread, prevalent in both rural and urban areas, and encompasses more than half the population. World Bank estimates state that about 60% of the smallholder population are living below the poverty line (Poverty line, according to World Bank encompasses those who are unable to meet their nutritional requirements and essentials and non-food needs equivalent to US$40 per capita per annum). Out of about 6.8 million persons aged 10 years or older around 4.5 million or 66% were economically active. Of the economically active population about 500,000 (only 13%) were employed. The majority of them (78%), are subsistence farmers. The rest are not involved in any meaningful economically gainful employment (NSO 1998).
In 1994, Malawi went through a political transition from a one party dictatorship to a multiparty government. The political transition was preceded by the withdrawal of donor aid in early 1990s. This, in addition to the drought that hit Malawi in the late 1980s, and early 1990s affected the economic performance of the country resulting into high inflation rates. Inflation rose from 11.9% in 1991 to 22.8% in 1993. It reached 35% in 1994. Table 1.1 Trends in selected macro economic statistics 1990/1 1993/4 1994/5 1995/6 1997/8 1999/00 2000/1 Real GDP growth - 10.8 -12.4 10.0 7.0 3.6 2.0 Inflation rate 11.9 22.8 34.6 83.3 9.2 44.8 29.6 Average exchange rate MWK/US$
- 4.40 8.80 15.78 16.56 44.09 59.54
Source: GoM 2002 Economic Reports; NSO Monthly Statistical Bulletin (selected years and indic ors)t
8
Good progress was, however, made in the immediate post 1994 years. Fiscal deficits fell from 28% to 8% in 1997. Inflation fell to 9% in 1997. Growth in GDP averaged over 3% in the period 92-97. In August 1998, Malawi’s official exchange currency, the Kwacha, experienced the worst devaluation of 68%. This was influenced by the decline in the value of currencies of Malawi’s main trading partners (South Africa and Zimbabwe) and also by the laxity in expenditure control in some sectors. In order to strengthen its fight against poverty, Government launched the Poverty Reduction Strategy in 2003. Education and human capital development is recognized as one of the crucial pillars in tackling the problem of poverty in Malawi.
1.2 Political Context
Malawi went through a smooth transition to a multiparty political system in 1994 when the country held its first multiparty presidential and parliamentary general elections since independence in 1964. Considerable strides towards good governance have been made since 1994. An office of the Ombudsman, the Human Rights Commission, and an Anti-Corruption Bureau have been established. The Public Affairs Committee is the watchdog for the Civil Society. The high level of illiteracy, now at 42% (1998 Population and Housing Census) is a major obstacle to the democratization process of the Malawi society. The masses are unable to appreciate the value of the political liberties accorded to them as enshrined in the 1995 Republican Constitution. The second and third general elections were held in 1999 and 2004.
1.3 Gender
Malawian women produce 70 – 80% of the food consumed in Malawi and make up 51% of the population (1998 Population and Housing Census). Despite articles in the Constitution that protect the position of women Malawi still has the problem of inheritance rights for women and domestic violence. Government has taken a number of important steps in order to address this situation.
9
There is a Gender Policy whose main objective is to mainstream the gender dimension into all aspects of Malawi life. The policy sets out priorities and strategies for addressing gender issues. In 1997, the Malawi Government signed the SADC Declaration on Gender and Development which commits the Malawi Government to the integration of gender dimensions in all public policies and programmes. In education there is inequity of opportunity for girls especially at secondary and higher education levels. However, the introduction of the Free Primary education and the provision of bursaries for girls at secondary level have done much to redress the situation. Social mobilization campaign, the establishment of a Gender Appropriate Curriculum Unit at Malawi Institute of Education and the introduction of the policy to readmit girls who get pregnant while at school, have ensured that gender based disparities between male and female students are addressed.
2.0 EDUCATION POLICIES AND REFORMS 2.1 Principles and General Objectives of Education
The broad policy on education is to develop an “efficient” and high quality system of education of a type and size appropriate both to the available resources and to the political, social and economic aspirations of the nation. The emphasis of education is to equip the students with the skills and desire for self-employment and entrepreneurship rather than conventional wage employment. The Ministry of Education and Human Resource Development (MOEHRD) is responsible for the provision of primary, secondary and tertiary education. However, the provision of technical and vocational education is under the Ministry of Labour and Vocational Training (MOLVT). While Government is the main provider of education at all levels, the private sector is currently active in the provision of pre-primary, primary, secondary and tertiary education. Before 1994, Government was guided by two Education Development Plans (EDP) that preceded each other.
10
The first EDP was formulated for the period 1973 to 1980. It had the following major objectives: i. the fulfillment of the specific needs of the labour market ii. the development of a school curriculum with relevance to the
socioeconomic and environmental needs of the country iii. the improvement of efficiency in the utilization of existing
facilities and resources; and the achievement of a more equitable distribution of educational facilities and resources
The second EDP covered the period from 1985-1995. It intended to address four overall objectives: i. the equalization of educational opportunity, ii. the promotion of efficiency in the system, iii. the improvement of physical and human resources; and
iv. the judicious use of limited resource.
The third EDP, the Education Policy and Investment Framework (PIF) for Education in Malawi, covering 1995-2005, was worked out and published in 1995 to address the challenges that the Education Sector faced with the introduction of various reforms including the Free Primary Education. This PIF was revised between 1997 and 2000 to make it more comprehensive, more focused and analytical in terms of priorities and budgetary planning mechanisms. The revision took into account, in a holistic manner all reforms that had taken place at all levels of Education. These included the following:
primary – Free Primary Education; Secondary – Changing f om a system of distance secondary
school education to Community Day Secondary Schools; r
t
Tertiary and Higher Education - The revision of the Teacher Training
Programme to address the high demand and high attrition rates at Primary and Secondary level; The establishment of the new Mzuzu University and the various reforms in the adminis ration of University of Malawi towards making it autonomous.
According to the new constitution of the Republic of Malawi drafted soon after the political transition to multiparty democracy and approved by parliament, the state shall actively promote the welfare and development of the people of Malawi by progressively adopting
11

and implementing policies and legislation aimed at achieving the following goals in the education sector among others; i. To eliminate illiteracy in Malawi ii. To make primary education compulsory and free to all citizens
of Malawi iii. To offer greater access to higher learning and continuing
education; and; iv. To promote national goals such as unity and elimination of
political, religious, racial and ethnic intolerance 2.1.1 Primary
The fundamental objective of primary education is to instill basic literacy, numeracy and life skills to over 95% of school going age population by 2012. This is an effort to achieve Universal Primary Education through the abolition of school fees and school uniform costs, the provision of free instructional materials and the establishment of schools within reasonable walking distance for every community in the country. Apart from committing itself to open and free access to primary education for school age children, Government continues to put special attention to the quality and lasting nature (durability) of the primary education given. Efforts are being made to improve the level of resources and quality of facilities provided for primary education as well as its internal and external efficiency.
2.1.2 Secondary
Primary education was, for a number of years, considered as terminal for the large majority of the school leavers who were in most cases directly entering into the labour force. However, in the recent years there has been an exceedingly high demand for secondary education since it is viewed as a gateway to higher paying jobs in the formal sector. Thus, secondary education opportunities have shifted from being geared towards primarily serving economic development to serving the social demand as well. This has impacted negatively on the curriculum, the administration of examinations and internal efficiency as will be seen later. The main focus at secondary level continues to be on the creation of a unified system of public secondary education, coordinated with the promotion of regulated private provision. As part of this strategy, Government continues with its programme to upgrade the former Distance Education Centers (DECs) which were changed to Community Day Secondary Schools in order to quality.
12
In spite of the available alternative avenues of post-primary education and training e.g. the conventional and community day secondary schools and private institutions, the demand for secondary education remains high.
2.1.3 Non-Formal Education
While children’s needs are addressed in the formal educational system, adults with no formal schooling require a different approach. The Adult Literacy programme must therefore be provided in the context of people’s needs in their community and must cope with the rapidly changing demands related to the socio-economic situation. It is Government’s intention to eradicate illiteracy by strengthening and intensifying the National Literacy Programme (NALP) along side the free primary education programme.
2.1.4 Tertiary Education
Tertiary Education in Malawi embraces primary and secondary teacher training, technical education, university education and other post-secondary professional courses. However, this caters only for 4 per cent of the eligible target population.
2.1.4.1 Teacher Training
Government’s primary concern in teacher training at both primary and secondary level is to increase the number of qualified teachers in order to improve the quality of education through a number of interventions such as residential as well as distance pre- and in-service courses, expansion of existing institutions and training of the para-professional teachers who were recruited when free primary education was introduced.
2.1.4.2 Technical, Entrepreneurial and Vocational Education and Training Since the late 1990s, Malawi has experienced an increase in the labour force of over four million people. The vast majority of these have a low level of formal education and poor professional skills. The number of illiterates and school dropouts is still alarmingly high. Even those who undergo significant schooling are not really equipped with skills required in the labour market.
13
Malawi used to have, and still has, four government-aided and three state technical and vocational training institutions offering formal training in some 22 trades in the fields of building/construction, engineering, horticulture, and printing. The training was based on an apprenticeship system (for four years) at artisan and technician level. Annual intake was around 500.
Government realized that this system of technical and vocational training was not flexible enough to face the challenge of the dynamic labour market. In January 1999, the Ministry of Labour and Vocational Training (MOLVT) launched a policy whose mission is to contribute to human resource development in response to labour market demands and to increase Malawi’s economic productivity through the provision of Technical, Entrepreneurial and Vocational Education and Training (TEVET) based on environmentally appropriate technology. The TEVET system is demand-driven and takes the form of a competency – based modular system with multiple entry and exit points, turning the acquisition of technical, managerial and business skills into a lifelong learning process. Government established Technical Education and Vocational Training Authority (TEVETA) to regulate the technical education and vocational training programmes and activities.
2.1.4.3 University Education
Government’s policy on Tertiary Education is to increase access from 3,300 in 1997 to 12,000 by 2012. The main strategies include optimizing use of the available physical and human resources. Which will include intensified use of facilities during nights, weekends and holidays as well as joint time tabling across faculties. Mzuzu University and the University of Malawi are encouraged to mount distance education programmes with the aim of catering for at least 15% of the total tertiary students’ population. Government encourages private initiatives in tertiary education provision. The intention is to have private tertiary students comprise 15% of total enrolment by 2012.
3.0 THE STRUCTURE OF EDUCATION SYSTEM IN MALAWI
Education in Malawi is governed by the Education Act of 1962. A new Act, however, is in the process of preparation. The Ministry of Education and Human Resource Development, which provides
14

support to many other institutions acts as a central policymaking body for the whole education system. The Ministry of Education facilitates the enactment of laws in Parliament; initiates policies and policy reforms, strategies, programmes and projects for education development and issues guidelines and advisory services for private participation in the development of the education system.
The formal education system is composed of three levels:
1. Primary: The official entry age for primary education is 6 years. It comprises standards one to eight. This is divided into infant (standards 1-2), junior (standards 3-5) and senior (standards 6- 8). At the conclusion of the primary cycle, pupils sit for the primary school leaving certificate examination (PSLCE), which also determines their eligibility for entry into secondary school. Currently, there are 5,055 primary schools in the country with a total enrolment of 3,088,460. (Basic Education Statistics 2003).
The eight years of primary education culminate in the Primary School Leaving Certificate Examination. This examination is also used as a selection tool for places in secondary schools.
2. Secondary education: Lasts 4 years, i.e. 2 years Junior
Certificate level (forms I and II) and 2 years Malawi School Certificate (forms III and IV).
3. Post secondary education: Varies in length depending on the
type of the education programme. Some of the programmes include:
i.Teacher Training - that normally lasted 2 years, but got modified between after Free Primary Education was introduced in 1994 in an effort to train more teachers to meet the high teacher demand. Government plans to go back to the two-year (modified) programme, which will combine both residential and distance mode of training;
ii. Diploma and degree programmes - of university
education lasting between 3 and 5 years; iii. Apprenticeship courses - lasting between 2 to 4 years
(See Fig. 1.)
15
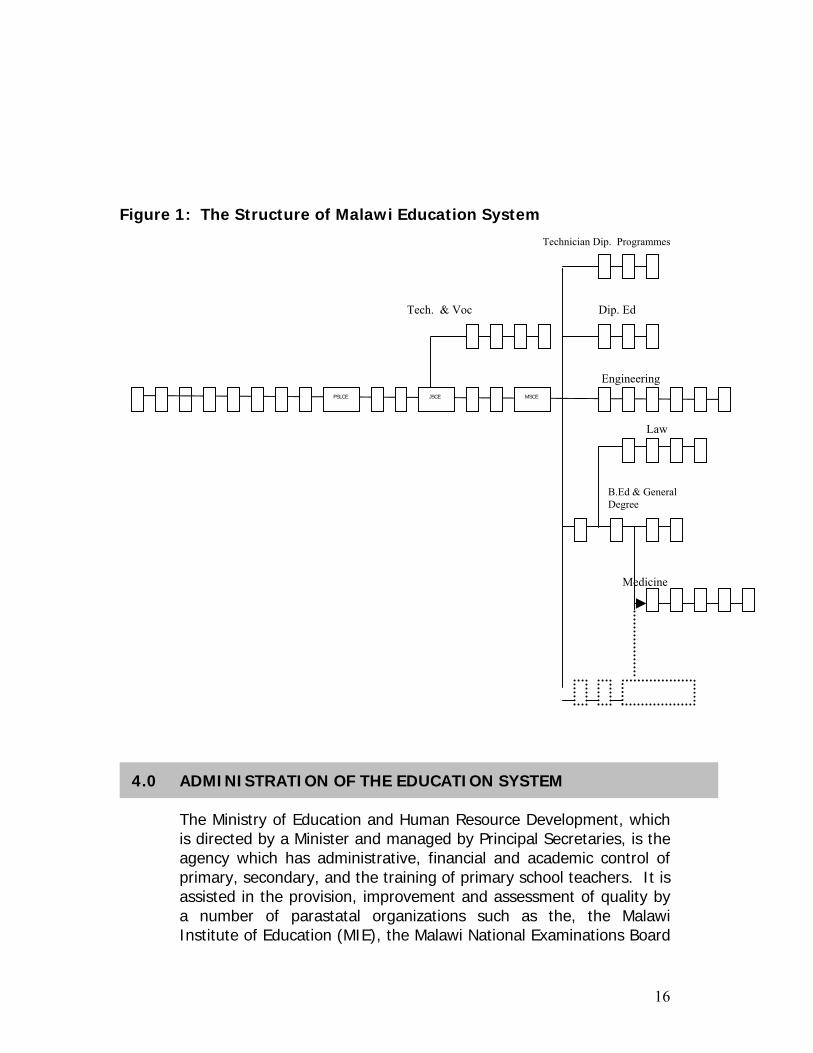
Figure 1: The Structure of Malawi Education System
Technician Dip. Programmes Tech. & Voc Dip. Ed Engineering
Law
Medicine
JSCE MSCE
B.Ed & General Degree
PSLCE
4.0 ADMINISTRATION OF THE EDUCATION SYSTEM
The Ministry of Education and Human Resource Development, which is directed by a Minister and managed by Principal Secretaries, is the agency which has administrative, financial and academic control of primary, secondary, and the training of primary school teachers. It is assisted in the provision, improvement and assessment of quality by a number of parastatal organizations such as the, the Malawi Institute of Education (MIE), the Malawi National Examinations Board
16

(MANEB), the National Library Service (NLS), The Teaching Service Commission and the Malawi National Commission for UNESCO. These are autonomous institutions, funded almost entirely by Government. The training of secondary school teachers is carried out by both the Ministry of Education and Human Resource Development (i.e. diploma teachers) and the Universities (graduate teachers).
Administration of education over the years has been centralized at the Ministry Headquarters, but following recommendations of an independent study (Education Service Review, MOEST and Price Waterhouse, March 1988) some steps have been undertaken to decentralize the management of the system.
To date, there has been devolution of the responsibility for budgeting and financial management to post-primary institutions, regional and district education offices. Decentralisation of functions such as schools inspection and planning is at an advanced stage while that of staff development has just started. The Sector is managed through central, divisional (six) and district (31) structures. Primary schools are organized through a Zonal system (317 Zones) with each zone served by a Teachers’ Development Centre (TDC). A similar system, Cluster System, has been developed for the secondary sub-sector – 96 clusters have been set up.
5.0 THE FINANCING OF EDUCATION
In spite of the scarcity of financial resources, the GoM has been able to increase funding for education by shifting resources to education from other sources. The reallocation in public expenditure has received a hearty approval from the international development agencies and education economists. The share of GDP devoted to public expenditure on education has been rising, climbing from 3.8% in 1990/91 to 5.7% in 1995/96. The GoM ensures that the education sector benefits from a high proportion of public expenditure as table 5.1 shows: The trend shown in the table is consistent with the government’s policy on education. The budgetary allocation to education jumped from 22% in the 1993/94 fiscal year to 29% in the following year. In 2002, it had however gone down to 21%.
17
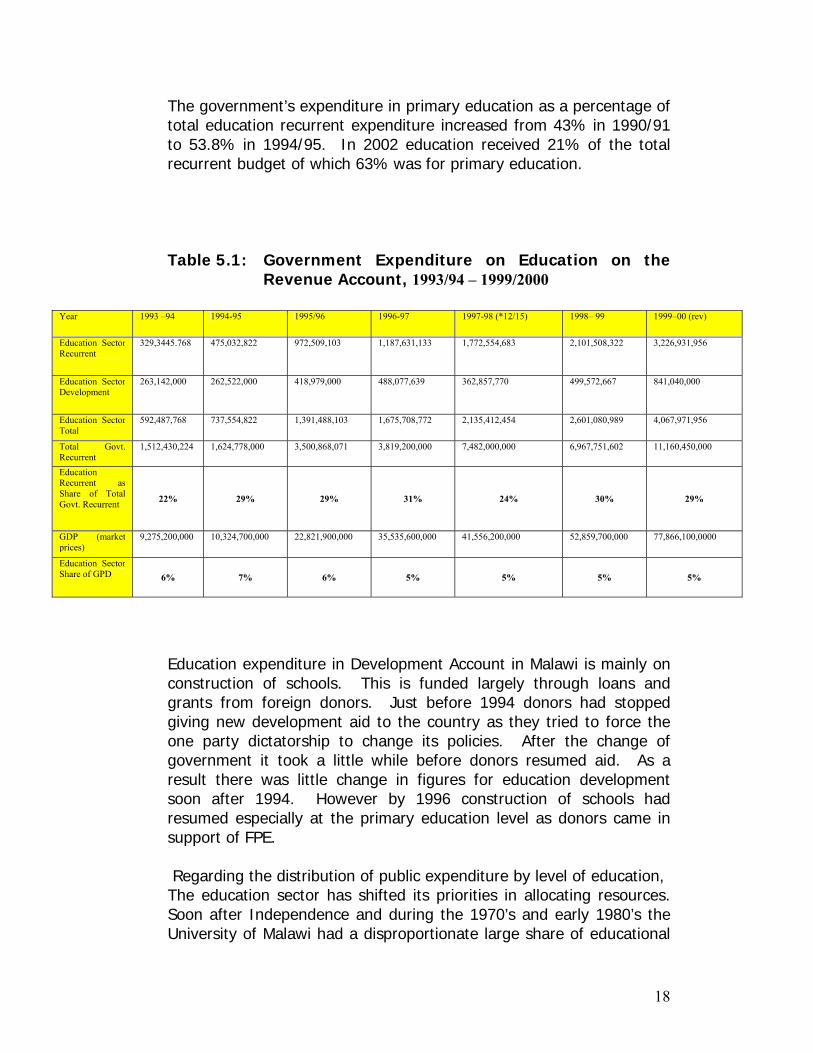
The government’s expenditure in primary education as a percentage of total education recurrent expenditure increased from 43% in 1990/91 to 53.8% in 1994/95. In 2002 education received 21% of the total recurrent budget of which 63% was for primary education. Table 5.1: Government Expenditure on Education on the
Revenue Account, 1993/94 – 1999/2000
Year 1993 –94 1994-95 1995/96 1996-97 1997-98 (*12/15) 1998– 99 1999–00 (rev)
Education Sector Recurrent
329,3445.768 475,032,822 972,509,103 1,187,631,133 1,772,554,683 2,101,508,322 3,226,931,956
Education Sector Development
263,142,000 262,522,000 418,979,000 488,077,639 362,857,770 499,572,667 841,040,000
Education Sector Total
592,487,768 737,554,822 1,391,488,103 1,675,708,772 2,135,412,454 2,601,080,989 4,067,971,956
Total Govt. Recurrent
1,512,430,224 1,624,778,000 3,500,868,071 3,819,200,000 7,482,000,000 6,967,751,602 11,160,450,000
Education Recurrent as Share of Total Govt. Recurrent 22% 29% 29% 31% 24% 30% 29%
GDP (market prices)
9,275,200,000 10,324,700,000 22,821,900,000 35,535,600,000 41,556,200,000 52,859,700,000 77,866,100,0000
Education Sector Share of GPD 6% 7% 6% 5% 5% 5% 5%
Education expenditure in Development Account in Malawi is mainly on construction of schools. This is funded largely through loans and grants from foreign donors. Just before 1994 donors had stopped giving new development aid to the country as they tried to force the one party dictatorship to change its policies. After the change of government it took a little while before donors resumed aid. As a result there was little change in figures for education development soon after 1994. However by 1996 construction of schools had resumed especially at the primary education level as donors came in support of FPE.
Regarding the distribution of public expenditure by level of education, The education sector has shifted its priorities in allocating resources. Soon after Independence and during the 1970’s and early 1980’s the University of Malawi had a disproportionate large share of educational
18
resources. During the Second Educational Development Plan in the 1980s, resources for primary education steadily increased from 38% to 48% of total recurrent expenditure on education. In 1993/94 the recurrent expenditure on primary education rose to 51%.
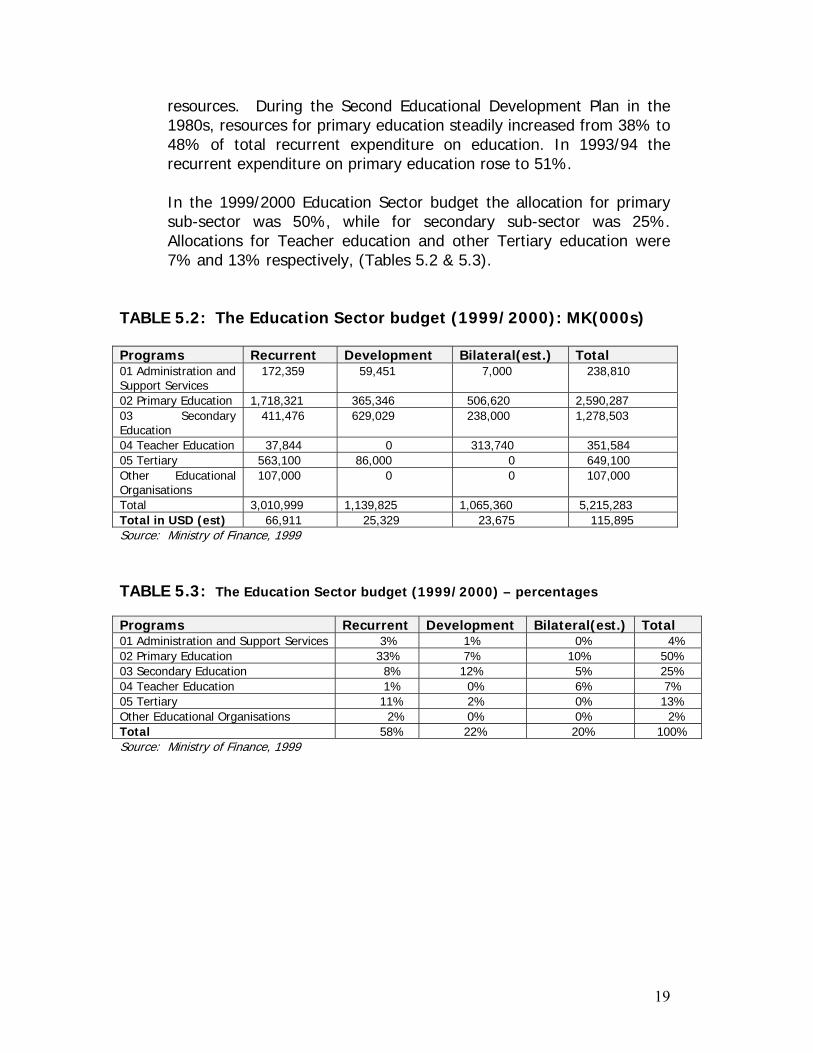
In the 1999/2000 Education Sector budget the allocation for primary sub-sector was 50%, while for secondary sub-sector was 25%. Allocations for Teacher education and other Tertiary education were 7% and 13% respectively, (Tables 5.2 & 5.3).
TABLE 5.2: The Education Sector budget (1999/2000): MK(000s) Programs Recurrent Development Bilateral(est.) Total 01 Administration and Support Services
172,359 59,451 7,000 238,810
02 Primary Education 1,718,321 365,346 506,620 2,590,287 03 Secondary Education
411,476 629,029 238,000 1,278,503
04 Teacher Education 37,844 0 313,740 351,584 05 Tertiary 563,100 86,000 0 649,100 Other Educational Organisations
107,000 0 0 107,000
Total 3,010,999 1,139,825 1,065,360 5,215,283 Total in USD (est) 66,911 25,329 23,675 115,895 Source: Ministry of Finance, 1999 TABLE 5.3: The Education Sector budget (1999/2000) – percentages Programs Recurrent Development Bilateral(est.) Total 01 Administration and Support Services 3% 1% 0% 4% 02 Primary Education 33% 7% 10% 50% 03 Secondary Education 8% 12% 5% 25% 04 Teacher Education 1% 0% 6% 7% 05 Tertiary 11% 2% 0% 13% Other Educational Organisations 2% 0% 0% 2% Total 58% 22% 20% 100% Source: Ministry of Finance, 1999
19
6.0 THE EDUCATION PROCESS 6.1 CURRICULUM 6.1.1 Pre-School Education
Government recognizes and acknowledges the special role pre-schools play in the acculturation and socialization of a child. In this view the government developed a national Policy on Early Childhood Development (ECD). A curriculum on pre-school education is currently being developed. Meanwhile, Government encourages the Local Education Authorities (LEA). Local Government Authorities, NGOs, Churches and private entrepreneurs to participate in the provision of Early Childhood Development Programmes.
6.1.2 Primary Education
The primary curriculum is being reviewed through the Primary Curriculum and Assessment Review programme(PCAR). The PCAR process is a consultative process responding to needs of the nation. The major departure from the current curriculum is introduction of the readiness year, learning areas and continuous assessment.
6.1.3 Secondary Education
The secondary school curriculum was revised in 1998 – 1999 and implemented in 2000.
6.1.4 Medium of Instruction
For a number of years Chichewa was used as a medium of instruction in the lower primary school. The use of Chichewa created lots of problems in areas where Chichewa was not the mother tongue. The Government’s new language policy is to encourage the use of local vernacular languages as media of instruction in standards 1 to 4. However, English and Chichewa are taught as subjects. From standard five onwards, English is a medium of instruction.
20
6.2 ACCESS
6.2.1 Primary
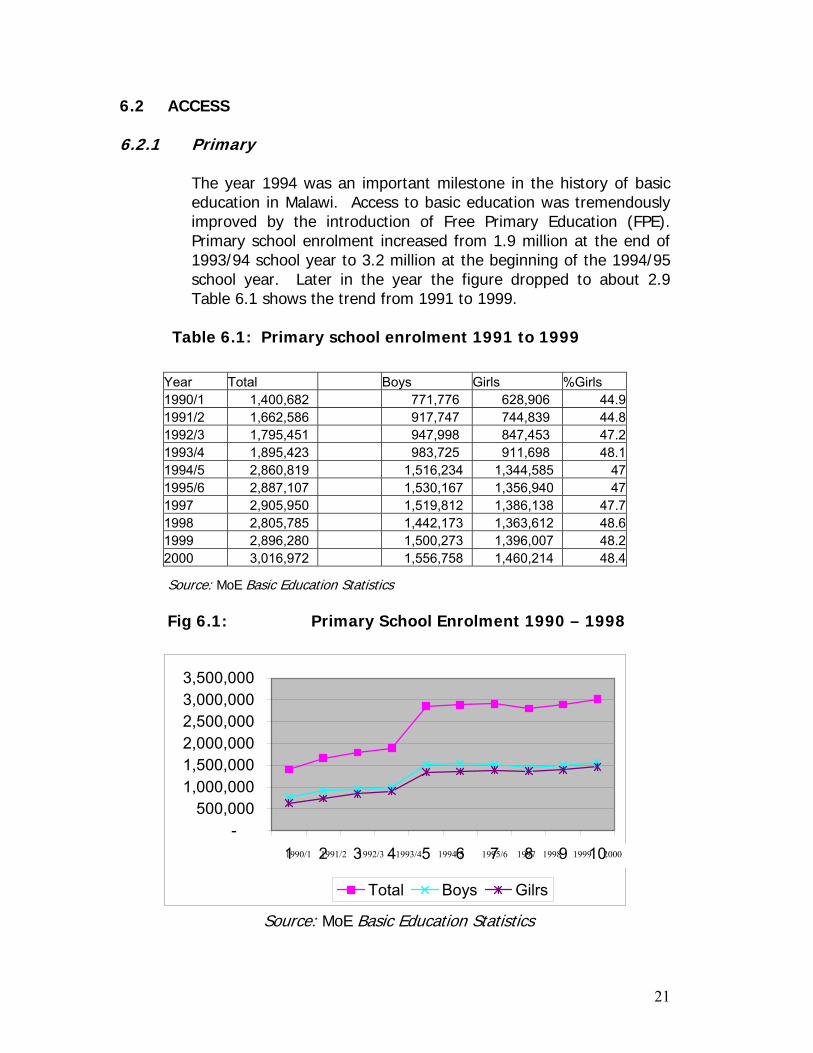
The year 1994 was an important milestone in the history of basic education in Malawi. Access to basic education was tremendously improved by the introduction of Free Primary Education (FPE). Primary school enrolment increased from 1.9 million at the end of 1993/94 school year to 3.2 million at the beginning of the 1994/95 school year. Later in the year the figure dropped to about 2.9 Table 6.1 shows the trend from 1991 to 1999.
Table 6.1: Primary school enrolment 1991 to 1999
Year Total Boys Girls %Girls 1990/1 1,400,682 771,776 628,906 44.91991/2 1,662,586 917,747 744,839 44.81992/3 1,795,451 947,998 847,453 47.21993/4 1,895,423 983,725 911,698 48.11994/5 2,860,819 1,516,234 1,344,585 471995/6 2,887,107 1,530,167 1,356,940 471997 2,905,950 1,519,812 1,386,138 47.71998 2,805,785 1,442,173 1,363,612 48.61999 2,896,280 1,500,273 1,396,007 48.22000 3,016,972 1,556,758 1,460,214 48.4
Source: MoE Basic Education Statistics
Fig 6.1: Primary School Enrolment 1990 – 1998
-500,000
1,000,0001,500,0002,000,0002,500,0003,000,0003,500,000
Total Boys Gilrs
1 2 3 4 5 6 7 8 9 101990/1 1991/2 1992/3 1993/4 1994/5 1995/6 1997 1998 1999 2000
Source: MoE Basic Education Statistics
21
As can be seen from table 6.1 and fig. 6.1, primary school enrolment has been stabilized at around 3 million. The 1997 figure represented a Gross Enrolment Ratio (GER) of 135.6% and a Net Enrolment Ratio (NER) of about 95%. Before 1994 the NER was only 68%. This is a big improvement in access to primary education. The introduction of the FPE brought its own challenges. The increase in enrolment had made the shortage of classrooms, teachers and teaching and learning materials even more acute. The quality of the system suffered seriously particularly in the first year of FPE. Repetition and dropout rates increased significantly from 1993/94 to 1994/95 as will be seen later in section 6.2. This was the first year of FPE. The situation is now improving, but it is still unacceptably high.
6.2.2 Secondary
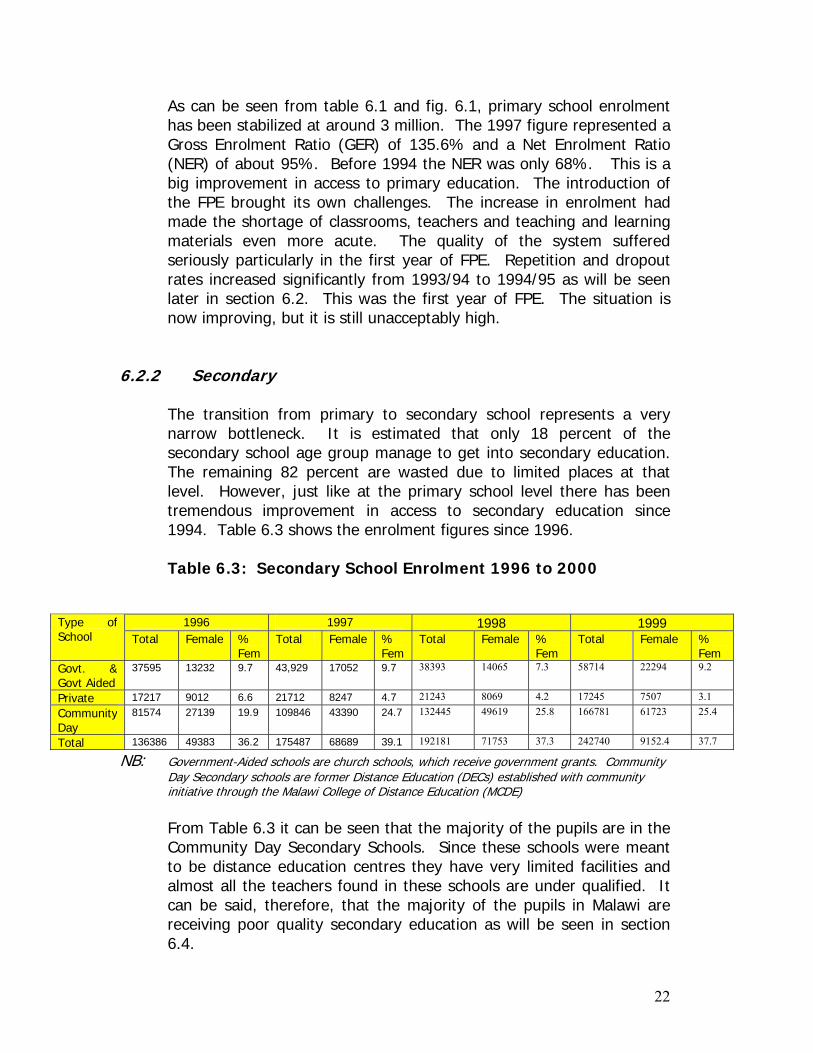
The transition from primary to secondary school represents a very narrow bottleneck. It is estimated that only 18 percent of the secondary school age group manage to get into secondary education. The remaining 82 percent are wasted due to limited places at that level. However, just like at the primary school level there has been tremendous improvement in access to secondary education since 1994. Table 6.3 shows the enrolment figures since 1996.
Table 6.3: Secondary School Enrolment 1996 to 2000
1996 1997 1998 1999 Type of School Total Female %
Fem Total Female %
FemTotal Female %
Fem Total Female %
Fem Govt. & Govt Aided
37595 13232 9.7 43,929 17052 9.7 38393 14065 7.3 58714 22294 9.2
Private 17217 9012 6.6 21712 8247 4.7 21243 8069 4.2 17245 7507 3.1 Community Day
81574 27139 19.9 109846 43390 24.7 132445 49619 25.8 166781 61723 25.4
Total 136386 49383 36.2 175487 68689 39.1 192181 71753 37.3 242740 9152.4 37.7
NB: Government-Aided schools are church schools, which receive government grants. Community Day Secondary schools are former Distance Education (DECs) established with community initiative through the Malawi College of Distance Education (MCDE)
From Table 6.3 it can be seen that the majority of the pupils are in the
Community Day Secondary Schools. Since these schools were meant to be distance education centres they have very limited facilities and almost all the teachers found in these schools are under qualified. It can be said, therefore, that the majority of the pupils in Malawi are receiving poor quality secondary education as will be seen in section 6.4.
22
At present there are over 1000 secondary schools in the country. Of these schools 101 are Government Schools, (Government Day Schools, Government Boarding and Day Schools with limited boarding facilities) 600 are Community Day schools. The number of community day schools is fluid as communities are allowed to open schools at will. The number of private schools secondary is not easy to ascertain, but it estimated at 300. Despite secondary schools exceeding 1000 and enrolment in the 2001/02 school year estimated at 283,128 access is still very limited. With a gross enrolment ratio of 18%, there is a big challenge to meet the key PIF objective on secondary education, i.e., to increase the number of primary school graduates who access secondary education from the current 16% to 30% by 2012.
Access is also highly unequal, particularly affecting children from low-income families and girls. Studies show that only 20% of the standard eight candidates manage to get a place in government financed schools. The latter account for only around 37 percent of gross enrolment.
6.2.3 Tertiary Education
As stated earlier, tertiary education in Malawi embraces technical education, primary and secondary teacher training, university education and other post-secondary professional institutions.
i. Technical Education and Vocational Training There are four government technical colleges, which are equipped to offer craft and technical level training in construction, engineering and business studies with an annual intake of around 500 students. In 1995/96 there was a total of 1,054 students. In 1999 there were an estimated 1,305 students. Access is limited by the capacity of boarding accommodation. With the introduction of the modular training system which allows for multiple entry points and exit points, Government through TEVETA, intends to increase access.
23

TABLE 6.4: Enrolment of Technical and Vocational Colleges by Course of Study 1994 – 1999
Course of Study 1994/95 1995/96 1997 1998 1999
Two years full time training 249 243 297 285 282 Three years full time training 0 0 0 0 0 Apprentice training 326 318 389 415 422 Upgrading/Block release 445 434 531 543 545 One year full time training 60 59 72 65 56 Total 1,808 1,054 1,290 1,308 1,305
Source: Ministry of Labour and Vocational T aining r ii. Teacher Education
Primary School Teacher Training
There are presently six Teacher Training Colleges (TTCs) in Malawi with the total bed space of approximately 2,700 student teachers.
When Free Primary Education programme was being introduced, there were 27, 748 teachers representing a pupil/teacher ratio of about 1:100. The Ministry of Education then recruited 18,000 untrained additional teachers along with 4,000 retired teachers. Apart from a two-week orientation course, the trained teachers did not receive any formal training. The untrained teachers were posted to schools and enrolled in the two-year Malawi Integrated Teacher Education Programme (MIITEP) certificate course. These untrained teachers effectively lowered down the teacher pupil ratio to approximately 1:63. In order to meet the ever increasing high demand of qualified teachers, the MIITEP replaced the traditional conventional residential teacher training programme. The MIITEP has three components. Having been recruited and having gained experience in schools, MIITEP students undertake a three-moth college-based course. This is followed by five terms practicing teaching and undertaking self-study back in school, during which time it is intended that the students receive support not only from Teacher Training College (TTC) staff, but also from school staff and from Primary
24
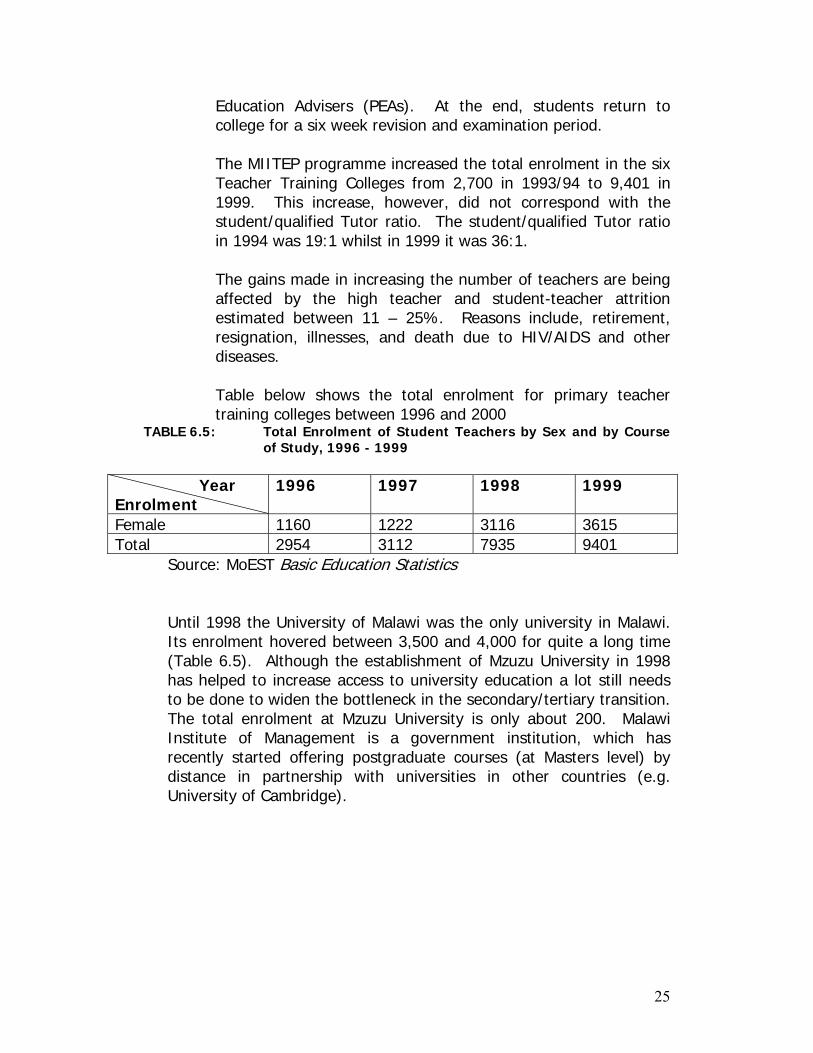
Education Advisers (PEAs). At the end, students return to college for a six week revision and examination period. The MIITEP programme increased the total enrolment in the six Teacher Training Colleges from 2,700 in 1993/94 to 9,401 in 1999. This increase, however, did not correspond with the student/qualified Tutor ratio. The student/qualified Tutor ratio in 1994 was 19:1 whilst in 1999 it was 36:1. The gains made in increasing the number of teachers are being affected by the high teacher and student-teacher attrition estimated between 11 – 25%. Reasons include, retirement, resignation, illnesses, and death due to HIV/AIDS and other diseases.
Table below shows the total enrolment for primary teacher training colleges between 1996 and 2000
TABLE 6.5: Total Enrolment of Student Teachers by Sex and by Course of Study, 1996 - 1999
Year Enrolment
1996 1997 1998 1999
Female 1160 1222 3116 3615 Total 2954 3112 7935 9401
Source: MoEST Basic Education Statistics Until 1998 the University of Malawi was the only university in Malawi. Its enrolment hovered between 3,500 and 4,000 for quite a long time (Table 6.5). Although the establishment of Mzuzu University in 1998 has helped to increase access to university education a lot still needs to be done to widen the bottleneck in the secondary/tertiary transition. The total enrolment at Mzuzu University is only about 200. Malawi Institute of Management is a government institution, which has recently started offering postgraduate courses (at Masters level) by distance in partnership with universities in other countries (e.g. University of Cambridge).
25
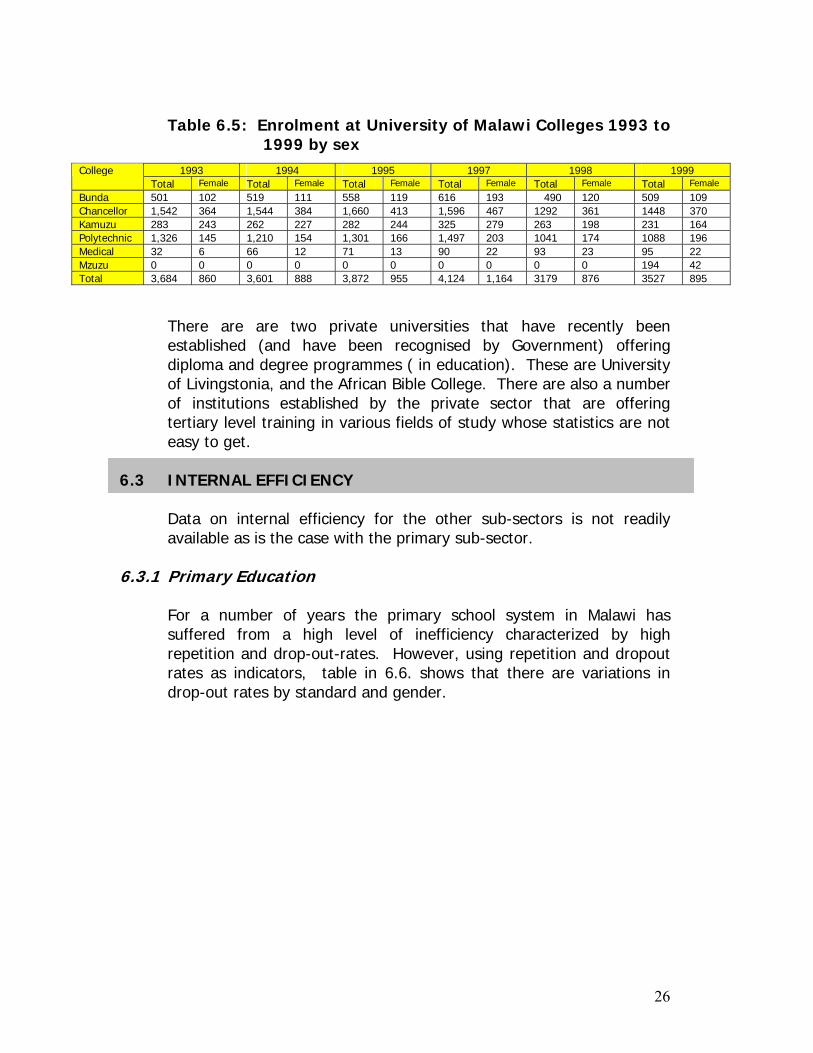
Table 6.5: Enrolment at University of Malawi Colleges 1993 to
1999 by sex
1993 1994 1995 1997 1998 1999 College Total Female Total Female Total Female Total Female Total Female Total Female
Bunda 501 102 519 111 558 119 616 193 490 120 509 109 Chancellor 1,542 364 1,544 384 1,660 413 1,596 467 1292 361 1448 370 Kamuzu 283 243 262 227 282 244 325 279 263 198 231 164 Polytechnic 1,326 145 1,210 154 1,301 166 1,497 203 1041 174 1088 196 Medical 32 6 66 12 71 13 90 22 93 23 95 22 Mzuzu 0 0 0 0 0 0 0 0 0 0 194 42 Total 3,684 860 3,601 888 3,872 955 4,124 1,164 3179 876 3527 895
There are are two private universities that have recently been established (and have been recognised by Government) offering diploma and degree programmes ( in education). These are University of Livingstonia, and the African Bible College. There are also a number of institutions established by the private sector that are offering tertiary level training in various fields of study whose statistics are not easy to get.
6.3 INTERNAL EFFICIENCY
Data on internal efficiency for the other sub-sectors is not readily available as is the case with the primary sub-sector.
6.3.1 Primary Education
For a number of years the primary school system in Malawi has suffered from a high level of inefficiency characterized by high repetition and drop-out-rates. However, using repetition and dropout rates as indicators, table in 6.6. shows that there are variations in drop-out rates by standard and gender.
26
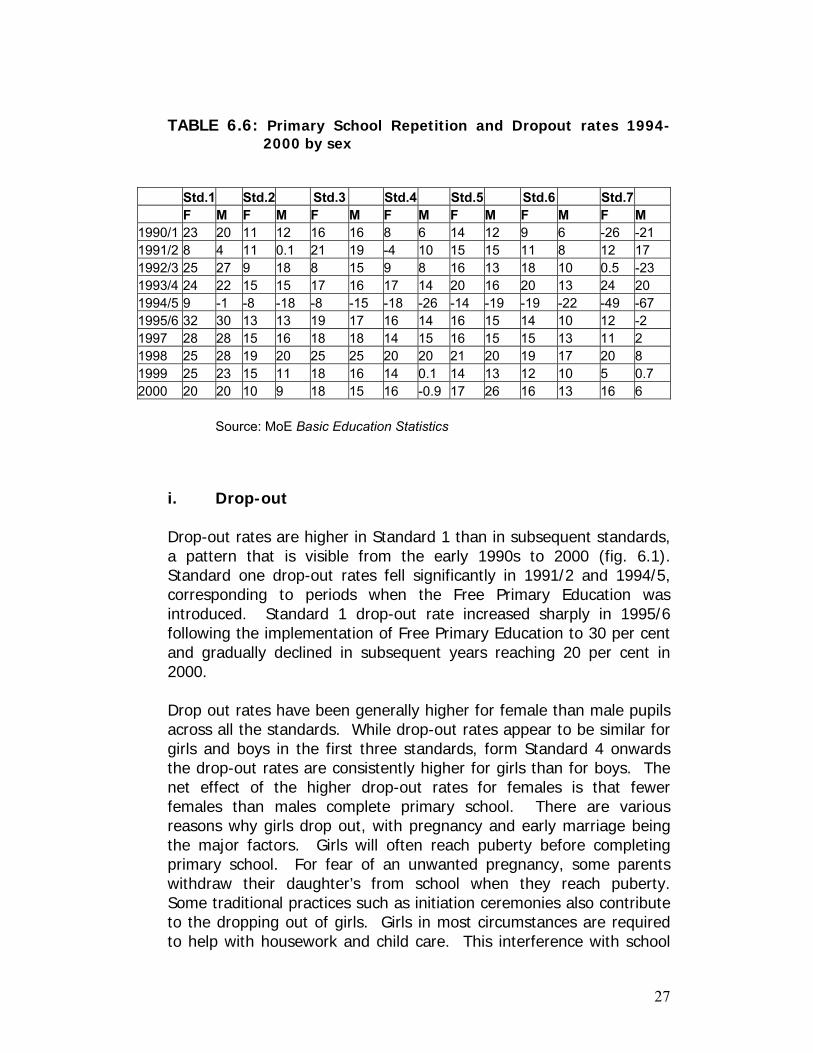
TABLE 6.6: Primary School Repetition and Dropout rates 1994-
2000 by sex
Std.1 Std.2 Std.3 Std.4 Std.5 Std.6 Std.7 F M F M F M F M F M F M F M 1990/1 23 20 11 12 16 16 8 6 14 12 9 6 -26 -21 1991/2 8 4 11 0.1 21 19 -4 10 15 15 11 8 12 17 1992/3 25 27 9 18 8 15 9 8 16 13 18 10 0.5 -23 1993/4 24 22 15 15 17 16 17 14 20 16 20 13 24 20 1994/5 9 -1 -8 -18 -8 -15 -18 -26 -14 -19 -19 -22 -49 -67 1995/6 32 30 13 13 19 17 16 14 16 15 14 10 12 -2 1997 28 28 15 16 18 18 14 15 16 15 15 13 11 2 1998 25 28 19 20 25 25 20 20 21 20 19 17 20 8 1999 25 23 15 11 18 16 14 0.1 14 13 12 10 5 0.7 2000 20 20 10 9 18 15 16 -0.9 17 26 16 13 16 6
Source: MoE Basic Education Statistics
i. Drop-out Drop-out rates are higher in Standard 1 than in subsequent standards, a pattern that is visible from the early 1990s to 2000 (fig. 6.1). Standard one drop-out rates fell significantly in 1991/2 and 1994/5, corresponding to periods when the Free Primary Education was introduced. Standard 1 drop-out rate increased sharply in 1995/6 following the implementation of Free Primary Education to 30 per cent and gradually declined in subsequent years reaching 20 per cent in 2000. Drop out rates have been generally higher for female than male pupils across all the standards. While drop-out rates appear to be similar for girls and boys in the first three standards, form Standard 4 onwards the drop-out rates are consistently higher for girls than for boys. The net effect of the higher drop-out rates for females is that fewer females than males complete primary school. There are various reasons why girls drop out, with pregnancy and early marriage being the major factors. Girls will often reach puberty before completing primary school. For fear of an unwanted pregnancy, some parents withdraw their daughter’s from school when they reach puberty. Some traditional practices such as initiation ceremonies also contribute to the dropping out of girls. Girls in most circumstances are required to help with housework and child care. This interference with school
27
work and study time causes poor academic performance which often results in repetition and dropping out. There are some factors such as the influence of initiation ceremonies that cause prolonged absenteeism of children. Government has, however, made some strides in order to address the problems brought about by initiation ceremonies. In consultation with traditional leaders, the Ministry of Education, Science and Technology had readjusted the school calendar in order to ensure that pupils attend school throughout the year without being interrupted by the initiation ceremonies. ii. Repetition
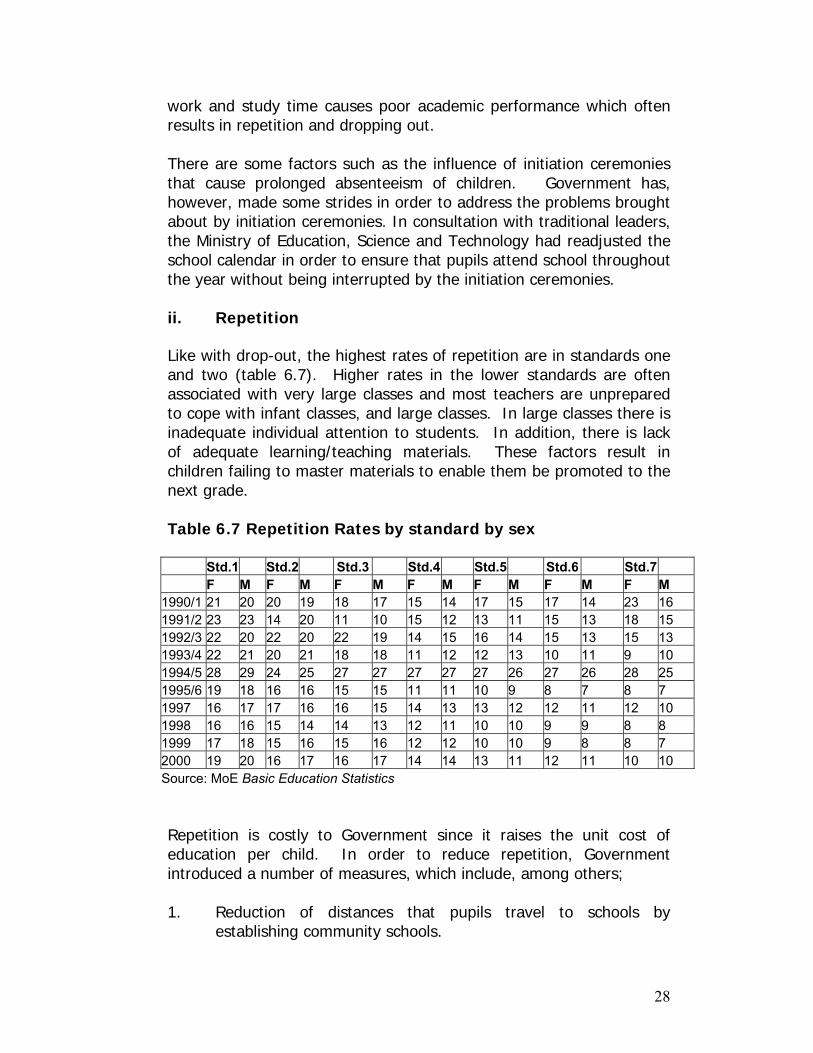
Like with drop-out, the highest rates of repetition are in standards one and two (table 6.7). Higher rates in the lower standards are often associated with very large classes and most teachers are unprepared to cope with infant classes, and large classes. In large classes there is inadequate individual attention to students. In addition, there is lack of adequate learning/teaching materials. These factors result in children failing to master materials to enable them be promoted to the next grade. Table 6.7 Repetition Rates by standard by sex
Std.1 Std.2 Std.3 Std.4 Std.5 Std.6 Std.7 F M F M F M F M F M F M F M 1990/1 21 20 20 19 18 17 15 14 17 15 17 14 23 16 1991/2 23 23 14 20 11 10 15 12 13 11 15 13 18 15 1992/3 22 20 22 20 22 19 14 15 16 14 15 13 15 13 1993/4 22 21 20 21 18 18 11 12 12 13 10 11 9 10 1994/5 28 29 24 25 27 27 27 27 27 26 27 26 28 25 1995/6 19 18 16 16 15 15 11 11 10 9 8 7 8 7 1997 16 17 17 16 16 15 14 13 13 12 12 11 12 10 1998 16 16 15 14 14 13 12 11 10 10 9 9 8 8 1999 17 18 15 16 15 16 12 12 10 10 9 8 8 7 2000 19 20 16 17 16 17 14 14 13 11 12 11 10 10 Source: MoE Basic Education Statistics Repetition is costly to Government since it raises the unit cost of education per child. In order to reduce repetition, Government introduced a number of measures, which include, among others; 1. Reduction of distances that pupils travel to schools by
establishing community schools.
28
2. Abolition of school fees and making school uniform not
compulsory. 3. Increasing the number of qualified teachers. 4. Discouraging pupils to repeat in one class for too long especially
in standard eight by expanding access to secondary education by lowering the selection quota for repeaters: 75% of the form one places in public secondary schools are reserved for non-repeaters, 25% for first time repeaters and 5% for multiple repeaters.
6.4 Quality The quality of education in Malawi which is usually indicated by the evaluation system of the Malawi National Examinations Board (MANEB) and various studies of the Quality of Monitoring and Learning Achievements (MLA) the Southern Africa Consortium of Education Achievement and Quality (SACMEQ), is largely determined by the quality of the inputs into the system. Such inputs include availability of teaching and learning materials, the learning environment, classroom and furniture, the curriculum, and qualified teachers. As in the case of statistics on internal efficiency more detailed data is found for primary sub-sector. Data for the other sub-sectors i.e. Pre-primary, Secondary and Tertiary Education is scanty in some cases not available especially on issues such availability of teaching and learning materials, the learning environment classroom and furniture.
6.4.1 Primary Education The Pupil-qualified Teacher ratio (i.e, excluding the unqualified teachers) is 118:1. The general Pupil-Teacher ratio, thus including those qualified and unqualified, is 66:1. There are however variations in teacher distribution between urban and rural areas. There are more teachers, particularly female teachers in the urban than rural areas. In 1990/91, the pupil:teacher ratio for rural schools was 81:1 compared to 77:1 for urban schools. By 2000 there were 65 children per teacher in rural schools against 46 pupils per teacher in urban schools. There has been some tremendous improvement in the provision of teaching/learning materials. In 1993/94, the pupil to textbook ratio was 4:1 with a few supplementary readers. The pupil to textbook ratio
29
is are currently 1:1. There is still a serious shortage of pupils furniture. About 90% of pupils do not have access to pupils desks.
6.4.2 Secondary Education
Secondary school teachers are trained at Chancellor College (University of Malawi), The Polytechnic (University of Malawi), Domasi College of Education and Mzuzu University. The Total output of all these institutions is approximately 350 teachers per year. The input has not kept pace with the demand which has increased over the past six years. Following an increase in private education providers, the construction of additional government schools and the changing of 450 DECs into CDSSs, the demand for secondary teachers is approximately 11,500.
6.5 The Evaluation System
The Malawi National Examinations Board (MANEB) has responsibility over the following public examinations: Malawi School Certificate of Education (MSCE). Junior Certificate of Education (JCE), Primary School Leaving Certificate of Education (PSLCE) including artisan examinations. The Board also develops examination syllabuses for all the examinable formal school subjects. Through its Research and Testing Department, it undertakes the development of testing programmes; the evaluation and testing of job applicants; training in measurement and evaluation techniques, and provides research services in Education and Educational Measurement. The MANEB has a core staff that works closely with personnel from other institutions and it has some capacity for printing materials. The Board also coordinates foreign examinations e.g. City and Guilds. Cheating practices were wide spread amongst pupils in the late 1990s to such an extent that the reliability of the MANEB examinations results was questionable. Through a ‘Cluster system’ of administering examinations where pupils from several schools take exams at one examination center, Government has been able to address malpractices that were leading to cheating among pupils and teachers.
30
In the past candidates were writing examinations in their respective schools.
7.0 SPECIAL EDUCATION Government’s policy on education for people with special needs emphasizes their integration as much as possible into normal schools. To encourage parents to send their children with special needs to school, certain provisions exist for remission of fees depending on the needs of the family. In secondary schools and Universities, the Malawi Council for the Handicapped provides more assistance to students on the basis of merit and need. While integration has worked for the deaf and the blind, there is need for special facilities and programmes for persons with other disabilities. At the moment, there are four residential special schools for the deaf/hearing impaired and two for the blind/visually impaired at primary school level. These residential schools accommodate learners with severe impairments who are separated from learners without visual and or hearing impairments. Specialist teachers teach these learners. On the other hand, learners with mild impairments are integrated in resource centres attached to regular schools where a specialist teacher is deployed to the school to support the children with special needs and regular teachers. The rest of the learners with impairments who cannot be accommodated in either residential special school or a resource centre attend other regular schools. Itinerant teachers who operate in several schools in a catchment area assist these learners. This Itinerant Programme is operational in 24 out of 33 education districts. At secondary school level there are eight secondary schools where deaf learners are integrated, nine secondary schools for the blind and only two where learners with physical disabilities are integrated. At college level there are students with all impairments at Montfort TTC, Domasi College of Education and Chancellor College (University of Malawi). However, what has been highlighted reflects only on the learners with learning difficulties, hearing impairments and visual impairments. Within the concept of inclusive education, Government has broadened
31
its focus by bringing on board other learners with special needs like orphans, children on the streets, refugees, children in conflict with the law and other. However, interventions in this regard are minimal. Government is planning to introduce a component of special needs education in each of the six regular teacher training colleges so that all the students, upon graduation, have skills on how to handle children with special needs. The major challenge in the management of special needs education is inadequate funding. Most of the specialized teaching and learning material are expensive and with inadequate funds there is always lack of materials in the centres. Residential schools and resource centres largely depend on donations from well-wishers because of inadequate funding.
8.0 PRIVATE PROVIDERS OF EDUCATION
Private Schools have in the recent past, become a common feature of the education landscape of the country. Private institutions transcend the three levels of education: pre-school, primary and secondary. For pre-school education, as there is not yet a national curriculum, institutions adopt some available curricula. Private primary and secondary schools follow the national curricula since their students sit for the national examinations prepared by the Malawi National Examinations Board. There are, however, some institutions like the Designated Schools which cater for children of diplomats and other foreigners. These schools follow international curricula. The private schools offering secondary education register with the “Private Schools Association of Malawi” (PRISAM) which is aimed at providing a voice and a policy forum for all registered Private Schools. Private Secondary Schools account for about 22% of the existing enrolled Secondary School students and about 4% of the age cohort.
32
9.0 NON-FORMAL EDUCATION
The Government began a functional adult literacy programme in 1986. The programme was designed primarily to meet the needs of smallholder farmers. Various organizations make use of the literacy programme to disseminate information, education and communication packages to the target population. The Ministry of Gender, Child Welfare and Community Services is responsible for adult literacy and adult education. An inter-ministerial and inter-sectoral body was created to give policy direction on the National Literacy Programme (NALP). Between 1987 and 1992 the programme had 2,617 centres serving an estimated 40,243 learners. According to projected target the programme was supposed to cover 10,500 centres for 262,500 learners by 1992. However, the number of learners began to dwindle in the 90s. Inadequate teaching and learning materials and poor instructor retention rates are the major factors contributing to this poor coverage. The fundamental problem is inadequate funding and lack of a dynamic Policy framework.
10.0 DEVELOPMENT PARTNERS SUPPORT
The support that Malawi receives from the donor community takes three forms. The first is through budgetary support for recurrent expenditure that Malawi receives from multilateral as well as bilateral donors. For example, in the 2002/3 budget, Malawi was expecting 18.7 per cent of it recurrent expenditure to be foreign financed. It is, however, very difficult to track how much of this funding goes to various sectors. This is because the money goes into the consolidated fund before the treasury can distribute it. However, education is one of the sectors that benefit substantially from such financing, which takes the form of grants and Highly Indebted Poor Countries ( HIPC ) debt relief.
The second involvement of donors in the education sector is through the budgetary support for capital expenditure. Over a long period of time, more than three-quarters of Malawi’s capital expenditure has been from donors. This form of support is clearly presented in the
33
budget. Information provided includes the name of the project being funded, the name of the donor funding it and the amount.
Thirdly, there is also some external funding that Malawi receives but which is never reflected in the budget documents. The education sector has also been one of the main beneficiaries of such funding. The coordination of donor inputs is the responsibility of the Planning Division of the Ministry. Donor coordination has been strengthened with the development and adoption by Government of the Policy and Investment Framework (PIF) for the education sector, the Malawi Poverty Reduction Strategy and other national frameworks.
34
REFERENCES
Banda, K. N. 1982, A Brief History of Malawi, Blantyre, Dzuka Publishing.
Centre for Education Research and Training (CERT) 1995, The Malawi Special
Teacher Education Project (MASTEP) (a general evaluation), Zomba.
Centre for Education Research and Training (CERT), (2000), Girls and Primary
Schooling in Malawi ( GAPSM), Zomba.
Croft, A, (2000), Gender gaps in Schools and colleges: Can Teacher
Education Policy Improve Gender Equity in Malawi? Discussion
Paper 14, Centre for International Education, University of Sussex.
Government of Malawi (2002), Teacher Education and Development Review, Ministry of Education, Sports and Culture, Teacher Development Unit, Lilongwe.
Jere D R and Nyirenda, D M C, 1990, Professional In-service Teacher
Education Programme for the Training of Educational and Institutional Leaders within Primary Education Systems of Malawi, Evaluation
Report, Malawi Institute of Education, Domasi. Kadzamira E C, Khwima, N and Kholowa, F 2004, Financing Primary Education
For All: Public expenditure and education outcomes in Malawi. Institute of Development Studies, University of Sussex, Brighton.
Kishindo, E C (----) Report on improving the performance of untrained
teachers in classroom, MIE Research Report Series no. 4. Malawi Institute of Education, Domasi.
Kunje D & Chirembo S 2000, The Malawi Integrated In-service Teacher
Education Programme and its school based component: Discussion Paper 12. Centre for International Education University of Sussex.
Kunje, D and Lewni, K M, 2000, The Costs and Financing of Teacher Education in Malawi: Discussion Paper 2. Centre for International Education University of Sussex.
35
Kunje D, Lewni K M and Stuart J, 2003, Primary Teacher Education in Malawi: Insights into Practice and Policy. Centre for International Education University of Sussex. Malawi Government 2000, Education Basic Statistics Malawi, 2000. Lilongwe. Malawi Government April 2002, Malawi Poverty Reduction Strategy Paper
(Final Draft). Milner G., Chimombo J., Banda, T. and Mchikoma., 2001, The Quality of
Primary Education: Some Policy suggestions based on survey of school, Malawi SACMEQ Policy Research Report 7, Paris: International Institute for Education Planning/UNESCO.
Ministry of Education, Science and Technology 1998, Malawi School Support Systems Project (MSSSP), Report of the Review team. Ministry of Education, Science and Technology 2001, Education Sector Policy
and Investment Framework (PIF), MOEST, Lilongwe. Ministry of Education, Science and Technology (MOEST) 2003, National Strategy for Teacher Education in Malawi (Draft). Mosha H. 2003, A Study on Lead Teacher Education Institutions, UNESCO.
Paris. National Statistical Office, 2003, Malawi Education Data Survey 2002, Zomba. Stuart, J S & Kunje, D 2000, The Malawi Integrated In-service Teacher
Education Project: an analysis of the curriculum and its delivery in the colleges: Discussion Paper 11. Centre for International Education University of Sussex.
Stuart, J, Kunje, D and Lefoka, P 2000, Careers and Perspectives of Tutors in
Teacher Training Colleges: Discussion Paper 16: Case studies of Lesotho and Malawi, Centre for International Education University of Sussex.
UNDP 2003, United Nations Development Report 2003, UN Headquarters,
New York. UNESCO 2000, Monitoring Learning Achievement, United Nations Education,
Scientific and Cultural Organisation, Paris.
36