the impact of groundwater chemistry on the stability of ...12589/fulltext01.pdf · i det svenska...
TRANSCRIPT

The impact of Groundwater Chemistry on the Stability of Bentonite Colloids
Sandra García García
Licentiate Thesis
School of Chemical Science and Engineering
Nuclear Chemistry Royal Institute of Technology
Stockholm, Sweden 2007
AKADEMISK AVHANDLING
Som med tillstånd av Kungliga Tekniska Högskolan framlägges till offentlig granskning för avläggande av Teknologie Licentiatexamen i kemi fredagen den 5 Oktober 2007, klockan 13.00 i sal E2, Kungliga Tekniska Högskolan, Lindstedtsvägen 3, Stockholm
i

ISBN: 978-91-7178-760-6 ISSN 1654-1081 TRITA-CHE-Report 2007:61 © Sandra García García 2007 Tryck: Universitetsserivce AB, Stockholm 2007
ii

”Entre todos los saberes posibles existe al menos uno imprescindible: el de que ciertas cosas nos convienen y otras no”. “Among all the knowledge one can possibly possess, there is at least a part of it that is essential: knowing the things that are worth doing from those that are not”. Fernando Savater
iii

Abstract In deep geological repositories in Sweden, encapsulated nuclear waste will be surrounded by compacted bentonite in the host rock. In future contact with water-bearing fractures, this bentonite barrier can release montmorillonite colloids under certain conditions. This process can lead to loss of buffer material. Furthermore, these colloids, if stable, may facilitate the transport of associated radionuclides towards the biosphere. Colloid stability is determined by groundwater chemistry. This study addresses the effects of groundwater chemistry on the stability of montmorillonite colloids. During the lifetime of the repository, the pH and ionic strength of the groundwater are expected to vary, partly due to intrusion of glacial melt water. Initially, the temperature will be higher in the surrounding host rock due to heat released from radioactive decay in the spent nuclear fuel. The effects of these parameters on the stability of montmorillonite suspensions were evaluated by studying the aggregation kinetics. The change in particle concentration with time was monitored by Photon Correlation Spectroscopy (PCS). Aggregation kinetics experiments showed that for a given pH and temperature, the rate constant for colloid aggregation increased with increasing ionic strength. The relationship between the rate constant and the ionic strength allowed the NaCl and CaCl2 critical coagulation concentration (CCC) for Na- and Ca-montmorillonite to be determined. The aggregation rate constant decreased with increasing pH as the surface potential increased. This effect became more pronounced at higher ionic strengths and higher temperatures but could not be observed at low temperature. The effect of temperature on the stability of the suspensions is pH-dependent. At pH≤4, the rate constant for colloid aggregation increased with increasing temperature, regardless of ionic strength. At pH≥10, the aggregation rate constant decreased with increasing temperature. In the intermediate pH interval, the aggregation rate constant decreased with increasing temperature except at the highest ionic strength, where it increased. The experimental results were in agreement with DLVO calculations.
iv

Abstract I det svenska djupförvaret för kärnbränsle ska kompakterad bentonit användas som barriär mellan kopparkapslar med utbränt kärnbränsle och berget. I kontakt med vattenförande sprickor kan bentonitbarriären under vissa omständigheter avge montmorillonitkolloider. Förutom att barriärens egenskaper urholkas pga förlusten av material kan kolloiderna, om de är stabila, underlätta transporten av sorberade radionuklider ut mot biosfären. Den här studien fokuserar på att undersöka vilka effekter grundvattenkemin har på montmorillonitkolloiders stabilitet. Grundvattnets sammansättning, pH och jonstyrka, kommer sannolikt att förändras under djupförvarets livslängd, delvis pga inträngandet av glactialt smältvatten. Initialt kommer omgivande berg att värmas upp pga värmealstring från det radioaktiva sönderfallet i det utbrända kärnbränslet. Effekterna av pH, jonstyrka och temperatur på montmorillonitkolloiders stabilitet har analyserats genom att följa hur kolloiderna aggregerar med tiden. Minskningen av partikelkoncentration med tiden mättes med Photon Correlation Spectroscopy (PCS). Aggregationsexperimenten visar att, vid ett givet pH och en given temperatur, ökar hastighetskonstanten för aggregation med ökande jonstyrka. Kritiska koaguleringskoncentrationen (CCC) för NaCl och CaCl2 för Na-montmorillonit och Ca-montmorillonit beräknas utifrån ett samband mellan hastighetskonstanterna och jonstyrkan. Hastighetskonstanten för aggregation minskar med ökande pH eftersom ytpotentialen ökar. Effekten blir tydligare vid högre jonstyrkor och högre temperaturer, men kan däremot inte observeras vid låga temperaturer. Temperatureffekten på bentonitkolloidernas stabilitet är pH-beroende. Vid pH≤4 ökar hastighetskonstanten för kolloidaggregation med ökande temperatur, oavsett jonstyrka.Vid pH≥10 minskar hastighetskonstanten med ökande temperatur. I mellanliggande pH-område minskar hastighetskonstanten för aggregation med ökande temperatur, förutom vid den högsta jonstyrkan, där den ökade. Beräkningar baserade på DLVO-teori matchar de experimentella resultaten.
v
List of Papers This licentiate thesis is based on the following papers and manuscripts, which are referred to in the text by their Roman numerals:
I. Kinetic determination of Critical Coagulation Concentrations for Sodium- and Calcium-Montmorillonite colloids in NaCl and CaCl2 aqueous solutions. S. García-García, S. Wold, M. Jonsson. Journal of Colloid and Interface Science (2007). Accepted manuscript, available on line: doi:10.1016/j.jcis.2007.07.002.
II. Temperature effect on the stability of bentonite colloids in water.
S. García-García, M. Jonsson, S. Wold. Journal of Colloid and Interface Science, 298 (2006) 694-705.
III. Effect of pH and temperature on the stability of bentonite colloids.
S. García-García, S. Wold and M. Jonsson. Submitted to Journal of Colloid and Interface Science (2007).
vi

Contents 1. Introduction..................................................................................................................... 1
1.1. Nuclear power in Sweden ........................................................................................ 1 1.2. The Swedish deep repository for spent nuclear fuel................................................ 1 1.3. The bentonite barrier................................................................................................ 4 1.4. The mineral montmorillonite ................................................................................... 5 1.5. Colloid chemistry..................................................................................................... 6
1.5.1. What is a colloid?.............................................................................................. 6 1.5.2. Classification of sols ......................................................................................... 6 1.5.3. Aggregation, sedimentation and redispersion................................................... 6 1.5.4. The electrical double layer................................................................................ 8 1.5.5. Total inter-particle energy................................................................................. 9 1.5.6. Indifferent and non-indifferent electrolytes .................................................... 10 1.5.7. Surface reactions............................................................................................. 11 1.5.8. Colloid transport and deposition..................................................................... 12
1.6. Objectives of this thesis ......................................................................................... 14 2. Materials ....................................................................................................................... 14
2.1. Bentonite ................................................................................................................ 14 2.2. Sodium- and calcium-montmorillonite .................................................................. 15
3. Methods......................................................................................................................... 15 3.1. Colloidal suspensions............................................................................................. 15
3.1.1. Bentonite suspensions..................................................................................... 15 3.1.2. Montmorillonite suspensions .......................................................................... 16 3.1.3. Reference colloids........................................................................................... 16
3.2. Photon Correlation Spectroscopy .......................................................................... 16 3.3. Zeta potential ......................................................................................................... 18 3.4. ICP-OES ................................................................................................................ 18
4. Results and Discussion ................................................................................................. 19 4.1. Method applicability and PCS calibration ............................................................. 19 4.2. Effect of the ionic strength on aggregation kinetics .............................................. 20 4.3. Effect of temperature on taggregation kinetics ...................................................... 27 4.4. Ionic strength, pH and temperature effects on the stability of montmorillonite colloids.......................................................................................................................... 31
5. Concluding remarks ...................................................................................................... 34 6. Acknowledgements....................................................................................................... 35 7. Bibliography ................................................................................................................. 36
vii
1. Introduction
1.1. Nuclear power in Sweden Nuclear fission is widely used to produce electrical energy. Compared with other sources of energy, nuclear power offers advantages such as high energy production per unit weight of fuel, while greenhouse gas emissions are lower than for other non-renewable energy sources. However, the use of nuclear energy is controversial due to the devastating consequences of potential nuclear accidents and the production of dangerous radioactive waste. Therefore, the future of nuclear power is under debate and different countries within the European Community have adopted different policies. In Sweden, 10 operational nuclear reactors currently provide about half the electricity consumed.1 Concerning nuclear waste management, many countries plan to dispose their spent nuclear fuel in 400-700 m deep geological repositories.2 Finland has recently started to build the first underground characterization facility in Europe, expected to become a final deep repository. The decision taken by the Swedish government is to deposit the nuclear waste in deep geological repositories similarly to the Finnish concept. The construction of the Swedish repository is planned to start around 2020.3
1.2. The Swedish deep repository for spent nuclear fuel The spent nuclear fuel is kept in storage pools at the nuclear power station for at least nine months after discharge. During this time, the radioactivity decreases by about 90%. After this initial period, the fuel is transported to the central storage facility for spent fuel (CLAB) where it is stored in pools for 30-40 years to allow the fuel to decay to about 1% of the initial activity. According to the present plans, the fuel will then be encapsulated in copper/steel canisters before final disposal.4,5
The repository will be designed to allow the remaining radioactivity of the spent fuel to decay to the same level as that of natural uranium minerals. During the 100 000 years required to reach this level of radioactivity, the deep geological repository must prevent radionuclides from reaching the biosphere. The Swedish concept (KBS-3), developed by the Swedish Nuclear Fuel and Waste Management Company (SKB), will accomplish the safety conditions by a multi-barrier system consisting of four engineered and natural barriers4 as represented in Figure 1.
1

Figure 1: The KBS-3 concept for disposal of spent nuclear fuel.6
In a multi-barrier system, the different barriers support and complement each other but they are functionally independent of the possible failure of any of the other barriers: - The first barrier is the spent fuel pellets. The spent fuel consists of 95% UO2 and 5% fission products and actinides. In the event of groundwater intrusion due to barrier failure, radionuclides will be released at the rate of UO2 (fuel matrix) dissolution. The dissolution of uranium dioxide is slow under reducing conditions.7 However, the remaining radioactivity of the spent fuel can cause radiolysis of water, producing equal amounts of reducing and oxidizing species. For kinetic reasons the local environment becomes oxidizing and U(IV) can be oxidized to the significantly more soluble U(VI). The kinetics and mechanism of UO2 oxidation by several oxidants has been investigated.8,9 Among the oxidants formed upon radiolysis of water, it has been shown that H2O2 has the highest relative impact (99-100%) under deep repository conditions.10 Hence, H2O2 is the only oxidant that must be accounted for when simulating spent nuclear fuel dissolution. Recent studies show that the rate of radiation-induced spent nuclear fuel matrix dissolution is proportional to the dose rate.11,12 However, it should be noted that noble metal particles composed of fission products catalyze reduction of the oxidized fuel matrix (U(VI)) by H2 (produced from radiolysis and by the anaerobic corrosion of steel).11,13 This process appears to be very efficient. - The second barrier is a corrosion-resistant copper canister provided with a cast iron insert in which the fuel elements will be encapsulated. The copper canister is stable under reducing conditions. However, under oxidizing conditions and low pH, copper dissolves as Cu2+ or forms soluble species such as CuCl+ and CuCl2
-. At alkaline pH and oxidizing conditions the formation of stable passivation films of CuO, Cu2O takes place. If sulphide is present, CuS, Cu2S solids are formed at negative redox potentials independently of the pH.14 Corrosion of the cast iron insert would lead to the formation of iron hydroxides, magnetite and hydrogen gas.15 Radionuclides are expected to adsorb on these corrosion products in the event of canister failure.16
2

- The third barrier is the compacted saturated bentonite that will surround the canisters. It will provide mechanical support for the canisters, holding them in an upright position. When water-saturated, the bentonite barrier has low hydraulic permeability which will reduce the water flow around the canisters. Due to the low hydraulic permeability, the only transport mechanism is diffusion, which will limit the access of corrosive species such as HS- to the canister and will retard escaping radionuclides. The migration of positively charged radionuclides will be further retarded by surface complexation and cation exchange processes in the bentonite matrix. Another beneficial feature is that the plastic consistency of the swollen bentonite will minimize the potential damage caused to the canister by any future seismic rock movements.17
- The crystalline granite host rock is the fourth barrier that ensures stable mechanical and chemical environment to the canisters and where sorption of escaping radionuclides can take place.18 The host rock has to fulfill a number of requirements in order to be suitable for a deep repository. The bedrock should not have any ore potential that could motivate future mining activities. Deformation zones should be avoided, since these zones usually have lower strength and higher permeability. The repository should also be far from major fracture zones.19
The heat released from radioactive decay of the spent nuclear fuel will increase the temperature in the buffer and the surrounding bedrock. The Swedish deep repository will be designed in such a way that the temperature at canister surface will never exceed 100°C20, in order to avoid accelerating mineralogical alteration processes in bentonite that could severely reduce its favourable properties.21Assuming an initial undisturbed bedrock temperature of 15°C and a maximum canister surface temperature of 100°C, the maximum rock wall temperature will be reached after 20 to 50 years of deposition. This maximum rock wall temperature is estimated to range from 35 to 64°C. The restitution of the undisturbed bedrock temperature is expected to take place after 2000 to 8000 years. The maximum temperature reached and the evolution of the temperature in the host rock will depend on a number of parameters such as repository size and geometry, tunnel-canister spacing, rock thermal properties, interim storage time, etc.22
During the lifetime of the repository, the fracture system and the groundwater composition and flow will be affected by climate changes. The potential changes in the climate and the consequences for the repository are difficult to predict. Scandinavia can be expected to experience glacial cycles, during which ice sheets grow and retreat and melt water accumulates and can infiltrate by pore pressure differences generated at both sides of the ice sheet margin. A higher groundwater flow then occurs downwards beneath the ice sheet and upwards beyond the ice sheet margin, displacing the more saline pre-existing groundwaters.23,24
These processes will lead to hydrological changes in permeability, groundwater pressure, groundwater flow, groundwater salinity, pH and oxygen content at repository depths.25
3

1.3. The bentonite barrier The motivation for using bentonite as a buffer material is its high content (65-90%) of the mineral montmorillonite. Montmorillonite has pH buffering capacity and swells in contact with water. These properties will provide a stable physical and chemical environment for the canisters (see Figure 2). When saturated with de-ionized water to a density of 2000±50 kg m-3, compacted bentonite has a swelling pressure of about 104 kPa and a hydraulic conductivity26 of 7·10-14 m s-1. Therefore, the water flow around the canister will be reduced by the buffer barrier, preventing corrosive agents such as sulphide from coming into contact with the canister.27
In addition, montmorillonite has excellent sorption characteristics. In the event of radionuclides being released from a failed canister, the mobility of cationic contaminants will be specially limited, since they will be retarded due to surface complexation and cation exchange reactions.
Figure 2: Deposition chamber with bentonite buffer and canister.6
4

During the initial operating time of the repository, the high ionic strength of deep granitic groundwaters will not lead to significant colloid erosion and stable colloids are not expected. However, these conditions can change along the lifetime of the repository. In the event of melt water intrusion during a glacial cycle, low salinity groundwater can reach the repository at higher flows than at present. The montmorillonite will accumulate water molecules in the interlayer space and swell freely forming a highly hydrated gel of poor consistency expanding into fractures. High water flow would cause the bentonite gel to break apart into particles.28 A significant fraction of these particles would be in the colloidal size range (1-1000 nm) and could easily be carried away by the water flow. The importance of colloid release lies not only in the loss of buffer material but also in the risk of colloid-facilitated radionuclide transport, since most radionuclides will adsorb strongly onto bentonite in the event of canister failure. It is known that the theoretical travel velocity of soluble contaminants in groundwater is very low due to matrix diffusion retardation.29 However, when sorbed to colloids, contaminants have been observed to travel at unexpectedly high rates.30,31
1.4. The mineral montmorillonite Montmorillonite is a layered aluminosilicate mineral from the 2:1 smectite group. Each layer consists of three sheets: an octahedral sheet between two tetrahedral sheets, as illustrated in Figure 3. Aluminium atoms are present at the octahedral sites, coordinating to oxygen and hydroxyl groups, while silicon atoms coordinate to oxygen in the tetrahedral positions. The bonding forces between layers are much weaker than those within sheets. Figure 3: Na-montmorillonite structure. Isomorphous substitution occurs mainly in octahedral sheets, where Al is replaced by Mg or Fe, but substitution of Si by Al in the tetrahedral sheets can also take place. As a consequence, the layers have a permanent negative charge with a charge density of about 0.13 C m-2. The excess of negative charge is compensated for by adsorbed positive ions such as Na+ and Ca2+ between the layers. When montmorillonite comes into contact with water, water molecules occupy the interlayer space and the montmorillonite swells. The
5

extent of swelling depends on the compensating cations. Once the montmorillonite layers have been filled with water molecules, the compensating cations can easily diffuse out and be exchanged by new ions from the solution/liquid phase. This feature is characteristic of many clay minerals. The typical cation exchange capacity in montmorillonite is about 90 meq 100g-1.32
1.5. Colloid chemistry
1.5.1. What is a colloid? A colloidal dispersion is a distribution of small particles of a substance (solid, liquid or gas) in a continuous phase. The size of the particles is in the range 1-1000 nm. A colloid consisting of solid particles dispersed in a liquid medium is called a sol or suspension. Given the small size of the suspended particles, they have high surface area per unit mass. Due to their low mass, colloidal particles are not strongly affected by gravitational force. Most particles in suspension bear a surface charge, which results in repulsive forces between particles, preventing them from agglomerating. Voluminous groups binding or adsorbing to the surface can also prevent particle agglomeration by osmotic and volume restriction effects.33 The combination of a low tendency to agglomerate with negligible gravitational force results in stable colloidal dispersions.
1.5.2. Classification of sols Depending on the affinity of the dry solid for water, colloids are traditionally classified as lyophilic or lyophobic, where the lyophobic colloids have a lower affinity for water. Another common classification used refers to the stabilization mechanism that prevents particles from sticking together, i.e., steric stabilization or electrostatic stabilization.33
The size distribution can be sharp (e.g. poly(vinyl toluene) lattices)34 or broad (e.g. amylopectin)35 and symmetrical or asymmetrical with respect to the mean value, such as poly(vinyl toluene) lattices and AgCl particles respectively.34 Depending on the size distribution, colloids can be classified as monodisperse or polydisperse. Synthetic colloids34 and some inorganic particles, such as titanium dioxide,36 are homogeneous in size, while most of the colloids in natural systems have broad size distributions.37,38,39
1.5.3. Aggregation, sedimentation and redispersion When two particles collide they can form an aggregate. If the particles undergo irreversible aggregation, the colloids have coagulated, while if the aggregates can be redispersed by shaking or changing the conditions in the system, the colloids have
6
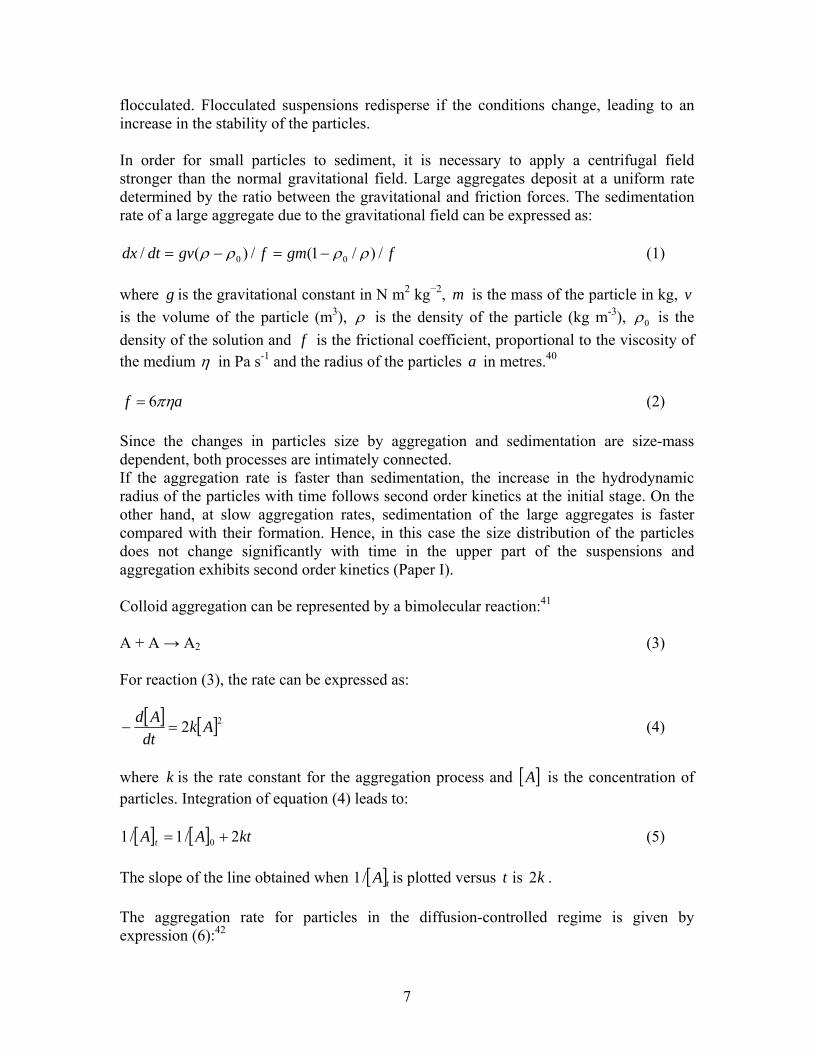
flocculated. Flocculated suspensions redisperse if the conditions change, leading to an increase in the stability of the particles. In order for small particles to sediment, it is necessary to apply a centrifugal field stronger than the normal gravitational field. Large aggregates deposit at a uniform rate determined by the ratio between the gravitational and friction forces. The sedimentation rate of a large aggregate due to the gravitational field can be expressed as:
fgmfgvdtdx /)/1(/)(/ 00 ρρρρ −=−= (1) where g is the gravitational constant in N m2 kg−2, is the mass of the particle in kg, v is the volume of the particle (m
m3), ρ is the density of the particle (kg m-3), 0ρ is the
density of the solution and is the frictional coefficient, proportional to the viscosity of the medium
fη in Pa s-1 and the radius of the particles in metres.a 40
af πη6= (2)
Since the changes in particles size by aggregation and sedimentation are size-mass dependent, both processes are intimately connected. If the aggregation rate is faster than sedimentation, the increase in the hydrodynamic radius of the particles with time follows second order kinetics at the initial stage. On the other hand, at slow aggregation rates, sedimentation of the large aggregates is faster compared with their formation. Hence, in this case the size distribution of the particles does not change significantly with time in the upper part of the suspensions and aggregation exhibits second order kinetics (Paper I). Colloid aggregation can be represented by a bimolecular reaction:41
A + A → A2 (3) For reaction (3), the rate can be expressed as:
[ ] [ ]22 AkdtAd
=− (4)
where is the rate constant for the aggregation process and k [ ]A is the concentration of particles. Integration of equation (4) leads to: [ ] [ ] ktAA t 2/1/1 0 += (5)
The slope of the line obtained when [ ]tA/1 is plotted versus t is . k2 The aggregation rate for particles in the diffusion-controlled regime is given by expression (6):42
7

[ ] [ ]216/ AaDdtAd pπ−= (6)
where is time, is the diffusion coefficient and is the particle radius. The diffusion coefficient, can be defined as:
t pD a
pD
aTkD Bp πη6/= (7) where is the Boltzmann constant, Bk T is temperature and η is the viscosity of the medium. Expression (6) can be rewritten as:
[ ] [ ]23
8/ ATkdtAd B
η−= (8)
where η3
8 TkB is the diffusion-controlled rate constant, which is independent of the radius
and nature of the particles and only depends on the viscosity of the medium. For dilute aqueous suspensions, the diffusion-controlled rate constant for colloidal particles is 6.53·109 l mol-1 s-1.
1.5.4. The electrical double layer In electrostatically stabilized suspensions, the surface charge of a colloidal particle attracts ions of opposite charge (counter-ions) that attach firmly, building the so-called Stern layer. More counter-ions are then attracted in order to neutralize the charged particle but these repel each other and are repelled by the ions in the Stern layer. Therefore, they form a dynamic diffuse layer of counter-ions. The concentration of counter-ions in the diffuse layer gradually decreases with distance from the surface, until it reaches the concentration in the bulk. The Stern layer and diffuse layer constitute the electrical double layer. The thickness of the electrical double layer depends on the type and concentration of the ions in the suspension, the particle surface, temperature, etc. The Debye-Hückel parameter κ is the inverse thickness of the electrical double layer defined as:
2/1
0
022
⎟⎟⎠
⎞⎜⎜⎝
⎛= ∑
Tknze
Br
iii
εεκ (9)
where is the elementary charge, is the ion charge, is the number of ions per cubic metre,
e z 0n
0ε is the permittivity of vacuum, rε is the dielectric constant, is the Boltzmann constant and
BkT is the absolute temperature.
8
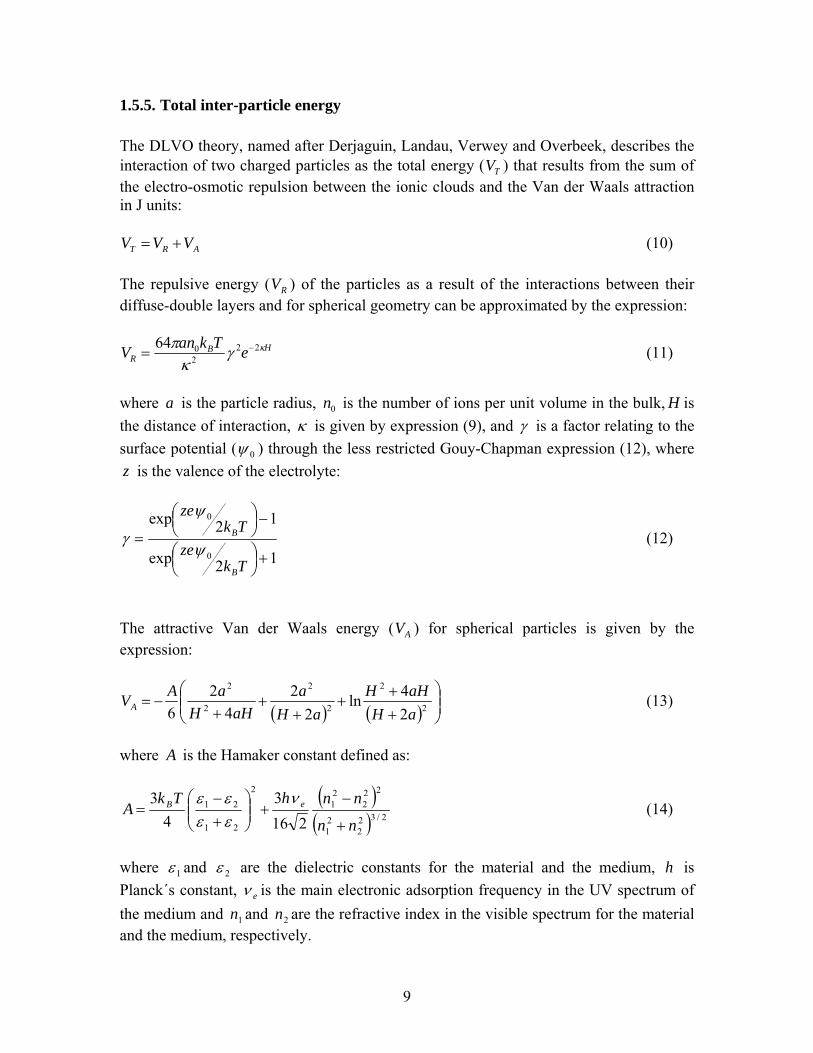
1.5.5. Total inter-particle energy The DLVO theory, named after Derjaguin, Landau, Verwey and Overbeek, describes the interaction of two charged particles as the total energy ( ) that results from the sum of the electro-osmotic repulsion between the ionic clouds and the Van der Waals attraction in J units:
TV
ART VVV += (10)
The repulsive energy ( ) of the particles as a result of the interactions between their diffuse-double layers and for spherical geometry can be approximated by the expression:
RV
HB
R eTkanV κγκ
π 222064 −= (11)
where is the particle radius, is the number of ions per unit volume in the bulk,a 0n H is the distance of interaction, κ is given by expression (9), and γ is a factor relating to the surface potential ( 0ψ ) through the less restricted Gouy-Chapman expression (12), where z is the valence of the electrolyte:
12exp
12exp
0
0
+⎟⎠⎞⎜
⎝⎛
−⎟⎠⎞⎜
⎝⎛
=
Tkze
Tkze
B
B
ψ
ψ
γ (12)
The attractive Van der Waals energy ( ) for spherical particles is given by the expression:
AV
( ) ( ) ⎟⎟⎠
⎞⎜⎜⎝
⎛
++
++
++
−= 2
2
2
2
2
2
24ln
22
42
6 aHaHH
aHa
aHHaAVA (13)
where A is the Hamaker constant defined as:
( )( ) 2/32
221
222
21
2
21
21
2163
43
nn
nnhTkA eB
+
−+⎟⎟
⎠
⎞⎜⎜⎝
⎛+−
=ν
εεεε
(14)
where 1ε and 2ε are the dielectric constants for the material and the medium, is Planck´s constant,
h
eν is the main electronic adsorption frequency in the UV spectrum of the medium and and are the refractive index in the visible spectrum for the material and the medium, respectively.
1n 2n
9
The total energy function displays a maximum at a certain particle distance. The maximum of the total energy function corresponds to the energy that the particles must surmount to aggregate. If the maximum of the total energy is negative, attraction between particles will dominate and the system will be unstable, since every collision between particles will lead to aggregation. On the contrary, if the total energy maximum is positive, only the collisions with enough energy to overcome the energy barrier will form an aggregate. Therefore, the higher the energy barrier, the slower the aggregation process and the more stable the suspension.
TV
The height of the energy barrier depends on the surface potential and the electrolyte concentration. Increasing electrolyte concentration reduces the double layer thickness, as can be deduced from equation (9). The double layer compression reduces the repulsive energy between particles according to equation (11). The electrolyte concentration at which the repulsive energy is equal to the attractive energy is called the critical coagulation concentration, CCC.43 At CCC and higher electrolyte concentrations, colloidal suspensions are unstable. The height of the maximum total energy, which can be compared with the activation energy for particle aggregation, is zero. Therefore every collision between particles forms an aggregate, and the aggregation process takes place in a diffusion-controlled regime.
1.5.6. Indifferent and non-indifferent electrolytes Depending on the interaction with the particle surface, electrolytes are classified as indifferent or non-indifferent electrolytes. Indifferent electrolytes counteract the surface charge of the particles without affecting the surface potential 0ψ of the particles. Increasing concentration of indifferent electrolytes in the medium causes reduction in the stability of the colloidal system by double layer compression. Most 1:1 electrolytes are considered indifferent.41
Ions that neutralize the surface charge by chemical reaction with the surface are called non-indifferent or potential-determining. These ions reduce the stability of the particles by affecting their surface potential.44
Typical potential-determining ions are constituent ions such as Ag+ for AgI particles and Ba2+ in BaSO4. The adsorption of these ions determines the potential of the surface according to the Nernst equation:
[ ] [ ]( PZCAgAgF
RT ++= /ln0 )ψ (15)
where R is the molar gas constant, is the Faraday constant, and F [ ]+Ag [ ]PZCAg + are the concentrations of in solution and at the point of zero charge, PZC. +AgFor metal oxides, H+ and OH- ions are usually called charge-determining ions, since they are not constituent ions and their adsorption does not obey the Nernst law. These ions determine the surface charge of oxides according to ionization reactions at the surface.
10

The amphoteric behaviour of the surface of metal oxides can be represented by the following equilibrium reactions:45
Protonation: S-OH + H+ ⇔ S-OH2
+ (16) Deprotonation: S-OH + OH- ⇔ S-O- + H2O (17) The dependence of the surface potential on pH can be expressed as:
[ ] [ ]( ) ( pHpHF
RTHHF
RTPZCPZC −⋅⋅⎟
⎠⎞
⎜⎝⎛== ++ 3.2/ln0 )ψ (18)
The point of zero charge (PZC) of a suspension corresponds to the pH value or potential-determining electrolyte concentration at which the colloidal particles have no net charge, since the number of positive charges equals the number of negative charges. For colloidal particles carrying different charge contributions (such as montmorillonite particles, which have a permanent charge and a pH-dependent charge at the broken bonds on the edges), the point of zero net charge (PZNC) and the point of zero net proton charge (PZNPC) are defined for each charge contribution respectively.45
1.5.7. Surface reactions The importance of surface reactions in colloidal suspensions lies in the combination of large surface area per unit mass and high surface charge density. Two main adsorption mechanisms can be distinguished: (i) electrostatic adsorption or ion-exchange reactions by outer sphere complexation; and (ii) specific adsorption or surface complexation at amphoteric surface hydroxyl groups forming inner sphere complexes. The permanent charge on montmorillonite particles arising from isomorphous substitutions attracts an excess of cations. Hydrated ions, typically Na+ and Ca2+, compensate for the permanent charge by forming outer-sphere complexes. The actual surface charge is determined by an equilibrium process between the aqueous ions associated with the surface charge and the ions in the bulk. Ion exchange reactions arise as soon as the composition of the medium changes. Some of the ions in the double layer are replaced by the new ions in the bulk in order to re-establish the equilibrium. The ion replacement is determined by the charge of the ions involved and the ability of the ions to interact with the solid phase and be specifically adsorbed. The ion exchange equilibrium can be expressed as:
++ +−⇔−+ ba aBXbAXaBbA (19) where and b stand for the valence of the ions and a A B respectively and X is the cation exchanger. The thermodynamic equilibrium constant is given by:46
11

[ ] [ ][ ] [ ]ba
ab
XABXBAK
−−
= (20)
Ion exchange reactions are fast, reversible and pH-independent if protons are not competing cations. The cation exchange capacity (CEC) of a solid is defined as the amount of charge that can be accommodated, which is a measure of the number of exchangeable ions. In surface complexation reactions, ions with high affinity for the surface react with surface groups forming inner-sphere complexes by covalent binding. This type of reaction is particularly important in metal oxides. The pH strongly determines specific adsorption. Specific adsorption alters the nature of the surface and, thus a shift in the PZC is observed.47
Surface complexation can be described by the following reaction: S-OH + Mm+ ⇔ S-OMm+-1 + H+ (21) The formation of such surface complexes at montmorillonite edges has been proven by spectroscopy studies by Dähn et al. (2002) and Dähn et al. (2003) with Th4+ and Ni2+ respectively.48,49 In general, the adsorption of heavy metals decreases considerably with decreasing pH due to competition with protons for the sorption sites.
1.5.8. Colloid transport and deposition Colloid transport has important environmental repercussions since it is directly linked to contaminant transport. Due to the large surface area of colloidal particles, contaminants show effective adsorption by the surface reactions previously described. If metals and actinides are strongly associated to colloidal particles, their mobility can be significantly enhanced. Particles of clay minerals, iron hydroxides, silica and natural organic matter among others are present in natural aquifers in the colloidal size range and their concentrations are affected by hydrogeochemical perturbations.50
Colloid transport is retarded by particle deposition. Particle sedimentation, attachment to surfaces and filtration are the main deposition mechanisms that prevent colloid transport. Since large particles settle under gravity or filter out, the ability of particles to aggregate influences the deposition rate.
12

Attachment of colloids to rock walls is characterized by a partition coefficient determined as the mass concentration of colloid reversibly attached per unit area [ ] (g cm
aR
rcoll-2) divided by the mass concentration of colloid in the liquid phase (g cm[coll] -3):51
[ ][ ]collcollR r
a = (22)
Both aggregation and the partition coefficient increase with electrolyte concentration. Filtration theory is able to describe deposition in porous and fracture media under favourable conditions, i.e. when attractive forces dominate. However, theory fails to explain the high collision efficiency observed under unfavourable conditions (repulsive interaction). Other discrepancies between theory and experimental observations are the lower sensitivity of colloid to ionic strength and particle size. Surface heterogeneities have been proposed as a possible explanation.52 Figure 4 shows colloid transport in natural fractures.
Figure 4: Colloid transport in natural fractures.
13

1.6. Objectives of this thesis The main objective of this thesis was to assess the individual and combined impact of temperature, pH and ionic strength on the stability of bentonite and montmorillonite colloids by studying their influence on aggregation kinetics.
2. Materials
2.1. Bentonite There are a number of different types of bentonites differing in exchangeable cations, montmorillonite content, number and abundance of accessory minerals etc. The Wyoming form of bentonite (MX-80) is widely used as reference material to investigate different properties of the buffer and backfilling material in the deep repository. The bentonite used in this study is Wyoming MX-80 supplied by the American Colloid Co. The mineral composition of MX-80 is given in Table 1. Table 1: Mineral composition of bentonite Wyoming MX-80.32
Component MX-80
(wt-%) Uncertainty (±
wt-%) Calcite + Siderite 0–1 1
Quartz 3 0.5 Cristobalite 2 0.5
Pyrite 0.07 0.05 Mica 4 1
Gypsum 0.7 0.2 Albite 3 1
Dolomite 0 1 Montmorillonite 87 3
Na- 72% 5 Ca- 18% 5 Mg- 8% 5 K- 2% 1
Anorthoclase 0 1 CEC (meq 100 g-1) 75 2
Organic carbon 0.2 –
14

2.2. Sodium- and calcium-montmorillonite The sodium- and calcium-montmorillonites used in this study (Paper I) were obtained after purifying Wyoming bentonite MX-80 at the laboratory of Clay Technology AB. The purification procedure was as follows: A 10 g portion of MX-80 bentonite was dispersed in 1 l of 1 M analytical grade chloride solution of the desired cation and left to settle. The supernatant was removed and the procedure repeated three times. The material was washed three times with de-ionized water and the supernatant was removed after centrifugation. The clay fraction suspension was separated from the accessory minerals by decanting. In order to remove excess electrolytes, the clay suspension was transferred to dialysis membranes (Spectrapore 3, 3500 MWCO) placed in plastic containers with de-ionized water. The water was changed daily until the electrical conductivity was below 10 μS cm-1. The material was then redispersed in 1 l of 1 M analytical grade chloride, and the process was repeated again. The montmorillonite then was dried at 60oC and milled to an aggregate grain size similar to that of MX-80. The structural formula of the Na-exchanged montmorillonite was determined by ICP-AES element analysis as:32
(Na 0.64 K 0.01)(Al 3.11 Ti 0.01 Fe 3+ 0.36 Mg 0.47)[( Si 7.93 Al 0.07)O20](OH)4 x nH2O (23) and that of the Ca-exchanged form as: (Ca 0.25 Na 0.01 K 0.01)( Al 3.14 Ti 0.01 Fe 3+ 0.37 Mg 0.47 )[(Si 7.93 Al 0.04) O20](OH)4 x nH2O
(24)
3. Methods
3.1. Colloidal suspensions Millipore de-ionized water and analytical grade chemicals were used to prepare all the particle suspensions.
3.1.1. Bentonite suspensions Two different procedures were used to prepare colloidal bentonite suspensions. For one series of experiments, (Paper II), suspensions were prepared from commercial bentonite Wyoming (MX-80) as received from the supplier. One gram of bentonite was dispersed in 250 ml of 10-3 M NaCl or NaClO4 solutions and the suspension was allowed to settle for 24 h. Then 80 ml of the upper colloidal part were collected and used in the experiments. The colloid concentration was determined gravimetrically to be 0.88 ± 0.06 mg ml-1. The pH of the suspensions was measured at approximately 9.
15

In other series of experiments (Paper III), the bentonite was purified from soluble and coarse minerals as follows: (i) 0.3 g of clay was dispersed in 30 ml de-ionized water and centrifuged for two hours at 6000 rpm. (ii) The supernatant solution was decanted off. (iii) The sediment was collected and the clay fraction was separated from the coarser minerals. (iv) The clay fraction was dispersed in 30 ml de-ionized water and centrifuged at 6000 rpm for two hours. The conductance of the rejected supernatant was <80 μS. (v) The sediment was collected and oven-dried at 60°C. A stock colloid suspension of 0.8 g l-1 was prepared from the purified material. The initial pH of the suspension was 8.3±0.1. The pH was adjusted using small volumes of HCl and NaOH. NaOH was used to adjust the pH to 10 and 11. NaOH additions were buffered by bentonite and the pH of the suspensions returned to the initial value. Daily additions of NaOH were necessary for at least two weeks until the pH of the suspensions was stable. Once the basic pH was stable, the acid pH was adjusted to 3, 4 and 6. These values were achieved immediately after adding HCl and were constant so no further additions were necessary. By conductance measurements, the concentration of NaOH was determined in the suspensions with pH 10 and 11. The corresponding amount of NaCl was added to the suspensions with pH 3, 4, 6 and 8.3 in order equal the total ionic strength. The total ionic strengths studied were 0.002, 0.003, 0.005 and 0.0068 M. The pH of the suspension with ionic strength 0.005 M was adjusted to 10 by using the buffer pair NaHCO3/Na2CO3 instead of NaOH for comparison.
3.1.2. Montmorillonite suspensions Sodium- and calcium-montmorillonite purified by Clay Technology AB were used to prepare suspensions of 0.8 g l-1 by ultrasonication of the dry material in deionised water for two hours (Paper I). The pH measured in the suspensions was 8.3 ± 0.1 The ionic strength was adjusted by addition of small volumes of concentrated NaCl and CaCl2 solutions.
3.1.3. Reference colloids Carboxyl and amidine terminated surfactant-free polystyrene latex particles purchased from Interfacial Dynamics Corporation (IDC, Portland, USA) were used as reference colloids. Suspensions were prepared by diluting the stock supplied to particle concentrations in the range 0.38-3.10 mg ml-1 in 10-3 M NaCl or NaClO4 solutions.
3.2. Photon Correlation Spectroscopy Photon correlation spectroscopy (PCS) measures the size of particles in solution in the size range 2-2000 nm by determining the diffusion coefficient. The advantages of this technique are that it is fast, non-invasive and requires a small sample volume.
16
Photon correlation spectroscopy measures the dynamic light scattering (or quasi-elastic light scattering). When a particle is illuminated by the laser beam, the phase of the scattered light depends on its position. The total intensity of the scattered light is the result of all the individual scattered waves. Fluctuations arise in the scattering intensity at a given scattering angle because the phase and polarization of the light scattered by each particle alter over time as the position of the particle changes due to the Brownian motion. The fluctuations with time of the scattered light have a lifetimeτ that is recorded and analyzed using an autocorrelation function. The average product of all the pulses in small time intervals gives the intensity of the autocorrelation function )(τC :
BKDAC T +−= )exp()( 2ττ (25) where and A B are constants, is the translational diffusion coefficient, and TD K is a constant calculated as:
)2/sin()/4( 0 θλπnK = (26) where is the refractive index of the liquid, n 0λ is the wavelength of the laser beam and θ is the scattering angle. Since the diffusion rate of particles is determined by their size, the rate of fluctuation of the scattered light can be used to determine their size. The Stokes-Einstein equation gives the relationship between the hydrodynamic diameter d and the diffusion coefficient : TD
dTkD bT πη3/= (27) where is the Bolztmann constant and bk T is the temperature. The signal of the PCS instrument, given as counts per second, is mainly determined by the number of particles scattered. However, the refractive index and the geometry of the particles can also affect the intensity of the signal. 53
In this study, the PCS instrument used was a 90Plus Particle Sizer supplied by Brookhaven Instruments Corporation. The instrument consists of a He-Ne laser source, a set of optical elements to collimate, focus and polarize the beam, a sample cell placed in a temperature-controlled module, a second set of optical elements to collect the scattered light, an amplifier and a detection system that counts the number of photons occurring in a defined time interval, a correlator that stores the counts and fits the time average calculations in a correlation function and a computer for parameter input and data output.54
17

3.3. Zeta potential The zeta potential is the value of the surface potential ψ at the Stern layer plane where the diffuse electrical double layer of the particle starts. It can be determined from the movement of the charged particles in the presence of an electrical field. Depending on the sign of the charge, the particles move either to the positive or to the negative pole. The velocity of the movement is proportional to the charge of the particle. The electrophoretic mobility, , of the particles can be expressed as: eu
)(32 af
Evue κ
ηεζ ⋅== (28)
where v is the particle velocity, E is the electric field, ζ is the zeta potential in mV, ε is the dielectric constant of the medium, η is the viscosity of the medium, )( af κ is the Henry function, being κ the inverse thickness of the electrical double layer and a the radius of the particles.31
The function )( af κ varies from 1 to 1.5 depending on aκ . For large particles with a thin double layer, where aκ is >> 1 and 5.1)( =af κ , the electric field does not affect the mobility of the particles and equation (28) is called the Smoluchowski equation. In the case of small particles in diluted aqueous solution, aκ <1 and 1)( =af κ , the ions in the double layer surrounding the particle also move due to the electric field but in the opposite direction to the particle, which causes a reduction in particle velocity. Expression (28) is then called the Hückel equation.55
A ZetaPALS Zeta Potential Analyzer supplied by Brookhaven Instruments Corporation was used to determine the zeta potential of the particles. The acronym PALS stands for Phase Analysis Light Scattering. Two electrodes provide an electrical field. The light of laser beam is scattered by the particles. Since the particles are in movement, the Doppler effect of the scattered light is used to calculate the velocity of the particles. Samples of 1.8 ml were collected every 24 hours and changes in the zeta potential of the particles were monitored during periods ranging from one week to one month depending on the stability of the particles.
3.4. ICP-OES Element analysis of the solutions with ionic strength 0.005 M was performed at the Dept. of Geology Stockholm University and Geochemistry using a Varian Vista Ax ICP-OES equipped with a sea spray nebulizer and micro-concentric spray chamber. For each emission line, at least four standards were used for calibration. To check the accuracy and the precision the certified standard SPS-SW1 (Spectrapure Standards AS, Norway) was analyzed on a regular basis. The uncertainty in the analysis was 2.6%.
18
4. Results and Discussion
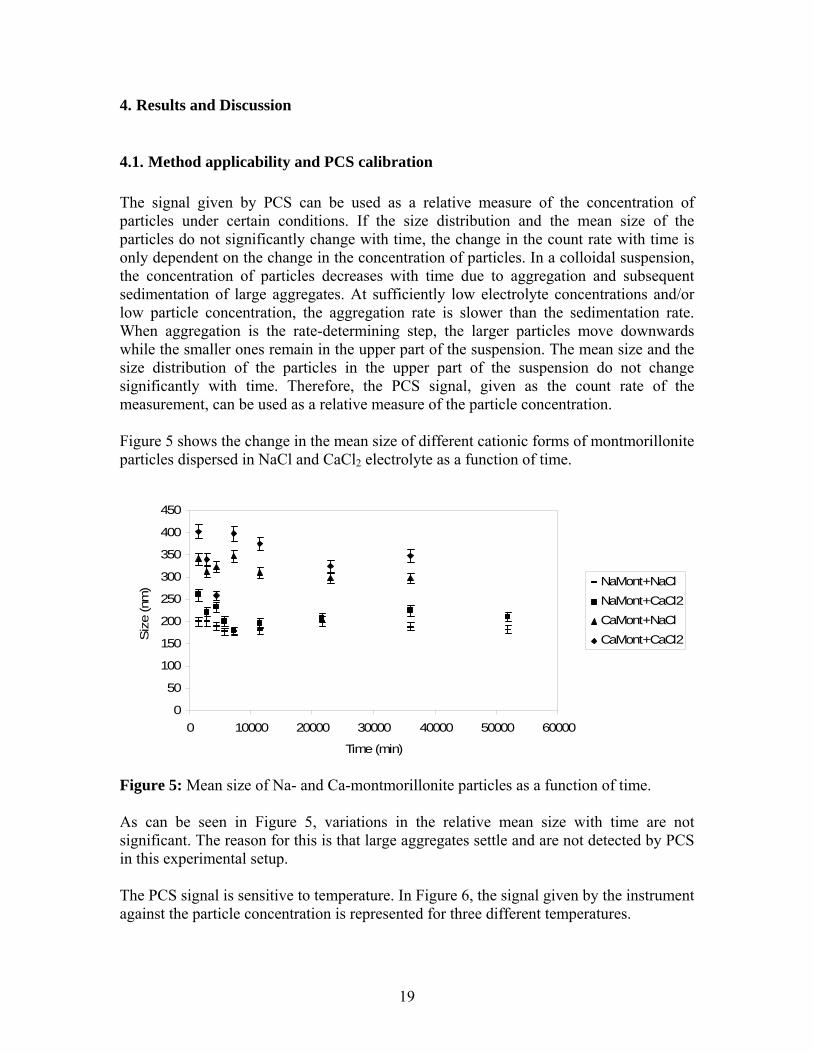
4.1. Method applicability and PCS calibration The signal given by PCS can be used as a relative measure of the concentration of particles under certain conditions. If the size distribution and the mean size of the particles do not significantly change with time, the change in the count rate with time is only dependent on the change in the concentration of particles. In a colloidal suspension, the concentration of particles decreases with time due to aggregation and subsequent sedimentation of large aggregates. At sufficiently low electrolyte concentrations and/or low particle concentration, the aggregation rate is slower than the sedimentation rate. When aggregation is the rate-determining step, the larger particles move downwards while the smaller ones remain in the upper part of the suspension. The mean size and the size distribution of the particles in the upper part of the suspension do not change significantly with time. Therefore, the PCS signal, given as the count rate of the measurement, can be used as a relative measure of the particle concentration. Figure 5 shows the change in the mean size of different cationic forms of montmorillonite particles dispersed in NaCl and CaCl2 electrolyte as a function of time.
0
50
100
150
200
250
300
350
400
450
0 10000 20000 30000 40000 50000 60000
Time (min)
Siz
e (n
m)
NaMont+NaClNaMont+CaCl2CaMont+NaClCaMont+CaCl2
Figure 5: Mean size of Na- and Ca-montmorillonite particles as a function of time. As can be seen in Figure 5, variations in the relative mean size with time are not significant. The reason for this is that large aggregates settle and are not detected by PCS in this experimental setup. The PCS signal is sensitive to temperature. In Figure 6, the signal given by the instrument against the particle concentration is represented for three different temperatures.
19

0
0.2
0.4
0.6
0.8
1
1.2
0 0.2 0.4 0.6 0.8 1 1.2
Concentration mg ml-1
Coun
t Rat
e (M
cps
-1 )
.
Figure 6: Relationship between the PCS count rate and the concentration of bentonite particles at pH 9 and 0°C ( ), 20°C ( ), and 80°C ( ). The count rates were linearly proportional to the concentration of particles for the three temperatures (Figure 6). However, the signal obtained at 80ºC was significantly lower than at 0 and 20ºC for particle concentrations higher than 0.4 mg ml-1. Therefore, calibration of the instrument was necessary and the readings at the highest temperature were normalized by multiplying by the factor of proportionality between 20 and 80ºC.
4.2. Effect of the ionic strength on aggregation kinetics Plotting the inverse of the count rate versus time gave straight lines with correlation factors R2 ≥ 0.9, which indicates that the aggregation of the colloidal particles studied (bentonite, montmorillonite and amidine latex) follows second order kinetics, as expected.41
The aggregation kinetics of Na- and Ca-montmorillonite dispersed in solutions with different concentrations of NaCl or CaCl2 were studied. For example Figure 7 shows the aggregation kinetics of montmorillonite particles at different NaCl concentrations.
20

Na-Montmorillonite in NaCl
00.5
11.5
22.5
33.5
44.5
5
0 10000 20000 30000 40000 50000 60000
Time (min)
1/C
R (M
cps
-1 ) .
3*10-3 M4*10-3 M5*10-3 M6*10-3 M7*10-3 M8*10-3 M9*10-3 M10-2 M
Figure 7: Inverse of the count rate versus time for Na-montmorillonite at different concentrations of NaCl. In Figure 7 it can be observed that increasing electrolyte concentration accelerated aggregation kinetics. Similar results were obtained using CaCl2 as electrolyte. The true second order rate constants were estimated from the second order slopes, expressed in Mcps-1 × min-1 units, by transforming the signal of the PCS instrument, given as count rate, to particle concentration. The number of particles in a suspension can be expressed as:
particleTotal mNm ⋅= (29) where is the mass of montmorillonite in the suspension expressed in g lTotalm -1, is the mass of each colloidal particle and is the number of particles per litre. For the dry mass of montmorillonite present in the experiments the count rate given by PCS can be related to the number of particles and the which was deduced from the density once the volume of the particles was known. The volume of the particles was estimated from the particle size data obtained from PCS assuming spherical geometry and monodisperse suspensions (Paper I). The average diameter of Na-montmorillonite particles was found to be 220 nm, while that of Ca-montmorillonite particles was 380 nm (Figure 5). A density of 1500-1600 kg m
particlemN
TotalmN particlem
-3 for hydrated particles of Na-montmorillonite and 1700-1800 kg m-3 for Ca-montmorillonite reported by Pusch56 was used in the calculations. The experimentally determined second order slopes and the corresponding estimated second order rate constants are summarized in Table 2 for NaCl electrolyte and in Table 3 for CaCl2 electrolyte.
21

Table 2: Second order slopes and second order rate constants for the aggregation kinetics of Na- and Ca-montmorillonite particles at different concentrations of NaCl
Na-montmorillonite Ca-montmorillonite NaCl (M) Slope (Mcps-1
× min-1) × 105k (l × mol-1 ×
s-1) × 10-5Slope (Mcps-1 × min-1) × 105
k (l × mol-1 × s-1) × 10-5
3×10⁻³ 3.2 ± 0.4 0.09 ± 0.01 13 ± 1 4.6 ± 0.4 4×10⁻³ 4.5 ± 0.3 0.118 ± 0.008 16 ± 2 5.7 ± 0.9 5×10⁻³ 4.9 ± 0.2 0.134 ± 0.006 19 ± 2 6.0 ± 0.6 6×10⁻³ 5.4 ± 0.2 0.147 ± 0.006 29 ± 1 8.2 ± 0.3 7×10⁻³ 6.4 ± 0.4 0.172 ± 0.05 40 ± 5 11 ± 1 8×10⁻³ 7.1 ± 0.2 0.194 ± 0.007 50 ± 10 14 ± 3 9×10⁻³ 15.8 ± 0.7 0.43± 0.02 80 ± 20 19 ± 5 1×10⁻² 23.3 ± 0.9 0.63 ± 0.02 90 ± 10 23 ± 3
Table 3: Second order slopes and second order rate constants for the aggregation kinetics of Na- or Ca-montmorillonite particles at different concentrations of CaCl2
Na-montmorillonite Ca-Montmorillonite CaCl2 (M) Slope (Mcps-1
× min-1) × 105k (l × mol-1 ×
s-1) × 10-5Slope (Mcps-1 × min-1) × 105
k (l × mol-1 × s-1) × 10-5
3×10⁻⁴ 4.5± 0.2 0.163 ± 0.009 22.1 ± 0.8 11.2 ± 0.4 4×10⁻⁴ 7.3± 0.4 0.31 ± 0.02 47 ± 2 24 ± 1 5×10⁻⁴ 26 ± 3 0.9 ± 0.1 54 ± 8 27 ± 4 6×10⁻⁴ 37 ± 3 1.3 ± 0.1 103 ± 15 52 ± 8 7×10⁻⁴ 155 ± 48 5 ± 2 166 ± 29 80 ± 14 8×10⁻⁴ 218 ± 39 8 ± 1 197 ± 39 100 ± 20 9×10⁻⁴ 400 ± 132 14 ± 5 276 ± 23 140 ± 9
As can be seen in Tables 2 and 3, the rate constants for aggregation increased with increasing electrolyte concentration for both cationic forms of montmorillonite and electrolytes, as expected. When the data listed in Table 2 and Table 3 were plotted as the logarithm of the second order rate constants versus the square root of the ionic strength of the suspensions, a linear relationship was obtained (Figure 8).
22

y = 16.765x + 2.9556 R 2 = 0.8351
y = 16.043x + 4.7206 R2 = 0.9653
0 1 2 3 4 5 6 7
0 0.02 0.04 0.06 0.08 0.1 0.12
I 1/2
Log
k
Na-MontmorilloniteCa-Montmorillonite
CE a
y = 91.821x + 1.379R 2 = 0.984
y = 49.292x + 4.601R 2 = 0.983
0 1 2 3 4 5 6 7 8
0 0.01 0.02 0.03 0.04 0.05 0.06
I 1/2
Log
k
Na-MontmorilloniteCa-montmorillonite
CE= 0.26 b
Figure 8: Effect of electrolyte concentration on the aggregation kinetics of Na- and Ca-montmorillonite for a) NaCl and b) CaCl2. CE indicates the electrolyte concentration necessary to replace 98% of the exchangeable cations in montmorillonite. In Figure, the ionic strength denoted by CE indicates the electrolyte concentration required to exchange 98% of the calcium in Ca-montmorillonite dispersed in NaCl for sodium (Figure 8a), and the concentration of CaCl2 necessary to replace 98% of the sodium in Na-montmorillonite for calcium (Figure 8b). The CE quantities were calculated from the cation exchange capacity of montmorillonite32 using the equilibrium constants reported by Tang et al.46 for 98% replacement of the exchangeable cations. Since cation exchange is an equilibrium reaction, as the concentration of electrolyte in the medium increases, a larger degree of replacement occurs in the interlayer space. In Figure 8a, the calculated CE lay at electrolyte concentrations lower than the concentrations used in the experiments. Therefore, replacement of calcium by sodium in Ca-montmorillonite can be expected to be complete for the range of NaCl concentrations used in the experiments. Since both materials are Na-montmorillonite, they show the same dependency on the logarithm of the rate constant with the square root of the ionic
23

strength. However, in the experiments performed with CaCl2 (Figure 8b), Na- and Ca-montmorillonite showed different rates of increase in with increasing ionic strength. The calculated CE values lay at CaCl
)log(k2 concentrations much higher than the
concentrations used in the experiments. Thus, cation exchange reactions can be expected to take place in the range of ionic strengths investigated. A larger replacement of sodium by calcium in Na-montmorillonite occurred as the concentration of CaCl2 increased. The zeta potential of montmorillonite at buffer pH and room temperature was independent of electrolyte concentration, but strongly dependent on the cationic form of montmorillonite and the cation of the electrolyte. The average zeta potential values of different electrolyte concentrations are given in Table 4. Table 4: Average values of zeta potential of Na- and Ca-montmorillonite in de-ionized water and NaCl or CaCl2 electrolyte
Deionised water (mV)
NaCl (mV) CaCl2 (mV)
Na-montmorillonite -55 ± 2 -54 ± 9 -25 ± 5 Ca-montmorillonite -18 ± 2 -47 ± 8 -19 ± 4
The valence of the cation adsorbed in the Stern layer strongly determines the zeta potential of the particles. Consequently, the charge of the montmorillonite colloid is completely governed by the electrolyte in the medium. DLVO calculations were performed in order to interpret the experimental results from aggregation kinetics studies. The differences in zeta potential for the pure sodium and pure calcium systems were taken into account when calculating the repulsive, attractive and total energy using equations (9) to (14), assuming the zeta potential values to be proportional to the surface potential of the particles. The maximum values reached by the total energy are plotted against the square root of the ionic strength in Figure 9.
24

y NaCl = -6.494E-18x + 4.470E-18R2 =0.998
yCaCl2 = -8.513E-18x + 2.616E-18
R2 = 0.998
05E-191E-18
1.5E-182E-18
2.5E-183E-18
3.5E-184E-18
4.5E-18
0 0.05 0.1 0.15 0.2
I ½
VT m
ax (J
)
NaClCaCl2
Figure 9: Maximum values of the total energy versus square root of the ionic strength. The solid lines show linear extrapolations of the values calculated at the low ionic strengths inside the square. As can be seen in Figure 9, the height of the total energy function decreased with increasing electrolyte concentration, which is in agreement with the kinetic results. For a limited ionic strength range, such as the ionic strength range investigated experimentally marked by a square in Figure 9, the maximum of the function decreases linearly with the square root of the ionic strength. However, it deviates from linearity for a wider ionic strength range. This explains the linear correlation between the logarithm of the rate constant and the square root of the ionic strength observed for the fairly narrow ionic strength range investigated experimentally (Figure 8a and 8b). Note that the total energy maximum is more sensitive to increasing concentration of CaCl2 than increasing NaCl concentration, which is in agreement with experimental results shown in Figure 8. The linear relationships shown in Figure 8a and 8b allowed CCC to be estimated by extrapolation to diffusion-controlled conditions. The diffusion-controlled rate constant for particle aggregation calculated from equations (6)-(8), 6.53·109 l mol-1 s-1, was inserted into the linear regression for the with )log(k I obtained experimentally for the pure sodium and calcium systems. The ionic strengths obtained in this way correspond to apparent CCC values. However, since log(k) is expected to be linearly related to VT max and VT max is not strictly linearly related to I , the apparent CCC values must be corrected. The correction is performed by identifying the I value at which the VT max value corresponds to the diffusion-controlled limit using DLVO theory. The correction procedure is illustrated in Figure 10 for the case of CaCl2.
25

y = -8.513E-18x + 2.616E-18R2 = 0.998
0
5E-19
1E-18
1.5E-18
2E-18
2.5E-18
0 0.02 0.04 0.06 0.08 0.1 0.12 0.14 0.16 0.18 0.2
I ½
VT m
ax (J
) .
CaCl2
CCCcorrected
CCC apparent
Figure 10: Correction of the CCC value for Ca-montmorillonite in CaCl2 electrolyte. The corrected NaCl CCC for Na-montmorillonite was found to be 0.70 M and the corrected CaCl2 CCC for Ca-montmorillonite 0.0062 M. These CCC values are of the same order of magnitude or higher than the CCC values published in the literature, as can be seen in Table 5. Table 5: Published CCC values for montmorillonite compared with those obtained in the present study (Paper I)
Author (year) Mineral Clay/water (%)
Method CCC (M)
Frey (1978)57 Wyoming 0.025 Test tube series (24h)
0.01-0.15 NaCl
Tombácz (1989)58 Na-Mont 0.2 Visual inspection (24h)
0.25 NaCl 0.002 CaCl2
Tombácz (1989)58 Ca-Mont 0.2 Visual inspection (24h)
0.25 NaCl 0.002 CaCl2
Chheda (1992)59 Na-Mont 0.015 Turbidity and optical density
≈ 0.018 NaCl ≈0.00045 CaCl2
Lagaly (2002)60 Na-Mont 0.025 Visual inspection 0.005 NaCl 0.0004 CaCl2
Lagaly (2002)60 Na-Mont 0.5 Rheological measurements
0.015 NaCl 0.002 CaCl2
Lagaly (2002)60 Na-Mont 1 Rheological measurements
0.020 NaCl 0.003 CaCl2
SKB (2004a)61 Mont Not specified
Not specified 0.1 NaCl 0.001 CaCl2
Paper I Na-Mont 0.08 Aggregation kinetics
0.70±0.05 NaCl
Paper I Ca-Mont 0.08 Aggregation kinetics
0.0062±0.0005 CaCl2
26

The CCC values determined by aggregation kinetics can be expected to be higher, since other experimental methods identify the CCC value with changes in the colloidal system that become significant at aggregation rate constants far below the point where the system begins to be diffusion-controlled. It is interesting to note that under diffusion-controlled conditions, the total energy is still positive, when according to the CCC definition given by DLVO theory the total energy should be zero. Therefore, according to the DLVO theory, the CCC value should correspond to an even higher electrolyte concentration. The difference between the CCC values for NaCl and CaCl2 of two orders of magnitude is mostly due to the differences in zeta potential, size and density between the Na- and Ca-montmorillonite particles. However it would be of interest to use this method to determine CCC values for colloidal systems not affected by cation exchange processes.
4.3. Effect of temperature on aggregation kinetics The effect of temperature on the stability of bentonite colloids at pH≈9 and amidine latex particles dispersed in NaCl or NaClO4 (pH=5.4) was investigated. The second order kinetics for bentonite particles at 20 and 80ºC are shown in Figure 11.
00.20.40.60.8
11.21.41.61.8
0 1000 2000 3000 4000 5000 6000 7000 8000
Time (min)
1/CR
(Mcp
s -1 ) .
Figure 11: Inverse of the count rate as a function of time at 20°C ( ) and 80°C ( ) for bentonite suspensions in 10-3 M NaCl or NaClO4 solutions at pH 9. The second order slopes were the same for 10-3 M NaCl or NaClO4. At 20ºC the second order slopes for both electrolytes were (10.0±0.1) × 10 -5 Mcps-1 × min-1 and at 80ºC the second order slopes were (2.7±0.5) × 10 -5 Mcps-1 × min-1. The faster aggregation kinetics at 20ºC indicates lower stability at 20ºC compared with that at 80ºC. However, the effect of temperature on the stability of amidine latex particles was the opposite to that for bentonite. Increasing temperature had a destabilizing effect on amidine latex colloids dispersed in 10-3 M NaCl or NaClO4 solutions, as can be seen in Figure 12.
27

0
0.1
0.2
0.3
0.4
0.5
0.6
0.7
0 20 40 60 80 100 120 14
Time (min)
1/C
R (M
cps
-1)
0
.
Figure 12: Sedimentation kinetics for amidine latex particles in 10-3 M NaCl or NaClO4 electrolyte at pH 5.7, 20°C ( ) and pH 5.4, 80°C ( ). Suspensions at 20°C were more stable as shown by the second order slope (1.6±0.2·10 -5 Mcps-1 min-1), which was lower than the slope at 80°C (3.7 ±0.5·10 -5 Mcps-1 min-1). The zeta potential of bentonite particles at pH≈9 was independent of temperature and stable with time as can be seen in Figure 13.
-60
-55
-50
-45
-40
-35
-30
0 1000 2000 3000 4000 5000 6000 7000 8000
Time (min)
Zeta
pot
entia
l (m
V)
Figure 13: Zeta potential of bentonite colloids in 10-3 M NaCl or NaClO4 electrolyte at pH 9 as a function of time at 0°C ( ), 20°C ( ), and 80°C ( ). No differences in the zeta potential were observed between NaCl and NaClO4. Table 4 shows that that the charge of the positive counter-ions strongly determined the zeta potential of the particles. Since the cation in both electrolytes was monovalent Na+, the zeta potential of bentonite particles should be the same. If the bulk composition is not
28

changed, the Stern layer does not change and neither does the zeta potential. Therefore, the zeta potential should be constant with time. Increasing temperature had a dramatic effect on the zeta potential of amidine latex particles, as can be seen in Figure 14.
0102030405060708090
0 1000 2000 3000 4000 5000 6000 7000 8000
Time (min)
Zeta
pot
entia
l (m
V)
Figure 14: Zeta potential of amidine latex colloids in 10-3 M NaCl or NaClO4 electrolyte as a function of time at pH 5.7, 20°C ( ), and pH 5.4, 80°C ( ). Amidine latex particles are positively charged, and the Stern layer consists of the negative counter-ions of the electrolyte in solution. No significant differences in zeta potential were observed for the anions Cl- and ClO4
-, since both anions are monovalent. The small influence that the different size of the anions could have on the zeta potentials measurements, is probably of the same magnitude as the error. Increasing temperature induces the deprotonation of amidine head groups NH2
+(NH2).62 Therefore, the zeta potential was less positive at the higher temperature (Figure 14). This is in agreement with the fact that the pH of the suspensions at 80°C was slightly more acid than the pH of the suspensions at 20°C. Note that the zeta potential of amidine particles at 80°C slightly decreased with time, indicating progressive deprotonation of the head groups. The lower zeta potential at 80°C explains the faster aggregation kinetics observed experimentally (Figure 12). When the DLVO theory, equations (9)-(13), was used to analyze the effect of temperature on the stability of bentonite particles, it transpired that the repulsive energy, and in consequence the total energy, increased with increasing temperature, as can be seen in Figure 15.
29

-8E-18
-6E-18
-4E-18
-2E-18
0
2E-18
4E-18
6E-18
8E-18
0 1 2 3 4 5 6 7 8 9 10
Distance (nm)
VR, V
A, V
T (J
)
VA
VT
VR
Figure 15: Calculated energy curves of interaction (in J) as a function of interparticle distance and temperature at pH 9 for bentonite particles in 10-3 M of 1:1 electrolyte. The arrows show the evolution of the potential functions with increasing temperature. These results are in agreement with the aggregation kinetics, where increasing temperature was shown to have a stabilizing effect on bentonite suspensions. As the maximum of the total energy increases with increasing temperature, a smaller fraction of particles overcomes the energy barrier and the aggregation process becomes slower. However, when the effect of temperature on the total energy was investigated for amidine latex, the calculations showed that the total energy decreases with increased temperature (Figure 16).
30

-8E-18
-6E-18
-4E-18
-2E-18
0
2E-18
4E-18
6E-18
8E-18
0 1 2 3 4 5 6 7 8 9 10
Distance (nm)
VR, V
A, V
T (J)
VR 20°C
VT 20°C
VR 80°CVT 80°CVA
Figure 16: Total energy curves of interaction (in J) as a function of distance and temperature for amidine latex particles in 10-3 M of 1:1 electrolyte. The DLVO calculations explained the faster aggregation kinetics of amidine latex suspensions at 80°C compared with 20°C. The reduction in the surface charge by deprotonation of the amidine groups at 80°C drastically reduced the repulsion of the particles. The energy barrier for aggregation was lower at the highest temperature and the particles aggregated faster.
4.4. Ionic strength, pH and temperature effects on the stability of montmorillonite colloids Since the ionic strength, temperature and surface potential were found to affect the total energy and considering that the surface charge of montmorillonite edge groups is pH dependent, the study of the effects of temperature and ionic strength on the stability of montmorillonite colloids was extended to other pH values. The aggregation kinetics for montmorillonite suspensions were studied at pH=3-11. The temperatures investigated were 4, 22 and 70°C and the ionic strength was varied from 0.002 to 0.0068 M NaCl. The second order slopes obtained are presented in Table 6.
31
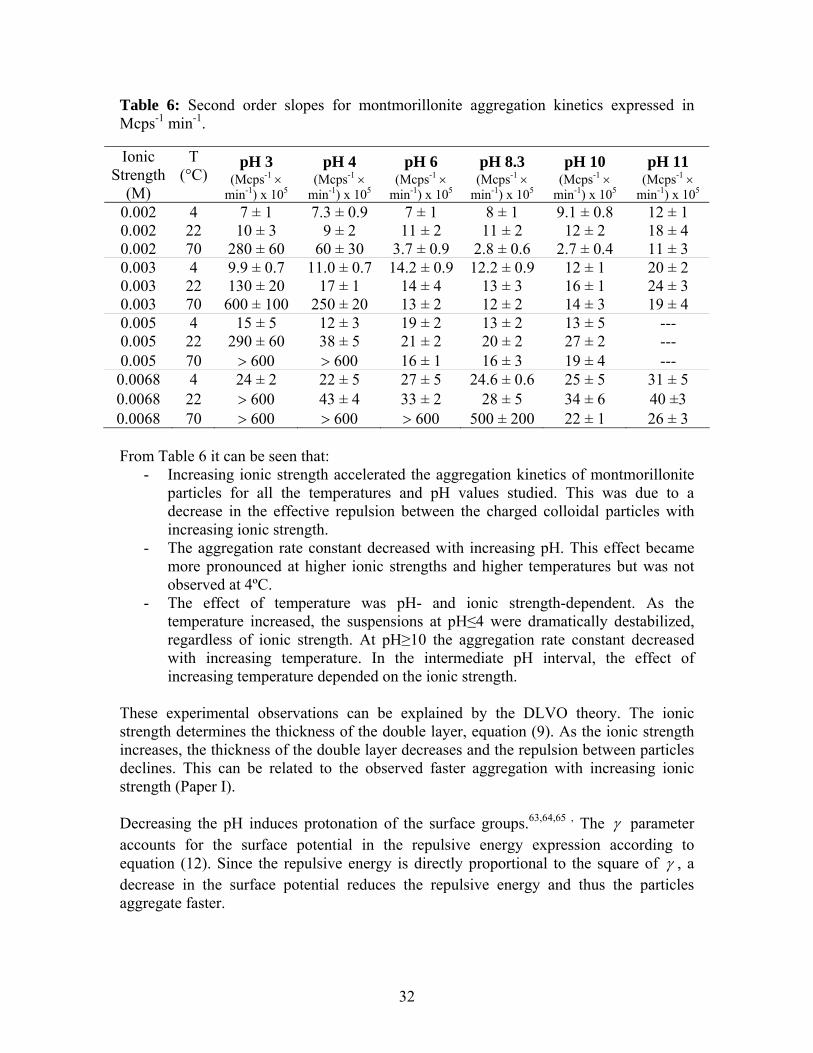
Table 6: Second order slopes for montmorillonite aggregation kinetics expressed in Mcps-1 min-1.
Ionic Strength
(M)
T (°C)
pH 3 pH 4 pH 6 pH 8.3 pH 10 pH 11 (Mcps-1 ×
min-1) x 105(Mcps-1 ×
min-1) x 105(Mcps-1 ×
min-1) x 105(Mcps-1 ×
min-1) x 105(Mcps-1 ×
min-1) x 105(Mcps-1 ×
min-1) x 105
0.002 4 7 ± 1 7.3 ± 0.9 7 ± 1 8 ± 1 9.1 ± 0.8 12 ± 1 0.002 22 10 ± 3 9 ± 2 11 ± 2 11 ± 2 12 ± 2 18 ± 4 0.002 70 280 ± 60 60 ± 30 3.7 ± 0.9 2.8 ± 0.6 2.7 ± 0.4 11 ± 3 0.003 4 9.9 ± 0.7 11.0 ± 0.7 14.2 ± 0.9 12.2 ± 0.9 12 ± 1 20 ± 2 0.003 22 130 ± 20 17 ± 1 14 ± 4 13 ± 3 16 ± 1 24 ± 3 0.003 70 600 ± 100 250 ± 20 13 ± 2 12 ± 2 14 ± 3 19 ± 4 0.005 4 15 ± 5 12 ± 3 19 ± 2 13 ± 2 13 ± 5 --- 0.005 22 290 ± 60 38 ± 5 21 ± 2 20 ± 2 27 ± 2 --- 0.005 70 > 600 > 600 16 ± 1 16 ± 3 19 ± 4 --- 0.0068 4 24 ± 2 22 ± 5 27 ± 5 24.6 ± 0.6 25 ± 5 31 ± 5 0.0068 22 > 600 43 ± 4 33 ± 2 28 ± 5 34 ± 6
40 ±3 0.0068 70 > 600 > 600 > 600 500 ± 200 22 ± 1 26 ± 3
From Table 6 it can be seen that: - Increasing ionic strength accelerated the aggregation kinetics of montmorillonite
particles for all the temperatures and pH values studied. This was due to a decrease in the effective repulsion between the charged colloidal particles with increasing ionic strength.
- The aggregation rate constant decreased with increasing pH. This effect became more pronounced at higher ionic strengths and higher temperatures but was not observed at 4ºC.
- The effect of temperature was pH- and ionic strength-dependent. As the temperature increased, the suspensions at pH≤4 were dramatically destabilized, regardless of ionic strength. At pH≥10 the aggregation rate constant decreased with increasing temperature. In the intermediate pH interval, the effect of increasing temperature depended on the ionic strength.
These experimental observations can be explained by the DLVO theory. The ionic strength determines the thickness of the double layer, equation (9). As the ionic strength increases, the thickness of the double layer decreases and the repulsion between particles declines. This can be related to the observed faster aggregation with increasing ionic strength (Paper I). Decreasing the pH induces protonation of the surface groups.63,64,65 , The γ parameter accounts for the surface potential in the repulsive energy expression according to equation (12). Since the repulsive energy is directly proportional to the square of γ , a decrease in the surface potential reduces the repulsive energy and thus the particles aggregate faster.
32

Increasing the temperature increases the collision frequency and the kinetic energy of the colloidal particles. In general, this leads to faster aggregation as observed at pH≤4 (Table 6). However, the temperature also affects the repulsion between the particles in two opposing ways. In Figure 17, the difference between the calculated maxima of the total energy functions at 22 and 70ºC, i.e. (Vmax
70-Vmax22), is represented as a function of the
absolute value of the surface potential 0ψ .
-2.0E-19
-1.0E-19
0.0E+00
1.0E-19
2.0E-19
3.0E-19
0 100 200 300 400 500 600 700
Surface Potential (mV)
Vm
ax 70
-Vm
ax 22
(J)
0.002 M0.0068 M
Figure 17: Difference of the calculated total energy maxima at 70 and 22ºC as a function of the surface potential for two ionic strengths, 0.002 M and 0.0068 M NaCl. In Figure 17 it can be seen that the direction of the temperature effect depended on the surface potential and that the magnitude of the effect depended on the ionic strength of NaCl. At low surface potentials the repulsion decreased with increasing temperature while at high surface potentials the repulsion increased with increasing temperature. The increase in the repulsion with increasing temperature counteracted the temperature-induced increase in collision frequency. Therefore a stabilization effect was observed with increasing temperature in the suspensions in the intermediate and high pH region (Table 6). The parameter γ decreases with increasing temperature, equation (12). This effect alone would lead to weaker repulsion at higher temperature. However, the magnitude of the temperature effect on γ decreases dramatically with increasing surface potential. The ionic medium contribution to the repulsion (ionic strength-dependent terms) is also temperature-dependent. Contrary toγ , the medium contribution increases with increasing temperature and decreases with increasing ionic strength. The temperature effect on the medium contribution counteracts the effect on the surface charge contribution (γ ). Hence, for low surface potentials (low pH) the temperature effect can mainly be attributed to the effect on the surface charge contribution (γ ) while for higher potentials (high pH) the temperature effect can be attributed to the effect on the ionic medium contribution to the repulsion.
33

5. Concluding remarks The influence of temperature, ionic strength and pH on the stability of several colloidal systems (bentonite, Na- and Ca-montmorillonite and amidine latex) was determined:
• Increasing ionic strength decreased the stability of montmorillonite particles for all the pH and temperatures investigated.
• Montmorillonite suspensions were more sensitive to increasing CaCl2
concentration than NaCl concentration. The CCC value obtained for CaCl2 was two orders of magnitude lower than that for NaCl.
• Increasing pH stabilized montmorillonite suspensions, independently of the ionic
strength and the temperature.
• The pH and ionic strength were proved to be critical parameters influencing the effect of the temperature. In general, at pH≤4 increasing temperature dramatically reduced the stability of montmorillonite suspensions. At pH≥10 increasing temperature stabilized the suspensions. At intermediate pH, the effect of increasing temperature stabilized the suspensions with ionic strength lower than 0.0068 M.
• The DLVO theory provided a qualitative explanation for effects of these
parameters on the stability of the suspensions. This information is important for predicting and modeling bentonite colloid transport for the safety assessment of deep repositories
34

6. Acknowledgements I would like to thank my supervisors Prof. Mats Jonsson and Dr. Susanna Wold for guidance, brilliant ideas and stimulating attitudes. You are the best supervisors that any PhD student could have. I am also grateful to Dr. Ignasi Puigdomenech and Prof. Ivars Neretnieks for illuminating discussions. Thanks to all the former and present workmates from the Nuclear Chemistry and Inorganic Chemistry divisions at KTH for creating a scientific and enjoyable atmosphere at work. I am thankful to SKB for funding my research. My family and friends here and there, thank you for the faith, the good advice and the great interest that you have shown in my work. Special thanks to Victor for the magic touch that has made this thesis and everything else possible, not only from a practical point of view.
35

7. Bibliography [1] www.vattenfall.se. [2] R. Lidskog, A. C. Andersson, “The management of radioactive waste. A description of ten countries”. SKB, 2002. [3] www.skb.se. [4] “Final storage of spent nuclear fuel - KBS-3, I General; II Geology; III Barriers; IV Safety; - Summary”. Swedish Nuclear Fuel Supply Co/Division KBS (SKBF/KBS) 1983 [5] SR 97-post-clossure safety, SKB TR-99-06, Main Report, Vol. I., II. SKB, 1999. [6] “Long-term safety for KBS-3 repositories at Forsmark and Laxemar – a first evaluation Main Report of the SR-Can project”, SKB Technical Report, TR-06-09, 2006. [7] R. L. Segall, R. St. C. Smart, P. S. Turner, “Surface and Near- Surface Chemistry of Oxide Materials”, Materials Science Monographs 47, edited by J. Nowotny and L.-C. Dufour, Elsevier Science Publishers B. V., Amsterdam, 1988. [8] E. Ekeroth, M. Jonsson, “Oxidation of UO2 by radiolytic oxidants” J. Nucl. Mater. 322 (2003) 242-248. [9] M. M. Hossain, E. Ekeroth, M. Jonsson, “Effects of HCO3
- on the kinetics of UO2 oxidation by H2O2 “, J. Nucl. Mater. 358 (2006) 202-208. [10] E. Ekeroth, O. Roth, M. Jonsson, “The relative impact of radiolysis products in radiation induced oxidative dissolution of UO2,” J. Nucl. Mater., 355, (2006) 38-46. [11] F. Nielsen, K. Lundahl, M. Jonsson, ” Simulations of H2O2 concentration profiles in the water surrounding spent nuclear fuel”, J. Nucl. Mater. In press doi:10.1016/j.jnucmat.2007.01.279 [12] M. Jonsson,; F. Nielsen, O. Roth, E. Ekeroth, S. Nilsson, M. M. Hossain, “ Radiation induced spent nuclear fuel dissolution under deep repository conditions”, Environ. Sci. & Technol. in press. [13] S. Nilsson and M. Jonsson, On the Catalytic Effect of Pd(s) on the Reduction of UO2
2+ with H2 in Aqueous Solution. Submitted to J. Nucl. Mater. (2007), doi:10.1016/j.jnucmat.2007.03.040 [14] F. King “Corrosion of copper in alkaline chloride environments”, SKB Technical Report, TR-02-25, 2002.
36

[15] F. El Aamrani, I. Casas, J. de Pablo, L. Duro, M. Grivé, J. Bruno, “Experimental and modeling study of the interaction between Uranium (VI) and magnetite”, SKB Technical Report, TR-99-21, 1999. [16] T. Missana, M. García-Gutiérrez, and V Fernández, Uranium (VI) sorption on colloidal magnetite under anoxic environment: Experimental study and surface complexation modeling, Geochimica et Cosmochimica Acta, Volume 67, Issue 14, 15 July 2003, Pages 2543-2550. [17] L. Börgesson, J. Hernelind, “Earthquake induced rock shear through a deposition hole. Influence of shear plane inclination and location as well as buffer properties on the damage caused to the canister”, SKB Technical Report, TR-06-43, 2006. [18] P. Vejmelka, Th. Fanghaenel, B. Kienzler, E. Korthaus, J. Römer, W. Schüssler, R. Artinger. “Sorption and migration of radionuclides in granite (HRL Äspö, Sweden)”, FZKA 6488, 2000. [19] J. Andersson, A. Ström, C. Svemar, K-E. Almén, L. O. Ericsson, “What requirements does the KBS-3 repository make on the host rock? Geoscientific suitability indicators and criteria for siting and site evaluation”, SKB Technical Report, TR-00-12, 2000. [20] H. Hökmark, B. Fälth, “Thermal dimensioning of the deep repository. Influence of canister spacing, canister power, rock thermal properties and nearfield design on the maximum canister surface temperature”, SKB Technical Report, TR-03-09, 2003. [21] O. Karnland, M. Birgersson, “Montmorillonite stability. With special respect to KBS-3 conditions”, SKB Technical Report, TR-06-11, 2006. [22] H. Hökmark, J. Claesson, “Use of an analytical solution for calculating temperatures in repository host rock”, Engineering Geology, 81 (2005) 353-364. [23] L. F. Auqué, M. J. Gimeno, J. B. Gómez, I. Puigdomenech, J. Smellie, E-L. Tullborg, “Groundwater chemistry around a repository for spent nuclear fuel over a glacial cycle. Evaluation for SR-Can”, SKB Technical Report, TR-06-31, 2006. [24] G. S. Boulton, P. E. Caban, K. van Gijssel, “Groundwater flow beneath ice sheets: Part I — Large scale patterns”, Quaternary Science Reviews, 14 (1995) 545-562. [25] I. Puigdomenech, “Hydrochemical stability of groundwaters surrounding a spent nuclear fuel repository in a 100000 year perspective”, SKB Technical Report, TR-01-28, 2001. [26] O. Karnland, T. Sandén, L.-E. Johannesson, T. E. Eriksen, M. Jansson, S. Wold, K. Pedersen, M. Motamedi, B. Rosborg; “Long term test of buffer material. Final Report on the pilot parcels”, SKB Technical Report, TR-00-22, 2000.
37

[27] I. Neretnieks; “Flow and transport through a damaged buffer- exploration of the impact of a cemented and an eroded buffer”, SKB Technical Report, TR-06-33, 2006. [28] I. Neretnieks, J. Liu; “Physical and chemical stability of the bentonite buffer”, R-06-103, SKB, 2006. [29] I. Neretnieks, “Diffusion in the rock matrix: an important factor in radionuclide retardation?”, J. Geophys. Res. 85 B8, (1980) 4379–4397. [30] A. Kersting, D. Efurd, D. Finnegan, D. Rokop, D. Smith, J. Thompson, “Migration of plutonium in ground water at the Nevada Test Site” Nature, 397 (1999) 56-59. [31] W. M. Miller, W. R. Alexander, N. A. Chapman, I. G. McKinley, J. A. T. Smellie, Geological Diposal of Radioactive Wastes and Natural Analogues. Waste Management Series, vol. 2, Pergamon, Amsterdam, 2000. [32] O. Karnland, S. Olsson, U. Nilsson, P. Sellin, “Mineralogy and sealing properties of various bentonites and smectite-rich clay materials”, SKB Technical Report, TR-06-30, 2006. [33] R. J. Hunter, “Introduction to modern colloid science”, Oxford Science Publications, 1993. [34] P. Bagchi, B. V. Gray and S. M. Birnbaum, “Preparation of model poly(vinyl toluene) latices and characterization of their surface charge by titration and electrophoresis”, J. Coll. Interface Sci., 69 (1979) 502-528. [35] M. L. Fishman, P. Cooke, B. White and W. Damert, “Size distributions of amylose and amylopectin solubilized from corn starch granules”, Carbohydr. Polym., 26 (1995) 245-253. [36] E. Matijevi, M. Budnik and L. Meites, ” Preparation and mechanism of formation of titanium dioxide hydrosols of narrow size distribution” J. Coll. Interface Sci., 61 (1977) 302-311. [37] Y. Ran, J. M. Fu, G. Y. Sheng, R. Beckett and B. T. Hart, “Fractionation and composition of colloidal and suspended particulate materials in rivers” Chemosphere, 41 (2000) 33-43. [38] M. Plaschke, T. Schäfer, T. Brundschuh, T. Ngo Manh, R. Knopp, H. Geckeis and J. I.Kim, “Size Characterization of Bentonite Colloids by Different Methods” Anal. Chem., 73 (2001) 4338-4347.
38

[39] A. Cadene , S. Durand-Vidal, P. Turq, J. Brendle, “Study of individual Na-montmorillonite particles size, morphology, and apparent charge”, J. Coll. Interface Sci., 285 (2005) 719-730. [40] George Scatchard, “Equilibrium in solutions. Surface and Colloid Chemistry”, p.260-261, Harvard University Press, 1976. [41] H. Stechemesser, B. Dobiáš, “Coagulation and Flocculation”, 2nd edition, Surfactant Science Series vol. 126, CRC Press Taylor and Francis, 2005, p.81-88. [42] J. Lyklema, “Fundamentals of Interface and Colloid Science”, Vol. IV, Elsevier academic press, 2005. [43] P.C. Hiemenz, “Principles of colloid and surface chemistry”, 2nd ed. Marcel Dekker, inc. New York, 1986. [44] E. D. Shchukin, A. V. Pertsov, E. A. Amelina and A. S. Zelenev, “Colloid and Surface Chemistry”, Studies in Interface Science, vol. 12, Elsevier, 2001, p.214. [45] Jozsef Toth, “Adsorption: Theory, Modeling and Analysis”, Marcel Dekker Incorporated, 2002, p.722-723. [46] L. Tang, D. L. Sparks, “Cation-exchange kinetics on montmorillonite using pressure-jump relaxation”, Soil Sci. Soc. Am. J., 57 (1993) 42- 46. [47] Gary W. vanLoon, Stephen J. Duffy, “Environmental Chemistry, a global perspective”, Oxford university press, 2000, p. 284-302. [48] R. Dähn, A. Scheidegger, A. Manceau, E. Curti, B. Baeyens, M.H. Bradbury and D. Chateigner, “Th uptake on montmorillonite: A powder and polarized extended X-ray absorption fine structure (EXAFS) study”, J. Coll. Inter. Sci., 249 (2002) 8–21 [49] R. Dähn, A.M. Scheidegger, A. Manceau, M. Schlegel, B. Baeyens, M.H. Bradbury and D. Chateigner, “Structural evidence for the sorption of Ni(II) atoms on the edges of montmorillonite clay minerals: A polarised X-ray absorption fine structure study”, Geochim. Cosmochim. Acta, 67 (2003) 1–15. [50] J. F. McCarthy, C. Degueldre, “Sampling and Characterization of Colloids and Particles in Groundwater for Studying Their Role in Contaminant Transport,” Environmental Particles, Vol.2, J. Buffle and H. P. van Leeuwen (Eds.), Lewis Publisers, Boca Raton, FL, 1993 p. 247-315. [51] C. Degueldre, R. Grauer, A. Laube, “Colloid properties in granitic groundwater systems. II: Stability and transport study”, Applied Geochemistry, 11 (1996) 697-710.
39

[52] J.N. Ryan, M. Elimelech, “Colloid mobilization and transport in groundwater”, Colloids Surfaces A: Physicochemical Eng. Aspects 107 (1996) 1-56. [53] A. Ledin, S. Karlsson, A. Düker, B. Allard, “Applicability of photon correlation spectroscopy for measurement of concentration and size distribution of colloids in natural waters”, Anal. Chim. Acta, 281 (1993) 421-428. [54] Xu, Renliang. “Particle Characterization: Light Scattering Methods”, Hingham, MA, USA: Kluwer Academic Publishers, 2000. p 223-269. [55] Robert D. Vold, Marjorie J. Vold, “Colloid and Interface Chemistry”, Addison Wesley Publishing Company, 1983 [56] R. Pusch, “Experimental study of the effect of high porewater salinity on the physical properties of a natural smectitic clay”, SKB Technical Report, TR-01-07, (2001). [57] E. Frey and G. Lagaly, “Selective coagulation in mixed colloidal suspensions”, J. Coll Interface Sci., 70 (1978) 1. [58] E. Tombácz, J. Balázs, J. Lakatos and F. Szántó, “Influence of the exchangeable cations on stability and rheological properties of montmorillonite suspensions“, Colloid Polym. Sci., 267 (1989) 1016-1025 [59] P. Chheda, D. Grasso and C. J. van Oss, “Impact of ozone on stability of montmorillonite suspensions”, J. Coll. Interface Sci., 153 1 (1992) 226-236. [60] G. Lagaly and S. Ziesmer, “Colloid chemistry of clay minerals: the coagulation of montmorillonite dispersions”, Advances Coll. Interface Sci., 100-102 (2003) 105-128. [61] SKB, 2004a. Interim initial state report for the safety assessment SR-Can. SKB Report R-04-35, 2004. [62] A. Homola, R. O. James, “Preparation and characterization of amphoteric polystyrene lattices”, J. Coll. Interface Sci., 59(1) (1977) 123-34 . [63] M. J. Avena, C. P. De Pauli, “Proton Adsorption and Electrokinetics of an Argentinean Montmorillonite”, J. Coll. Interface Sci., 202 (1998) 195-204. [64] A. M. L. Kraepiel, K. Keller, F. M. M. Morel, “A Model for Metal Adsorption on Montmorillonite”, J. Coll. Interface Sci., 210 (1999) 43-54. [65] E. Tombácz. I. Ábrahám, M. Gilde, F. Szántó, “The pH-dependent colloidal stability of aqueous montmorillonite suspensions”, Coll. and Surfaces, 49 (1990) 71-80.
40