the impact of the source of stem cells: … · the impact of the source of stem cells:...
TRANSCRIPT

The impact of the source of stem cells:
Bone marrow versus Peripheral Blood
NC Gorin
EBMT 2011

0
20
40
60
80
100
90 92 94 96 98 00 02 04 06 08
%
auto PB
allo PB
cord
EBMT Activity Survey on HSCT 1990-2008
changes in stem cell source
2008: final data
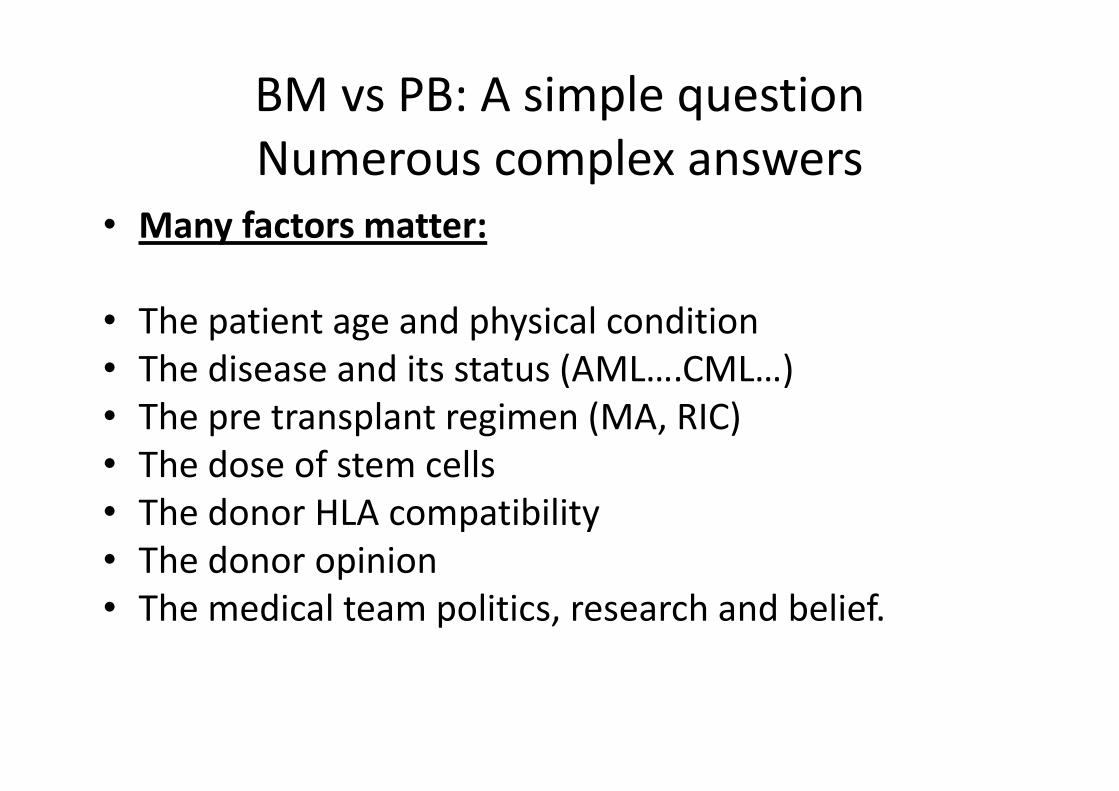
BM vs PB: A simple question
Numerous complex answers
• Many factors matter:
• The patient age and physical condition
• The disease and its status (AML….CML…)
• The pre transplant regimen (MA, RIC)
• The dose of stem cells
• The donor HLA compatibility
• The donor opinion
• The medical team politics, research and belief.

Allogeneic stem cell transplantation
HLA identical siblings
• 1-Randomized studies
• 2-Retrospective studies: yes they are useful

Is mobilized peripheral blood comparable with bone marrow as a
source of hematopoietic stem cells for allogeneic transplantation
from HLA-identical sibling donors? A case-control study
David Gallardo, E Carreras
GvHD/Immunotherapy Committee of the Spanish Group of Hematopoietic Stem Cell Transplantation (GETH: Grupo Español
de Trasplante Hemopoyético)
Haematologica 2009


Overall survival

QUALITY OF LIFE
Function
score
BM PB P
Physical
function
92.7 88.1 0.078
Role function 92.5 80.3 0.002
Social
function
87.7 76.6 0.019
Financial
difficulties
11.8 32 <0.001
David Gallardo et al 2009

Conclusion
• Patients receiving PBSC have a higher incidence of
acute and chronic GvHD and worse social and role
functioning indicators after quality of life
assessment.
• Peripheral blood can not be considered equal to
or better than bone marrow for an important
proportion of patients.
D Gallardo GETH Haematologica 2009

Stem Cell Trialists' Collaborative Group, JCO 2010:23, 5074-5087
Summary of Randomized Clinical Trials
Principal Investigator No. Patient characteristics
Schmitz et al, 2002 350 AML or ALL (1st or 2nd remission, incipient relapse),
CML (chronic or accelerate phase),
MDS (no RAEBT)
Couban et al, 2002 228 CML (chronic or accelerate phase),
AML (remission) or MDS
Bensinger et al, 2003 176 Various hematologic malignances
Blaise et al, 2000 101 ALL, AML and CML (1st chronic phase)
Further studies
Saudi Arabia (unpublished) 83
Heldal et al, 2000 61
Morton et al, 2001 57
Vigorito et al, 1998 56
Powels et al, 2000 39
Mahmoud et al, 1999 30

Allogeneic peripheral blood stem cell vs. bone
marrow transplantation in the management of
hematological malignancies:
an individual patient data meta-analysis
of 9 randomized trials and 1,111 patients
Stem Cell Trialists' Collaborative Group
J Clin Oncol 2005; 23: 5074-87

Effect on acute GVHD
Chi2 Statistic: 1.60P = 0.20590Abs Diff at100 days = 3.21%
36.41%
39.8%
38.33%
41.55%
100
90
80
70
60
50
40
30
20
10
0Proportion of patients that developed acute GVHD (%)
0 20 40 60 80 100Days
PBSCT
BMT__
Time to acute GVHD (grade II-IV)
Individual patient-data meta-analysis of allogeneic PBSCT vs. BMT transplant
Events/Person-days:PBSCT : 10/4150 49/3844 60/3216 39/2631 20/2240 12/2065BMT__ : 8/4320 34/4064 56/3418 35/2800 29/2388 12/2183

Effect on chronic GVHD
Chi2 Statistic: 23.34P = 0.00000Abs Diff at5 yrs = 14.92%
35.69%
50.61%
39.96%
58.79%
100
90
80
70
60
50
40
30
20
10
0Proportion developing chronic GVHD (%)
0 1 2 3 4 5 6Years
PBSCT
BMT__
Time to chronic GVHD (extensive stage)
Individual patient-data meta-analysis of allogeneic PBSCT vs. BMT transplant
Events/Person-years:PBSCT : 159/325.72 12/126.20 5/99.81 5/63.48 0/40.63 4/23.19BMT__ : 101/344.25 9/171.96 5/142.56 1/76.68 2/40.85 2/25.46
From day +100

Relapse in “unfavorable” prognostic category
Chi2 Statistic: 5.23P = 0.02220Abs Diff at5 yrs = 14.12%
43.51%
57.63%
43.51%
57.63%
100
90
80
70
60
50
40
30
20
10
0Proportion of patients suffering from relapse (%)
0 1 2 3 4 5 6Years
PBSCT
BMT__
Probability of relapse ('poor' prognosis)
Individual patient-data meta-analysis of allogeneic PBSCT vs. BMT transplant
Relapse/Person-years:PBSCT : 29/99.22 6/67.85 2/55.08 3/36.00 2/25.34 0/13.32BMT__ : 37/81.37 6/44.72 5/33.56 1/20.19 1/8.81 0/3.45

Survival in “favorable” prognostic category
Chi2 Statistic: 0.05P = 0.82306Abs Diff at5 yrs = 1.38%
65.26%
63.88%
63.82%
61.59%
0102030405060708090100
Survival (%
)
0 1 2 3 4 5 6Years
PBSCT
BMT__
Survival in patients with 'good' prognosis
Individual patient-data meta-analysis of allogeneic PBSCT vs. BMT transplant
Deaths/Person-years:PBSCT : 84/344.60 30/276.88 9/232.87 2/133.45 3/74.56 0/35.23BMT__ : 91/354.93 29/283.69 7/240.85 3/122.86 1/64.77 2/33.85
Think of the QOL
Prefer BM?

Survival in “unfavorable” prognostic category
Chi2 Statistic: 6.70P = 0.00964Abs Diff at5 yrs = 10.16%
39.45%
29.29%
39.45%
29.29%
0102030405060708090100
Survival (%
)
0 1 2 3 4 5 6Years
PBSCT
BMT__
Survival in patients with 'poor' prognosis
Individual patient-data meta-analysis of allogeneic PBSCT vs. BMT transplant
Deaths/Person-years:PBSCT : 55/106.35 12/72.56 4/59.60 3/42.39 2/28.24 0/13.48BMT__ : 74/91.79 16/50.53 3/37.88 0/21.98 1/13.04 0/5.63
Prefer PB

A Phase III, Randomised, Multicentre Trial Comparing
Allogeneic Filgrastim-Mobilised Peripheral Blood Progenitor Cell
Transplantation (PBPCT) with
Allogeneic Bone Marrow Transplantation (BMT) in Patients with Acute
Leukaemia, Chronic Myelogenous Leukaemia or Myelodysplastic
Syndrome
Norbert Schmitz, Meral Beksac, Dirk Hasenclever, Andrea Bacigalupo, Tapani Ruutu, Arnon
Nagler, Eliane Gluckman, Nigel Russell, Jane F. Apperley, Norbert C. Gorin, Jeff Szer, Ken
Bradstock, Agnes Buzyn, Peter Clark, Keith Borkett, and Alois Gratwohl
Blood 2002; 100: 761 - 767

Study Schema - Donor
Filgrastim 10µg/kg/day
Leukapheresis D5 (6, 7)
Bone-marrow
HLA-Identical Sibling Donor
Age 16-60 PBPC
Harvest
R

Patient Flow
PatientsRandomised
350BMT PBPCT
Donor
Harvest RECIPIENT
Conditioning
Transplanted
Alive End of Study
Alive Last Follow-up
176
Donor
Harvest
174
166
166
149
119
163
163
140
113

Recipient Characteristics
BMT PBPCT
N 166 163
Age (Median, years) 37 39
ALL 31 (19%) 24 (15%)
AML 56 (34%) 61 (37%)
CML 74 (44%) 73 (45%)
MDS 5 (3%) 5 (3%)

Maximum Acute GvHD
0
5
10
15
20
25
30
35
40
Percentage of Patients
0 I II III IV
Max acute GvHD
BMT
PBPCT
p = 0.009

Overall Chronic GvHD
0
10
20
30
40
50
60
Percentage of Patients
6 9 12 24 36
Months Since Transplant
BMT
PBPCT

Overall Survival
0.0
0.1
0.2
0.3
0.4
0.5
0.6
0.7
0.8
0.9
1.0
0 6 12 18 24 30 36Months since transplant
Probability of survival
BMT
PBPCT
HR = 1.15 P = 0.47

Long-term outcome and late effects in patients transplanted
with mobilised blood or bone marrow: a randomised trial
B Friedrichs, N Schmitz et al.
Lancet Oncol 2010; 11: 331–38
8 YEARS LATER !!!

GvHD and Immunosuppression
p = 0.035
BMT PBPCT
Proportion of patients with GvHD
Hazard Ratio 1.40
95% CI 1.07-1.8
0 2 4 6 8 10 12
Years post TX
* Other than CSA
total p-value
Information available 75 68 142 n.s.
Patients with cGvHD 52.7% 71.2% 61.6% 0.03
Extensive cGvHD 30.4% 56.3% 0.002
Patients with additional IS* 8.0% (6/75) 17.8% (13/68) 14.1% (19/142) 0.09
Patients on IS 5 yrs. post TX 10.6% (10/75) 29.4% (20/68) 21.1% (30/142) 0.01
BMT
PBPCT

Survival
10-year estimate
56.5% BMT
49.1% PBPCT
p log rank = 0.27
(HR 0.83; CI 95% 0.60-1.15 )
Overall survival Leukemia-free survival
BMT n = 166
PBPCT n = 163
10-year estimate
45.8% BMT
42.3% PBPCT
p log rank = 0.4
(HR 0.88; CI 95% 0.65-1.12 )

LFS - subgroup analysis
10-year LFS estimate
BM 28.1%
PB 13.0%
(p = 0.13)
10-year LFS estimate
BM 62.3%
PB 47.1%
(p = 0.16)
10-year LFS estimate
BM 40.8%
PB 47.5 %
(p = 0.6)

Remaining issues
All randomized studies have been done in HLA
identical siblings transplants
What about:
younger adults
Aplastic anemias
The doses of cells infused
Unrelated donors
RIC transplants

Eapen et al., JCO 2004; 22:4872
Overall survival after alloBMT vs PBSCT
in children and adolescents

Schrezenmeier et al., Blood 2007 110: 1397-1400
Severe aplastic anemia after PBPC and BM Transplantation
Overall Survival

Marrow versus peripheral blood for geno identical allogeneic stem cell
transplantation in acute myelocytic leukaemia: influence of the dose and the
source of stem cells: better outcome with rich marrow
EBMT retrospective study
NC Gorin, M Labopin, P Zikos, W Arcese, M Beksac, E
Gluckman, O Ringden, T Ruutu, J Reiffers, G Bandini,
M Falda, R Willemze, V Rocha, F Frassoni
Blood 2003

Outcome: BM vs PB
Outcome (%) BM PB
TRM 22 ± 2 22 ± 2
RI 19 ± 2 22 ± 3
LFS 63 ± 2 61 ± 3
OS 66 ± 2 66 ± 3

Copyright ©2003 American Society of Hematology. Copyright restrictions may apply.
Gorin, N. C. et al. Blood 2003;102:3043-3051
Figure 3. RI of patients receiving transplants with high-dose BM, low-dose BM, or PB

Copyright ©2003 American Society of Hematology. Copyright restrictions may apply.
Gorin, N. C. et al. Blood 2003;102:3043-3051
Figure 1. LFS of patients receiving transplants with high-dose BM, low-dose BM, or PB

Copyright ©2003 American Society of Hematology. Copyright restrictions may apply.
Gorin, N. C. et al. Blood 2003;102:3043-3051
Figure 4. OS of patients receiving transplants with high-dose BM, low-dose BM, or PB

96847260483624120
1.0
.8
.6
.4
.2
0.0
<1.62 x 10⁸/kg 41±5%
1.63-2.4 x 10⁸/kg
months
P (log rank) <0.0001
Leukemia Free Survival according to bone marrow cell dose
2.41-2.93 x 10⁸/kg 59±5%
>3.93 x 10⁸/kg 67±3%
50±5%
V Rocha, M labopin et al EBMT)

CONCLUSION
2003:
Patients with AML allografted in first
remission, have a better outcome with
marrow as compared to PB, when the dose of
marrow infused is rich.
2011:
Nobody really cares

Extensive chronic GvHD after allogeneic transplantation
from unrelated donors
Remberger M , Ringden O et al., BLOOD 2005; 105:548
EXTENSIVE cGVHD

REDUCED INTENSITY
CONDITIONING
The European Group for Blood and Marrow Transplantation
Mobilized Peripheral Blood Stem Cells (PBSC)
Compared with Bone Marrow (BM) as the Stem cell
Source for HLA Identical Sibling Allogeneic
Transplantation with Reduced Intensity Conditioning
(RIC-alloSCT) in Patients with Acute Myeloid Leukemia
(AML) in Complete Remission:
A Retrospective Analysis From the ALWP of EBMT
A. Nagler, M. Labopin, A. Shimoni, G. Mufti, J.J. Cornelissen, D. Blaise, J.J.W.M. Janssen, N. Milpied, L. Vindelov, E. Petersen, J. Gribben, A. Bacigalupo, C. Malm, D. Niederwieser, G. Socie, R. Arnold, P. Brown,
H. Goker, M. Mohty, V. Rocha
On behalf of the Acute Leukemia Working Party EBMT

The European Group for Blood and Marrow Transplantation
0 1 2 3 4 5
0.0
0.2
0.4
0.6
0.8
1.0
RIC in sib. SCT for AML in remission:
Cumulative Incidence of relapse
years
32 ± 1%
38± 6%
PB n=1430
BM n=107
P Gray=0.66

The European Group for Blood and Marrow Transplantation
RIC in sib. SCT for AML in remission:
Leukemia Free Survival
years
51 ± 2%
50 ± 6%
PB n=1430
BM n=107
P Gray=0.86

The European Group for Blood and Marrow Transplantation
A first rapid (and yet incomplete)
conclusion
� BM and PB give equivalent outcomes
� PB is easier to collect and kinetics of
engraftment are more rapid
� We adressed the question of the graft
compositionIIIIII..

RESULTS OF GENOIDENTICAL HEMOPOIETIC STEM CELL
TRANSPLANTATION WITH REDUCED INTENSITY CONDITIONING
FOR ACUTE MYELOCYTIC LEUKEMIA. higher doses of stem cells
infused benefit patients transplanted in CR2 or beyond. A report from the
Acute Leukemia Working Party (ALWP) of the European Group for Blood and
Marrow Transplantation (EBMT).
NC Gorin, M Labopin, JM Boiron, N Theorin, T Littlewood , S Slavin, H
Greinix, JY Cahn , E.P. Alessandrino, A Rambaldi, A Nagler, E Polge
and Vanderson Rocha
A report from the Acute Leukemia Working Party (ALWP) of the
European Group for Blood and Marrow Transplantation (EBMT).
2006;24(24):3959

0 200 400 600
0.0
0.2
0.4
0.6
0.8
1.0
30 ± 4%
56 ±5%
RIC from an HLA identical donor
in adult AML
Cumulative Incidence: chronic GVHD
days
Nucleated cells < median
Nucleated cells>median
P=0.003

3210
1.0
.8
.6
.4
.2
0.0
Figure 3: LFS according to the nucleated cell dose infused
Below the median
Above the median
years
P=0.03
Higher doses
Lower doses
NC Gorin et al JCO 2006 Aug 20;24(24):3959

NO INFLUENCE OF THE DOSE
OF CELLS INFUSED IN CR1Dose LFS RI TRM aGVHD
≥2
cGVHD
<median 54+/-7 30+/-7 16+/-5 21+/-5 48+/-7
>median 45+/-7 42+/-7 13+/-4 17+/-5 56+/-7
p 0.8 0.53 0.58 0.49 0.29

INFLUENCE OF THE DOSE OF
CELLS INFUSED IN CR2
Dose LFS RI TRM aGVHD
≥2
cGVHD
<median 20+/-8 65+/-7 16+/-5 21+/-5 31+/-8
>median 47+/-8 44+/-8 10+/-4 22+/-6 62+/-9
p 0.0025 0.01 0.45 0.65 0.006

RIC transplants AML Conclusion :
Nucleated cell dose infused
� LFS: Better with higher NC dose infused: In CR2 , not in CR1.
� RI: Lower with higher NC dose infused
� The role of CD8+ T cells is possible

3210
1.0
.8
.6
.4
.2
0.0
Figure 5: LFS according to the CD34 cells dose infused
years
Below the median
Above the medianP=0.82
Higher doses
Lower doses
NC Gorin et al JCO 2006 Aug 20;24(24):3959-66.

Engraftment and survival following
RIC allogeneic PBSC transplants: CD8 T cell doseTM Cao, et al Stanford, Blood March 15 2005
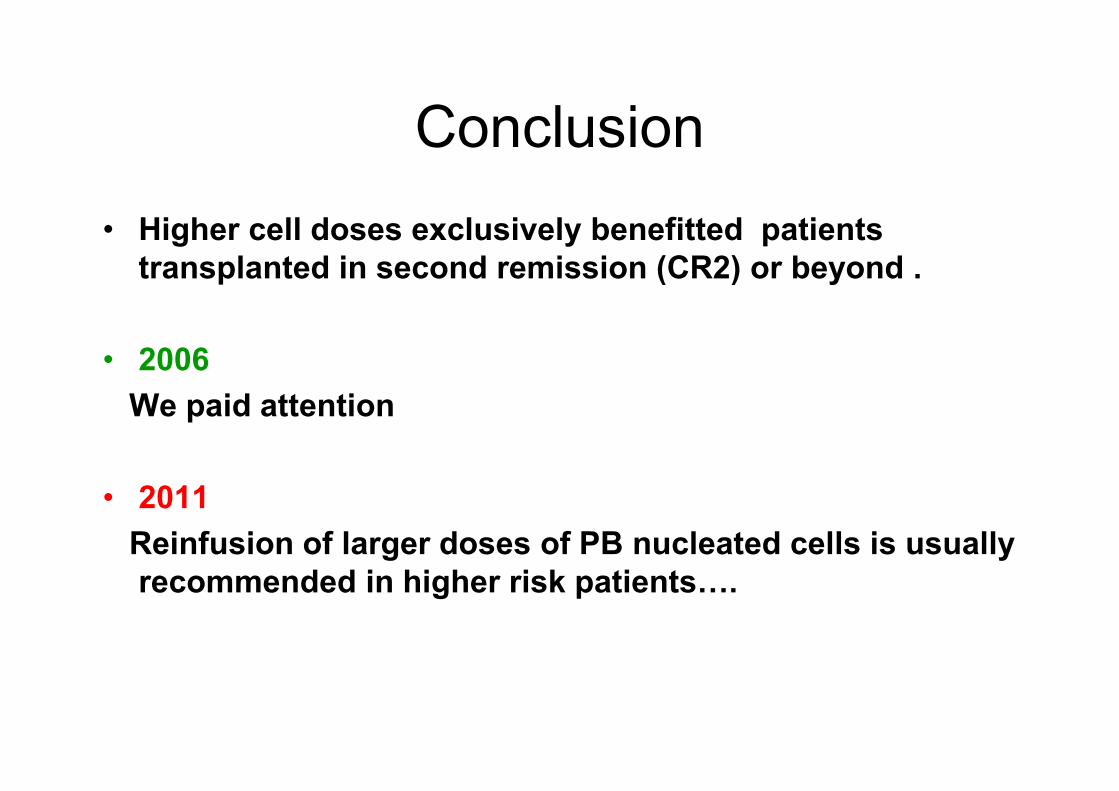
Conclusion
• Higher cell doses exclusively benefitted patients
transplanted in second remission (CR2) or beyond .
• 2006
We paid attention
• 2011
Reinfusion of larger doses of PB nucleated cells is usually
recommended in higher risk patientsI.

Autologous stem cell transplantation
for AML
IS BONE MARROW BETTER?

543210
1,0
0,8
0,6
0,4
0,2
0,0
Pro
ba
bil
ity
(%
)
years
47 ± 1%
50 ± 1%
P=0.01
Estimated Leukemia-Free Survival (LFS) in patients receiving autogolous transplantation before 1994 (_______)
or after1994 (-------)

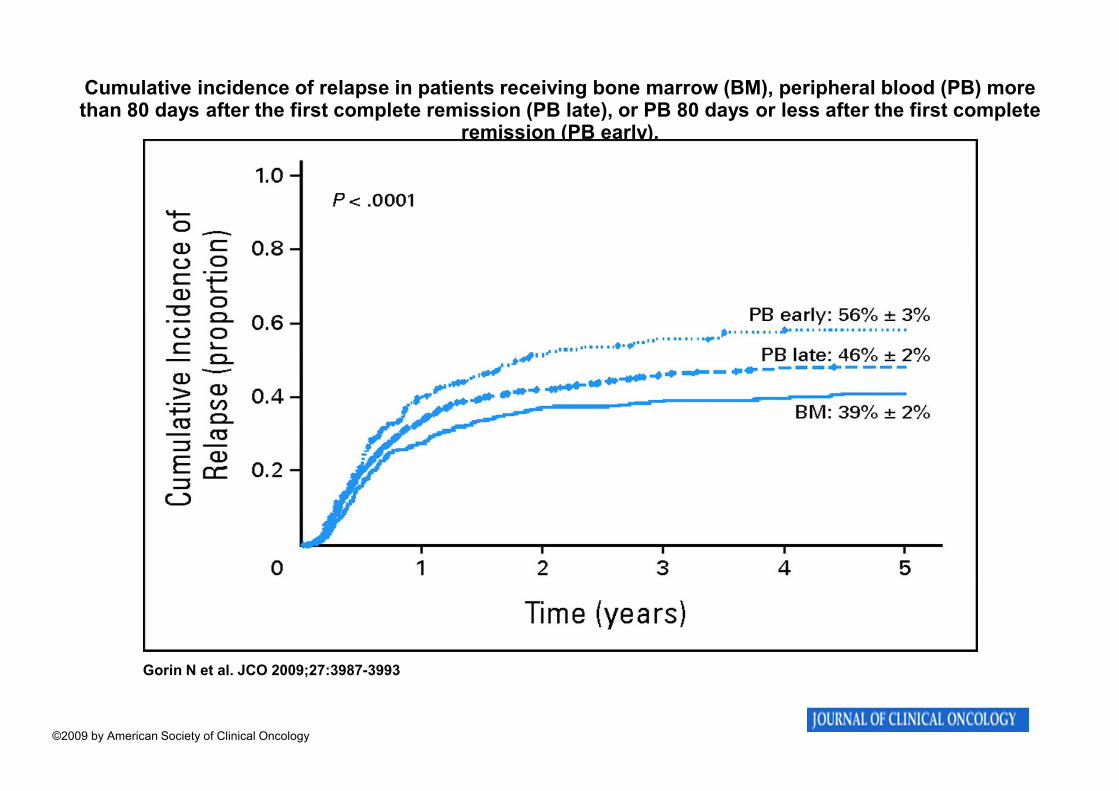
Cumulative incidence of relapse in patients receiving bone marrow (BM), peripheral blood (PB) more than 80 days after the first complete remission (PB late), or PB 80 days or less after the first complete
remission (PB early).
Gorin N et al. JCO 2009;27:3987-3993
©2009 by American Society of Clinical Oncology

Estimated leukemia-free survival in patients receiving bone marrow (BM), peripheral blood (PB) more than 80 days after the first complete remission (PB late), or PB 80 days or less after the first complete
remission (PB early).
Gorin N et al. JCO 2009;27:3987-3993
©2009 by American Society of Clinical Oncology

Copyright ©2010 American Society of Hematology. Copyright restrictions may apply.
Gorin, N.-C. et al. Blood 2010;116:3157-3162
Figure 1 Cumulative incidence of relapse
Dose of infused CD34+ cells > 7.16 x 10⁶ cells/kg.

Copyright ©2010 American Society of Hematology. Copyright restrictions may apply.
Gorin, N.-C. et al. Blood 2010;116:3157-3162
Figure 2 Probability of LFS
Dose of infused CD34+ cells > 7.16 x 10⁶ cells/kg.

Patients with AML in CR with insufficient mobilization of CD34+ cells with G-SCF and/or Cytoxan:
G-SCF: 10µµµµg/kg QD x 7-8 days;
AMD3100: 240 µµµµg/kg QD starting Day 4 x 3-4 days
Mobilization of AML progenitor cells with G-CSF+Plerixafor
in patients with AML in CR
Courtesy: M Andreef MDA Houston

Increase in circulating clonal cells during apheresis
following G-CSF and AMD3100
G-SCF
AMD-3100

GENERAL CONCLUSION
ASCT in AML
• BM superior to PB
• PB better if more in vivo purging (CR to
ASCT > 80 days)
• PB better if CD34+ Cell dose not too high
• Can we compare BM to Good PB ?

LFS after autograft for AML CR1
1994-2008
Optimal PB identical to BM
BM n=1028
PB* n=672
50 ± 2%
48 ± 2%
years
P=0.95 * interval CR1 to transplant>80 days and CD34 <7.16 106/Kg

BM VERSUS PB
CONCLUSIONS

Peripheral Blood vs Marrow
Allogeneic
• First period: 1993-1999: Discovery of PB and enthusiasm
• Second period: 2000-2007: PB is the Golden standard «
eyes shot »
• Third period: 2008 - 2010 :Concerns and reasonable doubt
« eyes open »: Quality of life assesment
• Today: tailored grafts: source and dose……

Good riskpatient
Standard risk disease
RICH MARROW
Good riskpatient
High risk disease
RICH PB

High riskpatient
Standard risk disease
RICH MARROW OF
COURSE
High riskpatient
High risk disease
PB for the disease
Very rich for the patient
NO TRANSPLANT
or
VERY RICH PB OF
COURSE

Peripheral Blood vs Marrow
Autologous AML
• 1977- 1985: Marrow and in vitro purged marrow
• 1987-1995: Enthusiam for PB giving more rapid engraftment;
concerns on early unexpected relapses in AML…… (JP laporte, J
Mehta…)
Mobilisation of tumor cells
Eyes shot
• Second period 1995-2005: The concept of in vivo purging ( NHL,
Acute Leukemias, ..)
• An old newcomer: Monitoring of Minimal Residual disease.

MARROW MINER TWO
First presented at the EBMT 2008 Meeting
In Florence Italy

The European Group for Blood and Marrow Transplantation
Acknowledgments
• All participating EBMT participating centers and
investigators
• National registries
• Local and national data managers
• Norbert Schmitz
• Myriam Labopin
• Arnon Nagler
• Didier Blaise
• Vanderson Rocha
• Mohamad Mohty