the university of tokyo ir3s energy sustainability … triple 50 oecd triple 50 in the world...
TRANSCRIPT

The University of Tokyo IR3S Energy Sustainability Forum Interna<onal Symposium “Pathway to Low Carbon Society aCer Kyoto Protocol”October 28th (Wed.), 2009 13:00 ‐ 17:30U Thant Hall, United Na<ons University (5‐53‐70 Jingumae, Shibuya‐ku, Tokyo)
“Midterm CO2 Reduction Target in terms of Science, Fairness and Feasibility”
Dr.Tetsuo Yuhara Project Prof. IR3S, The University of Tokyo
Research Director, Canon Ins<tute for Global Studies 1

2
Triple 50 OECD
Triple 50 in the World
Sustainable World
Triple50: Self-sufficiency 50%, Dependency on Fossil fuel 50%,Energy efficiency 50% Sustainable = Emission of CO2 within Earth ability of natural absorption ( exhausted with fossil fuel 4Btoe)
☜ within ability of natural absorption

“Triple 50 “ for Japan, proposed by the Univ. of Tokyo
50% 50% 50% 2030
35% 80% 20% now
Energy Utilization Efficiency
Dependency on oil Energy self-sufficiency
Renewables
Nuclear
Fossil fuel
Long-Term Energy Demand Outlook 2030 by the Agency for Natural Resources and Energy (METI) and TRIPLE 50

Se]ng the target Concept and approach(Example)
4
* -25%

5
Issues on CO2 emission reduc<on
• Scien<fic and Long‐term Scenario of GHG reduc<on ‐‐‐ CO2 curve that should be globally shared
• Differen<ated role and contribu<on of each country--- Promises by developed countries and emission reduc;on curve for developing countries
• To share the gap--- Ideal energy mix and hard truth
• Measures to overcome the gap--- Technology development and its diffusion/transfer Sharing the key technologies and those deployment
• To build a future interna<onal coopera<ve system--- Advanced CDM and ETS

6
Se]ng & mee<ng Target for GHG Emission Reduc<on by 2020
Consistency with global climate change 科学性
Rise in global temperature < 2 oC
公平性Fairness among countries
Marginal cost should be equal among
developed countries for 25% CO2 reduc<on
Feasibility実現可能性
Cost benefit should be considered to install the technologies
2009.4 T.YUHARA (proposed to “Committee on mid-term target”)

Japanese Mid‐term (2020) Target and Abatement Cost
7

The six choices of mid-term target The marginal abatement cost to meet target
Goal of
US, EU
US, EU target level (Equal MAC)
Compare to 2005 level
Compare to 1990 level ※All names of choices
are temporary
② All developed nations reduce 25% from 1990 (Equal MAC)
④ All developed nations reduce 25% from 1990 (Equal cost per unit GDP)
US, EU target
US target
EU target
① Long-term supply and demand prospect Effort Continuance Case (-4% to 2005 level, +4% to 1990 level)
③ Long-term supply and demand prospect Max Introduction Case (-14% to 2005 level, -7% to 1990 level)
⑤ Compare to 1990 level -15% Case (-21% to 2005 level, -15% to 1990 level)
Target of Kyoto Protocol (-0.6% to 1990 level, -7.9% to 2005 level) ※-6% to 1990 level by including carbon sink and international trading
⑥ Compare to 1990 level -25% Case (-30% to 2005 level, -25% to 1990 level)
From final report of Committee on Mid-term target(2009.6)

CO2 Emission Reduction and its Cost Impact
• METI proposed 47 kinds of technologies and policies to
reduce CO2 emission in the long-term supply and demand
forecast.
• 27 measures will result in positive impact on economy
• The following 5 measures will cost over 5,000 JPY/CO2-ton
– BEMS (Building and Energy Management System)
– Energy Efficient Resident
– Heat Pump, co-generation, Fuel Cell for buildings and houses
– Solar Power
– Next generation vehicles (Hybrid, Electric, Plug-in Hybrid,
Fuel-Cell)
** These measures help job creation.
1

Mid-term GHG reduction Target of Japan
1990 2005 2020 2050
Long-term target (▲60-80% from 1990)
Real emission (△7.7% from 1990)
15% version (Jun. 2009) (▲7% from 1990)
Baseline (1261.3 MtCO2)
Mid-term target
25% version (Sep. 2009) (▲ 25% from 1990)
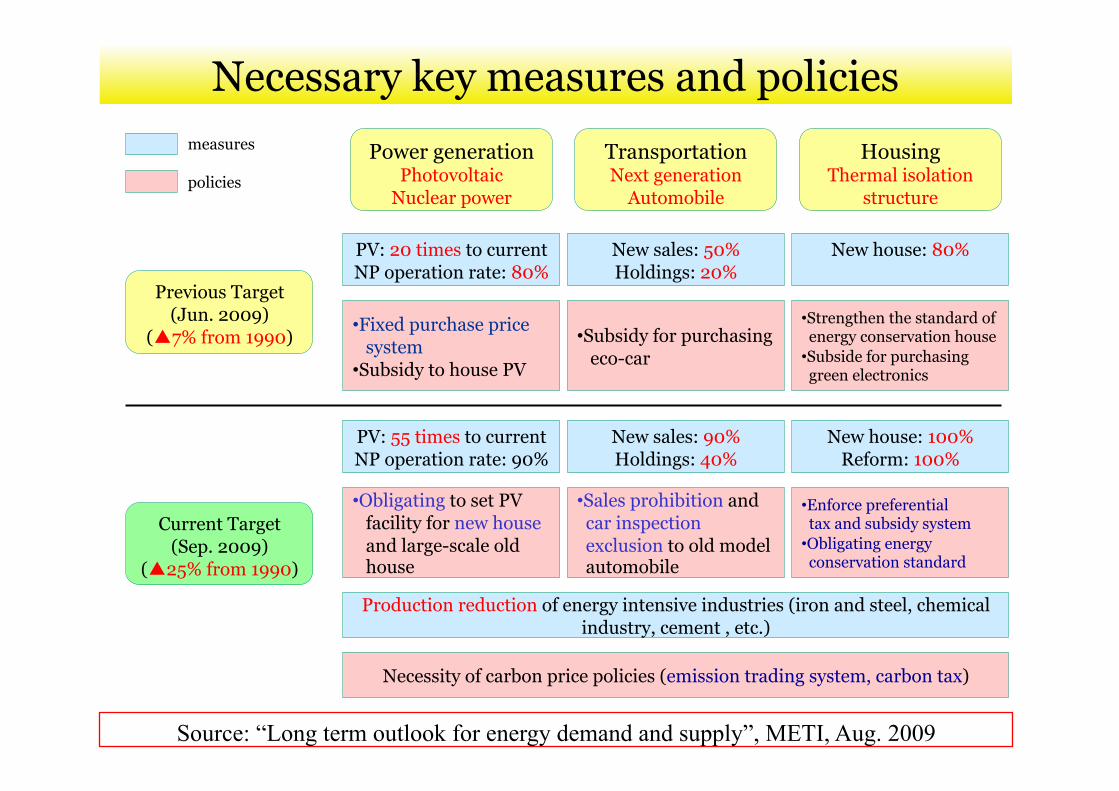
Necessary key measures and policies
Previous Target (Jun. 2009)
(▲7% from 1990)
Current Target (Sep. 2009)
(▲25% from 1990)
Power generation Photovoltaic
Nuclear power
Transportation Next generation
Automobile
Housing Thermal isolation
structure
PV: 20 times to current NP operation rate: 80%
• Fixed purchase price system • Subsidy to house PV
New sales: 50% Holdings: 20%
• Subsidy for purchasing eco-car
New house: 80%
• Strengthen the standard of energy conservation house • Subside for purchasing green electronics
PV: 55 times to current NP operation rate: 90%
• Obligating to set PV facility for new house and large-scale old house
New sales: 90% Holdings: 40%
• Sales prohibition and car inspection exclusion to old model automobile
New house: 100% Reform: 100%
• Enforce preferential tax and subsidy system • Obligating energy conservation standard
Production reduction of energy intensive industries (iron and steel, chemical industry, cement , etc.)
Necessity of carbon price policies (emission trading system, carbon tax)
measures
policies
Source: “Long term outlook for energy demand and supply”, METI, Aug. 2009

Economical Impacts(Results by “Committee on Midterm target”
▲0.6% in 2020 (depressing)
Baseline (△4% from 1990)
Previous Target (▲7% from 1990)
Current Target (▲25% from 1990)
△0.2% (rise)
△0.1%
▲40,000JP\/yr Per household
△30,000JP\ /yr Per household
15,000YP\/tCO2 If putting the cost into energy price, it would
make a rise by 30JP\/l for gasoline
Real GDP
Unemployment rate
Private plant investment
Disposable income
Utility costs
Marginal abatement cost
Based on an assumption of a
1.3% annual growth of Real GDP
35-62 US$/tCO2 Cannot be compared
simply due to the different models
▲3.2% in 2020 (depressing)
△1.3% (rise)
▲ 0.4%
▲220,000JP\ /yr Per household
△140,000JP\ yr Per household
82,000YP\/tCO2 If putting the cost into energy price, it would
make a rise by 170JP\/l for gasoline
※1) The change rates show the differences compared to the baseline in 2020. ※2) The results are analyzed using the CGE model of Japan Center for Economic Research
Source: “Long term outlook for energy demand and supply”, METI, Aug. 2009

※According to the analysis of the Mid-term Target Examination Committee and the Institute of Energy Economics Japan (IEEJ)
Necessary measures ○Photovoltaic genera;on Introducing to all new house Introducing to 600,000 old house annually (equal to the house number in Nagasaki Prefecture) ○Energy‐conserva;on house The severest standard (1 MJPY) for all new house Reforming all old house to energy‐conserva;on type (2 MJPY) ○High efficiency boiler Introducing to all households with more then two persons and parts of single households ○Next genera;on automobile Sales prohibi<on for gasoline automobile ○Restric;on of economic ac;vi;es Produc;on reduc;on of steel by 18%, cement by 25%, etc.
482 455 408 321
127 174 132
87
164 238
174
140
217 257
200
169
68
79
66
53
0
200
400
600
800
1000
1200
1400
転換
運輸
業務
家庭
産業
1990 2005 15% target 25% target
981
770
1203 1059
Necessary sectoral reduction rates from 2005 to meet the -25% target
Industry: -29% Commercial: -41% Transport: -34% Conversion: -33%
Residential emission needs to be Halved.
(Mt-CO2)
Sectoral CO2 emissions
Conversion
Transport
Commercial
Residential
Industry 26% 18% 11%
24% 22%
10%
11%
5%
3%
31%
42%
55%
8% 8%
9%
1% 5% 11%
0%
10%
20%
30%
40%
50%
60%
70%
80%
90%
100%
新エネルギー
水力
原子力
石油等
LNG
石炭
2005 15% target 25% target
New energy
Hydraulic power
Nuclear
Oil
Natural Gas
Coal
Nuclear covers more than half
Power supply composition

Case of 25% CO2 Emission Reduc<on ⑥ from the Midterm Target Commigee (Cabinet Secretariat)
14
25% reduc;on from the level of 1990 (30% reduc;on from 2005)
Phenomenon: all appliances/equipments are state‐of the art.
Economic ac<vi<es are cutdown
Principles: Mandatory to replace all appliances/equipments to be state‐of‐the‐art.
Mandatory for carbon pricing Technology installa<on and Policies: Solar Power : ‐ 55 <mes of current capacity of solar power ‐ Newly built and some of exis<ng houses are obliged to install solar power devices.
Next Genera<on Vehicles : ‐ 90% of sales of new car and 40% of exis<ng cars should be the next genera<on v‐ ehicles. ‐ Prohibi<on of sales and inspec<on‐and‐maintenance of conven<onal vehicles
Heat insula<ng houses: ‐ 100% of newly‐built house and exis<ng house install heat insula<ng. ‐ Mandatory of energy‐conserva<on standards for all houses
Energy Intensive Industries : ‐ Produc<on cutdown ‐ Mandatory of ETS and Carbon tax

15
Comparisons ;Outlooks of Energy supply through 2030 to 2050 in Japan
Year 2005 2020 2030 2050
Real Value
METI 2009.8
WEO 2009 NIES METI
2009.8 WEO 2009
IEE Japan
TPES(Mtoe) 544 511 465 477 476 446 364
CO2 Reduction (2005) - -16 -21 -32 -27 -48 -65
% (1990) +8 -6 -10 -23 -18 -40 -60
Fossil Fuels % 82 73 71 68 68 57 48
Nuclear % 12 18 23 19 21 31 31
Renewable Energy % 6 9 6 13 12 11 21

16
Outlook of mixtures of energy supply through 2030 to 2050 in Japan
Year 2005 2020 2030
Real Value
METI 2009.8
Current Target
Triple 50
TPES(Mtoe) 544 511 511 480
CO2 Reduction (2005) - -15 -30 -40
% (1990) +8 -6 -25
Fossil Fuels % 82 73 67 50
Nuclear % 12 18 22* 25
Renewable Energy % 6 9 11 25
* Nuclear power plants 12-15 (operation ratio in all plants: 80-90%)

17

Flexible pathway of emission reduc<on , agreed among developed and developing countries
18

World Reduc<on Curve of CO2 emissions (Peak&decay curves , cumula<ve emission 640Gt and within 2℃ in this century)
and differen<ated roles of developed and developing countries
19 * T. Matsuno, K.Maruyama, J.Tsutsui (2009)
*
20
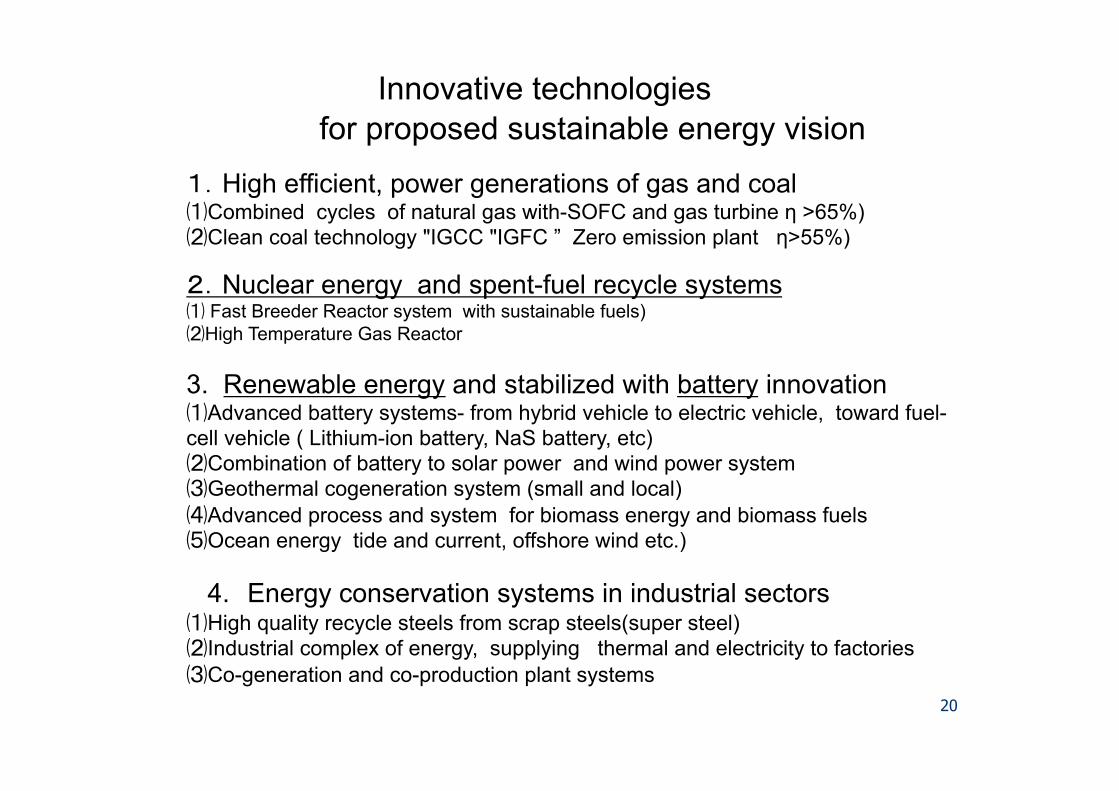
Innovative technologies for proposed sustainable energy vision
1.High efficient, power generations of gas and coal ⑴Combined cycles of natural gas with-SOFC and gas turbine η >65%) ⑵Clean coal technology "IGCC "IGFC ” Zero emission plant η>55%)
2.Nuclear energy and spent-fuel recycle systems ⑴ Fast Breeder Reactor system with sustainable fuels) ⑵High Temperature Gas Reactor
3. Renewable energy and stabilized with battery innovation
⑴Advanced battery systems- from hybrid vehicle to electric vehicle, toward fuel- cell vehicle ( Lithium-ion battery, NaS battery, etc) ⑵Combination of battery to solar power and wind power system ⑶Geothermal cogeneration system (small and local) ⑷Advanced process and system for biomass energy and biomass fuels ⑸Ocean energy tide and current, offshore wind etc.)
4. Energy conservation systems in industrial sectors
⑴High quality recycle steels from scrap steels(super steel) ⑵Industrial complex of energy, supplying thermal and electricity to factories ⑶Co-generation and co-production plant systems

World energy mixture to 50% CO2 reduc<on in 2050 ‐role of nuclear energy
*Uranium Reserve 4.5MtU(Cost<$130/kg), Ultimate reserve 14.4MtU

Hard Truth to Fill in the Gaps Uranium Reserve for Nuclear Power Plant • Uranium is less expensive energy resource than fossil fuels,
however, reserves are not enough to fill up the capacity of nuclear power genera;on in 2030 and 2050.
• Es;mated Uranium reserve is 4,540 thousand tU (its cost is less than 130USD/kg). Ul;mate reserve is 14,400 thousand tU. It is less amount to operate 1,200GW in 2030 and 3,600GW in 2050 of Nuclear Power Plants
• Fast Breeder Reactor cycle should be installed before 2050.
Availability of Renewable Energy Resource • Used renewable energy resources are not enough in 2050.
Unused renewable energy resources should be introduced.

23
Possibility of 30% CO2 Emission Reduc<on CO2 reduc<on
(Mton) Reduc<on %
to 2005
Nuclear Power Plant
90% opera<ng rate for 15 Newly‐built plant 163 13.5
Thermal Power Plant
Gas Power Plant (MACC) 8 0.7
Bio‐mass mixed‐combus<on 50 4.2 METI’s maximum introduc<on case
< 5,000 JPY/CO2‐ton 62 5.2
> 5,000 JPY/CO2‐ton 24 2.0 20 <mes of current Solar Power Genera<on 14 1.2
Next genera<on vehicles 21 1.7
Others 18 1.5
Total 360 30.0%

24
Addi<onal Measures with Fairness, feasibility and science
• Improvement of capacity u;liza;on rate of nuclear power plant (60%→90%)
• Improvement of the mixed ra;o of Biomass in coal‐fired power plant (Prpf .S.Kaneko proposes)
• Advanced scheme to globally share the target and technologies. CDM, ETS, and ……

25
Technologies to Fill in the Gaps
• Green and Efficient thermal power genera;on technology
• FBR • Advanced secondary bajeries • Unused renewable energy
– Cold energy – Geothermal energy – Thinned wood
• Carbon capture and storage
26
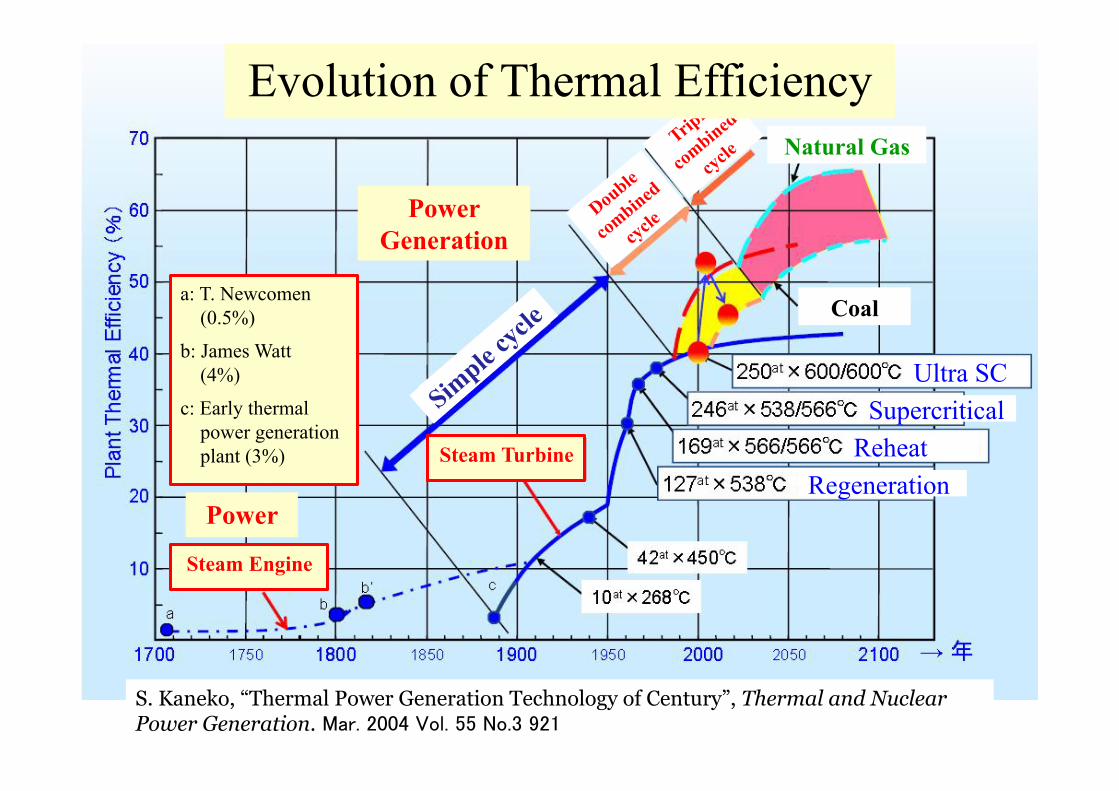
a: T. Newcomen (0.5%)
b: James Watt (4%)
c: Early thermal power generation plant (3%)
Power
Steam Engine
Steam Turbine
Power Generation
Coal
Natural Gas
Evolution of Thermal Efficiency
Regeneration Reheat
Supercritical Ultra SC
S. Kaneko, “Thermal Power Generation Technology of Century”, Thermal and Nuclear Power Generation. Mar. 2004 Vol. 55 No.3 921

27 S. Tanaka, “Japan’s National Strategy for Global Nuclear Development”, ASME/JSME Workshop. October 14, 2009

Overview of Next‐Genera<on LWR
6 Concepts of Next-Generation LWR (This Figure shows an example of PWR)
Reactor Core System with above 5% Enriched Uranium Fuel
Hybrid Safety System (optimized passive and active safety)
Long-Life Materials and Innovative Water Chemistry Technologies
Innovative Construction Technology
World Leading Digital Technology
Seismic Isolation System
Electric Output
1,700–1,800 MWe
Reactor Type
PWR / BWR
Y. Ueda, “Next-Generation LWR Development Program in Japan”, ASME/JSME Workshop. October 14, 2009

The HTTR (High Temperature Engineering Test Reactor)
With a thermal power of 30 MW, is a research facility constructed for development of High Temperature Gas‐Cooled Reactor (HTGR) technology and nuclear heat u;liza;on technology
The first cri;cality of the HTTR was ajained on November 10, 1998. The full power of 30 MW and the reactor outlet coolant temperature of 850°C was achieved on December 7, 2001.
The maximum reactor outlet coolant temperature of 950°C was achieved in April 2004.
hjp://hjr.jaea.go.jp/eng/index_top_eng.html

USC Power Plant
IGCC
IGFC
Secondary Battery
Secondary Battery
Secondary Battery
Secondary Battery
Secondary Battery
Secondary Battery
Photovoltaic
Wind Farm
Electronic Vehicle
Wireless Tramcar
House
Hotel Office building
Transformation Transmission Transformation
Energy Vision based on advanced secondary bagery

31
Carbon Capture and Storage (CCS) Key technology for post combustion
Ocean sequestration
Aquifer sequestration
(By RITE)
(By RITE)

32
!
"!!
#!!!
#"!!
$!!!
$"!!
%!!!
%"!!
&!!!
&"!!
'()*+,-./0*.1,232.41
56--+1'789:;)(2<
=$!!!,
>$!!&,
?$!%!
:@8A$!!B<
C$!%!,
)D/5,5)6E1
F$!"!,
)D/5,5)6E1
GD/3*,232.41,0/H)6.25,/3,$!!!I,$!%!I$!"!J)D/5,5)6E1<,5D*.2,(K,K(55/+,K62+5,L,BMN:$!%!<I,"!N:$!"!<
O232P*Q+2
R6S+2*.
T*5
U/+
G(*+
20% 30%
17% 20%
T.YUHARA in “#3 Japan-China Forum on environment,energy and transportation in Jan.15,2008

Aug-2007 T.YUHARA
Proposed for Japan-China forum on environment,energy and transportation issues

34
Energy balance sheet of China in 2030 (Case-1)

Emissions in Enhanced Low Carbon scenario are very similar to Z650 case under 60%-80% reductions by Annex I countries.
35 Increase ratio is1.55 in 2020 from 2005 level. 1.58 in 2030 0.99 in 2050
Resent study of reduction target in China 15 August 2009
Koki Maruyama “Policy Implication of Z520, Z650 emission pathways”

Harmony among Asia (with China)
• Sharing the target • Advanced schemes to accelerate sharing advanced technologies among countries.
36
CDM
Need to improve the complexity of cer<fica<on
ETS
Other scheme?
Authorized by Private sector?

37
Thank you for your attention.