three-dimensional aquila rift: magnetized hi arch …sofue/papers/sofcomp/2016-mn-aquila-rift... ·...
TRANSCRIPT

Mon. Not. R. Astron. Soc. 000, 000–000 (0000) Printed 5 September 2016 (MN LATEX style file v2.2)
Three-Dimensional Aquila Rift: Magnetized HI ArchAnchored by Molecular Complex
Yoshiaki Sofue1⋆ and Hiroyuki Nakanishi21 Insitute of Astronomy, The University of Tokyo, Mitaka, Tokyo 181-0015, Japan2 Graduate Schools of Science and Engineering, Kagoshima university, 1-21-35 Korimoto, Kagoshima 890-8544, Japan
ABSTRACTThree dimensional structure of the Aquila Rift of magnetized neutral gas is investi-
gated by analyzing HI and CO line data. The projected distance on the Galactic planeof the HI arch of the Rift is r⊥ ∼ 250 pc from the Sun. The HI arch emerges at l ∼ 30◦,reaches to altitudes as high as ∼ 500 pc above the plane at l ∼ 350◦, and returns tothe disk at l ∼ 270◦. The extent of arch at positive latitudes is ∼ 1 kpc and radiusis ∼ 100 pc. The eastern root is associated with the giant molecular cloud complex,which is the main body of the optically defined Aquila Rift. The HI and molecularmasses of the Rift are estimated to be MHI ∼ 1.4 × 10⁵M⊙• and MH2 ∼ 3 × 10⁵M⊙•.Gravitational energies to lift the gases to their heights are Egrav:HI ∼ 1.4 × 1051 andEgrav:H2 ∼ 0.3×1051 erg, respectively. Magnetic field is aligned along the HI arch of theRift, and the strength is measured to be B ∼ 10 µG using Faraday rotation measures ofextragalactic radio sources. The magnetic energy is estimated to be Emag ∼ 1.2×1051
erg. A possible mechanism of formation of the Aquila Rift is proposed in terms ofinterstellar magnetic inflation by a sinusoidal Parker instability of wavelength of ∼ 2.5kpc and amplitude ∼ 500 pc.
Key words: galaxies: individual (Milky Way) — ISM: HI gas — ISM: molecular gas— ISM: magnetic field — Parker instability
1 INTRODUCTION
The Aquila Rift is a giant dark lane dividing the Milky Wayby heavy starlight extinction at galactic longitude l ∼ 10 −30◦ near the galactic plane (Weaver 1949; Dame et al. 2001;Dobashi et al. 2005; Green et al. 2015), where it makes agiant triangular shade. It then extends to positive latitudesover the Galactic Center, and returns to the galactic planeat l ∼ 270◦ (Dame et al. 2001). It is composed of neutralgas and dust drawing a giant arch on the sky.
Similarly to the dark lane, the HI arch is inflating fromthe galactic plane at l ∼ 30◦, extends over the GalacticCenter and returns to the galactic plane at l ∼ 270◦, span-ning over ∼ 120◦ on the sky. It also extends toward nega-tive latitudes from l ∼ 30◦, running through (60◦,−40◦) to(90◦,−50◦).
The Rift is composed of broad curved ridge of HI fil-aments (Kalberla et al. 2003). It is associated with a com-plex of dark clouds (Dobashi et al. 2003; Green et al. 2015),molecular cloud complex (Dame et al. 2001) and dust emit-ting far infrared (FIR) emissions (Planck Collaboration etal. 2015a,b). Intensity cross section of the HI arch and stellar
⋆ E-mail:[email protected]
polarization intensities indicates ridge-center peaked profileindicative of a filament or a bunch of filaments (Kalberla etal. 2005), but it does not show any signature of a shell. Inthis regard, the Aquila Rift is a filament or a loop, but nota shell, though it may be thought to be one of Heiles (1998)HI shells.
The Aquila Rift is associated with magnetic fieldsaligned along the ridge as inferred from star light polariza-tion (Mathewson and Ford 1970; Santos et al. 2011) and FIRpolarized dust emission (Planck collaboration 2015a,b). Theeastern end of the HI arch near the galactic plane is rootedby another molecular cloud complex extending to negativegalactic latitudes (Kawamura et al. 1999).
The root region at l ∼ 20 − 30◦ apparently coincideswith the root of the North Polar Spur (NPS). However, theNPS and Aquila Rift are shown to be unrelated objects sep-arated on the line of sight from their different distances andperpendicular magnetic fields (Sofue 2015: See discussionsection and the literature therein).
The Aquila Rift has been modeled as a loop producedby interaction of the local hot bubble and Loop I (Egger andAschenbach 1995; Heiles 1998; Reis and Corradi 2008; San-tos et al. 2011; Vidal et al. 2015), and the loop is thoughtto be one of the super HI shells of Heiles (1984). This loopmodel has recently encountered a difficulty about its relation
c⃝ 0000 RAS
2
to the North Polar Spur (NPS; Loop I), because the NPSdistance has been measured to be farther than several kpcby soft-Xray absorption (Sofue 2015; Sofue et al. 2016; Lalle-mant et al. 2016)) and Faraday rotation and depolarizationanalyses (Sun et al. 2014; Sofue 2015). Thus, the loop modelseems to have lost its phenomenological basis. Another dif-ficulty is the origin of the loop, which has nothing special inloop center.
Therefore, it would be worth visiting the Aquila Riftfrom a quite different stand point of view based on more real-istic astrophysical consideration about the formation mech-anism such as the Parker instability in the magnetized in-terstellar medium, which is well established and widely ac-cepted in the astrophysics of the galactic disk. Thereby phe-nomenologically, besides the shells and loops, we may morecarefully inspect into the HI, CO and magnetic field mapsof the local ISM with particular insight into coherent fila-mentary structures.
In this paper we analyze the kinematics and morphologyof interstellar HI and H2 gases in the Aquila Rift using theLeiden-Argentine-Bonn all-sky HI line survey (Kalberla etal. 2005 ) and Colombia galactic plane CO line survey (Dameet al. 2001). We present the three-dimensional structure ofneutral gas distribution based on the result of kinematicalanalysis. We further discuss the magnetic field structure,and consider the origin in terms of the Parker instability.
2 KINEMATICAL DISTANCE OF THEAQUILA RIFT
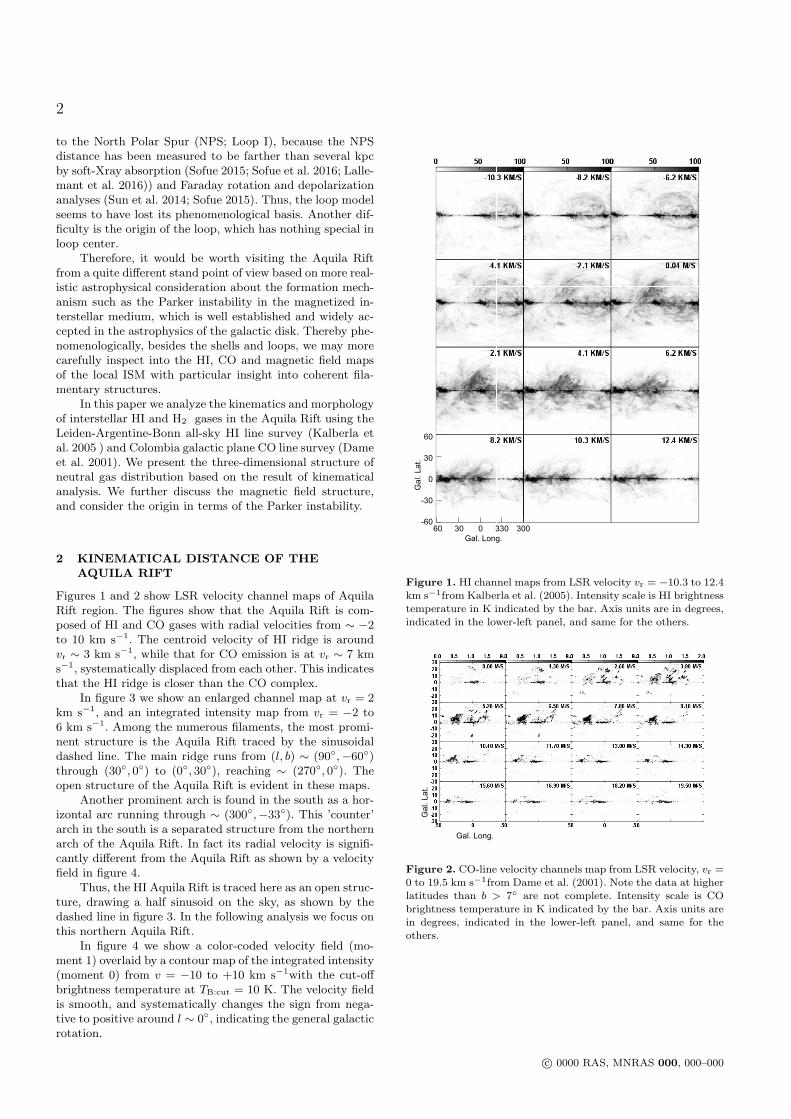
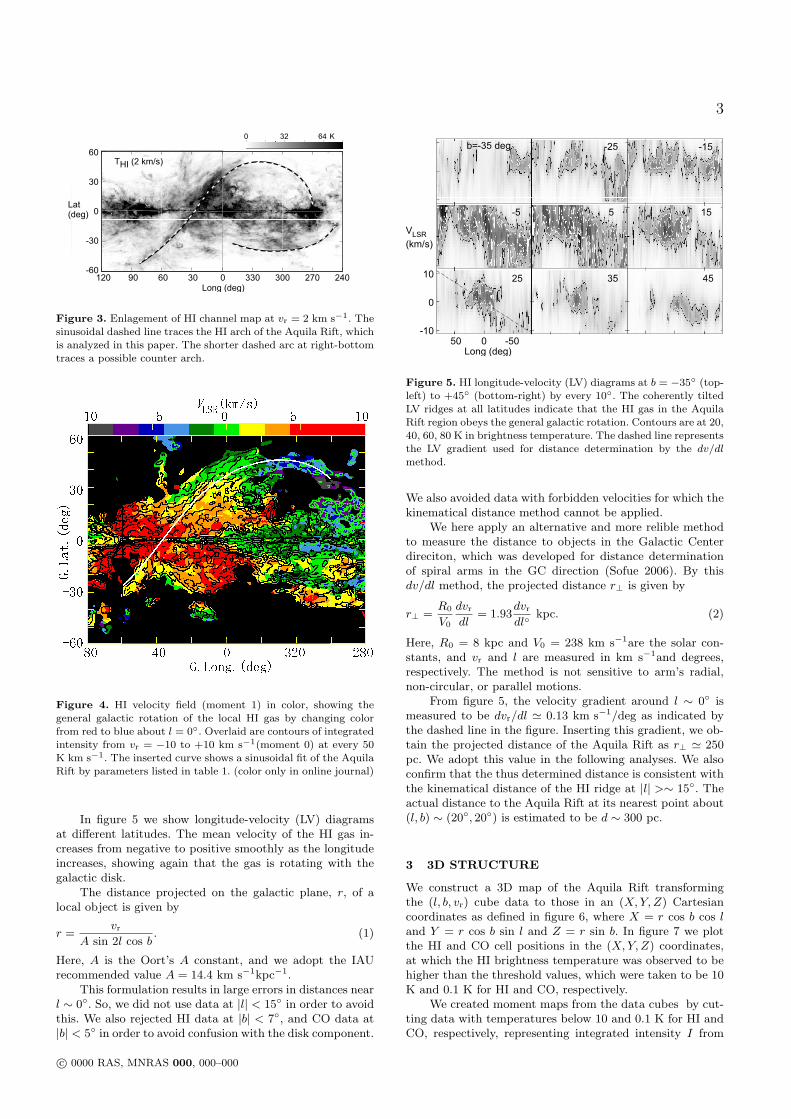
Figures 1 and 2 show LSR velocity channel maps of AquilaRift region. The figures show that the Aquila Rift is com-posed of HI and CO gases with radial velocities from ∼ −2to 10 km s−1. The centroid velocity of HI ridge is aroundvr ∼ 3 km s−1, while that for CO emission is at vr ∼ 7 kms−1, systematically displaced from each other. This indicatesthat the HI ridge is closer than the CO complex.
In figure 3 we show an enlarged channel map at vr = 2km s−1, and an integrated intensity map from vr = −2 to6 km s−1. Among the numerous filaments, the most promi-nent structure is the Aquila Rift traced by the sinusoidaldashed line. The main ridge runs from (l, b) ∼ (90◦,−60◦)through (30◦, 0◦) to (0◦, 30◦), reaching ∼ (270◦, 0◦). Theopen structure of the Aquila Rift is evident in these maps.
Another prominent arch is found in the south as a hor-izontal arc running through ∼ (300◦,−33◦). This ’counter’arch in the south is a separated structure from the northernarch of the Aquila Rift. In fact its radial velocity is signifi-cantly different from the Aquila Rift as shown by a velocityfield in figure 4.
Thus, the HI Aquila Rift is traced here as an open struc-ture, drawing a half sinusoid on the sky, as shown by thedashed line in figure 3. In the following analysis we focus onthis northern Aquila Rift.
In figure 4 we show a color-coded velocity field (mo-ment 1) overlaid by a contour map of the integrated intensity(moment 0) from v = −10 to +10 km s−1with the cut-offbrightness temperature at TB:cut = 10 K. The velocity fieldis smooth, and systematically changes the sign from nega-tive to positive around l ∼ 0◦, indicating the general galacticrotation.
60 30 0 330 300
60
30
0
-30
-60
Gal. Long.
Ga
l. L
at.
Figure 1. HI channel maps from LSR velocity vr = −10.3 to 12.4km s−1from Kalberla et al. (2005). Intensity scale is HI brightnesstemperature in K indicated by the bar. Axis units are in degrees,indicated in the lower-left panel, and same for the others.
Gal. Long.
Ga
l. L
at.
Figure 2. CO-line velocity channels map from LSR velocity, vr =0 to 19.5 km s−1from Dame et al. (2001). Note the data at higherlatitudes than b > 7◦ are not complete. Intensity scale is CO
brightness temperature in K indicated by the bar. Axis units arein degrees, indicated in the lower-left panel, and same for theothers.
c⃝ 0000 RAS, MNRAS 000, 000–000
3
60 0 300
30
0
-30
Long (deg)
Lat (deg)
120 240-60
60THI (2 km/s)
90 30 270330
0 32 64 K
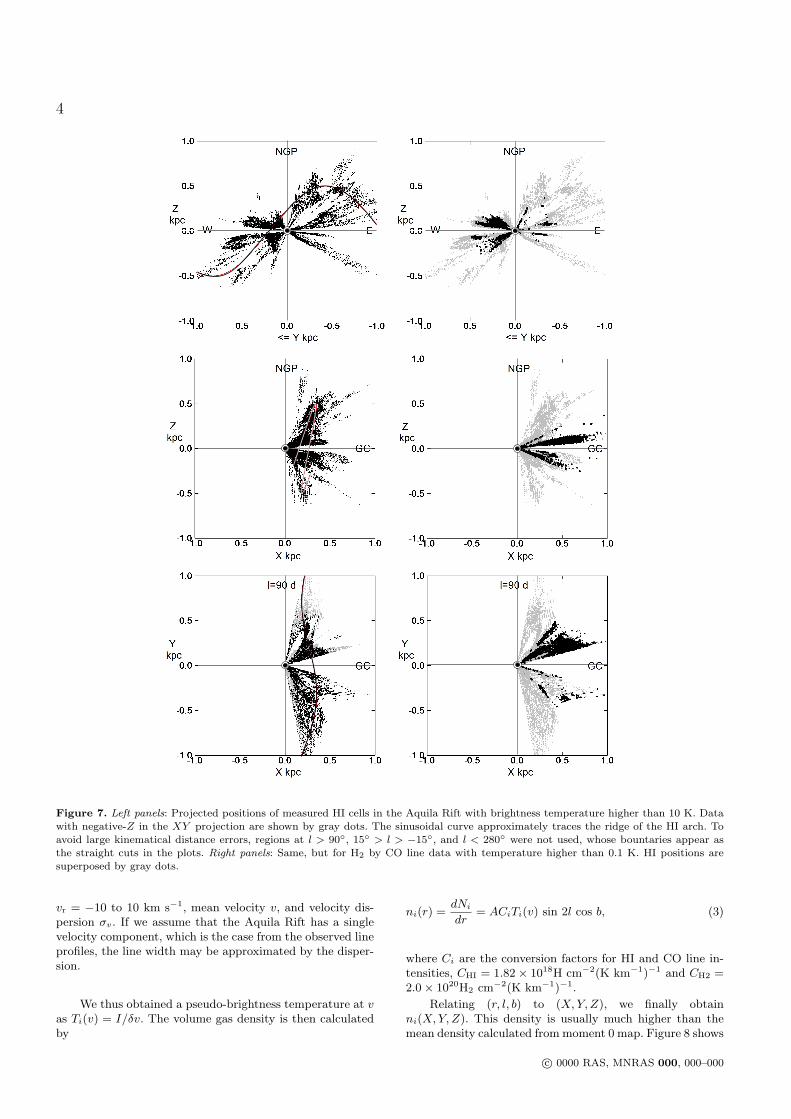
Figure 3. Enlagement of HI channel map at vr = 2 km s−1. Thesinusoidal dashed line traces the HI arch of the Aquila Rift, whichis analyzed in this paper. The shorter dashed arc at right-bottom
traces a possible counter arch.
Figure 4. HI velocity field (moment 1) in color, showing thegeneral galactic rotation of the local HI gas by changing colorfrom red to blue about l = 0◦. Overlaid are contours of integratedintensity from vr = −10 to +10 km s−1(moment 0) at every 50
K km s−1. The inserted curve shows a sinusoidal fit of the AquilaRift by parameters listed in table 1. (color only in online journal)
In figure 5 we show longitude-velocity (LV) diagramsat different latitudes. The mean velocity of the HI gas in-creases from negative to positive smoothly as the longitudeincreases, showing again that the gas is rotating with thegalactic disk.
The distance projected on the galactic plane, r, of alocal object is given by
r =vr
A sin 2l cos b. (1)
Here, A is the Oort’s A constant, and we adopt the IAUrecommended value A = 14.4 km s−1kpc−1.
This formulation results in large errors in distances nearl ∼ 0◦. So, we did not use data at |l| < 15◦ in order to avoidthis. We also rejected HI data at |b| < 7◦, and CO data at|b| < 5◦ in order to avoid confusion with the disk component.
50 0 -50
10
0
-10
Long (deg)
VLSR
(km/s)
b=-35 deg -25 -15
-5 5 15
25 35 45
Figure 5. HI longitude-velocity (LV) diagrams at b = −35◦ (top-left) to +45◦ (bottom-right) by every 10◦. The coherently tiltedLV ridges at all latitudes indicate that the HI gas in the AquilaRift region obeys the general galactic rotation. Contours are at 20,
40, 60, 80 K in brightness temperature. The dashed line representsthe LV gradient used for distance determination by the dv/dlmethod.
We also avoided data with forbidden velocities for which thekinematical distance method cannot be applied.
We here apply an alternative and more relible methodto measure the distance to objects in the Galactic Centerdireciton, which was developed for distance determinationof spiral arms in the GC direction (Sofue 2006). By thisdv/dl method, the projected distance r⊥ is given by
r⊥ =R0
V0
dvr
dl= 1.93
dvr
dl◦kpc. (2)
Here, R0 = 8 kpc and V0 = 238 km s−1are the solar con-stants, and vr and l are measured in km s−1and degrees,respectively. The method is not sensitive to arm’s radial,non-circular, or parallel motions.
From figure 5, the velocity gradient around l ∼ 0◦ ismeasured to be dvr/dl ≃ 0.13 km s−1/deg as indicated bythe dashed line in the figure. Inserting this gradient, we ob-tain the projected distance of the Aquila Rift as r⊥ ≃ 250pc. We adopt this value in the following analyses. We alsoconfirm that the thus determined distance is consistent withthe kinematical distance of the HI ridge at |l| >∼ 15◦. Theactual distance to the Aquila Rift at its nearest point about(l, b) ∼ (20◦, 20◦) is estimated to be d ∼ 300 pc.
3 3D STRUCTURE
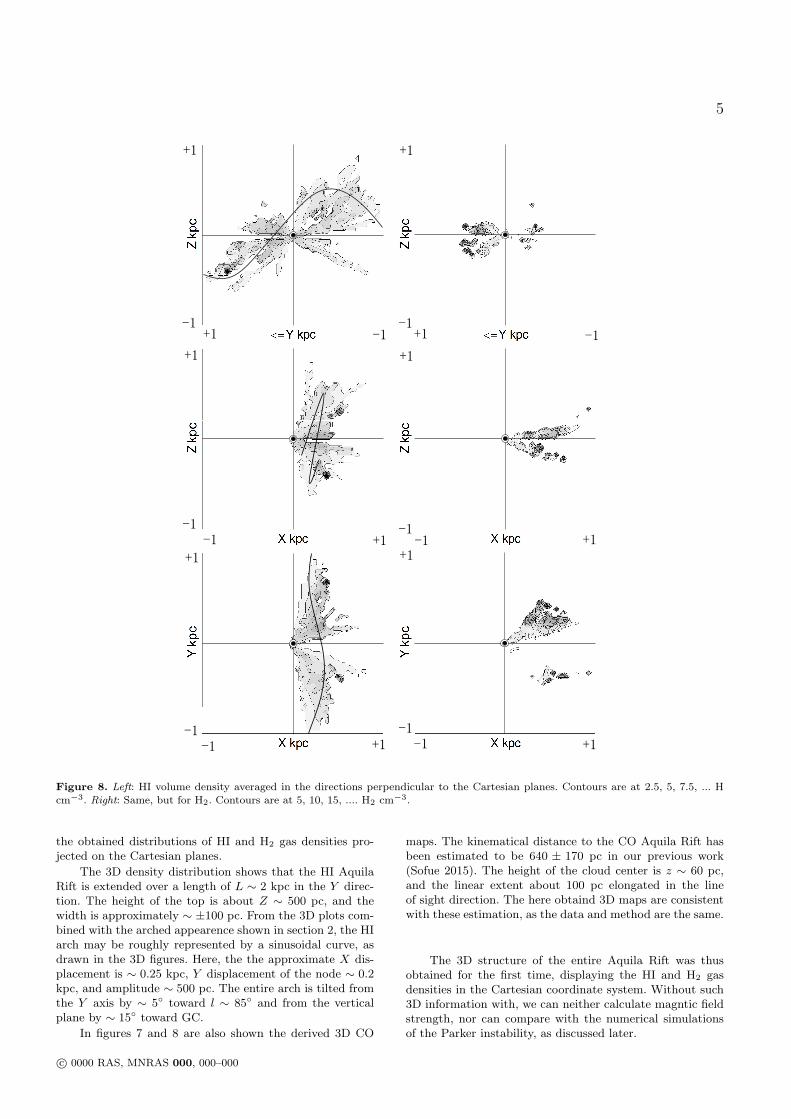
We construct a 3D map of the Aquila Rift transformingthe (l, b, vr) cube data to those in an (X, Y, Z) Cartesiancoordinates as defined in figure 6, where X = r cos b cos land Y = r cos b sin l and Z = r sin b. In figure 7 we plotthe HI and CO cell positions in the (X, Y, Z) coordinates,at which the HI brightness temperature was observed to behigher than the threshold values, which were taken to be 10K and 0.1 K for HI and CO, respectively.
We created moment maps from the data cubes by cut-ting data with temperatures below 10 and 0.1 K for HI andCO, respectively, representing integrated intensity I from
c⃝ 0000 RAS, MNRAS 000, 000–000
4
Figure 7. Left panels: Projected positions of measured HI cells in the Aquila Rift with brightness temperature higher than 10 K. Datawith negative-Z in the XY projection are shown by gray dots. The sinusoidal curve approximately traces the ridge of the HI arch. To
avoid large kinematical distance errors, regions at l > 90◦, 15◦ > l > −15◦, and l < 280◦ were not used, whose bountaries appear asthe straight cuts in the plots. Right panels: Same, but for H2 by CO line data with temperature higher than 0.1 K. HI positions aresuperposed by gray dots.
vr = −10 to 10 km s−1, mean velocity v, and velocity dis-persion σv. If we assume that the Aquila Rift has a singlevelocity component, which is the case from the observed lineprofiles, the line width may be approximated by the disper-sion.
We thus obtained a pseudo-brightness temperature at vas Ti(v) = I/δv. The volume gas density is then calculatedby
ni(r) =dNi
dr= ACiTi(v) sin 2l cos b, (3)
where Ci are the conversion factors for HI and CO line in-tensities, CHI = 1.82 × 10¹⁸H cm−2(K km−1)−1 and CH2 =2.0 × 10²⁰H2 cm−2(K km−1)−1.
Relating (r, l, b) to (X, Y, Z), we finally obtainni(X, Y, Z). This density is usually much higher than themean density calculated from moment 0 map. Figure 8 shows
c⃝ 0000 RAS, MNRAS 000, 000–000
5
Figure 8. Left: HI volume density averaged in the directions perpendicular to the Cartesian planes. Contours are at 2.5, 5, 7.5, ... H
cm−3. Right: Same, but for H2. Contours are at 5, 10, 15, .... H2 cm−3.
the obtained distributions of HI and H2 gas densities pro-jected on the Cartesian planes.
The 3D density distribution shows that the HI AquilaRift is extended over a length of L ∼ 2 kpc in the Y direc-tion. The height of the top is about Z ∼ 500 pc, and thewidth is approximately ∼ ±100 pc. From the 3D plots com-bined with the arched appearence shown in section 2, the HIarch may be roughly represented by a sinusoidal curve, asdrawn in the 3D figures. Here, the the approximate X dis-placement is ∼ 0.25 kpc, Y displacement of the node ∼ 0.2kpc, and amplitude ∼ 500 pc. The entire arch is tilted fromthe Y axis by ∼ 5◦ toward l ∼ 85◦ and from the verticalplane by ∼ 15◦ toward GC.
In figures 7 and 8 are also shown the derived 3D CO
maps. The kinematical distance to the CO Aquila Rift hasbeen estimated to be 640 ± 170 pc in our previous work(Sofue 2015). The height of the cloud center is z ∼ 60 pc,and the linear extent about 100 pc elongated in the lineof sight direction. The here obtaind 3D maps are consistentwith these estimation, as the data and method are the same.
The 3D structure of the entire Aquila Rift was thusobtained for the first time, displaying the HI and H2 gasdensities in the Cartesian coordinate system. Without such3D information with, we can neither calculate magntic fieldstrength, nor can compare with the numerical simulationsof the Parker instability, as discussed later.
c⃝ 0000 RAS, MNRAS 000, 000–000
6
Sun
HI
NGP Z
Y (l=90d)
GCX (l=0)
B
r
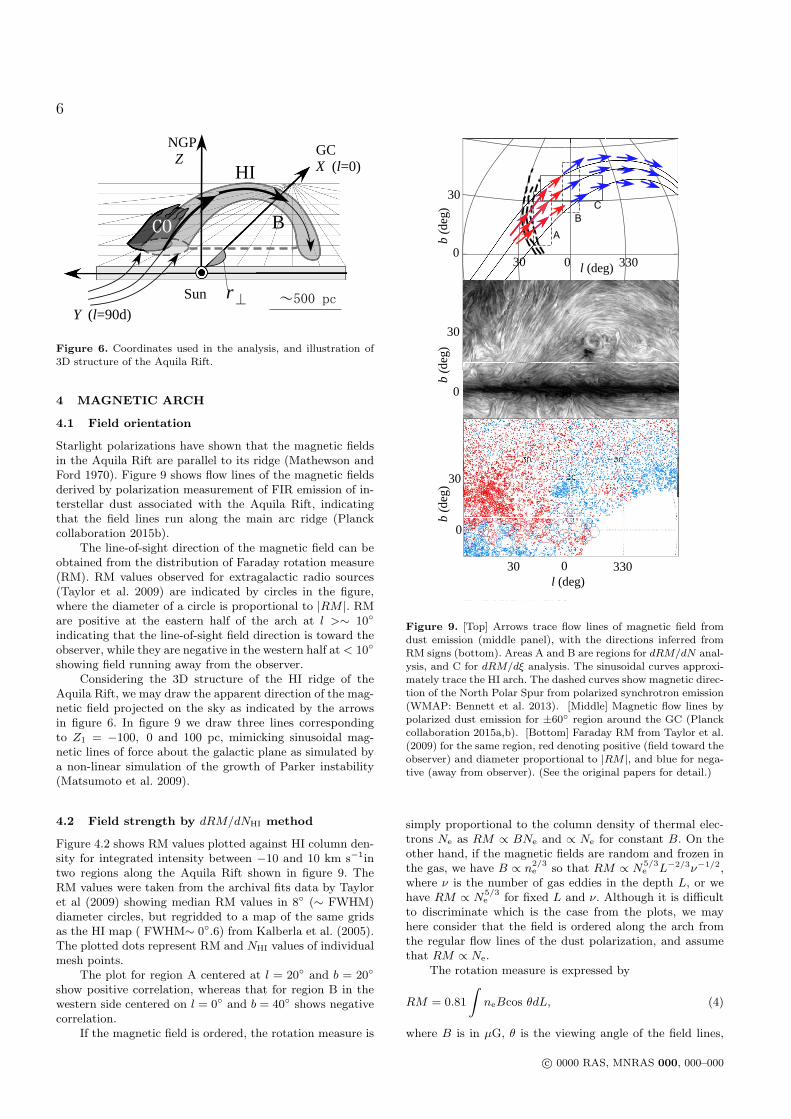
Figure 6. Coordinates used in the analysis, and illustration of3D structure of the Aquila Rift.
4 MAGNETIC ARCH
4.1 Field orientation
Starlight polarizations have shown that the magnetic fieldsin the Aquila Rift are parallel to its ridge (Mathewson andFord 1970). Figure 9 shows flow lines of the magnetic fieldsderived by polarization measurement of FIR emission of in-terstellar dust associated with the Aquila Rift, indicatingthat the field lines run along the main arc ridge (Planckcollaboration 2015b).
The line-of-sight direction of the magnetic field can beobtained from the distribution of Faraday rotation measure(RM). RM values observed for extragalactic radio sources(Taylor et al. 2009) are indicated by circles in the figure,where the diameter of a circle is proportional to |RM |. RMare positive at the eastern half of the arch at l >∼ 10◦
indicating that the line-of-sight field direction is toward theobserver, while they are negative in the western half at < 10◦
showing field running away from the observer.Considering the 3D structure of the HI ridge of the
Aquila Rift, we may draw the apparent direction of the mag-netic field projected on the sky as indicated by the arrowsin figure 6. In figure 9 we draw three lines correspondingto Z1 = −100, 0 and 100 pc, mimicking sinusoidal mag-netic lines of force about the galactic plane as simulated bya non-linear simulation of the growth of Parker instability(Matsumoto et al. 2009).
4.2 Field strength by dRM/dNHI method
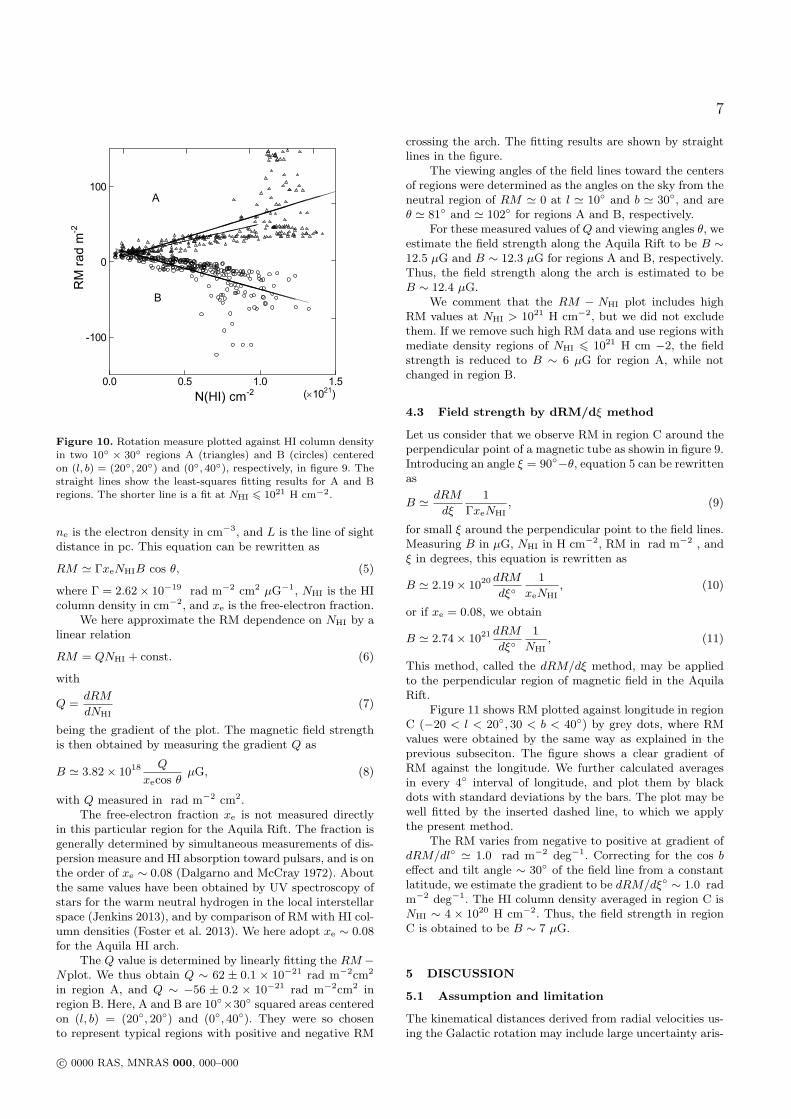
Figure 4.2 shows RM values plotted against HI column den-sity for integrated intensity between −10 and 10 km s−1intwo regions along the Aquila Rift shown in figure 9. TheRM values were taken from the archival fits data by Tayloret al (2009) showing median RM values in 8◦ (∼ FWHM)diameter circles, but regridded to a map of the same gridsas the HI map ( FWHM∼ 0◦.6) from Kalberla et al. (2005).The plotted dots represent RM and NHI values of individualmesh points.
The plot for region A centered at l = 20◦ and b = 20◦
show positive correlation, whereas that for region B in thewestern side centered on l = 0◦ and b = 40◦ shows negativecorrelation.
If the magnetic field is ordered, the rotation measure is
30
30
033030 0
b (d
eg)
l (deg)
-30-300
30
0
b (d
eg)
b (d
eg)
C
A
B
33030 0l (deg)
Figure 9. [Top] Arrows trace flow lines of magnetic field fromdust emission (middle panel), with the directions inferred from
RM signs (bottom). Areas A and B are regions for dRM/dN anal-ysis, and C for dRM/dξ analysis. The sinusoidal curves approxi-mately trace the HI arch. The dashed curves show magnetic direc-tion of the North Polar Spur from polarized synchrotron emission
(WMAP: Bennett et al. 2013). [Middle] Magnetic flow lines bypolarized dust emission for ±60◦ region around the GC (Planckcollaboration 2015a,b). [Bottom] Faraday RM from Taylor et al.(2009) for the same region, red denoting positive (field toward the
observer) and diameter proportional to |RM |, and blue for nega-tive (away from observer). (See the original papers for detail.)
simply proportional to the column density of thermal elec-trons Ne as RM ∝ BNe and ∝ Ne for constant B. On theother hand, if the magnetic fields are random and frozen inthe gas, we have B ∝ n
2/3e so that RM ∝ N
5/3e L−2/3ν−1/2,
where ν is the number of gas eddies in the depth L, or wehave RM ∝ N
5/3e for fixed L and ν. Although it is difficult
to discriminate which is the case from the plots, we mayhere consider that the field is ordered along the arch fromthe regular flow lines of the dust polarization, and assumethat RM ∝ Ne.
The rotation measure is expressed by
RM = 0.81
∫neBcos θdL, (4)
where B is in µG, θ is the viewing angle of the field lines,
c⃝ 0000 RAS, MNRAS 000, 000–000
7
RMradm-2
N(HI) cm-2
A
B
0.0 0.5 1.0 1.5
( 1021)
-100
0
100
Figure 10. Rotation measure plotted against HI column densityin two 10◦ × 30◦ regions A (triangles) and B (circles) centered
on (l, b) = (20◦, 20◦) and (0◦, 40◦), respectively, in figure 9. Thestraight lines show the least-squares fitting results for A and Bregions. The shorter line is a fit at NHI 6 1021 H cm−2.
ne is the electron density in cm−3, and L is the line of sightdistance in pc. This equation can be rewritten as
RM ≃ ΓxeNHIB cos θ, (5)
where Γ = 2.62 × 10⁻¹⁹ rad m−2 cm2 µG−1, NHI is the HIcolumn density in cm−2, and xe is the free-electron fraction.
We here approximate the RM dependence on NHI by alinear relation
RM = QNHI + const. (6)
with
Q =dRM
dNHI(7)
being the gradient of the plot. The magnetic field strengthis then obtained by measuring the gradient Q as
B ≃ 3.82 × 10¹⁸ Q
xecos θµG, (8)
with Q measured in rad m−2 cm2.The free-electron fraction xe is not measured directly
in this particular region for the Aquila Rift. The fraction isgenerally determined by simultaneous measurements of dis-persion measure and HI absorption toward pulsars, and is onthe order of xe ∼ 0.08 (Dalgarno and McCray 1972). Aboutthe same values have been obtained by UV spectroscopy ofstars for the warm neutral hydrogen in the local interstellarspace (Jenkins 2013), and by comparison of RM with HI col-umn densities (Foster et al. 2013). We here adopt xe ∼ 0.08for the Aquila HI arch.
The Q value is determined by linearly fitting the RM −Nplot. We thus obtain Q ∼ 62 ± 0.1 × 10⁻²¹ rad m−2cm2
in region A, and Q ∼ −56 ± 0.2 × 10⁻²¹ rad m−2cm2 inregion B. Here, A and B are 10◦×30◦ squared areas centeredon (l, b) = (20◦, 20◦) and (0◦, 40◦). They were so chosento represent typical regions with positive and negative RM
crossing the arch. The fitting results are shown by straightlines in the figure.
The viewing angles of the field lines toward the centersof regions were determined as the angles on the sky from theneutral region of RM ≃ 0 at l ≃ 10◦ and b ≃ 30◦, and areθ ≃ 81◦ and ≃ 102◦ for regions A and B, respectively.
For these measured values of Q and viewing angles θ, weestimate the field strength along the Aquila Rift to be B ∼12.5 µG and B ∼ 12.3 µG for regions A and B, respectively.Thus, the field strength along the arch is estimated to beB ∼ 12.4 µG.
We comment that the RM − NHI plot includes highRM values at NHI > 1021 H cm−2, but we did not excludethem. If we remove such high RM data and use regions withmediate density regions of NHI 6 1021 H cm −2, the fieldstrength is reduced to B ∼ 6 µG for region A, while notchanged in region B.
4.3 Field strength by dRM/dξ method
Let us consider that we observe RM in region C around theperpendicular point of a magnetic tube as showin in figure 9.Introducing an angle ξ = 90◦−θ, equation 5 can be rewrittenas
B ≃ dRM
dξ
1
ΓxeNHI, (9)
for small ξ around the perpendicular point to the field lines.Measuring B in µG, NHI in H cm−2, RM in rad m−2 , andξ in degrees, this equation is rewritten as
B ≃ 2.19 × 10²⁰ dRM
dξ◦1
xeNHI, (10)
or if xe = 0.08, we obtain
B ≃ 2.74 × 10²¹ dRM
dξ◦1
NHI, (11)
This method, called the dRM/dξ method, may be appliedto the perpendicular region of magnetic field in the AquilaRift.
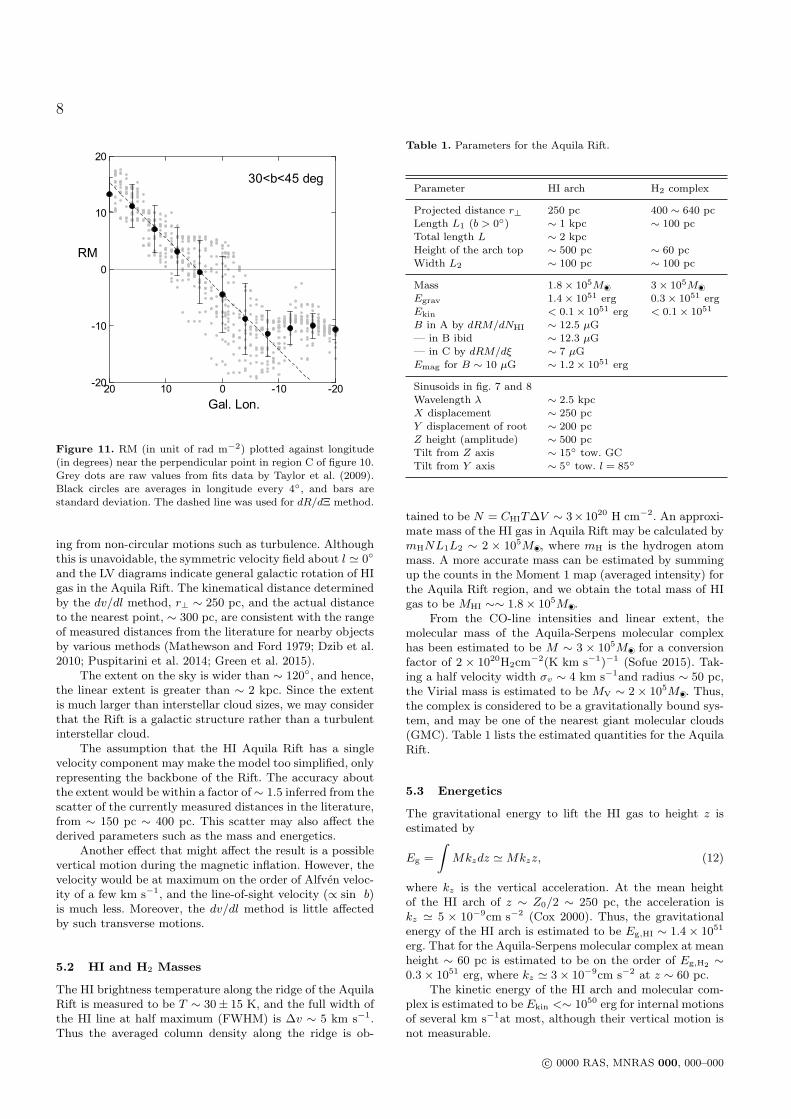
Figure 11 shows RM plotted against longitude in regionC (−20 < l < 20◦, 30 < b < 40◦) by grey dots, where RMvalues were obtained by the same way as explained in theprevious subseciton. The figure shows a clear gradient ofRM against the longitude. We further calculated averagesin every 4◦ interval of longitude, and plot them by blackdots with standard deviations by the bars. The plot may bewell fitted by the inserted dashed line, to which we applythe present method.
The RM varies from negative to positive at gradient ofdRM/dl◦ ≃ 1.0 rad m−2 deg−1. Correcting for the cos beffect and tilt angle ∼ 30◦ of the field line from a constantlatitude, we estimate the gradient to be dRM/dξ◦ ∼ 1.0 radm−2 deg−1. The HI column density averaged in region C isNHI ∼ 4 × 10²⁰ H cm−2. Thus, the field strength in regionC is obtained to be B ∼ 7 µG.
5 DISCUSSION
5.1 Assumption and limitation
The kinematical distances derived from radial velocities us-ing the Galactic rotation may include large uncertainty aris-
c⃝ 0000 RAS, MNRAS 000, 000–000
8
!
"#$%&'()%
*+,-,./&012
34+35++5+4+34+
35+
+
5+
4+
Figure 11. RM (in unit of rad m−2) plotted against longitude(in degrees) near the perpendicular point in region C of figure 10.
Grey dots are raw values from fits data by Taylor et al. (2009).Black circles are averages in longitude every 4◦, and bars arestandard deviation. The dashed line was used for dR/dΞ method.
ing from non-circular motions such as turbulence. Althoughthis is unavoidable, the symmetric velocity field about l ≃ 0◦
and the LV diagrams indicate general galactic rotation of HIgas in the Aquila Rift. The kinematical distance determinedby the dv/dl method, r⊥ ∼ 250 pc, and the actual distanceto the nearest point, ∼ 300 pc, are consistent with the rangeof measured distances from the literature for nearby objectsby various methods (Mathewson and Ford 1979; Dzib et al.2010; Puspitarini et al. 2014; Green et al. 2015).
The extent on the sky is wider than ∼ 120◦, and hence,the linear extent is greater than ∼ 2 kpc. Since the extentis much larger than interstellar cloud sizes, we may considerthat the Rift is a galactic structure rather than a turbulentinterstellar cloud.
The assumption that the HI Aquila Rift has a singlevelocity component may make the model too simplified, onlyrepresenting the backbone of the Rift. The accuracy aboutthe extent would be within a factor of ∼ 1.5 inferred from thescatter of the currently measured distances in the literature,from ∼ 150 pc ∼ 400 pc. This scatter may also affect thederived parameters such as the mass and energetics.
Another effect that might affect the result is a possiblevertical motion during the magnetic inflation. However, thevelocity would be at maximum on the order of Alfven veloc-ity of a few km s−1, and the line-of-sight velocity (∝ sin b)is much less. Moreover, the dv/dl method is little affectedby such transverse motions.
5.2 HI and H2 Masses
The HI brightness temperature along the ridge of the AquilaRift is measured to be T ∼ 30± 15 K, and the full width ofthe HI line at half maximum (FWHM) is ∆v ∼ 5 km s−1.Thus the averaged column density along the ridge is ob-
Table 1. Parameters for the Aquila Rift.
Parameter HI arch H2 complex
Projected distance r⊥ 250 pc 400 ∼ 640 pcLength L1 (b > 0◦) ∼ 1 kpc ∼ 100 pc
Total length L ∼ 2 kpcHeight of the arch top ∼ 500 pc ∼ 60 pcWidth L2 ∼ 100 pc ∼ 100 pc
Mass 1.8 × 10⁵M⊙• 3 × 10⁵M⊙•Egrav 1.4 × 1051 erg 0.3 × 1051 erg
Ekin < 0.1 × 1051 erg < 0.1 × 1051
B in A by dRM/dNHI ∼ 12.5 µG— in B ibid ∼ 12.3 µG— in C by dRM/dξ ∼ 7 µG
Emag for B ∼ 10 µG ∼ 1.2 × 1051 erg
Sinusoids in fig. 7 and 8
Wavelength λ ∼ 2.5 kpcX displacement ∼ 250 pcY displacement of root ∼ 200 pcZ height (amplitude) ∼ 500 pc
Tilt from Z axis ∼ 15◦ tow. GCTilt from Y axis ∼ 5◦ tow. l = 85◦
tained to be N = CHIT∆V ∼ 3×10²⁰ H cm−2. An approxi-mate mass of the HI gas in Aquila Rift may be calculated bymHNL1L2 ∼ 2 × 10⁵M⊙•, where mH is the hydrogen atommass. A more accurate mass can be estimated by summingup the counts in the Moment 1 map (averaged intensity) forthe Aquila Rift region, and we obtain the total mass of HIgas to be MHI ∼∼ 1.8 × 10⁵M⊙•.
From the CO-line intensities and linear extent, themolecular mass of the Aquila-Serpens molecular complexhas been estimated to be M ∼ 3 × 10⁵M⊙• for a conversionfactor of 2 × 10²⁰H2cm
−2(K km s−1)−1 (Sofue 2015). Tak-ing a half velocity width σv ∼ 4 km s−1and radius ∼ 50 pc,the Virial mass is estimated to be MV ∼ 2 × 10⁵M⊙•. Thus,the complex is considered to be a gravitationally bound sys-tem, and may be one of the nearest giant molecular clouds(GMC). Table 1 lists the estimated quantities for the AquilaRift.
5.3 Energetics
The gravitational energy to lift the HI gas to height z isestimated by
Eg =
∫Mkzdz ≃ Mkzz, (12)
where kz is the vertical acceleration. At the mean heightof the HI arch of z ∼ Z0/2 ∼ 250 pc, the acceleration iskz ≃ 5 × 10⁻⁹cm s−2 (Cox 2000). Thus, the gravitationalenergy of the HI arch is estimated to be Eg,HI ∼ 1.4 × 1051
erg. That for the Aquila-Serpens molecular complex at meanheight ∼ 60 pc is estimated to be on the order of Eg,H2 ∼0.3 × 1051 erg, where kz ≃ 3 × 10⁻⁹cm s−2 at z ∼ 60 pc.
The kinetic energy of the HI arch and molecular com-plex is estimated to be Ekin <∼ 1050 erg for internal motionsof several km s−1at most, although their vertical motion isnot measurable.
c⃝ 0000 RAS, MNRAS 000, 000–000
9
The magnetic energy in the HI arch at positive latitudeis estimated by assuming a magnetic tube of length L1 ∼L/2 and width L2 with constant field strength as
Emag ≃ B2
8πL1L
22, (13)
Inserting the measured strength B ∼ 10 µG at (l, b) ∼(20◦, 30◦), L1 ∼ 1 kpc and L2 ∼ 100 pc, we obtain the mag-netic energy of Emag ∼ 1.2× 1051 erg, which is comparableto the gravitational energy.
5.4 Magnetized HI arch anchored by MolecularComplex formed by Parker Instability
As to the origin of the Aquila Rift we may consider theParker (1966) instability. As shown in table 1 the magneticenergy of the arch is comparable to the total gravitationaland kinetic energy of the HI and H2 gases. If we assumethe pressure equilibrium between cosmic rays and magneticfield, the pressure is strong enough to raise the gas againstthe gravitational force, so that the condition for the growthof Parker instability is satisfied.
There have been a number of linear and non-linear anal-yses of the Parker instability (Elmegreen 1982; Matsumotoet al. 1990; Hanawa et al. 1992) as well as 2D and 3Dnumerical simulations (Santillan et al. 2000; Nozawa 2005;Mouschovias et al. 2009: Machida et al. 2009, 2013; Lee andHong 2011; Rodrigues et al. 2016). Formation of arched mag-netic structure associated with interstellar gas has been thuswell understood theoretically. The simulations showed thatthe instability can grow either in symmetric or asymmetricwaves with respect to the galactic plane.
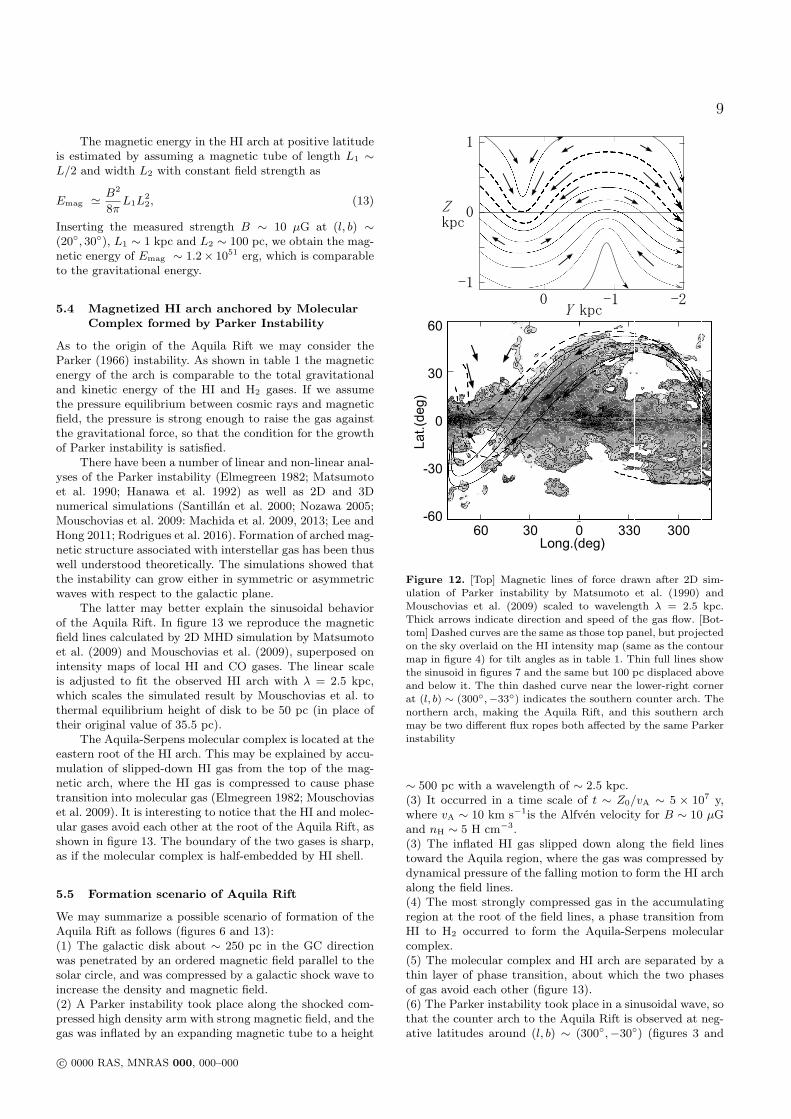
The latter may better explain the sinusoidal behaviorof the Aquila Rift. In figure 13 we reproduce the magneticfield lines calculated by 2D MHD simulation by Matsumotoet al. (2009) and Mouschovias et al. (2009), superposed onintensity maps of local HI and CO gases. The linear scaleis adjusted to fit the observed HI arch with λ = 2.5 kpc,which scales the simulated result by Mouschovias et al. tothermal equilibrium height of disk to be 50 pc (in place oftheir original value of 35.5 pc).
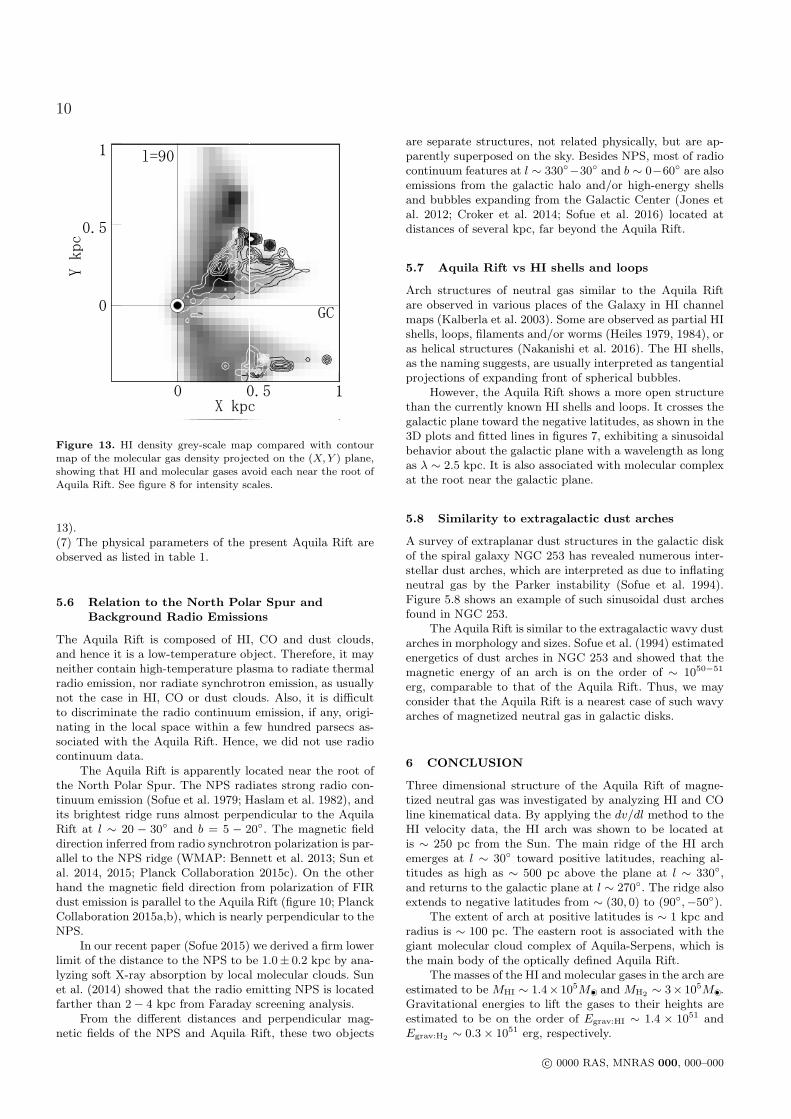
The Aquila-Serpens molecular complex is located at theeastern root of the HI arch. This may be explained by accu-mulation of slipped-down HI gas from the top of the mag-netic arch, where the HI gas is compressed to cause phasetransition into molecular gas (Elmegreen 1982; Mouschoviaset al. 2009). It is interesting to notice that the HI and molec-ular gases avoid each other at the root of the Aquila Rift, asshown in figure 13. The boundary of the two gases is sharp,as if the molecular complex is half-embedded by HI shell.
5.5 Formation scenario of Aquila Rift
We may summarize a possible scenario of formation of theAquila Rift as follows (figures 6 and 13):(1) The galactic disk about ∼ 250 pc in the GC directionwas penetrated by an ordered magnetic field parallel to thesolar circle, and was compressed by a galactic shock wave toincrease the density and magnetic field.(2) A Parker instability took place along the shocked com-pressed high density arm with strong magnetic field, and thegas was inflated by an expanding magnetic tube to a height
60 30 0 330 300Long.(deg)
60
30
0
-30
-60
Lat.(deg)
Figure 12. [Top] Magnetic lines of force drawn after 2D sim-ulation of Parker instability by Matsumoto et al. (1990) andMouschovias et al. (2009) scaled to wavelength λ = 2.5 kpc.
Thick arrows indicate direction and speed of the gas flow. [Bot-tom] Dashed curves are the same as those top panel, but projectedon the sky overlaid on the HI intensity map (same as the contourmap in figure 4) for tilt angles as in table 1. Thin full lines show
the sinusoid in figures 7 and the same but 100 pc displaced aboveand below it. The thin dashed curve near the lower-right cornerat (l, b) ∼ (300◦,−33◦) indicates the southern counter arch. Thenorthern arch, making the Aquila Rift, and this southern arch
may be two different flux ropes both affected by the same Parkerinstability
∼ 500 pc with a wavelength of ∼ 2.5 kpc.(3) It occurred in a time scale of t ∼ Z0/vA ∼ 5 × 10⁷ y,where vA ∼ 10 km s−1is the Alfven velocity for B ∼ 10 µGand nH ∼ 5 H cm−3.(3) The inflated HI gas slipped down along the field linestoward the Aquila region, where the gas was compressed bydynamical pressure of the falling motion to form the HI archalong the field lines.(4) The most strongly compressed gas in the accumulatingregion at the root of the field lines, a phase transition fromHI to H2 occurred to form the Aquila-Serpens molecularcomplex.(5) The molecular complex and HI arch are separated by athin layer of phase transition, about which the two phasesof gas avoid each other (figure 13).(6) The Parker instability took place in a sinusoidal wave, sothat the counter arch to the Aquila Rift is observed at neg-ative latitudes around (l, b) ∼ (300◦,−30◦) (figures 3 and
c⃝ 0000 RAS, MNRAS 000, 000–000
10
Figure 13. HI density grey-scale map compared with contourmap of the molecular gas density projected on the (X, Y ) plane,showing that HI and molecular gases avoid each near the root of
Aquila Rift. See figure 8 for intensity scales.
13).(7) The physical parameters of the present Aquila Rift areobserved as listed in table 1.
5.6 Relation to the North Polar Spur andBackground Radio Emissions
The Aquila Rift is composed of HI, CO and dust clouds,and hence it is a low-temperature object. Therefore, it mayneither contain high-temperature plasma to radiate thermalradio emission, nor radiate synchrotron emission, as usuallynot the case in HI, CO or dust clouds. Also, it is difficultto discriminate the radio continuum emission, if any, origi-nating in the local space within a few hundred parsecs as-sociated with the Aquila Rift. Hence, we did not use radiocontinuum data.
The Aquila Rift is apparently located near the root ofthe North Polar Spur. The NPS radiates strong radio con-tinuum emission (Sofue et al. 1979; Haslam et al. 1982), andits brightest ridge runs almost perpendicular to the AquilaRift at l ∼ 20 − 30◦ and b = 5 − 20◦. The magnetic fielddirection inferred from radio synchrotron polarization is par-allel to the NPS ridge (WMAP: Bennett et al. 2013; Sun etal. 2014, 2015; Planck Collaboration 2015c). On the otherhand the magnetic field direction from polarization of FIRdust emission is parallel to the Aquila Rift (figure 10; PlanckCollaboration 2015a,b), which is nearly perpendicular to theNPS.
In our recent paper (Sofue 2015) we derived a firm lowerlimit of the distance to the NPS to be 1.0± 0.2 kpc by ana-lyzing soft X-ray absorption by local molecular clouds. Sunet al. (2014) showed that the radio emitting NPS is locatedfarther than 2 − 4 kpc from Faraday screening analysis.
From the different distances and perpendicular mag-netic fields of the NPS and Aquila Rift, these two objects
are separate structures, not related physically, but are ap-parently superposed on the sky. Besides NPS, most of radiocontinuum features at l ∼ 330◦−30◦ and b ∼ 0−60◦ are alsoemissions from the galactic halo and/or high-energy shellsand bubbles expanding from the Galactic Center (Jones etal. 2012; Croker et al. 2014; Sofue et al. 2016) located atdistances of several kpc, far beyond the Aquila Rift.
5.7 Aquila Rift vs HI shells and loops
Arch structures of neutral gas similar to the Aquila Riftare observed in various places of the Galaxy in HI channelmaps (Kalberla et al. 2003). Some are observed as partial HIshells, loops, filaments and/or worms (Heiles 1979, 1984), oras helical structures (Nakanishi et al. 2016). The HI shells,as the naming suggests, are usually interpreted as tangentialprojections of expanding front of spherical bubbles.
However, the Aquila Rift shows a more open structurethan the currently known HI shells and loops. It crosses thegalactic plane toward the negative latitudes, as shown in the3D plots and fitted lines in figures 7, exhibiting a sinusoidalbehavior about the galactic plane with a wavelength as longas λ ∼ 2.5 kpc. It is also associated with molecular complexat the root near the galactic plane.
5.8 Similarity to extragalactic dust arches
A survey of extraplanar dust structures in the galactic diskof the spiral galaxy NGC 253 has revealed numerous inter-stellar dust arches, which are interpreted as due to inflatingneutral gas by the Parker instability (Sofue et al. 1994).Figure 5.8 shows an example of such sinusoidal dust archesfound in NGC 253.
The Aquila Rift is similar to the extragalactic wavy dustarches in morphology and sizes. Sofue et al. (1994) estimatedenergetics of dust arches in NGC 253 and showed that themagnetic energy of an arch is on the order of ∼ 1050−51
erg, comparable to that of the Aquila Rift. Thus, we mayconsider that the Aquila Rift is a nearest case of such wavyarches of magnetized neutral gas in galactic disks.
6 CONCLUSION
Three dimensional structure of the Aquila Rift of magne-tized neutral gas was investigated by analyzing HI and COline kinematical data. By applying the dv/dl method to theHI velocity data, the HI arch was shown to be located atis ∼ 250 pc from the Sun. The main ridge of the HI archemerges at l ∼ 30◦ toward positive latitudes, reaching al-titudes as high as ∼ 500 pc above the plane at l ∼ 330◦,and returns to the galactic plane at l ∼ 270◦. The ridge alsoextends to negative latitudes from ∼ (30, 0) to (90◦,−50◦).
The extent of arch at positive latitudes is ∼ 1 kpc andradius is ∼ 100 pc. The eastern root is associated with thegiant molecular cloud complex of Aquila-Serpens, which isthe main body of the optically defined Aquila Rift.
The masses of the HI and molecular gases in the arch areestimated to be MHI ∼ 1.4× 10⁵M⊙• and MH2 ∼ 3× 10⁵M⊙•.Gravitational energies to lift the gases to their heights areestimated to be on the order of Egrav:HI ∼ 1.4 × 1051 andEgrav:H2 ∼ 0.3 × 1051 erg, respectively.
c⃝ 0000 RAS, MNRAS 000, 000–000
11
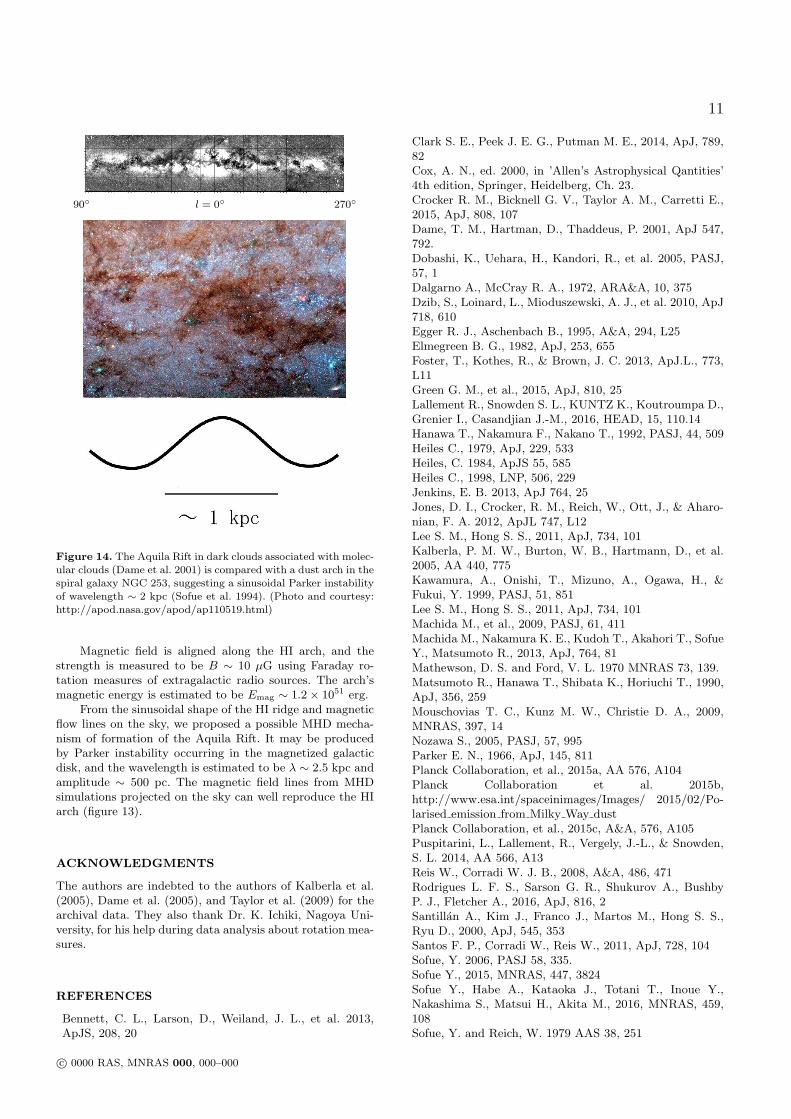
90◦ l = 0◦ 270◦
Figure 14. The Aquila Rift in dark clouds associated with molec-ular clouds (Dame et al. 2001) is compared with a dust arch in thespiral galaxy NGC 253, suggesting a sinusoidal Parker instability
of wavelength ∼ 2 kpc (Sofue et al. 1994). (Photo and courtesy:http://apod.nasa.gov/apod/ap110519.html)
Magnetic field is aligned along the HI arch, and thestrength is measured to be B ∼ 10 µG using Faraday ro-tation measures of extragalactic radio sources. The arch’smagnetic energy is estimated to be Emag ∼ 1.2 × 1051 erg.
From the sinusoidal shape of the HI ridge and magneticflow lines on the sky, we proposed a possible MHD mecha-nism of formation of the Aquila Rift. It may be producedby Parker instability occurring in the magnetized galacticdisk, and the wavelength is estimated to be λ ∼ 2.5 kpc andamplitude ∼ 500 pc. The magnetic field lines from MHDsimulations projected on the sky can well reproduce the HIarch (figure 13).
ACKNOWLEDGMENTS
The authors are indebted to the authors of Kalberla et al.(2005), Dame et al. (2005), and Taylor et al. (2009) for thearchival data. They also thank Dr. K. Ichiki, Nagoya Uni-versity, for his help during data analysis about rotation mea-sures.
REFERENCES
Bennett, C. L., Larson, D., Weiland, J. L., et al. 2013,ApJS, 208, 20
Clark S. E., Peek J. E. G., Putman M. E., 2014, ApJ, 789,82Cox, A. N., ed. 2000, in ’Allen’s Astrophysical Qantities’4th edition, Springer, Heidelberg, Ch. 23.Crocker R. M., Bicknell G. V., Taylor A. M., Carretti E.,2015, ApJ, 808, 107Dame, T. M., Hartman, D., Thaddeus, P. 2001, ApJ 547,792.Dobashi, K., Uehara, H., Kandori, R., et al. 2005, PASJ,57, 1Dalgarno A., McCray R. A., 1972, ARA&A, 10, 375Dzib, S., Loinard, L., Mioduszewski, A. J., et al. 2010, ApJ718, 610Egger R. J., Aschenbach B., 1995, A&A, 294, L25Elmegreen B. G., 1982, ApJ, 253, 655Foster, T., Kothes, R., & Brown, J. C. 2013, ApJ.L., 773,L11Green G. M., et al., 2015, ApJ, 810, 25Lallement R., Snowden S. L., KUNTZ K., Koutroumpa D.,Grenier I., Casandjian J.-M., 2016, HEAD, 15, 110.14Hanawa T., Nakamura F., Nakano T., 1992, PASJ, 44, 509Heiles C., 1979, ApJ, 229, 533Heiles, C. 1984, ApJS 55, 585Heiles C., 1998, LNP, 506, 229Jenkins, E. B. 2013, ApJ 764, 25Jones, D. I., Crocker, R. M., Reich, W., Ott, J., & Aharo-nian, F. A. 2012, ApJL 747, L12Lee S. M., Hong S. S., 2011, ApJ, 734, 101Kalberla, P. M. W., Burton, W. B., Hartmann, D., et al.2005, AA 440, 775Kawamura, A., Onishi, T., Mizuno, A., Ogawa, H., &Fukui, Y. 1999, PASJ, 51, 851Lee S. M., Hong S. S., 2011, ApJ, 734, 101Machida M., et al., 2009, PASJ, 61, 411Machida M., Nakamura K. E., Kudoh T., Akahori T., SofueY., Matsumoto R., 2013, ApJ, 764, 81Mathewson, D. S. and Ford, V. L. 1970 MNRAS 73, 139.Matsumoto R., Hanawa T., Shibata K., Horiuchi T., 1990,ApJ, 356, 259Mouschovias T. C., Kunz M. W., Christie D. A., 2009,MNRAS, 397, 14Nozawa S., 2005, PASJ, 57, 995Parker E. N., 1966, ApJ, 145, 811Planck Collaboration, et al., 2015a, AA 576, A104Planck Collaboration et al. 2015b,http://www.esa.int/spaceinimages/Images/ 2015/02/Po-larised emission from Milky Way dustPlanck Collaboration, et al., 2015c, A&A, 576, A105Puspitarini, L., Lallement, R., Vergely, J.-L., & Snowden,S. L. 2014, AA 566, A13Reis W., Corradi W. J. B., 2008, A&A, 486, 471Rodrigues L. F. S., Sarson G. R., Shukurov A., BushbyP. J., Fletcher A., 2016, ApJ, 816, 2Santillan A., Kim J., Franco J., Martos M., Hong S. S.,Ryu D., 2000, ApJ, 545, 353Santos F. P., Corradi W., Reis W., 2011, ApJ, 728, 104Sofue, Y. 2006, PASJ 58, 335.Sofue Y., 2015, MNRAS, 447, 3824Sofue Y., Habe A., Kataoka J., Totani T., Inoue Y.,Nakashima S., Matsui H., Akita M., 2016, MNRAS, 459,108Sofue, Y. and Reich, W. 1979 AAS 38, 251
c⃝ 0000 RAS, MNRAS 000, 000–000
12
Sofue, Y., Wakamatsu, K., and Malin, D. F. 1994, AJ 108,2102Sun, X. H., Gaensler, B. M., Carretti, E., et al. 2014, MN-RAS, 437, 2936Sun, X. H., Landecker, T. L., Gaensler, B. M., et al. 2015,ApJ 811, 40Sun, X. H., Gaensler, B. M., Carretti, E., et al. 2014, MN-RAS 437, 2936Weaver, H. F. 1949, ApJ, 110, 190Taylor A. R., Stil J. M., Sunstrum C., 2009, ApJ, 702, 1230Vidal M., Dickinson C., Davies R. D., Leahy J. P., 2015,MNRAS, 452, 656
c⃝ 0000 RAS, MNRAS 000, 000–000