three-dimensional reactive transport simulation of … · three-dimensional reactive transport...
TRANSCRIPT

1
Three-dimensional reactive transport simulation of the CCS demonstration project in Tomakomai, Hokkaido, Japan
Kohei Akaku1, Fumiaki Okumura1, Susumu Okubo1, Yusuke Wasaki1, Junji Yamamoto1, Hajime Yamamoto2, Yusuke Hiratsuka2, Takayasu Honda3 and Takahiro Nakajima4
1Japan Petroleum Exploration Co., Ltd. (JAPEX)
2Taisei Corporation 3Japan CCS Co., Ltd. (JCCS)
4Research Institute of Innovative Technology for the Earth (RITE)
INTRODUCTION
The Ministry of Economy, Trade and Industry of Japan has started a large-scale CCS
demonstration project in the Tomakomai area, Hokkaido. A geochemical reaction model was built
from the water analysis and mineralogical data gathered in the wells. The reaction model was
coupled with a field-scale reservoir model, and three-dimensional simulation studies were
conducted to predict the long-term behavior of CO2 including mineral trapping. We used
multiphase reactive geochemical transport code TOUGHREACT version 2.0 (Xu et al., 2011),
which was revised to enable parallel computing and consideration of hysteresis of relative
permeability for residual CO2 trapping. Thermoddem (http://thermoddem.brgm.fr), a
thermodynamic database which focuses on low temperature water/rock interaction including
zeolites and clay minerals was applied for the calculation.
GEOCHEMICAL MODEL
A target reservoir of the Tomakomai project is sandstone layers of the Moebetsu Formation at a
depth of approximately 1,100 m under the seabed. The sandstone contains quartz, plagioclase,
glauconite and biotite abundantly with K-feldspar, serpentinite, pyroxene and amphibole as primary
detrital minerals, whereas smectite (saponite), kaolinite, clinoptilolite, calcite and pyrite are
observed as diagenetic minerals. The formation water was sampled from the observation well OB-2
(Table 1). Based on the water analysis, we made a thermodynamic reconstruction of the water
composition by assuming equilibria with the diagenetic minerals, in addition to siderite, magnesite
and amorphous silica at formation temperature, 44°C, after the methods in Palandri and Reed
(2001). It was confirmed that the reconstructed formation water is markedly under-saturated with
respect to most of the detrital minerals and over-saturated with quartz, K-feldspar and chlorite to
some extent (Table 2).
The reactive surface areas of the minerals in the subsurface conditions are generally unknown.

2
Furthermore, the batch reaction simulations between the reconstructed formation water and
sandstone without CO2 injection showed that the geometric-based reactive surface areas equivalent
to the grain size of sandstone (e.g. Xu et al., 2011) were unrealistic because the calculated water
composition was unstable with time. Therefore, we reduced the reactive surface areas for the
under-saturated detrital minerals by 3-5 orders of magnitude; in addition, the precipitation of the
over-saturated minerals was suppressed to obtain nearly stable water composition through 10,000
years (Table 2). The sensitivity of the reactive surface area of glauconite was separately tested in
the following reactive transport simulations with CO2 injection because its correction was rather
insensitive to the long-term stability of the water composition in the batch simulations. As the
model with these corrections matched the field observation of diagenesis, we believe this model is
appropriate for predicting the long-term behavior of CO2 in the Moebetsu Formation.
Table 1
Analysis of the water in the Moebetsu formation and its thermodynamic reconstruction
Analyzed composition of waterfrom Tomakomai well OB-2
sampled on 19 Feb. 2013
Thermodynamically reconstructedwater composition
Formation Temperature (°C) 44pH 8.34 7.11mg/kg
Cl- 1942 1907
SO42- 9.16 9.20
HCO3- 731 608
HS- not analyzed 0.000111SiO2(aq) 74.4 165
Al3+ not detected 0.0000401
Ca2+ 78.5 39.1
Mg2+ 13.7 6.43
Fe2+ 0.30 0.85
K+ 26.6 26.7
Na+ 1365 1371
NH4+ 2.7 2.71
RemarksThe pH measured atatmospheric pressure and roomtemperature.
Equilibrium with pyrite, amorphoussilica, Na-clinoptilorite, kaolinite,siderite, magnesite, calcite, Fe-Na-saponite.
3
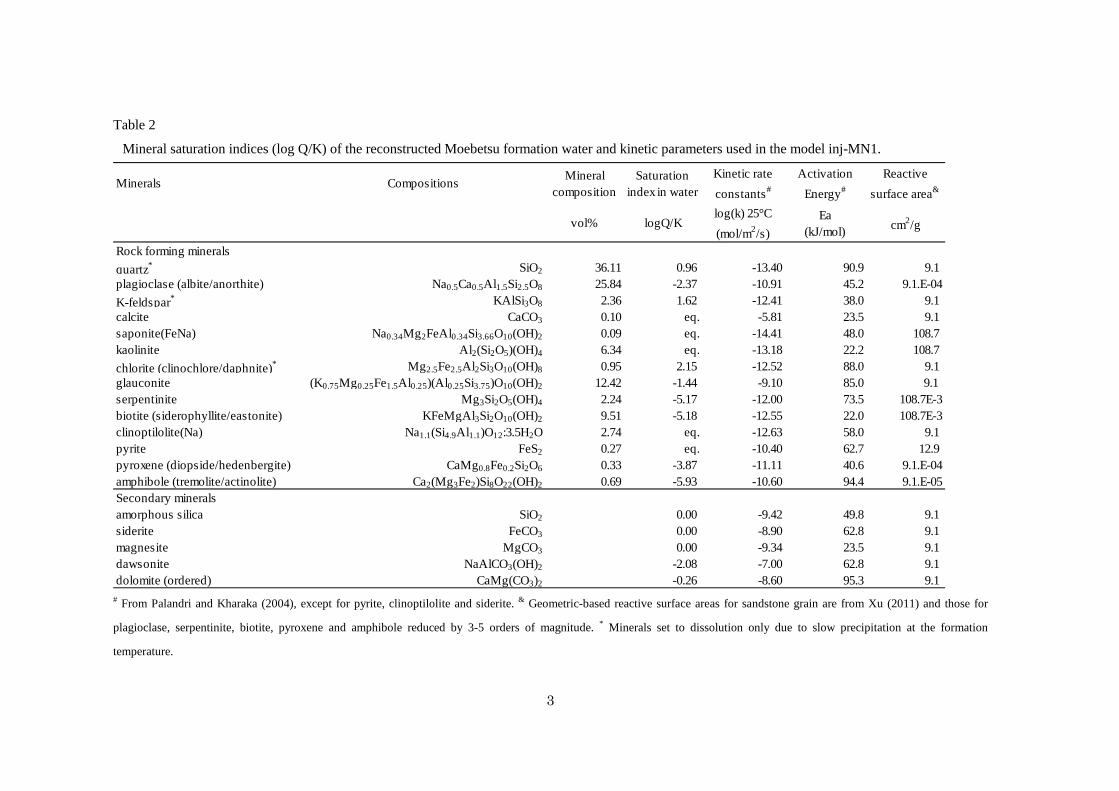
Table 2
Mineral saturation indices (log Q/K) of the reconstructed Moebetsu formation water and kinetic parameters used in the model inj-MN1.
# From Palandri and Kharaka (2004), except for pyrite, clinoptilolite and siderite. & Geometric-based reactive surface areas for sandstone grain are from Xu (2011) and those for
plagioclase, serpentinite, biotite, pyroxene and amphibole reduced by 3-5 orders of magnitude. * Minerals set to dissolution only due to slow precipitation at the formation
temperature.
Minerals Compositions Mineralcomposition
Saturationindex in water
Kinetic rateconstants#
ActivationEnergy#
Reactivesurface area&
vol% logQ/Klog(k) 25°C(mol/m2/s)
Ea(kJ/mol) cm2/g
Rock forming mineralsquartz* SiO2 36.11 0.96 -13.40 90.9 9.1plagioclase (albite/anorthite) Na0.5Ca0.5Al1.5Si2.5O8 25.84 -2.37 -10.91 45.2 9.1.E-04K-feldspar* KAlSi3O8 2.36 1.62 -12.41 38.0 9.1calcite CaCO3 0.10 eq. -5.81 23.5 9.1saponite(FeNa) Na0.34Mg2FeAl0.34Si3.66O10(OH)2 0.09 eq. -14.41 48.0 108.7kaolinite Al2(Si2O5)(OH)4 6.34 eq. -13.18 22.2 108.7chlorite (clinochlore/daphnite)* Mg2.5Fe2.5Al2Si3O10(OH)8 0.95 2.15 -12.52 88.0 9.1glauconite (K0.75Mg0.25Fe1.5Al0.25)(Al0.25Si3.75)O10(OH)2 12.42 -1.44 -9.10 85.0 9.1serpentinite Mg3Si2O5(OH)4 2.24 -5.17 -12.00 73.5 108.7E-3biotite (siderophyllite/eastonite) KFeMgAl3Si2O10(OH)2 9.51 -5.18 -12.55 22.0 108.7E-3clinoptilolite(Na) Na1.1(Si4.9Al1.1)O12:3.5H2O 2.74 eq. -12.63 58.0 9.1pyrite FeS2 0.27 eq. -10.40 62.7 12.9pyroxene (diopside/hedenbergite) CaMg0.8Fe0.2Si2O6 0.33 -3.87 -11.11 40.6 9.1.E-04amphibole (tremolite/actinolite) Ca2(Mg3Fe2)Si8O22(OH)2 0.69 -5.93 -10.60 94.4 9.1.E-05Secondary mineralsamorphous silica SiO2 0.00 -9.42 49.8 9.1siderite FeCO3 0.00 -8.90 62.8 9.1magnesite MgCO3 0.00 -9.34 23.5 9.1dawsonite NaAlCO3(OH)2 -2.08 -7.00 62.8 9.1dolomite (ordered) CaMg(CO3)2 -0.26 -8.60 95.3 9.1

4
ONE-DIMENSIONAL REACTIVE TRANSPORT SIMULATIONS
One-dimensional simulations of CO2 injection at a rate of 200,000 tons/year for 3 years coupled
with the geochemical models confirmed the dissolution of glauconite and precipitation of siderite
and magnesite, as prominent mineral leaching and trapping mechanisms of CO2. In the case where
the reactive surface area of glauconite was set to the geometric-based value, mineral trapping starts
in 10 years and reaches 85% of the injected CO2 at 1,000 years from start of CO2 injection
(inj-MN1 in Fig. 1). In contrast, the simulation where the reactive surface area was reduced by 4
orders of magnitude shows only 20% mineral trapping of the injected CO2 at 10,000 years
(inj-MN3 in Fig. 1).
Fig. 1. Results of one-dimensional simulations of CO2 injection for the Moebetsu formation. Figures
on the left hand side show the results of the model inj-MN1, whereas those on the right hand side are
the results of the model inj-MN3 where the reactive surface area of glauconite was reduced by 4
orders of magnitude. The upper figures show changes of CO2 distribution between phases
(“super-critical state”, so-called gas, “aqueous”, solubility trapped in water and “mineral”, trapped as
carbonate minerals) with time. The lower figures show changes in mineral abundance with time.
THREE-DIMENSIONAL SIMULATIONS
The geochemical models were coupled with a three-dimensional field-scale reservoir model and
simulation studies were conducted. The upward movement of CO2 driven by buoyancy forces is
0%
10%
20%
30%
40%
50%
60%
70%
80%
90%
100%
1 10 100 1000 10000
CO
2tra
pped
(%)
-2.0E+9
-1.5E+9
-1.0E+9
-5.0E+8
0.0E+0
5.0E+8
1.0E+9
1.5E+9
2.0E+9
1 10 100 1000 10000
Cha
nges
in m
iner
al a
bund
ance
(mol
)
Time since injection starts (years)
0%
10%
20%
30%
40%
50%
60%
70%
80%
90%
100%
1 10 100 1000 10000
CO
2tra
pped
(%)
-2.0E+9
-1.5E+9
-1.0E+9
-5.0E+8
0.0E+0
5.0E+8
1.0E+9
1.5E+9
2.0E+9
1 10 100 1000 10000
Cha
nges
in m
iner
al a
bund
ance
(mol
)
Time since injection starts (years)
glauconite
amorph silicasiderite
calcite
kaolinite
magnesite
Moebetsu, inj-MN1(1D)
pyrite
aqueous
super-critical mineral
aqueous
super-critical
mineral
glauconite
amorph silica
siderite
calcitekaolinitemagnesite
precipitation
dissolution
precipitation
dissolution
chloritechlorite
Moebetsu, inj-MN3(1D)

5
limited because much is trapped as residual CO2 in the model. The 3D simulation using the
inj-MN1 model gives results similar to the 1D simulation. However, the 3D simulation using the
model where the reactive surface area of glauconite was reduced by 4 orders of magnitude shows a
significant difference from the 1D result over 1,000 years, and the mineral trapping reaches 60 %
of the injected CO2 at 10,000 years (Fig. 2). We believe this is caused by the downward movement
of water saturated with CO2, which is slightly denser than the original formation water, and that the
gravity flow of the CO2 saturated water promotes mineral leaching and trapping (Fig. 3 and 4). The
mineralogical study showed that glauconite is abundant in the matrix of the sandstone, and
suggests that the latter case (inj-MN3-3D) with slow glauconite dissolution is the most reasonable
prediction.
Fig. 2. Results of three-dimensional simulations of CO2 injection for the model inj-MN1 and
inj-MN3 where the reactive surface area of glauconite was reduced by 4 orders of magnitude. The
super-critical CO2 includes residual trapped due to hysteresis of relative permeability. The others are
the same as the caption in Fig. 1.
CONCLUSIONS
We developed a geochemical model that successfully explains observed diagenesis of the
formation rocks as well as water analysis data by employing an appropriate thermodynamic
database. The reactive surface areas of minerals, generally unknown in the subsurface, were
0%
10%
20%
30%
40%
50%
60%
70%
80%
90%
100%
1 10 100 1000 10000
CO
2tra
pped
(%)
-1.0E+10
-5.0E+9
0.0E+0
5.0E+9
1.0E+10
1.5E+10
2.0E+10
1 10 100 1000 10000
Cha
nges
in m
iner
al a
bund
ance
(mol
)
Time since injection starts (years)
0%
10%
20%
30%
40%
50%
60%
70%
80%
90%
100%
1 10 100 1000 10000
CO
2tra
pped
(%)
-1.0E+10
-5.0E+9
0.0E+0
5.0E+9
1.0E+10
1.5E+10
2.0E+10
1 10 100 1000 10000
Cha
nges
in m
iner
al a
bund
ance
(mol
)
Time since injection starts (years)
glauconite
amorph silica
siderite
calcite
kaolinitemagnesite
Moebetsu, inj-MN1(3D)
pyrite
aqueous
super-critical mineral
Moebetsu, inj-MN3(3D)
aqueous
super-critical
mineral
glauconite
amorph silica siderite
calcitekaolinite
magnesite
precipitation
dissolution
precipitation
dissolution
residual trapped
chlorite
residual trapped

6
estimated based on the long-term stability of water composition. However, large uncertainties, in
the orders of magnitude, still remain in the long-term prediction of the mineral trapping associated
with the CO2 injection. More information on reactive surface areas at in situ reservoir conditions is
needed. We also recognized that the reactive transport simulation fully coupled with a
three-dimensional hydrodynamic model including residual trapping is important for the long-term
assessment of the CO2 behavior.
ACKOWLEDGEMENTS
This study was supported by the Ministry of Economy, Trade and Industry of Japan (METI),
Japan CCS Co., Ltd. (JCCS) and Research Institute of Innovative Technology for the Earth (RITE).
The authors would like to thank to all staff involved in the project.
REFERENCES
Palandri J. L. and Reed M. H. (2001) Reconstruction of in situ composition of sedimentary
formation waters. Geochim. Cosmochim. Acta 65, 1741–1767.
Palandri, J. and Kharaka, Y. (2004) A Compilation of Rate Parameters of Water–Mineral
Interaction Kinetics for Application to Geochemical Modeling. Report 2004-1068.
Xu, T., Spycher, N., Sonnenthal, E., Zhang, G., Zheng, L. and Pruess, K. (2011) TOUGHREACT
Version 2.0: A simulator for subsurface reactive transport under non-isothermal multiphase
flow conditions. Computers & Geosciences 37, 763-774.

7
Fig. 3. Results of three-dimensional simulations of CO2 injection for the Moebetsu formation (inj MN3 model). Molality of CO2 in aqueous phase
(mol/kg.H2O) on the plan view of layer K=41, around the bottom of the model (a) and the cross section of layer I=10 (b). Aqueous pH on the plan view of
layer K=41 (c) and the cross section of layer I=10 (d). The distributions in 3, 13, 103, 1,000, 5,000 and 10,000 years after CO2 injection starts respectively.
K=41
I=10
K=41
I=10
(a)
(b)
(c)
(d)
North North
North North

8
Fig. 4. Results of three-dimensional simulations of CO2 injection for the Moebetsu formation (inj MN3). Changes in abundance of glauconite (mol
m3.medium) on the plan view of layer K=41 (e) and the cross section of layer I=10 (f). Those for siderite on (g) and (h). The others are the same as the
caption in Fig. 3.
K=41
I=10
K=41
I=10
(e)
(f)
(g)
(h)
North North
North North