title issue date url 許諾条件により本文は2015/09/23に公開; …
TRANSCRIPT

RIGHT:
URL:
CITATION:
AUTHOR(S):
ISSUE DATE:
TITLE:
DECOMPOSITION BEHAVIORS OF VARIOUSCRYSTALLINE CELLULOSES BYHYDROTHERMAL TREATMENT(Dissertation_全文 )
Rosnah Abdullah
Rosnah Abdullah. DECOMPOSITION BEHAVIORS OF VARIOUS CRYSTALLINE CELLULOSESBY HYDROTHERMAL TREATMENT. 京都大学, 2014, 博士(エネルギー科学),
2014-09-24
https://doi.org/10.14989/doctor.k18606
許諾条件により本文は2015/09/23に公開; The original publication is available at Springer viahttp://dx.doi.org/10.1007/s10570-013-0022-4. The original publication is available at Springer viahttp://dx.doi.org/10.1007/s10570-014-0410-4. The original publication is available at Springer viahttp://dx.doi.org/10.1007/s10086-014-1401-7; Acknowlegdement in doctoral thesis needs to be given to the finalpublication and a link must be inserted to the publsihed article on Springer's website, by inserting the DO ...

1
DECOMPOSITION BEHAVIORS OF VARIOUS CRYSTALLINE
CELLULOSES BY HYDROTHERMAL TREATMENT
ROSNAH ABDULLAH

2
Contents
Chapter 1: Introduction
1.1 The Significance of Lignocellulose for Biofuels 6
1.2 Cellulose as Feedstocks for Bioethanol Production 7
1.3 Origin of Cellulose 8
1.3.1 Cellulose molecular structure 10
1.3.2 Crystalline structure 12
1.3.3 Crystalline polymorphs 12
1.3.3.1 Cellulose I 13
1.3.3.2 Cellulose II 14
1.3.3.3 Cellulose III 15
1.3.3.4 Cellulose IV 16
1.4 Decomposition of Cellulose for Bioethanol and Biochemical
Productions
18
1.4.1 Chemical treatments 19
1.4.1.1 Acid/alkali hydrolysis 19
1.4.1.2 Ionic liquid 20
1.4.2 Enzymatic treatments 20
1.4.3 Hydrothermal treatments 22
1.4.3.1 Sub/supercritical water 22
1.4.3.2 Hot-compressed water 23
1.5 Summative Description of This Dissertation 24
Chapter 2: Decomposition Behaviors of Celluloses as Studied for the
Residues
2.1 Introduction 26
2.2 Materials and Methods 27
2.2.1 Preparation of various cystalline celluloses 27
2.2.2 Determination of degree of polymerization and crystallinity of
the celluloses
27

3
2.2.3 Fourier transform-infrared analysis of residual celluloses 28
2.2.4 Treatment of the celluloses by semi-flow hot-compressed water 29
2.3 Results and Discussion 30
2.3.1 Characteristics of the starting celluloses 30
2.3.2 Evaluation of the residues of celluloses 32
2.4 Concluding Remarks 41
Chapter 3: Decomposition Behaviors of Celluloses by Enzymatic
Treatment
3.1 Introduction 42
3.2 Materials and Methods 43
3.2.1 Various crystalline celluloses and enzyme 43
3.2.2 Enzymatic hydrolysis for celluloses 43
3.2.3 Analyses of cellulose residues 43
3.2.4 Analysis of the supernatants 44
3.3 Results and Discussion 44
3.3.1 Evaluation of the cellulose residues 44
3.3.2 Evaluation of the supernatants 50
3.4 Concluding Remarks 51
Chapter 4: Decomposition Behaviors of Celluloses as Studied for the
Water-Soluble Products
4.1 Introduction 52
4.2 Materials and Methods 52
4.2.1 Various crystalline celluloses preparation 52
4.2.2 Degree of polymerization and crystallinity of the celluloses 53
4.2.3 Treatment of the celluloses by semi-flow hot-compressed water 53
4.2.4 Analytical methods 53
4
4.3 Results and Discussion 54
4.3.1 Decomposition kinetics of various crystalline celluloses 54
4.3.2 Quantification of water-soluble portions 58
4.4 Concluding Remarks 66
Chapter 5: Conversion of Cellulose III to Its Parent Cellulose in
Hydrothermal Treatment
5.1 Introduction 68
5.2 Materials and Methods 69
5.2.1 Preparation of cellulose III 69
5.2.2 Semi-flow hot-compressed water treatment and cellulose residue
analyses
69
5.3 Results and Discussion 69
5.3.1 The X-ray diffraction diagrams of celluloses IIII and IIIII 69
5.3.2 The X-ray diffraction patterns of celluloses IIII and IIIII 71
5.4 Concluding Remarks 75
Chapter 6: Molecular Dynamics Simulation on Decomposition
Behaviors of Celluloses
6.1 Introduction 77
6.2 Computational Procedures 79
6.3 Results and Discussion 81
6.3.1 Dynamics behaviors of the celluloses 81
6.3.2 Decomposition processes of celluloses Iβ and IVI 84
6.3.3 Decomposition process of cellulose II 86
6.3.4 Decomposition process of cellulose IIII 90
6.4 Concluding Remarks 96
5
Chapter 7: Concluding Remarks
7.1 Conclusions 98
7.2 Prospects for Future Researches 100
References 101
List of Publications and Award 120
Acknowledgements 123

6
CHAPTER 1
Introduction
1.1 The Significance of Lignocellulose for Biofuels
The current global issues on energy security and sustainability, as well as
serious environmental impacts from global warming have enforced us to look for
alternative energy resources. They are required to substitute petroleum-based fuels
and products in a large scale in order to help remedy the issues, as well as to satisfy
the increasing commodity needs of our society, particularly, in transportation sector
(Ribeiro et al. 2007; IEA 2012).
Biomass is seen as potential resources for biofuels (Kheshgi et al. 2000;
Fischer and Schrattenholzer 2001; UNEP 2009; IEA 2013). Its world primary
production is estimated to be around 1,900 billion dried tons/year (Whittaker 1970).
The plant biomass, known as lignocellulose, comprises cellulose, hemicellulose,
lignin and other polymeric constituents. It is considered as the most abundant organic
material on the earth and consists of non starch-based fibrous part of plant materials.
Lignocellulose is a carbon-neutral renewable resource. It does not add to the
greenhouse emission as it is environmentally benign which possibly reduces NOx
and SOx depending on the fossil-fuels displaced. Moreover, it appears to have a
significant economic potential given the fluctuating prices of the fossil fuels.
Due to the promising values of biomass for biofuel productions, policies and
acts have been documented. These essentially triggered the development of biofuels
demand by targets and blending quotas. Mandates for blending biofuels into vehicle
fuels had been enacted worldwide (REN21 2005). The recent targets define higher
levels of envisaged biofuels use in various countries. In general, most mandates
require blending 10–15 % ethanol with gasoline (U.S. EPA 2011).
The Renewable Fuel Standard (RFS) program has been revised to increase
the volume of renewable fuel blended into transportation fuel, from 34 billion
litres/year in 2008 to 136 billion litres/year by 2022 (U.S. EPA 2011). The revised
standards (RFS2) established new specific annual volume requirements for cellulosic
biofuels, biomass-based diesel, advanced biofuels and totally renewable fuel in

7
transportation fuel. Biofuels could increase their penetration significantly in all long-
term scenarios.
1.2 Cellulose as Feedstocks for Bioethanol Production
Cellulose production is approximated to be around 100 billion tons/year
(Hon 1994; Klemm et al. 2005). It exists as the framework substance in
lignocelluloses in the form of cellulose microfibrils, whereas hemicellulose presents
as the matrix substance associated with the cellulose. Lignin, on the other hand, is the
encrusting substance solidifying the cell wall associated with hemicellulose
(Fujita and Harada 2001). The schematic diagram of cellulose microfibrils is shown
in Fig. 1-1.
Fig. 1-1 The schematic diagram of cellulose mircrofibrils (Roelofsen 1965)
In recent decades, the cellulosic biofuel research, also known as ―the
advanced and conventional biofuels‖ has attracted much attention because of the
availability of cellulose (40-50 wt% of dry substance) in most lignocellulosic
biomass (Lynd et al. 1991; Fujita and Harada 2001). Due to the non-competing
properties with food and feed resources, cellulose has been considered as potential
feedstocks for bioethanol production.
In cellulose structure of the plant cell wall, identical to the building blocks,
glucoses are linked together by β-1,4 glucosidic linkages. This consequently
generates a linear, rigid and crystalline structure making it very resistant to biological
Glucan
chains
Hydrogen
Bonds
β- 1, 4-glucosidic lingkages
Cellulose
microfibrils

8
attack (Gray et al. 2006). These linkages can be broken down to form monomeric
sugars, such as glucose, essential for fermentation process. The main stream for
bioethanol production however is still based on food-based feedstocks, even though
potential supply of cellulosic biomass is far higher than that of food crops.
When starch- or sugar-containing feedstocks, such as corn or sugarcane are
used, the cost of raw material account for 40-70 % of the total ethanol production
cost (Classen et al. 1999). The utilization of such starch or sugar for energy resources
will compete with that for food products, leading to food shortage problems in the
future. In contrast, when inedible feedstocks are used as raw materials, it is possible
to produce large amounts of low-cost bioethanol (Wheals et al. 1999).
To attain the economical feasibility, a higher bioethanol yield is crucial.
However, to date the development of bioethanol production from cellulosic biomass
has been impeded by its great resistance to be hydrolyzed into sugars because of its
crystalline structures. In converting cellulose to bioethanol, a pretreatment process is
usually needed to render cellulose for more amenable and accessible towards
hydrolysis through various ways such as chemical, physico-chemical, enzymatic and
hydrothermal treatments. Though the cost of cellulosic biomass is perceived to be far
lower than that of food-based crops, the cost to obtain sugars from cellulose prior to
bioethanol production has historically been far too high to attract industrial interest.
Bioethanol production from cellulosic biomass generally follows these
sequences: pretreatment, enzymatic saccharification, fermentation, product recovery
and distillation. All the sequences steps are more or less the same, though various
pretreatment methods can be used. The enzyme will hydrolyze cellulose to form
fermentable sugars, and then convert to bioethanol by yeasts/bacteria.
1.3 Origin of Cellulose
Cellulose originates from a taxonomically diverse group of organisms
including plants, bacteria, fungi, tunicate and protists (Nakashima et al. 2004). Wood
plants are the general source of cellulose. The bacteria Acetobacter xylinum is a
common non-plant source of cellulose; others comprise tunicate cellulose
(e.g. Microcosmus fulcatus) which is produced by sea creatures, and protists which

9
mostly consist of unicellular microorganisms. All of them have the ability to
biosynthesize cellulose (Favier et al. 1995; Nakashima et al. 2004; Stone 2005).
Table 1-1 Chemical composition of some typical cellulose-containing materials
a Others include extractives, inorganics (ash), protein, wax and pectin;
b Rabemanolontsoa and Saka 2013;
c Hon 1996;
d Wang et al.2008;
e Kalita et al.
2013; f Fávaro et al. 2010
Despite the wide range of cellulose resources available, the current research
for bioethanol production is highly concentrated on wood plant cellulose
(Oilgae 2010; Bracmort 2013), which indirectly makes lignocelluloses as the major
source of cellulose. Typical cellulose-containing materials with their chemical
Biomass source Composition (g/g of oven-dried biomass basis)
Cellulose Hemicellulose Lignin Others a
Japanese beech b 0.439 0.284 0.240 0.036
Japanese cedar b 0.379 0.227 0.331 0.043
Bamboo b 0.394 0.311 0.206 0.079
Rice husk b
0.360 0.173 0.241 0.199
Wheat straw b 0.371 0.340 0.200 0.077
Corn cob b 0.343 0.328 0.180 0.140
Miscanthus b
0.337 0.248 0.223 0.170
Baggasse b
0.383 0.309 0.224 0.074
Oil palm trunk b
0.306 0.284 0.282 0.112
Nipa frond b 0.324 0.291 0.196 0.155
Corn stalks c
0.350 0.250 0.350 0.050
Cotton c
0.950 0.020 0.009 0.004
Flax (retted) c 0.712 0.206 0.022 0.060
Hemp c 0.702 0.224 0.057 0.017
Istle c 0.735 0.070 0.174 0.019
Jute d 0.654 0.176 0.144 0.025
Ramie e 0.701 0.098 0.093 0.067
Sisal f 0.560 0.240 0.090 0.011

10
composition are summarized in Table 1-1. Besides cellulose which is seen as the
main components in woods, hemicellulose, lignin and a comparably small amount of
other components such as extractives, inorganics (ash), protein, wax and pectin are
also present.
1.3.1 Cellulose molecular structure
Cellulose is a linear homopolysaccharides consisting of
β-1,4 D-glucopyranose units. The adjacent units are arranged so that glucosidic
oxygens point in opposite directions to form cellobiose, the actual repeating unit of
cellulose. The cellobiose units, illustrated in Fig. 1-2, are linked together to form an
extended, linear chain.
Fig.1- 2 The cellobiose unit of cellulose molecular structure
The parallel chains are later bonded each other by inter- and intra-molecular
hydrogen bonds forming cellulose molecules. The presence of inter-molecular
hydrogen bonds is responsible for the sheet-like nature of the native polymer,
whereas the intra-molecular hydrogen bonds are relevant with regards to the single-
chain conformation and stiffness. This resulted in aggregation of a highly crystalline
and paracrystalline regions of cellulose microfibrils. The products on the
combination of these microfibrils (~ 2-5 nm width) are cellulose fibers (Isogai 1994).
Due to the massive linkages, cellulose has becoming highly inert and resistant
to hydrolysis. This may explain why oligomers with a degree of polymerization (DP)
≥ 6 are practically insoluble, despite that the molecule itself has a hydrophilic
character. The physical properties, chemical reactivity and biological functions of
cellulose are essentially determined by this compact structure. In terms of its density
(1.5 x 10³ kg/m
3), cellulose fibers are stiffer (Young Modulus 50-130 GPa) and
HOO
HO
O
H
O
O
OH
HO
OH
OO
HO
OH
O
O
OH
HO
OH
OH
OH OH
Cellobiose repeating unit
n

11
stronger (1 GPa), when measured along the polymer length, than nylon, silk, chitin,
tendon, etc (Ashby et al. 1995).
The DP indicates the number of glucopyranose units in cellulose molecules.
On average, the DP of native celluloses is higher than that of the treated celluloses.
Table 1-2 reveals some examples to show the differences of DP on native and treated
celluloses (Heinze 1998; Zugenmaier 2008).
Table 1-2 Average DP evaluated from the molecular mass distribution of some
selected celluloses (a Heinze 1998;
b Zugenmaier 2008).
Cellulose DP
Native cellulose
Cotton b 10,000-15,000
Bacterial cellulose b
4,000-6,000
Ramie b
10,000
Flax b
9,000
Valonia b
25,000
Wood cellulose b
6,000-10,000
Treated cellulose
Cotton linters bleached b
1,000 -5,000
Avicel a
280
Chemical pulp bleached b
700
Sulfate pulp a 900-2000
Cellophane b
300
Rayon b
300-500
Cellulose acetate b
200-350
The DP of the treated celluloses on average is seen to be shorter i.e., < 5,000.
The soluble oligosaccharides are shorter fragments of cellulose with DP up to 12,
which are soluble and only slightly soluble for DP ≤ 6 and 6 < DP < 12, respectively
(Pereira et al. 1988; Zhang and Lynd 2004; Ehara and Saka 2005). The DP of a
molecule portrays its character, thus DP is seen as an important property for
cellulosic materials. There are many established DP test methods for cellulose, for
instance, cellulose dissolution in cupriethylenediamine solution (TAPPI 1982),

12
organic solvents or inorganic acids followed by derivatization or ionic solutions. The
DP of cellulose may be represented in terms of the number-average, weight-average
or viscosity-average and measured by diverse instruments such as osmometry, size-
exclusion chromatography or determination of reducing-end concentration,
cryoscopy etc (Zhang and Lynd 2005).
1.3.2 Crystalline structure
The crystalline structure of cellulose has been demonstrated by studies with
X-ray diffractometry (XRD), electron diffractometry, infrared (IR) spectroscopy,
Raman spectroscopy etc (Marchessault and Liang 1960; Sugiyama et al. 1991a,
1991b; Horii 2000; Fujita and Harada 2001). The cellulose crystallites are imperfect
in terms of crystallinity, crystalline size, cellulose molecules orientations and
crystalline purity (Isogai 1994). To determine the coordinates of all heavy atoms of
cellulose in a unit cell, various crystallographic planes are used to describe the unit
cell of cellulose (Gardiner and Sarko 1985; Isogai 1994; Langan et al. 2001;
Nishiyama et al. 2002, 2003; Wada et al. 2004a). In this chapter, the [001] direction
on an a-b plane is used to describe the projection of unit cells of cellulose.
1.3.3 Cellulose polymorphs
There have been extensive studies devoted for the investigation on cellulose
polymorphs (Gardner and Blackwell 1974; Hayashi et al. 1975; Sarko et al. 1976;
Isogai et al. 1989; French et al. 1993; Isogai 1994; Nishiyama et al. 2002, 2003;
Wada et al. 2004a, 2004b). The interest arises due to the vast abundance of cellulose
in nature and their technological utilization on a very large scale. Each of the
polymorphic form has a significant difference from the technological point of view,
and their presence in a cellulose-based product markedly affects their properties.
There are six known polymorphs of cellulose, namely celluloses I, II, IIII, IIIII,
IVI, and IVII, identified by their characteristic XRD patterns as well as 13
C nuclear
magnetic resonance (NMR) spectra. These celluloses can be prepared by various
methods and may be interconverted (Isogai 1994). The interconversion process of
these cellulose polymorphs is shown in Fig. 1-3 (Kroon-Baternburg et al. 1996).

13
Fig. 1-3 Polymorphy of celluloses (Kroon-Baternburg et al. 1996)
Native cellulose, also known as cellulose I, is abundant in nature and has
parallel arrangement of chains, whereas cellulose II can be prepared by two distinct
routes: mercerization by alkali treatment and regeneration through solubilization and
subsequent recrystallization. It is thermodynamically more stable in structure with an
antiparallel arrangement of the strands and some inter-sheet hydrogen bonds.
Celluloses IIII and IIIII can be prepared from celluloses I and II, respectively, by
treatment with liquid ammonia or organic amines. The swelling of cellulose from the
treatment is a simple and classical way to increase the accessibility of crystalline
cellulose (Da Silva Perez et al. 2003). On the other hand, celluloses IVI and IVII can
be obtained by heating celluloses IIII and IIIII, respectively, at 260 ˚C in pressurized
glycerol (Hayashi et al. 1975; Isogai 1994; O‘Sullivan 1997).
1.3.3.1 Cellulose I
Cellulose I has a monoclinic unit cell with space group P21 and parallel
arrangement of chains (Meyer and Misch 1937). It could be further classified into
two polymorphs, celluloses Iα and Iβ, whose detailed structures have been established
recently through synchrotron X-ray and neutron fiber diffraction studies (Atalla and
VanderHart 1984; Sugiyama et al. 1991a; French et al. 1993; Nishiyama et al. 2002,
2003). They are differences in their resonances of C-1 atoms i.e., singlet for
Cellulose I
Cellulose II
Cellulose IIII
Cellulose IIIII Cellulose IVII
Cellulose IVI
Glycerol Amines
Warm water
Mercerization
Regeneration
Glycerol
Warm water
Amines
Glycerol
Glycerol
Boiling acid
Boiling acid

14
cellulose Iα and a doublet for cellulose Iβ. This rather small difference indicates a
different hydrogen bonding pattern of the glucosidic linkages. Cellulose Iα is
described as a triclinic structure, with one cellulose chain per unit cell, whereas a
monoclinic with two chains per unit cell for cellulose Iβ. Their unit cell projections in
[001] directions are shown in Fig. 1-4.
Fig. 1-4 Sheet-like arrangements of celluloses Iα (Nishiyama et al. 2003) and Iβ
(Nishiyama et al. 2002)
Marine algal and bacterial celluloses are found to be rich in cellulose Iα with
the average mass (𝑚 ) of 63% (Isogai 1994), while ramie, cotton and wood are
dominated by cellulose Iβ with 𝑚 of about 80%. Cellulose Iβ chains are packed in a
more stable form in its unit cell than that of Iα (Yamamoto and Horii 1993). It has
also been shown that cellulose Iα is entirely transformed into cellulose Iβ phase
without losing its crystallinity, by hydrothermal treatment or by treatments with
various solvents (Wada et al. 2004a).
1.3.3.2 Cellulose II
Cellulose II has a two chain unit cell with space group P21 and has parallel
chain arrangement. It can be prepared from cellulose I by mercerization process, i.e.,
the intra-crystalline swelling of cellulose I in 17-22 % (w/v) aqueous sodium
Cellulose Iα Cellulose Iβ

15
hydroxide (NaOH), followed by decomposition of the intermediate via washing out
the NaOH (Kolpak et al. 1978; French et al. 1993; Zugenmaier 2008). The swelling
allows for reorganization of the chains and results in cellulose II when the swelling
agent is removed. Nevertheless, the molecular mechanism of the conversion during
the swollen state is largely unknown. It can also be prepared by regeneration process
by dissolving cellulose in a derivative-forming solvent and then reprecipitating it by
diluting in water. Both procedures lead to the same unit cells. The conversion of
cellulose I to cellulose II is generally considered to be irreversible. The unit cell
projection of cellulose II is shown in Fig. 1-5.
Fig. 1-5 Sheet-like arrangements of cellulose II (Langan et al. 2001)
1.3.3.3 Cellulose III
Cellulose III is an important cellulose allomorph because it is the basis for
composite cellulose. It is a low-temperature modification structure of cellulose
(Kulshreshtha 1979). Two crystalline cellulose structures IIII and IIIII that can be
prepared by treating cellulose I and cellulose II, respectively, with liquid ammonia or
organic amines, followed by washing with alcohol and drying in air (Marrinan and
Mann 1956; Hayashi et al. 1975; Chanzy et al. 1983; Isogai 1994). This conversion,
however, is reversible (Kroon-Baternburg et al. 1996; Wada 2001). The unit cells
for both allomorphs are found to be very similar, with some differences in intensities
of the meridional reflections only (Sarko et al. 1976). These findings were recently

16
supported by a comparison of the two similar X-ray fiber patterns of celluloses IIII
and IIIII. However, it is assumed that the two structures pack in quite different
fashion, parallel arrangements in cellulose IIII and anti-parallel in cellulose IIIII. This
is concluded from the fact that cellulose IIII can revert back by boiling water for 30
min (Roche and Chanzy 1981) or through a solvent complex to the parallel-packed
cellulose I and that cellulose IIIII can be converted by the same heat treatment to
antiparallel-packed cellulose II.
Fig. 1-6 Sheet-like arrangements of celluloses IIII and IIIII (Wada et al. 2004b)
Similar X-ray diagrams for celluloses IIII and IIIII were found and a two-
chain unit cell for cellulose IIII was proposed as in Fig. 1-6 (Wada et al. 2004b).
This idea was motivated by the necessity for two anti-parallel running chains in
cellulose IIIII and the almost identical X-ray patterns of the two structures.
1.3.3.4 Cellulose IV
In contrast with cellulose III, cellulose IV is a high modification structure of
cellulose (Kulshreshtha 1979). Celluloses IVI and IVII are produced by heating
celluloses IIII and IIIII, respectively, in a pressurized glycerol treatment for 30 min at
260 ˚C (Hayashi et al. 1975; Isogai, 1994). Glycerol acts as a protective plasticizing
medium, allowing the cellulose molecules to retain sufficient mutual mobility in
order to arrange themselves into another stable lattice at 250 ˚C. There is no
additional compound of cellulose and glycerol is formed during this conversion.

17
Figure 1-7 shows the structure of celluloses IVI and IVII. The XRD patterns
of celluloses IVI and IVII and their unit cells are very similar but their derived
structures can be distinguished upon heterogeneous acetylation. It is necessary to
convert cellulose I to cellulose IIII before its transformation into cellulose IVI
because of fibrillation of cellulose microfibrils. It makes them more accessible to the
reaction for conversion to cellulose IVI that occurred through the change to cellulose
IIII. The perfection of cellulose IVI depends on the crystallinity of the original
sample either the starting material being celluloses I or IIII.
Fig. 1-7 Projection of the celluloses IVI and IVII (Gardiner and Sarko 1985)
In a recent study using clodaphora, the structure of cellulose IVI was revealed
to contain lateral disorder of cellulose I (Wada et al. 2004a), agreeable with other
findings that cellulose IVI comprise mixtures of celluloses IVI (~ 60 %) and I
(Marrinan 1956; Isogai 1989; Newman 2008). In either case, the structure cannot be
termed as cellulose I, thus, it seems acceptable to consider it as cellulose IVI, like in
the literatures (Chanzy et al. 1979; Gardiner and Sarko 1985). A study was done on
disencrusted cellulose sub-elementary fibrils of the primary cell wall of cotton and
rose cells which lead to the conclusion that the two observed diffraction spots on the
equator agreed with that of cellulose IVI but not cellulose I (Chanzy et al. 1979).
The morphology of the heavily treated initial cellulose may facilitate a
rearrangement of the chains during the conversions as observed by Wada et al.
(2004a), which may be hindered through morphological restraints. In the case of the
Cellulose IVI Cellulose IVII

18
sub-elementary fibrils studied by Chanzy et al. (1979) the lateral disorder seemed to
be an intrinsic property of the fibrils and cannot be erased by treatments normally
leading to cellulose I (Zugenmaier 2008).
1.4 Decomposition of Cellulose for Bioethanol and Biochemical Productions
The decomposition of cellulose has been receiving considerable attention for
both bioethanol and biochemical productions. Hydrolysis of cellulose, especially
involving high temperature and pressure, is very often not only producing sugars
alone, but also other degraded products (through dehydration and fragmentation)
such as furfural, erythrose etc (Antal and Mok 1990a; Ehara et al. 2002;
Phaiboonsilpa et al. 2010). For this reason, it is safe and valid to define the process of
breaking down of cellulose as decomposition of cellulose which literally includes
either/both hydrolysis or/and degradation processes.
Numerous methods on physico-chemical, chemical, enzymatic and
hydrothermal treatments have been utilized worldwide for decomposition of
cellulose, in order to obtain sugar molecules, particularly, glucose for further
fermentation process (Eriksson 1982; Bobleter et al. 1983; McMillan 1994; Bjeree
et al. 1996; Ando et al. 2000; Aden et al. 2002; Kumar et al. 2010; Mittal et al. 2011).
In literatures, the methods are mostly described as pretreatment steps for
lignocellulosic materials because cellulose is associated with hemicellulose which is
encrusted with lignin.
This study focuses on cellulose, thus it would rather be described as treatment
technology for cellulose decomposition. Some selected well-known treatment
technologies that will be discussed broadly are classified into chemical, enzymatic
and hydrothermal treatments. It is also common to have one or more combinations of
treatment methods for cellulose decomposition such as acid hydrolysis followed by
enzymatic treatment etc.
Despite of various methods available and applied, the two main key limiting
factors for cellulose decomposition are still on existing, (1) the accessibility of the
surface contact of cellulose and (2) cellulose crystallinity (Xiao et al. 2011). The
reduction on these factors would significantly improve the decomposition process
(McMillan 1994). In addition, better sugar yields can be obtained if the formation of

19
sugars or the ability to subsequently produce sugars by enzymatic hydrolysis can be
improved and the degradation or loss of carbohydrates can be avoided during the
process of cellulose decomposition (Sun and Cheng 2002).
1.4.1 Chemical treatments
1.4.1.1 Acid/alkali hydrolysis
The acid/alkali hydrolysis methods are widely used for cellulose
decomposition. These treatments increase surface area and reduce the cellulose
crystallinity due to structural swelling and dissolution. There are two types of
cellulose swelling involved, inter-crystalline and intra-crystalline. Inter-crystalline
swelling can be affected by water, whereas intra-crystalline swelling requires a
chemical agent for breaking the hydrogen bonding of the cellulose.
Acid hydrolysis can be performed with several types of acids, including
sulfuric, hydrochloric, phosphoric, formic etc and can be either concentrated or
diluted (Harris and Beglinger 1946; Camacho et al. 1996). Processes involving
concentrated acids are operated at low temperature and give high yields (e.g., 90 %
of theoretical glucose yield). However, a large amount of acids used cause problems
associated with toxicity to the environments, corrosion and energy demand for acid
recovery process (Jones and Semrau 1984). The concentrated acid must be recovered
after hydrolysis to make the process economically feasible (Sivers and Zacchi 1995).
On the other hand, dilute acid hydrolysis requires high temperature treatment for
acceptable conversion rates of cellulose to glucose. Unfortunately, acidity and high
temperature increase both the rate of cellulose hydrolysis and the rate of
decomposition of glucose products (Jones and Semrau 1984; McMillan 1994).
Alkali hydrolysis is usually used to enhance enzymatic hydrolysis of
cellulosic materials (Karr and Holzapple 2000). The main reagents used for this
process is NaOH, ammonia, calcium hydroxide, and oxidative alkali. Dilute NaOH
aqueous solution causes disruption of carbohydrate linkages and swelling of
cellulose, a reduction of cellulose crystallinity, an increase in surface area and a
decrease in the DP.

20
1.4.1.2 Ionic liquid
Ionic liquids are a group of new organic salts that exist as liquids at a
relatively low temperature. They are chemically and thermally stable, non-flammable
and have low volatility (Zhu et al. 2006). These properties can be tuned to
dissolve/liquefy a wide variety of compounds including cellulose.
Liquefaction of cellulose in ionic liquids, such as 1-ethyl-3-
methylimidazolium chloride (Miyafuji et al. 2009), 1-butyl-3-methylimidazolium
chloride (Sievers et al. 2009), 1-allyl-3-methylimidazolium chloride (Zhu et al. 2006),
1-ethyl-3-methylimidazolium acetate (Lee et al. 2009; Cetinkol et al. 2010) etc. and
their subsequent regeneration to amorphous cellulose by using anti-solvent such as
water, ethanol, methanol, acetone has gained many research interests. Cellulose
crystalline structure is observed to be gradually broken down in ionic liquid
treatment (Miyafuji et al. 2009). The hydrolysis rate of regenerated cellulose is
significantly increased and the initial rates of hydrolysis are approximated to be in
the order of magnitude higher than that of untreated cellulose (Dadi et al. 2006).
While, a nearly complete conversion of the carbohydrate fraction into water-soluble
(WS) products is readily observed at 120 ˚C in ionic liquids, which is lower than the
temperatures typically applied for aqueous-phase hydrolysis (Sievers et al. 2009).
After regeneration of celluloses, the ionic liquids can be recovered and reused,
however the cost and recycling of ionic liquid are the major disadvantage of the
process.
1.4.2 Enzymatic treatments
Enzymatic treatment, also known as enzymatic saccharification, is a slow
process and the extent of hydrolysis is influenced by the structural properties such as
cellulose crystallinity, surface area, DP and porosity (Mittal et al. 2011). It is carried
out by a highly specific enzyme called cellulase (Béguin and Aubert 1994). The
products of the treatment are usually monosaccharides such as glucose, though some
cellobiose could still present in the end results as products.
The enzymatic hydrolysis has low energy consumption because it is usually
conducted at mild conditions (pH 4.8-5.0, ≤ 50 ˚C), has low waste disposal and no

21
corrosion problems (Duff and Murray 1996; Mittal et al. 2011). However, some
challenges such as the retardation of hydrolysis rate, high cellulose loading and little
knowledge about the cellulose kinetics are very commonly faced. The cellulase can
be produced from both bacteria and fungi, however the cellulase excreted from
bacteria is more complicated than that of fungi as it is produced as intracellular
enzyme. These microorganisms can be aerobic or anaerobic, mesophilic or
thermophilic.
Bacteria belonging to species such as Clostridium, Cellulomonas,
Thermomonospora, Ruminococcus etc can produce cellulase (Bisaria 1991). Among
those, Cellulomonas fimi and Thermomonospora fusca have been extensively studied
for cellulase production. Many cellulolytic bacteria, particularly the cellulolytic
anaerobes such as Clostridium thermocellum and Bacteroides cellulosolvens produce
cellulases with high specific activity but do not produce high enzyme titres (Duff and
Murray 1996). They have a very low growth rate and require anaerobic growth
conditions, thus, most research for commercial cellulase production has focused on
fungi. Fungi that have been reported to produce cellulases include Sclerotium rolfsii,
Phanerohaete chrysosporium and species of Trichoderma, Aspergillus and
Penicillium (Fan et al. 1987; Duff and Murray 1996). From these, Trichoderma has
been most extensively studied for cellulase production (Sternberg 1976).
Cellulases are usually composed of 3 major components that are involved in
the treatment process: (1) endoglucanase - attacks regions of low crystallinity in the
cellulose fiber to create free chain-ends; (2) cellobiohydrolase - degrades the
molecule further by removing cellobiose units from the free chain-ends; and
(3) β-glucosidase - hydrolyses cellobiose to produce glucose (Sun and Cheng 2002).
During the treatment, cellulose is decomposed by the cellulase to reducing sugars
from its long chains, which can be fermented by yeasts/bacteria to produce ethanol
(Wright 1998).

22
1.4.3 Hydrothermal treatments
1.4.3.1 Sub/supercritical water
Water has a relatively high critical point (374 ˚C/22.1 MPa) due to the strong
interaction between the molecules that are caused by numerous hydrogen bonds.
Liquid water below the critical point is referred as subcritical water whereas water
above the critical point is termed supercritical water. Both density and dielectric
constant of the water medium play major roles in solubilizing different compounds.
At these conditions, water becomes a good solvent for cellulose so that its
decomposition can take place without any catalysts, resulting in the efficient
conversion into various WS saccharides (Antal and Mok 1990b; Minowa et al. 1998;
Ando et al. 2000; Sasaki et al. 2002; Kamio et al. 2006).
When water is heated, hydrogen bondings start to weaken, allowing the
dissociation of water into acidic hydronium ions (H3O+) and basic hydroxide ions
(OH−). The structure of water changes significantly near the critical point because of
the breakage of infinite network of hydrogen bonds (Kalinichev and Churakov
1999). In fact, dielectric constant of water decreases considerably near the critical
point, which causes a change in the dynamic viscosity and also increases self-
diffusion coefficient of water (Marcus 1999).
In the sub/supercritical region, higher ionic products exist, therefore, higher
H+ and OH
− ion concentrations compared to ambient water, which offers a highly
interesting reaction medium for hydrolysis process. Acid neutralization is not
required because the H+ ion concentration is a function of temperature and decreases
when the temperature is lowered.
The intermediates formed during the reactions show a high solubility in
sub/supercritical water; hence reaction steps are mainly homogeneous. Diffusion
related problems such as mass transfer through the interface are not encountered in
homogeneous reaction (Kruse and Gawlik 2003; Peterson et al. 2008). The physical
properties such as viscosity, ionic products, density, dielectric constant and heat
capacity, change dramatically in the sub/supercritical regions with only a small
change in the temperature or pressure, resulting in a substantial increase in the rates
of chemical reactions (Franck 1987; Savage 1999). These substantial changes in the

23
physical and chemical properties of water in the vicinity of its critical point can be
utilized advantageously for cellulose decomposition (Dinjus and Kruse 2004;
Peterson et al. 2008).
Sasaki et al. (2000, 2003) suggested that cellulose hydrolysis at high
temperature takes place with liquefaction in water. This is probably because of the
cleavage of intra- and inter-molecular hydrogen bondings in the cellulose crystal.
The decomposition rate of cellulose in subcritical water treatment was found to be
extremely high, however, the hydrolysis rate of cellulose was much lower than the
degradation rate of glucose and its oligomers (Sasaki et al. 1998). While in another
study (Saka and Ueno 1999), cellulose was rapidly decomposed in supercritical
water for 5-10 s to produce cellobiose, glucose and levoglucosan. However, glucose
was further degraded due to the high temperature of the supercritical water treatment.
1.4.3.2 Hot-compressed water
Several years ago, it was clarified that high pressure (40-70 MPa) and high
temperature (350-400 ˚C) enhanced the dehydration of glucose to
5-hydromethylfurfural (5HMF) that caused inhibitory effect to the subsequent
fermentation process (Aida et al. 2007). Moreover, the economic and environmental
constrains limit the applicability of these subcritical/supercritical methods (Liu and
Wyman 2005). As a result, hot-compressed water (HCW) appears as a better option
for decomposition of cellulose.
The HCW refers to the water at sub/supercritical state, or at sufficiently high
pressure and temperature (Phaiboonsilpa 2010). It has a milder condition process
with high ionic products as compared to sub/supercritical water treatment,
environmentally friendly characteristics and attractive reaction media for a variety of
applications (Ando et al. 2000; Rogalinski et al. 2008).
The HCW system can be categorized as batch- and flow-type systems
(Kusdiana et al. 2002). The decomposition reaction of cellulose is dominant in
batch-type reaction; therefore, a flow-type HCW treatment is preferable (Ehara
et al. 2002; Liu and Wyman 2003). Another kind of HCW system is a semi-flow type.
It resulted better digestible cellulose (Xiao et al. 2011), greater removal of lignin
(Tirtowidjojo et al. 1988), higher sugar recovery from hemicelluloses (Bobleter et al.

24
1983) and less inhibitors in the hydrolyzed liquid as compared with the conventional
batch and co-current flow systems (Liu and Wyman 2003).
Recently, the two-step semi-flow HCW treatments were used to study the
chemical conversion of lignocellulosic biomass (Lu et al. 2009; Phaiboonsilpa 2010;
Phaiboonsilpa et al. 2010, 2011) and revealed that 230 ˚C/10 MPa/15 min and
270 ˚C/10 MPa/15 min were, respectively, the optimum conditions for
decomposition of hemicellulose and cellulose. It was shown that the main reaction of
saccharides involve hydrolysis, dehydration and fragmentation.
1.5 Summative Description of This Dissertation
While cellulose decomposition has been prominent for bioethanol and
biochemical productions around the world, the study on the decomposition has been
primarily limited to only celluloses I, II and IIII by using conventional methods.
Therefore, it is the aim of this dissertation to study in depth on decomposition
behaviors of various crystalline celluloses (I, II, IIII, IIIII, IVI and IVII) by
hydrothermal treatment. It specifically focuses on the fundamental understanding of
the reactions involved in the treatment by investigating the hydrothermal conversion
of various crystalline celluloses and additionally, to determine quantitatively various
hydrolyzed and degraded products obtained.
The Chapter 1 of this dissertation has been covered as introduction that
discussed on the importance of lignocellulosic resources, cellulose backgrounds and
the trends on cellulose decomposition treatments by diverse methods starting with
conventional to the newly developed technologies, discussion of their advantages and
weaknesses, as well as the issues that lead to the importance of the current study.
In Chapter 2, various crystalline celluloses were prepared as feedstocks. By
using semi-flow HCW system as the treatment medium, decomposition behaviors of
the celluloses at 230-270 ˚C/10 MPa/2-15 min were studied thoroughly. This chapter
focused principally on understanding the changes in the physical characteristics of
these celluloses such as the DP and crystallinity. It was observed that the crystallinity
remained unaffected during the treatment, whereas the DP decreased with treatment
temperatures. This study revealed that the decomposition behaviors were dependent
on the different crystalline forms of the starting celluloses.
25
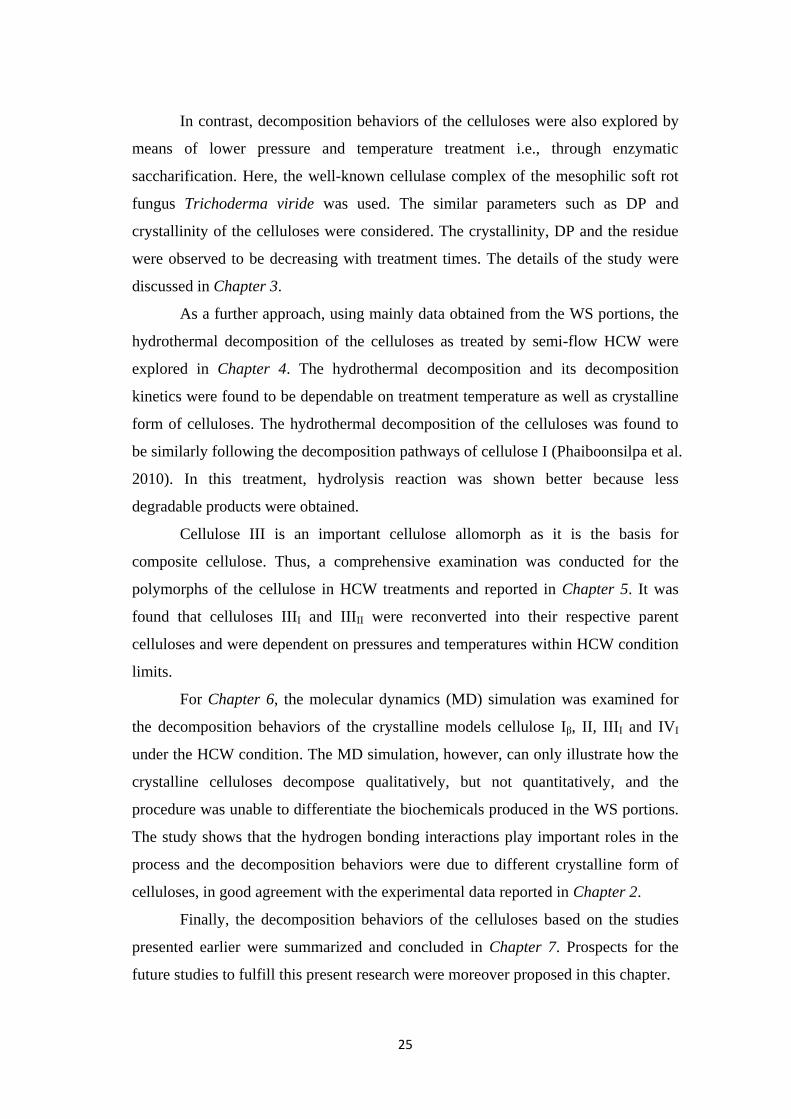
In contrast, decomposition behaviors of the celluloses were also explored by
means of lower pressure and temperature treatment i.e., through enzymatic
saccharification. Here, the well-known cellulase complex of the mesophilic soft rot
fungus Trichoderma viride was used. The similar parameters such as DP and
crystallinity of the celluloses were considered. The crystallinity, DP and the residue
were observed to be decreasing with treatment times. The details of the study were
discussed in Chapter 3.
As a further approach, using mainly data obtained from the WS portions, the
hydrothermal decomposition of the celluloses as treated by semi-flow HCW were
explored in Chapter 4. The hydrothermal decomposition and its decomposition
kinetics were found to be dependable on treatment temperature as well as crystalline
form of celluloses. The hydrothermal decomposition of the celluloses was found to
be similarly following the decomposition pathways of cellulose I (Phaiboonsilpa et al.
2010). In this treatment, hydrolysis reaction was shown better because less
degradable products were obtained.
Cellulose III is an important cellulose allomorph as it is the basis for
composite cellulose. Thus, a comprehensive examination was conducted for the
polymorphs of the cellulose in HCW treatments and reported in Chapter 5. It was
found that celluloses IIII and IIIII were reconverted into their respective parent
celluloses and were dependent on pressures and temperatures within HCW condition
limits.
For Chapter 6, the molecular dynamics (MD) simulation was examined for
the decomposition behaviors of the crystalline models cellulose Iβ, II, IIII and IVI
under the HCW condition. The MD simulation, however, can only illustrate how the
crystalline celluloses decompose qualitatively, but not quantitatively, and the
procedure was unable to differentiate the biochemicals produced in the WS portions.
The study shows that the hydrogen bonding interactions play important roles in the
process and the decomposition behaviors were due to different crystalline form of
celluloses, in good agreement with the experimental data reported in Chapter 2.
Finally, the decomposition behaviors of the celluloses based on the studies
presented earlier were summarized and concluded in Chapter 7. Prospects for the
future studies to fulfill this present research were moreover proposed in this chapter.

26
CHAPTER 2
Decomposition Behaviors of Celluloses as Studied for the Residues
2.1 Introduction
For the past three decades, hydrothermal treatment, such as hot-compressed
water (HCW), has attracted much attention due to its suitability as a non-toxic, an
environmentally benign, a non-catalytic and an inexpensive medium for
lignocelluloses hydrolysis (Bobleter et al. 1976; Bobleter et al. 1983; Yu and Wu.
2010). About 4-22 % of cellulose was decomposed in HCW
(200-230 ˚C/34.5 MPa/15 min) by using flow-type treatment (Mok and Antal 1992).
Bobleter and coworkers (1976, 1983) have shown that passing HCW continuously
through a stationary biomass bed, also known as, semi-flow HCW treatment, resulted
better digestible cellulose (Xiao et al. 2011), greater removal of lignin (Tirtowidjojo
et al. 1988), higher sugar recovery from hemicelluloses and less inhibitors in the
hydrolyzed liquid as compared with the conventional batch and co-current flow
systems (Liu and Wyman 2003).
Previously, the two-step semi-flow HCW treatments of lignocelluloses
biomass (Lu et al. 2009; Phaiboonsilpa et al. 2010, 2011) have suggested that
230 ˚C/10 MPa/15 min and 270 ˚C/10 MPa/15 min were optimum conditions for
decomposition of hemicelluloses and cellulose, respectively. Thus, the objective of
this work is to investigate comprehensively the hydrothermal decomposition
behaviors of various crystalline celluloses as treated by semi-flow HCW through
their residues at 230-270 ˚C/10 MPa/2-15 min.
The original publication is available at Springer via http://dx.doi.org/10.1007/s10570-013-
0022-4

27
2.2 Materials and Methods
2.2.1 Preparation of various crystalline celluloses
The celluloses were prepared from cotton linter (Buckeye 1AY-500), which,
in its native form is cellulose I (cell I). Mercerized cellulose with crystalline form of
cellulose II (cell II) was prepared from cell I by soaking it into 20.0 % of aqueous
NaOH solution for 24 h at ambient temperature, followed by washing thoroughly
with water and freeze-drying (Isogai et al. 1998). Samples with the crystalline forms
of celluloses IIII (cell IIII) and IIIII (cell IIIII) were prepared from cell I and cell II,
respectively, by soaking them in 100 % ethylenediamine (EDA) for 24 h at ambient
temperature, washed with dried methanol and kept under vacuum.
The prepared cell IIII and cell IIIII were further used for the preparation of
celluloses IVI (cell IVI) and IVII (cell IVII). They were firstly soaked in glycerol for
3 days at ambient temperature and then heated in a reaction vessel at
260 ˚C/0.6 MPa/30 min (Isogai et al. 1989). After cooling down to ambient
temperature, the product was washed with water and acetone successively and dried
in vacuum. To simplify, the cotton linter (cell I) was converted into group I (celI I,
cell IIII, cell IVI) and group II (cell II, cell IIIII, cell IVII) celluloses. The chemical
compositions of these celluloses were also analyzed and all the cellulose samples
were found to contain similar components of about 99.9 wt% glucose and 0.1wt%
xylose.
To evaluate decomposition behaviors for the celluloses by semi-flow HCW
treatment, celluloses with similar degree of polymerization (DP) are appropriate for
their comparison. Consequently, these celluloses were adjusted by trials and errors
for their DPs. Cell I were heated in HCW conditions at
100-200 ˚C/10 MPa/10-15 min prior to the preparation processes above and
measured the DP. This is repeated until the DP is almost similar.
2.2.2 Determination of degree of polymerization and crystallinity of the celluloses
The DP is an important parameter to be considered in order to study the
decomposition behaviors. The viscosities of the celluloses were measured by using
0.5M cupriethethylenediamine (Cuen) (TAPPI, 1982) in a Cannon Fenske capillary

28
viscometer. The viscosity average DP of the cellulose samples was calculated from
the intrinsic viscosity [η] according to the Eq. (2-1) (Sihtola et al. 1963):
DP0.905
= 0.75[η] Eq. (2-1)
Apart from the DP, the crystallinity of the celluloses is another essential
parameter. The X-ray diffraction (XRD) patterns of these celluloses were recorded
by X-ray diffractometer Rigaku RINT 2200 equipped with monochrometer. About
20 mg of cellulose was placed on a glass sample holder and flattened carefully, then
mounted on the sample holder. X-ray diffraction was conducted on reflectance
modes through a 2θ range between 7.5 ˚ and 32.5 ˚ by Cu-Kα radiation (λ=0.1542
nm), operated at 40 kV and 30 mA at ambient temperature. Gaussian functions were
used to deconvolute the XRD patterns of various crystalline celluloses. The
crystallinity was then calculated from the ratio of the area of all crystalline peaks
with less background to the total area (Park et al. 2010).
The diffraction angles of each XRD pattern and their assignment diffraction
planes are summarized based on a newly proposed conventional indexing for various
unit cells of cellulose (French 2014). Here, the unit cells were mainly referenced to
the orientation along c-axis, whereby various data from literatures and experimental
approaches were used, thus some variations may occur (Gardiner and Sarko 1985;
Isogai 1994; Langan et al. 2001; Nishiyama et al. 2002, 2003; Wada et al. 2004a,
2004b).
2.2.3 Fourier transform-infrared analysis of residual celluloses
The Fourier Transform-Infrared (FT-IR) analysis was carried out for the
residues of the celluloses obtained after HCW treatments. The spectra of the dried
sample pellets in KBr were recorded using a Shimadzu IR-8000 spectrophotometer.
All the spectra were recorded with an accumulation of 64 scans, revolution of 4 cm-1
,
in a range from 4000 to 400 cm-1
.

29
2.2.4 Treatment of the celluloses by semi-flow hot-compressed water
The prepared celluloses (about 0.4 g) as starting materials were treated
individually within a 5 ml reaction vessel in a semi-flow HCW system at
temperatures of 230, 250 and 270 ˚C under 10 MPa for 2-15 min. The semi-flow
HCW conversion system and its operational procedures as explained elsewhere were
adapted for this study (Lu et al. 2009; Phaiboonsilpa et al. 2010, 2011). Briefly, the
ambient distilled water from a water tank was flown through the reaction vessel by a
pump in order to pressurize the system at 10 MPa controlled by a back-pressure
regulator. To raise the temperature, the preheating unit monitored by thermocouples
was used to reach at the designated temperature of 230, 250 and 270 ˚C for about
20 min under 10 MPa and remain constant for additional 15 min, totally 35 min. In
vaddition, another heating unit was installed at the reaction vessel to maintain the
designated temperature in the reaction vessel, into which the HCW was passed
through at the flow-rate of 10 ml/min.
Fig. 2-1 The experimental process to study the decomposition behaviors of the
prepared celluloses
The treatments yielded residues of celluloses and water-soluble (WS)
portions. The analysis on WS portions will be discussed in details in Chapter 4. After
the HCW passing through reaction vessel, the WS portions were cooled down
immediately by the cooling system to terminate all reactions. The WS portions
Water-Soluble Residue
Semi-Flow HCW Treatment
(230, 250, 270 ˚C/10 MPa/2-15 min)
XRD, DP,
FT-IR
HPAEC,
HPLC, CE
Cell I, II, IIII, IIIII, IVI and IVII
Prepared From Cotton Linter

30
collected every 5 min were allowed to settle in ambient temperature and pressure for
a minimum of 12 h, before filtering them by 0.45 μm membranes prior to subsequent
analysis. The residues of celluloses left in the reaction vessel were, conversely,
collected, dried unless otherwise mentioned and evaluated for its DP and crystallinity,
again (Ehara and Saka 2002; Kumar et al. 2010). The experimental process for the
study is illustrated in Fig. 2-1.
2.3 Results and Discussion
2.3.1 Characteristics of the starting celluloses
The XRD patterns and the DP of the starting celluloses obtained after the
adjustments are demonstrated in Fig. 2-2 and Table 2-1, respectively.
Fig. 2-2 The XRD patterns for the celluloses prepared for this study
The diffraction angles of each XRD pattern and their assignment diffraction
planes are summarized in Table 2-2. For the celluloses in Fig. 2-2 and Table 2-1, the
semi-flow HCW treatments were carried out at 230-270 ˚C/10 MPa/2-15 min.
5 10 15 20 25 30 35
5 10 15 20 25 30 35
Cell I
Cell IIII
Cell IVI
Cell II
Cell IIIII
Cell IVII
Arb
itra
ry in
ten
sity
2θ (˚) 2θ (˚)
Group I Group II

31
Table 2-1 The DP and crystallinity for the prepared celluloses
Table 2-2 The diffraction planes and angles in XRD patterns of the celluloses
Cell Diffraction planes / Diffraction angles, 2θ (˚)
Group I
I 1_
10 / 14.4 110 / 16.3 200 / 22.5
IIII 010 / 11.7 100 / 20.8 11_
0 / 20.8
IVI 11_
0 / 15.4 020 / 21.8 200 / 22.2
Group II
II 1_
10 / 12.1 110 / 19.7 020 / 22.0
IIIII 010 / 12.1 100 / 20.4 11_
0 / 20.4
IVII 11_
0 / 15.1 012 / 20.6 200 / 22.5
I, II and IIII according to French (2014)
Cell DP Crystallinity (%)
Group I
I 176 91.8
IIII 164 86.0
IVI 167 89.6
Group II
II 173 85.3
IIIII 176 87.2
IVII 164 85.0

32
2.3.2 Evaluation of the residues of celluloses
The XRD patterns recorded for the residues of celluloses in group I and group
II after XRD analysis are shown in Figs. 2-3 and 2-4, respectively. In Fig. 2-3, the
XRD patterns of the residues from cell I are observed to remain the same as in the
starting cell I, in contrast with the XRD patterns of residues from cell IIII and
cell IVI. Two equatorial reflections of cell IIII at 2θ ≈ 11.7 and 20.8 ˚ indexed as 010
and 11_
0, respectively, can be observed at the starting of cell IIII. After the HCW
treatments at 230-270 ˚C/10 MPa/15 min, the peak at 2θ ≈ 11.7 ˚, for all residues
from cell IIII was totally disappeared, whereas a peak at 2θ ≈ 20.8 ˚ was noticeably
becoming smaller at elevated temperatures.
Fig. 2-3 The XRD patterns for the residues from cell I, cell IIII and cell IVI (from left
to right) treated by semi-flow HCW at 230-270 ˚C/10 MPa/15 min
In addition, the XRD peaks at 2θ ≈ 14.4, 16.3 and 22.5 ˚ were intensively
appeared. These peaks were similar to those of cell I, indexed as 1_
10, 110 and 200,
respectively. Here, therefore, all residues from cell IIII were observed to be totally
250C
230C
c3iCell IIII
230˚C
250˚C
Cell I
2θ (˚)2θ(˚)
5 10 15 20 25 30 35
270˚C
5 10 15 20 25 30 35
2 (o)
Cell I
Cell IVI
230˚C
270˚C
250˚C
2520 30 355 10 15
2θ(˚)
5 10 15 20 25 30 35
2 (o)
270˚C
250˚C
230˚C
Cell I
Arb
itra
ry i
nte
nsi
ty
2θ(˚)5 10 15 20 25 30 35
Cell I

33
converted to cell I. A similar result is reported for cell IIII treated in EDA to be
reversed and converted into cell I by treatment in warm water, whereas cell IIII
treated with liquid ammonia (140 ˚C/12 kPa) was found to be stable to boiling water
for a few hours (Sueoka et al. 1973; Roche and Chanzy 1981; Yatsu et al. 1986;
Wada 2001; Wada et al. 2008).
Whereas for cell IVI, the peak at 2θ ≈ 15.4 ˚ (indexed as 11_
0) was shown to
slowly emerge into two peaks as it was treated in the elevated temperatures.
Although the changes were not seen for residue from cell IVI at 230 ˚C, this
corresponding peak started to be transformed at 250 and 270 ˚C, which was found to
be corresponded to that of cell I; indexed as 1_
10 and 110.
This behavior of cell IVI converted to cell I by HCW is a fairly new
observation. Previously, it was only known that the similar conversion occurred by
boiling acid (2.5 N HCl/below 1 h) treatment (Chidambareswaran et al. 1982).
Though there are credible proofs that showed cell IVI is not a genuine allomorph
(Wada et al. 2004a; Isogai 1989; Newman 2008), however, the decomposition
behavior after HCW is not the same as in cell I (see also later in Chapter 4). In this
case, it is believed that the prepared cell IVI has assisted the decomposition process
during HCW treatment. During the treatment, it could be speculated that the prepared
cell IVI (contained lateral disorder structure of cell I) rearranged itself slowly and
recrystallizing to cell I structure. However, a more detail investigation on this part is
necessary to confirm the assumption.
As for the residues from group II shown in Fig. 2-4, the XRD patterns of
residues from cell II and cell IVII remained the same. On the other hand, the residues
from cell IIIII were observed to be transformed to other crystalline form. The peak at
2θ ≈ 12.1 ˚ (indexed as 010) for all residues from cell IIIII was shown to have no
changes compared with the control cell IIIII. However, a peak at 2θ ≈ 20.4 ˚ was
completely emerged into two peaks at 2θ ≈ 19.7 and 22.0 ˚, as can be seen with
residues from cell IIIII.
These peaks corresponded, respectively, to crystalline peaks at 110 and 020
of cell II. Moreover, a small peak at 2θ ≈ 15.1 ˚ was noticed and became more
prominent at 270 ˚C, which also matched up with crystalline peak of cell IVII that

34
indexed as 1 1_
0. Thus, these outcomes of residues from cell IIIII after HCW
treatments comprised a mixture of cell II and cell IVII.
Fig. 2-4 The XRD patterns for the residues from cell II, cell IIIII and cell IVII (from
left to right) treated by semi-flow HCW at 230-270 ˚C/10 MPa/15 min
All XRD patterns on residues from celluloses in Figs. 2-3 and 2-4 were
recorded and compared for the dried residues. The XRD analyses were also
performed for the wet residues from celluloses of cell IIII, cell IVI and cell IIIII,
consequently resulted the same.
Figure 2-5 shows the obtained XRD patterns of residues from cell IIII as
treated by semi-flow HCW at lower temperature, 230 ˚C/10 MPa/2-15 min. It seems
apparent that cell IIII has started to be converted to cell I at an early stage of the
HCW treatment. The peaks for 11_
0 of cell IIII were disappearing even after 2 min
treatment. Similar observations were recorded for cell IIII treated at the higher
temperature (250-270 ˚C/10 MPa/2-10 min). Upon examination on wet residues of
the celluloses, the results showed that they had already been converted as well.
s153
cell3ii
S151
s96
cell 4ii
cell 2
Cell IIIII
230˚C
250˚C
270˚C
Cell IVII
2θ (˚)5 10 15 20 25 30 35
2θ(˚)
Cell II
230
5 10 15 20 25 30 35
oriCell II
2θ(˚)5 10 15 20 25 30 35
250250˚C
230˚C
Arb
itra
ry i
nte
nsi
ty
cell 2
Cell II
5 10 15 20 25 30 35
2 (o)
270˚C
230˚C
250˚C
Cell IVII
2θ(˚)5 10 15 20 25 30 35
Cell IVII
5 10 15 20 25 30 35
2 (o)

35
The same was performed for cell IVI and cell IIIII, at
230-270 ˚C/10 MPa/2-10 min (data not shown) and they were found to behave in a
similar manner. Cell IVI has started to be converted to cell I at 10 min treatments
under 250-270 ˚C/10 MPa, whereas for cell IIIII, the conversion has occurred even at
2 min treatment under 230 ˚C/10 MPa to cell II mainly and to cell IVII to some extent.
All these results showed that they have already been converted at the early stage of
the HCW treatment at 230-270 ˚C/10 MPa. Since cell IIIII was observed to be
converted to cell II and cell IVII, further treatments for cell II were also performed at
270 ˚C/10 MPa/2-10 min in order to check whether it would be converted to cell IVII.
However, no significant crystallographic changes was observed, thus it remained as
cell II at 270 ˚C/10 MPa/2-10 min.
Fig. 2-5 The XRD patterns for the residues from cell IIII as treated by semi-flow
HCW at 230 ˚C/10 MPa for different treatment times
230C
c3iCell IIII
2θ (˚)2θ(˚)
5 10 15 20 25 30 35
15 min
5 min
2 min
Arb
itra
ry i
nte
nsi
ty
Cell I
10MPa/230˚C
10 min

36
In relation to the residues from cell IIII, cell IVI and cell IIIII in Figs. 2-3 to
2-5, the FT-IR measurements were also performed. Here, the FT-IR spectra focused
only on the OH stretching regions before and after the HCW treatments, as Fig. 2-6.
The extensively discussed bands in literatures at 3,480, 3,300 and 3150 cm-1
were
found in the spectra of cell IIII, whereas the residues of celluloses were found to be
similar as those of halocynthia and ramie which are cell I (cell Iβ type) (Wada, 2001;
Kokot et al. 2002; Zugenmaier, 2008). The bands at 3,720 cm-1
was clearly observed
showing that cell IIII has been converted to cell I.
Fig. 2-6 The FT-IR spectra for the residues from cell IIII, cell IVI and cell IIIII (from
left to right) treated by semi-flow HCW at 230-270 ˚C/10 MPa/15 min
In contrast, neither cell IVI nor cell IIIII was regularly discussed in literatures.
The residues from cell IVI that consisted of a mixture of cell I and cell IVI, usually
has higher proportion of cell IVI (Marrinan and Mann 1956; Zugenmaier, 2008).
Despite the presence of a high proportion of cell IVI, there seems to be no distinctive
absorption which could be attributed to cell IVI. It is, therefore, assumed that the
spectra of the residues from cell IVI resemble that from cell I, whereby the structure
consisted of cell I structure in lateral disorder form.
4000 3800 3600 3400 3200 3000 2800 2600 2400 2200 2000 1800 1600 1400 1200 1000 800 600 400
4000 3800 3600 3400 3200 3000 2800 2600 2400 2200 2000 1800 1600 1400 1200 1000 800 600 400
0.03
0.04
0.05
0.06
0.07
0.08
0.09
s161
ori
A
s161ori
4000 3800 3600 3400 3200 3000 2800 2600 2400 2200 2000 1800 1600 1400 1200 1000 800 600 400
Wavenumber (cm-1)
c3ii
Sm
ooth
ed
Y1
Sm
ooth
ed
Y2
Cell II
250˚C
230˚C
Cell IIIII
3400 3000 2600
Wavenumber (cm-1)
3800
Cell IVII
270˚C4000 3800 3600 3400 3200 3000 2800 2600 2400 2200 2000 1800 1600 1400 1200 1000 800 600 400
c1
Cell I
250˚C
230˚C
Cell IVI
3400 3000 2600
Wavenumber (cm-1)
3800
270˚C
4000 3800 3600 3400 3200 3000 2800 2600 2400 2200 2000 1800 1600 1400 1200 1000 800 600 400
Ab
so
rban
ce
Wavenumber (cm-1)
s1
26
4000 3800 3600 3400 3200 3000 2800 2600 2400 2200 2000 1800 1600 1400 1200 1000 800 600 400
4000 3800 3600 3400 3200 3000 2800 2600 2400 2200 2000 1800 1600 1400 1200 1000 800 600 400
A
c3idulu
Cell I
250˚C
230˚C
Cell IIII
3800 3400 3000 2600
Wavenumber (cm-1)
Ab
sorb
ance
270˚C4000 3800 3600 3400 3200 3000 2800 2600 2400 2200 2000 1800 1600 1400 1200 1000 800 600 400
c1

37
The cell IIIII spectrum has close resemblance with that of cell II as suggested
by Marrinan and Mann (1956) that the distance of the hydrogen bonding must be
very similar in the two forms. The general appearance of FT-IR spectra of cell IVII
spectrum resembled that of cell II. There was somehow no clear shift could be seen
with the FT-IR spectra obtained after HCW, only, a decrease in intensity of the
spectra for 270 ˚C/10 MPa/15 min. The appearance of different bands, as compared
with that of controls cell II, IIIII and IVII, in between 3200 to 3600 cm-1
were
observed with spectra from 250 and 270 ˚C, which could be ascribed from the
decomposition process.
Fig. 2-7 The possible interconversion pathways for various crystalline celluloses.
Solid line: Preparation process; Dotted line: Transformation by HCW treatment
All the observations above showed that the interconversion of cell IIII, cell
IVI and cell IIIII has occurred at either early or later stage of the HCW treatments.
From these results, a possible interconversion for the preparation process and
transformation of celluloses by HCW treatments can be summarized as in Fig. 2-7.
In spite of the crystallographic changes occurred for the residues from cell IIII,
cell IVI and cell IIIII, the changes in crystallinity and DP for residues of celluloses
after HCW treatments were demonstrated in Fig. 2-8. The crystallinity for residues
from cell IIII, cell IVI and cell IIIII was evaluated from the obtained XRD patterns as
treated by the corresponding temperatures. The overall results were found out to be
increased slightly and remained almost constant approximately at 90 %. The slight
increase could be due to the combined effects of an aqueous environment that
removed the paracrystalline portions of celluloses during hydrolysis (Weimer et al.
Cell I
Cell II
Cell IIII
Cell IIIII Cell IVII
Cell IVI
GlycerolEDA
HCW
Glycerol
NaOH
EDA
HCW
HCW
HCW

38
1995) and annealing that could take place on the cellulose at temperature between
220 and 280 ˚C (Yamamoto and Wu 1993).
Fig. 2-8 The changes on crystallinity and DP for the residues from the celluloses as
treated at 230-270 ˚C/10 MPa/15 min by semi-flow HCW
This observation agrees with previous studies, that even at a severe treatment
temperature 270 ˚C, the crystallinity was observed to remain almost unchanged
(Sasaki et al. 2000; Jollet et al. 2009; Kumar et al. 2010, Tolonen et al. 2011). One
study emphasized that (i) crystallinity and (ii) changes in the crystalline form of a
cellulose; as the two of the main determining factors efficacy of hydrolysis of
biomass (Cetinkol et al. 2010). However, it is generally thought that drying could
lead to the formation of new hydrogen bonds and recrystallization, which would
increase the crystallinity rather than reducing it (Tolonen et al. 2011).
Contrary to the crystallinity results, the DP for all residues of celluloses was
seen to decrease slightly with increase in temperature (Tolonen et al. 2011). The
expectation that the lower DP celluloses such as cell IVII would be easier to
decompose due to their shorter average lengths of molecules, however, was not
190 200 210 220 230 240 250 260 270 280
60
80
100
120
140
160
180
200
220
240
260
Group II
Cell I
Cell II
Cell IIII
Cell IIIII
Cell IVI
Cell IVII
DP
Temperature (oC)
Control
Group I
65
70
75
80
85
90
95
Cry
stal
linit
y (
%)
Group I
Group II

39
observed in Fig. 2-8. The DP was decreasing and leveling off to about 70, which is
obvious with group II celluloses, even after the treatment at 270 ˚C/10 MPa/15 min.
In literatures, the degradation cellulose II from cotton linters of DP 3100 by
hydrolysis may decrease to a DP of ~ 85 to 70 (Schulz and Husemann, 1942;
Jörgensen 1950; Shibazaki et al. 1997).
The present interpretations suggested that the crystalline structure of the
celluloses were still rigid, but only broken down into shorter-chain of cellulose
molecules. As temperature increases, the DP decreases which would raise the
solubility of cellulose in water and conversion of cellulose to the hydrolyzed and
degraded products (Sasaki et al. 2000; Yu and Wu 2009). In Fig. 2-8, the DP of
group I celluloses was observed to be generally higher than that of group II. This
shows that group II is easier to be decomposed as compared with group I. Also,
based on visual examination, the fibers as the starting materials have been changed
into powder-liked residues after the HCW treatment.
Figure 2-9 illustrates the relationship of DP and residues of celluloses after
HCW treatments. Both are seen to decrease as the treatment temperatures were
increased. It has also been reported in previous studies that the DP of residues
gradually decreased with increasing cellulose decomposition (Sasaki et al. 2000;
Tolonen et al. 2011).
The overall yield of the residues after semi-flow HCW treatment for various
types of celluloses is shown in Fig. 2-10. These residues notably decreased with the
increase in temperatures. The residues of the celluloses obtained particularly at
treatment condition of 230 ˚C/10 MPa/15 min were still quite high in yield (70-90
wt%), agreeable with earlier studies that the condition was known not to hydrolyze
the crystalline cellulose in wood (Lu et al. 2009; Phaiboonsilpa et al. 2010; 2011).
Since in the present study, the starting DP was adjusted to be the same for all
celluloses, a direct comparison can be made for decomposition behaviors of the
celluloses. As DP in the residues of celluloses is a function of cellulose
decomposition, the observed changes on residues were only due to the different
crystalline structures of celluloses as starting materials. The various crystalline
celluloses prepared as the starting materials have assisted the decomposition process
in HCW treatments even though the interconversion of some celluloses has occurred.

40
Fig. 2-9 The relationship between DP and residues from the celluloses as treated by
semi-flow HCW at 230-270 ˚C/10 MPa/15 min
Cell I yielded the highest residue among the celluloses used in this study
followed by cell IIII and cell IVI, as in Fig. 2-10. At 230 and 250 ˚C, both cell IIII and
cell IVI behaved very similarly, however, cell IVI decomposed more at 270 ˚C as
compared with cell IIII. This trend was later followed by cell II, cell IIIII and cell IVII.
Both cell IIIII and cell IVII behaved in the same manner, whereas, more
decomposition was observed for cell IVII at 270 ˚C as compared with cell IIIII. Cell II
was observed to have no residues left at 270 ˚C, thus crystallinity and DP values
were recorded in Fig. 2-8.
To sum up, cell I in native crystalline form was found to be the most resistant
against decomposition, while cell II, cell IIIII and cell IVII were decomposed the most
as compared with the other types of celluloses such as cell IIII and cell IVI. This
could be an indication of the easiness for decomposition of the celluloses and it
seemed likely that group I celluloses (cell I, cell IIII and cell IVI) had higher
resistance to be decomposed as compared with group II celluloses (cell II, cell IIIII
and cell IVII).
60
80
100
120
140
160
180
100 80 60 40 20 060
80
100
120
140
160
180
100 80 60 40 20 0 100 80 60 40 20 0
Cell II Cell IVII
Cell IIIII
Cell IVI
Cell IIII
DP
Cell I
DP
Residual celluloses (wt%)
Residual celulloses (wt%)
Residual celluloses (wt%)Residual cellulose (wt%)Residual cellulose (wt%)Residual cellulose (wt%)
DP
DP
Cell I
Cell II
Cell IIII
Cell IIIII
Cell IVI
Cell IVII
Control
230˚C250˚C
270˚C
Control
230˚C250˚C
Control
230˚C250˚C
270˚C
Control
230˚C250˚C
270˚C
Control
Control
230˚C
270˚C250˚C
230˚C
270˚C250˚C
(I)(I)
(I)
(II)(II) (II + IVII)
(I +IVI)
(IVII)
(I)
(I)(I)
(I +IVI)
(IVI)
(II ) (IVII)(IVII)
(II )

41
Fig. 2-10 The changes on the residues from the celluloses as treated at
230-270 ˚C/10 MPa/15 min by semi-flow HCW
2.4 Concluding Remarks
The decomposition behaviors on various types of crystalline celluloses were
investigated at 230-270 ˚C/10 MPa/2-15 min. To compare directly the effect of the
treatment, the DP of the celluloses was adjusted by trial and error to be similar prior
to the treatment. Based on the results of the residues, crystallographic changes were
found to be occurred during the HCW treatment for cell IIII, cell IVI and cell IIIII. In
general, group I celluloses (cell I, cell IIII, cell IVI) have been converted to cell I and
group II (cell II, cell IIIII, cell IVII) to cell II. Despite of these changes, the overall
results of residues showed that group I has higher resistance to be decomposed than
group II.
It was clear that the decomposition behaviors were due to their different
crystalline forms of celluloses. All these data are useful to understand the behaviors
of different types of crystalline celluloses that could provide information for efficient
use of lignocelluloses.
200 210 220 230 240 250 260 270
0
10
20
30
40
50
60
70
80
90
100
Cell II
Cell IIIII
Cell IVII
Res
idual
cel
lulo
ses
(wt%
)
Temperature (oC)
Cell I
Cell IIII
Cell IVI
Control
Group I
Group II
Group I
Group II

42
CHAPTER 3
Decomposition Behaviors of Celluloses by Enzymatic Treatment
3.1 Introduction
Numerous studies involving cellulases on celluloses have discovered the
mechanisms of enzyme degrade cellulose (Fan et al. 1980; Lee et al. 1983; Hsu 1996;
Cao and Tan. 2002; Yoshida et al. 2008; Hall et al. 2010: Ward 2011). Different
cellulases changed the degree of polymerization (DP), solubility towards aqueous
alkali solution and crystallinity of cellulose during enzymatic hydrolysis (Reese et al.
1957; Sasaki et al. 1979; Puri 1984). Cellobiose yield was increased by using non-
continuous hydrolysis process without further addition of enzyme (Vanderghem et al.
2010), while treated celluloses with alkali or anhydrous liquid ammonia affected
enzyme digestibility based on the relative crystallinity (Mittal et al. 2011).
There are many works on enzymatic hydrolysis of celluloses, however, they
focussed on either one or few allomorphs, explored their kinetics, studied their
molecular simulations and used bacteria for their treatment (Weimer et al. 1991;
Wada et al. 2010; Beckham et al. 2011; Mittal et al. 2011). Up to date, no reports are
yet available that describes the comparison of enzymatic hydrolysis behaviors using
various celluloses with retention of constant degree of polymerization (DP).
Therefore, in this study, hydrolysis behavior of the various crystalline celluloses
during treatment by cellulase of Trichoderma viride is investigated, in addition, to
compare them with the decomposition behaviors of the celluloses from the HCW
treatments.
The original publication is available at Springer via http://dx.doi.org/10.1007/s10570-014-
0410-4

43
3.2 Material and Methods
3.2.1 Various crystalline celluloses and enzyme
The celluloses were prepared according to the methods described in
Chapter 2. They were adjusted to similar DP which is necessary for comparing and
evaluating the decomposition products from this work.
The cellulase in lyophilized powder from Trichoderma viride Sigma C9422
was purchased from Nacalai Tesque, Japan. The activity of the enzymes was
expressed in international units (U), i.e., one international unit of enzyme is defined
as the amount that catalyzes the formation of one μmol of product per min under the
defined conditions. The activity was found to be 11.4 U/ml.
3.2.2 Enzymatic hydrolysis for celluloses
In a 20 ml glass vials were added 35 mg/ml cellulose, 0.35 U/mg cellulose of
cellulase and 0.05 M sodium acetate buffer of pH 5.0 (thermostated before at 50 ˚C)
until 3 ml final volume. The pH value was adjusted using 1 M hydrochloric acid
(HCl), if necessary (Bommarius et al. 2008). The controls together with the reaction
mixtures were placed in an incubator at 50 ˚C and continuously stirred using
magnetic stirrers. No β-glucosidase supplement was used in this study
(Kadam et al. 2004). At the designated treatment times, the samples were removed
and the enzyme reactions were terminated by quenching in ice bath, followed by
centrifugation at 8000 × g for 2 min. The supernatant was immediately filtered, then
refrigerated until subjected to analysis (Van Wyk 1997; Bommarius et al. 2008;
Yang 2010). All chemicals used in this study were of reagent grade without
purification. Enzymatic treatments were performed in duplicates.
3.2.3 Analyses of cellulose residues
The DP of the residues was measured using the molecular weight distribution
of celluloses as phenyl carbamate derivatives. The procedure was modified from
prior published methods (Evans et al. 1989; Mormann et al. 2002). Cellulose (5 mg)
and phenyl isocyanate (0.2 mL) were added to pyridine (2 mL), and its mixture was
heated up to 80 ˚C under continuous stirring for 24 h to become a yellow transparent

44
solution. Methanol (0.5 mL) was then added to terminate the reaction, and the
solvent was removed by evaporation in vacuum to give dark yellow syrup.
The syrups of the phenyl carbamate derivatives were dissolved in
tetrahydrofuran (THF). The solutions were then filtered through 0.45 μm
microcentrifuge membrane filters prior to analysis by gel permeation
chromatography (GPC) Shimadzu LC-10A under the following chromatographic
conditions: column, Shodex LF-804; column temperature, 40 ˚C; eluent, HPLC grade
THF; flow-rate, 1.0 ml/min and detector, UV254nm. Polystyrene standards were used
to calibrate retention time for its molecular weight. The DP of cellulose was then
calculated by dividing the molecular weights of the carbanilated cellulose by that of
its repeating unit (=519) with the degree of substitution of 3.0. All reported values
were based on the average of duplicate samples.
The evaluation of crystalline by using the X-ray diffraction (XRD) patterns
was recorded by X-ray diffractometer Rigaku RINT 2200, as in section 2.2.2.
3.2.4 Analysis of the supernatants
The total sugar productions i.e., the total hydrolyzed products, cellobiose and
glucose, in supernatant for each hydrolysis time points were measured by high
performance liquid chromatography (HPLC) system (Shimadzu, LC-10A). The
chromatographic conditions were: column, Bio-Rad Aminex HPX-87P; detector,
UV254nm; eluent, deionized water; flow-rate, 0.6 ml/min and oven temperature, 85 ˚C.
The sample injection volume was 10 μl and the running time was 30 min.
3.3 Results and Discussion
3.3.1 Evaluation of cellulose residues
To evaluate and compare directly their hydrolysis behaviors, it is essential for
the starting materials to have a common DP. As a result, the adjusted DP and the
corresponding crystallinity of the celluloses are summarized in Table 3-1. The XRD
patterns of these celluloses are similar to Fig. 2-2 in Chapter 2.
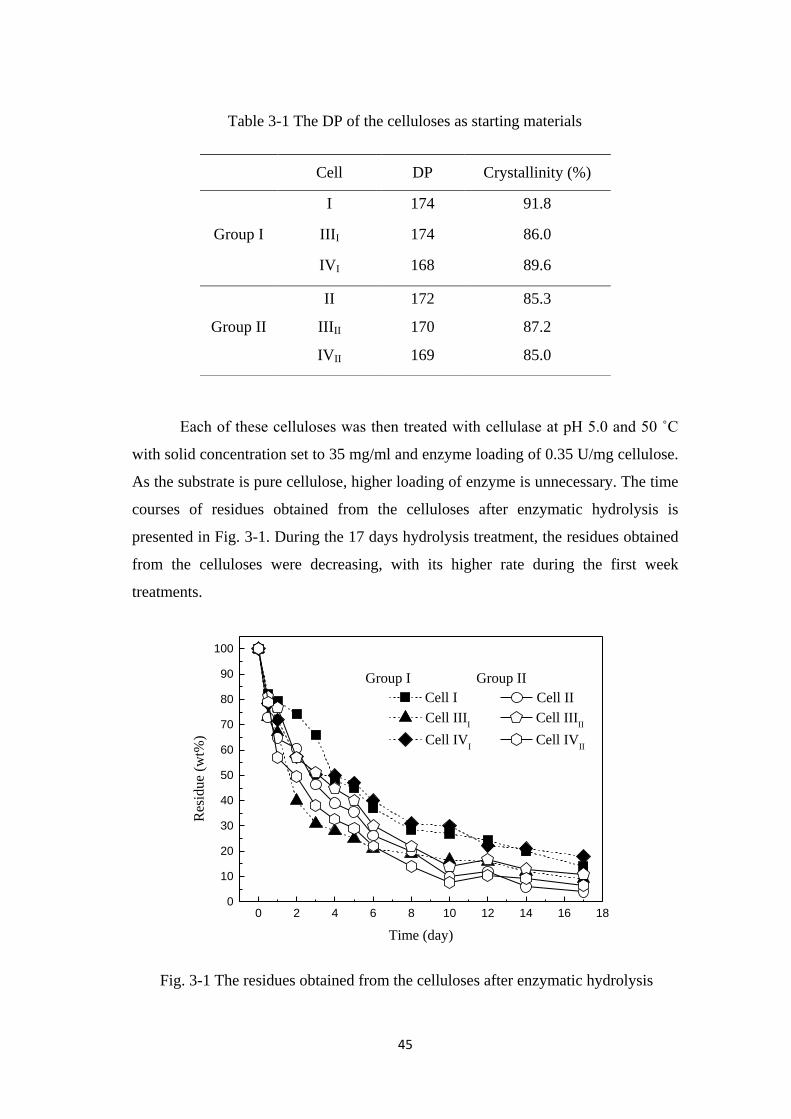
45
Table 3-1 The DP of the celluloses as starting materials
Each of these celluloses was then treated with cellulase at pH 5.0 and 50 ˚C
with solid concentration set to 35 mg/ml and enzyme loading of 0.35 U/mg cellulose.
As the substrate is pure cellulose, higher loading of enzyme is unnecessary. The time
courses of residues obtained from the celluloses after enzymatic hydrolysis is
presented in Fig. 3-1. During the 17 days hydrolysis treatment, the residues obtained
from the celluloses were decreasing, with its higher rate during the first week
treatments.
Fig. 3-1 The residues obtained from the celluloses after enzymatic hydrolysis
0 2 4 6 8 10 12 14 16 180
10
20
30
40
50
60
70
80
90
100
Group II
Cell II
Cell IIII
Cell IVI
Cell IIIII
Cell IVII
Res
idue
(wt%
)
Time (day)
Cell I
Group I
Cell DP Crystallinity (%)
Group I
I 174 91.8
IIII 174 86.0
IVI 168 89.6
Group II
II 172 85.3
IIIII 170 87.2
IVII 169 85.0

46
In group I, cell IIII hydrolyzed the most, and it has lesser residue than that of
cell I and cell IVI, which behave quite similarly. On the other hand, all celluloses in
group II reach more or less similar yields and are seemingly equivalent to that of cell
IIII. Generally, group II celluloses are easier to hydrolyze than those of group I,
except for cell IIII.
Figure 3-2 shows the XRD patterns of group I celluloses after enzymatic
hydrolysis. In Fig. 3-2 (left), the XRD patterns of the residues from cell I are
observed to remain almost unchanged even after 17 days hydrolysis treatment.
However, the intensity at 2θ ≈ 22.5 ˚, is decreasing as enzymatic hydrolysis is
prolonged and the peaks at 2θ ≈ 14.4 ˚ and 16.3 ˚ are not sharp as observed in the
control. This is seen in the progressive decrease in crystallinity in Fig. 3-5 (below)
and may be due to the enzymatic attacks onto the structure of the cell I (Lee et al.
1983; Cao and Tan 2005).
Fig. 3-2 The XRD patterns of group I celluloses; cell I (left), cell IIII (middle), cell
IVI (right), after enzymatic hydrolysis
5 10 15 20 25 30 35
2theta
ori
5 10 15 20 25 30 35
2theta
ori
e170
e174
e227
e228
5 10 15 20 25 30 35
2θ(˚)
Day
Arb
itra
ry i
nte
nsi
ty
Cell I
1
4
8
14
17
5 10 15 20 25 30 35
2theta
ori
5 10 15 20 25 30 35
2
c3At160c
e271
e274
e277
e279
5 10 15 20 25 30 35
2θ(˚)
Day
Cell IIII
1
4
8
14
17
Cell I
5 10 15 20 25 30 35
2theta
ori
5 10 15 20 25 30 35
2theta
ori
e116
e120
e114
e156
e261
5 10 15 20 25 30 35
2θ(˚)
Day
Cell IVI
8
14
17
1
4
Cell I
5 10 15 20 25 30 35
2theta
oriCell I

47
In Fig.3-2 (middle), the XRD patterns of residues from cell IIII demonstrate
that the cell IIII is slowly converted back to cell I. Yet, the full XRD pattern of cell I
is not obtained. During the treatment, the residues from cell IIII are observed to be
gradually modified to a mixture of cell I and cell IIII. As for the XRD pattern of the
residues from cell IVI, in Fig. 3-2 (right), no significant changes are observed, apart
from, the peak 2θ ≈ 15.1 ˚. The peak was becoming broader and slowly imitated the
characteristic peaks of cell I. In both cases cell IIII and cell IVI, some enzymatic
attacks could also have taken place.
Figure 3-3 shows the XRD patterns of group II celluloses after enzymatic
hydrolysis. Though there is no significant change observed from the XRD patterns
of cell II, in Fig 3-3 (left), the intensity at 2θ ≈ 19.7 ˚ and 22.0 ˚ decreases as
enzymatic treatment time is prolonged. The XRD patterns of residues from cell IIIII,
in Fig. 3-3 (middle) and cell IVII, in Fig. 3-3 (right), were slowly converted into their
parent, cell II.
Fig. 3-3 The XRD patterns for group II celluloses; cell II (left), cell IIIII (middle), cell
IVII (right), after enzymatic hydrolysis
5 10 15 20 25 30 35
ori
5 10 15 20 25 30 35
ori
5 10 15 20 25 30 35
ori
5 10 15 20 25 30 35
ori
Arb
itra
ry i
nte
nsi
ty
5 10 15 20 25 30 35
2θ(˚)
Day
Cell II
1
4
8
14
17
5 10 15 20 25 30 35
2theta
ori
e282
e285
e288
e291
e293
5 10 15 20 25 30 35
2θ(˚)
Day
Cell IIIII
8
14
17
Cell II
4
1
5 10 15 20 25 30 35
2theta
ori
e134
e138
e266
5 10 15 20 25 30 35
2θ(˚)
Cell IVII
8
14
17
Cell II
4
1
Day
Cell II

48
For cell IIIII, in Fig. 3-3 (middle), two peaks at 2θ ≈ 20.1 ˚ and 21.6 ˚ emerge
during the time of hydrolysis, comparable to the control, cell II. In contrast with Fig.
3-3 (right), the peak at 2θ ≈ 15.1 ˚ for cell IVII disappears after 1 a few days‘
treatment, replicating the control cell II. Thus, from cell IIIII, in Fig. 3-4 (middle) and
cell IVII, in Fig. 3-3 (right), mixtures comprising cell IIIII and cell II, also cell IVII
and cell II, are present during the treatments. These behaviors of cellulose residues
from cell IIII in Fig. 3-2 (middle); cell IVI in Fig. 3-2 (right); cell IIIII in Fig. 3-3
(middle) and cell IVII in Fig. 3-3 (right) are also examined under wet conditions by
X-ray diffractometry with similar results.
Figure 3-4 shows the comparison between XRD patterns of residues from
cell IIII treated with and without enzyme. In these data, the changes from cell IIII into
cell I occur with or without cellulase. However, the peaks at 2θ ≈ 14.4 ˚ and 16.3 ˚
appear at a much slower rate with enzyme. Somehow, the enzymatic attacks must
interfere with the conversion process.
Fig. 3-4 The comparison between XRD patterns of residues from cell IIII when
treated with and without enzyme
6hr
c3i
5 10 15 20 25 30 35
2θ(˚)
Hour
Cell IIII
24
Arb
itra
ry i
nte
nsi
ty
6
5 10 15 20 25 30 35
2theta
ori
With enzyme/50˚C/0.1MPa
Cell I
c3i
5 10 15 20 25 30 35
2θ(˚)
Hour
Cell IIII
24
6
5 10 15 20 25 30 35
2theta
ori
Without enzyme/50˚C/0.1MPa
Cell I
0 0

49
According to the literatures, the immersion of cell IIII in a polar solvent could
obtain cell IIII or cell I (Loeb and Segal 1955; Wada et al. 2008). Similar conversion
of the crystalline form to its parent cellulose is also detectable with cell IVI, cell IIIII
and cell IVII, but is insignificant for cell IVI, when it is treated without enzyme.
Figure 3-5 shows the relationship between DP and crystallinity of the
celluloses after enzymatic hydrolysis. The crystallinity is observed to drop slowly
after 1 day of treatment and then soon starts to decrease faster. The enzyme could
probably attack first the paracrystalline regions of the celluloses, hence the
crystallinity dropped slower at first, and then later would attack the crystalline parts.
As for the DP, it is observed to decrease with treatment time. With celluloses in the
modified forms (cell IIII, cell IVI, cell IIIII, cell IVII), enzymatic hydrolysis reaction is
shown to be more effective, compared with the cellulose in the cell I form. This
agrees with the previous work by Igarashi et al. (2007). Figure 3-5 shows more
changes occurred with group II than group I celluloses, and the changes during
hydrolysis reaction were closely related to the initial state of cellulose structure.
Fig. 3-5 The changes in DP and crystallinity of the celluloses after enzymatic
hydrolysis
100
120
140
160
180
95 90 85 80 75 70
100
120
140
160
180
95 90 85 80 75 70 95 90 85 80 75 70
dpC1
dpC3i
dpC4i
dpC2
dpC3ii
dpC4ii
Crystallinity (%)Crystallinity (%)Crystallinity (%)
DP
DP
Cell I
Cell II
Cell IVI
4
814
4
8
4
8
17
4
8
17
48
4
17
8
17
1
17
1
14
1
14
17
1
14
1
14
1
14
Cell II
Cell IIII
Cell IIIII
Cell (IVI+I)
Cell IVII
Cell (IVII+II)
Cell (IIII+I)
Cell (IIIII+II)
0
00
00
0
Cell I

50
3.3.2 Evaluation of the supernatants
The analysis of supernatant shows that enzymatic hydrolysis produces
hydrolyzed products (total sugar) such as cellobiose and glucose. On average, more
than 75 wt% of the total sugar consists of glucose. The results on total sugar obtained
for the celluloses after enzymatic hydrolysis are shown in Fig. 3-6. Overall, cell IIII
and group II celluloses produced similar total sugar yields, higher than those of cell I
and cell IVI. This confirms earlier findings that hydrolysis yield rates produced of
cellulose IIII were much higher than for cellulose I (Igarashi et al. 2007), but for a
more complete range of polymorphs and controlled DP.
Moreover, in this work, it is found that comparable yields of total sugar are
obtainable from enzymatic hydrolysis of cell II and cell IIII, disagreeing with the
previous work in which similar DPs were not considered for the starting materials
(Mittal et al. 2011). The comparable behavior of cell I and cell IVI could be because
of the structures of cell IVI and cell I are analogous (Wada et al. 2004b).
Fig. 3-6 The yield of total sugars from the celluloses after enzymatic hydrolysis
Matsuoka et al. (2011) previously showed thermal glycosylation converts the
reducing ends into more stable glycosides with alcohol, which what would probably
happened during the preparation of cell IVI. The reducing ends in the paracrystalline
0 2 4 6 8 10 12 14 16 180
10
20
30
40
50
60
70
80
90
100
Cell IIII
Cell IVI
Cell II
Cell IIIII
Cell IVII
To
tal
sug
ar (
wt%
)
Time (day)
Cell I
Group I Group II
51
regions were suggested to be more reactive than those in the crystalline regions. In
Fig. 3-6, some sugars can be obtained as result of enzymatic hydrolysis of cell IVI (as
the starting material). This could possibly be due to the enzymatic attack that
facilitated the cell IVI to convert into cell I (Fig. 3-2) and thus uncapped its reducing
ends, as well as, the attacking of enzyme at the reducing ends of the paracrystalline
regions.
The behaviors of the celluloses are seen to be dependable on the initial
hydrolysis reactions. Given that the interconversion processes for some celluloses are
most probably independent of the enzyme reaction, thus, the trends of total sugar
productions are most likely due to intrinsic properties of the starting materials.
3.4 Concluding Remarks
In order to enhance enzymatic hydrolysis sugar production, various forms of
crystalline celluloses were used as the starting materials. The modification of
cellulose crystalline structures somehow assists the enzyme to perform better during
hydrolysis reaction, although interconversion processes of the celluloses have
occurred. In addition, considering constant DP for starting materials was necessary to
improve the evaluation of enzymatic treatment of the various cellulose forms. From
the results above, it is concluded that enzymatic hydrolysis treatment is better for cell
IIII and group II celluloses, compared to native cellulose. Thus a recommendation
can be made to either convert cell I into cell IIII or group II celluloses for enzymatic
hydrolysis.

52
CHAPTER 4
Decomposition Behaviors of Celluloses as Studied for the Water-Soluble
Products
4.1 Introduction
In Chapter 2, the decomposition behaviors of various crystalline celluloses as
treated by semi-flow hot-compressed water (HCW) at 230-270 ˚C/10 MPa/2-15 min
were conducted and the analysis on the residues were carefully discussed based on
the physical characteristics such as degree of polymerization (DP) and crystalinity.
The overall results of residues showed that group I celluloses have higher resistance
to decompose than group II celluloses.
In addition to the above work (Abdullah et al. 2013), many other studies have
been done on the analysis of cellulose hydrolysis by using HCW treatments (Mok
and Antal 1992; Adschiri et al 1993; Sasaki et al. 1998; Saka and Ueno 1999; Ehara
and Saka 2002; Sakaki et al. 2002; Liu and Wyman 2003; Schacht et al. 2008;
Kumar and Gupta 2008; Lu et al. 2009; Phaiboonsilpa et al. 2010, 2011), however,
the comprehensive investigation has been rarely conducted on various crystalline
celluloses as the feedstocks. As a further approach, the primary objective is of this
work is to study quantitatively the decomposition from the celluloses by
hydrothermal treatment i.e., semi-flow HCW through the yields of the water-soluble
(WS) portions. It is anticipated that this line of informative evaluations would help to
understand the impact of semi-flow HCW treatment on these celluloses and judge the
feasibility of such processing on downstream bioethanol process.
4.2 Materials and Methods
4.2.1 Various crystalline celluloses preparation
The preparation of the celluloses and the adjustment the DP followed the
procedure as already described in Chapter 2.
The original publication is available at Springer via http://dx.doi.org/10.1007/s10086-014-
1401-7

53
4.2.2 Degree of polymerization and crystallinity of the celluloses
The DP of the celluloses was analyzed and calculated based on previous
studies (Sihtola et al. 1963; TAPPI 1982). For the crystallinity determination,
Gaussian functions were used to deconvolute the X-ray diffraction (XRD) patterns of
the celluloses (Park et al. 2010). These XRD patterns were recorded by X-ray
diffractometer Rigaku RINT 2200 (as in Chapter 2).
4.2.3 Treatment of the celluloses by semi-flow hot-compressed water
The prepared celluloses as starting materials were then treated individually in
a semi-flow HCW system. The details of the treatments have been described
previously in section 2.2.4 of Chapter 2. The treatments yielded residues of
celluloses and WS portions, at which the residues analyses have been discussed
expansively.
4.2.4 Analytical methods
The WS portions collected were analyzed and characterized by using high-
performance anion exchange chromatography (HPAEC), high-performance liquid
chromatography (HPLC) and capillary electrophoresis (CE). The HPAEC system
(Dionex ICS-1000 system) equipped with the CarboPac PA-1 column (4 mm x
250 mm) and electrochemical detector for pulsed amperometric detection was
employed and operated at 35 ˚C and flow-rate of 1.0 ml/min under the helium
atmosphere for monosaccharides and cello-oligosaccharides in the WS portions. The
mobile phase was a gradient-programmed mixture of deionized water, 0.2 M NaOH
and 2.0 M CH3COONa, as eluents. All eluents contained in 3 separate reservoirs
were degassed by an aspirator and subsequently purged with helium to prevent the
absorption of CO2.
The HPLC system (Shimadzu, LC-10A) equipped with a Shodex Sugar
KS-801/Ultron PS-80P columns and refractive index/UV-Vis detector was applied.
The eluent used was deionized water at a flow-rate of 1.0 ml/min and oven
temperature was set to be 80 ˚C for the columns. The CE (Agilent; Germany) was
used to assay the low molecular weight organic acids. A fused-silica capillary

54
(Agilent; 75 μm diameter, 104 cm total length, 95.5 cm effective length) was used at
15 ˚C.
Concentrations of the products in the WS portions were calculated based on
the peak areas on chromatograms obtained from HPAEC, HPLC and CE. A set of
standards with known concentrations, containing the compounds that were to be
identified both quantitatively and qualitatively, was prepared and analyzed together
with the samples by using the relevant analytical equipment as mentioned above (Lu
et al. 2009; Phaiboonsilpa et al. 2010; Yu and Wu 2010).
4.3 Results and Discussion
Having similar DPs for the celluloses as starting materials is essential so that
a direct comparison between the celluloses can be made. The crystallinity and DP for
the celluloses are similar to that listed in Table 2-1 (as in Chapter 2). Treatments by
semi-flow HCW were then carried out for these celluloses at
230-270 ˚C/10 MPa/15 min.
4.3.1 Decomposition kinetics of various crystalline celluloses
The semi-flow HCW treatment decomposed the celluloses either partially or
completely to the WS portions. The yield on WS portions from the celluloses as
shown in Fig. 4-1, is a function of treatment temperatures. During the treatment, the
yield on WS portions increased as the treatment temperature increased. They were
measurable even at lower temperature, 230 ˚C/10 MPa, with approximately
10-30 wt% and increased to more than 70 wt% at higher temperature, 270 ˚C/10
MPa. At 270 ˚C/10 MPa/15 min, cell II was shown to be totally decomposed to WS
portions as compared with other celluloses. The overall results from Fig.4-1
illustrated that higher yields were obtainable for group II celluloses than group I.
Figure 4-2 shows the Arrhenius plot of the present results according to the
pseudo-first-order reaction kinetics. The relationship between natural logarithms of
reaction constants, ln k, and T-1
shows good linear fits with the results indicating that
the decomposition follows the pseudo-first-order reaction kinetics. Cellulose
hydrolysis is classically defined by a pseudo-homogeneous kinetics model, a term

55
that in reality reflects that the hydrolysis process is heterogeneous (Olanrewaju
2012). Every parameter used such as time, pressure and DP on the celluloses were
kept constant, satisfying the assumption that the Arrhenius-plot is temperature
dependent. Though, the data points obtained in this study are only based on three
different temperatures profile, the degree of decomposition could be determined
reliably and the comparison of kinetics on the celluloses can be done directly.
Fig. 4-1 The yield on WS portions obtained from the celluloses as treated by semi-
flow HCW at 230-270 ˚C/10 MPa/15 min
The apparent activation energies, Ea, for the celluloses can be calculated from
Fig. 4-2. Activation energy of any reaction mainly explains its degree of
temperature-sensitiveness; reactions with higher Ea are high in temperature-
sensitiveness, while the reactions with lower Ea are low temperature-sensitive (Xin
et al. 2009). It can also be said that Ea is defined as the minimum energy required for
decomposition to occur. The smaller Ea for decomposition of cellulose signifies the
requirement of less energy for its decomposition and vice versa. In the figure, it was
shown that different slopes obtained for each of the celluloses suggested different Ea
for cellulose decomposition in the studied temperature range.
230 240 250 260 2700
10
20
30
40
50
60
70
80
90
100
110
120
Cell IIIII
Cell IVII
Cell IIII
Cell IVI
Group II
Cell II
Wate
r-so
luble
(w
t%)
Temperature (oC)
Cell I
Group I

56
Fig. 4-2 The Arrhenius plot for the celluloses using pseudo-first order reaction
kinetics as treated by semi-flow HCW at 230-270 ˚C/10 MPa/15 min
Table 4-1 shows the obtained Ea for all celluloses within the treatment
temperatures. The Ea for group I and group II celluloses are, respectively, greater
than 130 and 100 kJ/mol. It is apparent that the celluloses in group I have higher Ea
than those in group II, which implies an easier decomposition process for group II
celluloses by semi-flow HCW treatment. However, due to the aforementioned
limitations such as limited numbers of experiments carried out in a relatively narrow
temperature range, the obtained Ea must be judged critically. The acquired Ea was
based on the best fit curves. As a result, a higher Ea was obtained for cell IVI as
compared with cell I and cell IIII. Since comparison of Ea was done between group I
and group II, the above observation of group I having higher Ea than group II is
valid.
These Ea are lower than previously reported, 164 kJ/mol (Schacht et al. 2008)
and 145 kJ/mol (Sasaki et al. 2004) without catalysts, whereas, 144 kJ/mol and
100 kJ/mol (Mok et al. 1992) in dilute sulfuric acid catalyst. The differences in Ea
could be due to various definitions of decomposition processes and of cellulose
hydrolysis only at elevated temperatures (above 290 ˚C/25 MPa), treatment
1.85 1.90 1.95 2.00
-10
-9
-8
-7
-6
Cell I
Group I Group II
Cell IIII
Cell IVI
Temperature (oC)
ln k
1000/T (1/K)
Cell II
Cell IIIII
Cell IVII
250 230270

57
conditions used. For instance, Sasaki et al. (2004) studied just the kinetics whereby
in this work the kinetics of various cellulose decomposition were measured at
230-270 ˚C/10 MPa.
Table 4-1 The activation energies of the celluloses as treated by semi-flow HCW at
230-270 ˚C/10 MPa/15 min
Cellulose Activation energy, Ea (kJ/mol)
Group I
Cell I 137
Cell IIII 149
Cell IVI 172
Group II
Cell II 102
Cell IIIII 112
Cell IVII 108
The observed decomposition of cellulose in subcritical water appears to be as
good as that occurring in dilute sulphuric acid hydrolysis (Mok et al. 1992).
Cellulose firstly undergoes a rapid weight loss and followed by a slow hydrolysis
step of the remaining cellulose. The high reactivity is associated with accessible
paracrystalline regions in cellulose that are more vulnerable to chemical attacks than
the crystalline regions (Sasaki et al. 2000).
The reaction temperature has influence on the solvent properties of water
(Kruse and Dinjus 2007; Marshall and Franck 1981). It has been suggested that the
shift in solvent properties affects the kinetics of cellulose decomposition (Sasaki et
al. 2002; Deguchi et al. 2008). However, in this present work, the constant Ea implies
that the reaction mechanism of the hydrothermal decomposition is not distinctly
affected. The lower Ea obtained indirectly showed that the decomposition of the
celluloses in this system is a catalytic process, in agreement with the literature
(Mok et al. 1992).

58
4.3.2 Quantification of the water-soluble portions
Figure 4-3 below shows the reaction scheme of cellulose I decomposition into
hydrolyzed and degraded products as treated by semi-flow HCW treatment, adapted
from (Abdullah et al. 2013). In the present work, the WS portions for the celluloses
obtained from each treatment were found to follow a similar decomposition pathway
as in Fig. 4-3. It is important to know the decomposition pathway of cellulose as the
degraded products inhibit the fermentation process for ethanol production (Palmqvist
and Hann-Hägerdal 2000).
Fig. 4-3 Decomposition pathway of crystalline cellulose as treated by semi-flow
HCW (Phaiboonsilpa et al. 2010)
Under the HCW conditions, the ionization constant of water increases with
temperature and the amount of dissociation also increases, compared with normal
temperature and pressure. The glucosidic linkages of cellulose are cleaved and
cellulose starts to hydrolyze into cello-oligosaccharides, and subsequently,
hydrolyzed to monosaccharide of glucose (Antal and Mok 1990a; Kruse and Gawlik
OH OH
OO
HO
O
O
OH
HO
OH
OO
HO
O
O
OH
HO
OH
O
OH OH
Cellulose I
HOO
HO
OH
O
O
OH
HO
OH
OO
HO
OH
O
O
OH
HO
OH
OH
n=0-3
OH OH
Cello-oligosaccharides
O
HO
HO
OH
OH
OH
Glucose
O
HO
HO
HO
OH
OH
Mannose
O
OH
OH
CH2OH
CH2OHOH
Fructose
Dehydrated products
Hydrolyzed
Products
Degraded
Products
Other products (organic acids, etc.)
Further degradation
Furfural Levoglucosan5-HMF
OOHO
O O
O
OH
OH
OH
O
Fragmented products
Erythrose Glycolaldehyde Methylglyoxal
HO
O
OH
OH
H O
O
H O
O

59
2003; Phaiboonsilpa et al. 2010). Isomerization of glucose occurred producing
fructose and mannose. These monosaccharides are unstable at high temperature and
thus some parts of them are further converted into their degraded products such as
furfural, 5-hydroxymethyl furfural (5HMF), levoglucosan through dehydration, and
erythrose, glycolaldehyde, methylglyoxal through fragmentation (Antal and Mok
1990b). Prolonged treatment, however, allows further degradation to take place,
generating other products such as organic acids.
The resulted WS portion percentages based on the dried weight of cellulose
samples are summarized in Table 4-2. It was clearly indicated that the celluloses
have been converted to the hydrolyzed and degraded products. The hydrolyzed
products are comprised of cello-oligosaccharides, glucose, fructose and mannose,
whereas the degraded products consist of dehydrated and fragmented products, as
well as organic acids. Their productions were recorded higher in hydrolyzed products
as compared with degraded products, and more yields were obtained as treatment
temperatures increased.
These WS portions were calculated similarly as in the previous studies
(Lu et al. 2009; Phaiboonsilpa et al. 2010). The cello-oligosaccharides were
consisted of cellobiose, cellotriose, cellotetraose, cellopentaose, cellohexaose and
other cello-oligosaccharides with the higher DP. The more existence of the cello-
oligosaccharides with the higher DP shows that the cellulose has more resistance
against hydrolysis by semi-flow HCW treatment. In addition to cello-
oligosaccharides and glucose, a smaller amount of fructose was also detected and
only traces of mannose were identified. A much lower yield of the WS portions
obtained at 230 ˚C/10 MPa/15 min was due to the difficulty of the crystalline
structures of celluloses to be hydrolyzed at such lower temperature (Phaiboonsilpa et
al. 2011). The cello-oligosaccharides observed could be obtained from the
paracrystalline cellulose. The observed fructose is not a sugar component in cotton
linter, but it maybe isomerized from glucose after hydrolysis from cellulose
(Kabyemela et al. 1999; Srokol et al. 2004).

60
Semi-flow
HCW
treatments
under
10MPa/15min
Yield (wt%)
Water-soluble portions Water-
insoluble
residue
Hydrolyzed products Degraded products
Unknown Total
Cello-oligo-
saccharides Glucose Fructose Mannose
Dehydrated Fragmented
Organic
acids
Group I
Cell I
230˚C 3.4 1.2 0.1 0.0 0.2 0.1 0.0 4.9 9.9 90.1
250˚C 12.3 6.2 0.6 0.0 1.6 0.9 0.2 2.9 24.7 75.3
270˚C 31.8 17.8 2.4 0.0 7.1 2.3 1.1 6.2 68.7 31.3
Cell IIII
230˚C 5.0 2.2 0.1 0.0 0.3 0.1 0.4 4.7 12.8 87.2
250˚C 12.0 6.1 0.5 0.0 1.2 0.4 0.5 10.3 31.0 69.0
270˚C 31.3 17.9 3.5 0.0 7.1 2.7 0.8 21.9 85.2 14.8
Cell IVI
230˚C 8.1 3.1 0.2 0.0 0.4 0.1 0.2 1.3 13.4 86.6
250˚C 13.5 6.5 0.6 0.0 1.5 0.9 0.3 9.8 33.1 66.9
270˚C 43.4 19.6 4.0 0.0 7.5 3.0 0.6 17.4 95.5 4.5
Group II
Cell II
230˚C 6.4 2.2 0.1 0.0 0.9 0.0 0.5 10.5 20.6 79.4
250˚C 19.4 12.1 0.7 0.0 2.5 1.2 0.5 7.9 44.3 55.7
270˚C 34.7 26.0 6.6 0.0 11.4 6.4 1.0 13.9 100.0 0.0
Cell IIIII
230˚C 15.6 3.9 0.1 0.0 0.5 0.1 0.1 10.6 30.9 69.1
250˚C 31.0 10.7 4.8 0.0 3.8 0.8 0.3 6.6 58.0 42.0
270˚C 46.4 17.6 7.0 0.0 6.8 1.6 0.5 13.9 93.8 6.2
Cell IVII
230˚C 6.1 3.5 0.1 0.0 0.4 0.6 0.1 18.3 29.1 70.9
250˚C 30.2 9.3 0.6 0.0 2.1 2.0 0.4 12.4 57.0 43.0
270˚C 49.4 15.0 2.6 0.0 5.8 6.0 0.8 10.5 90.1 9.9
Table 4-2 The summarized yields of WS portions and water-insoluble residues from the celluloses as treated by semi-flow HCW
at 230-270 ˚C/10 MPa/15 min
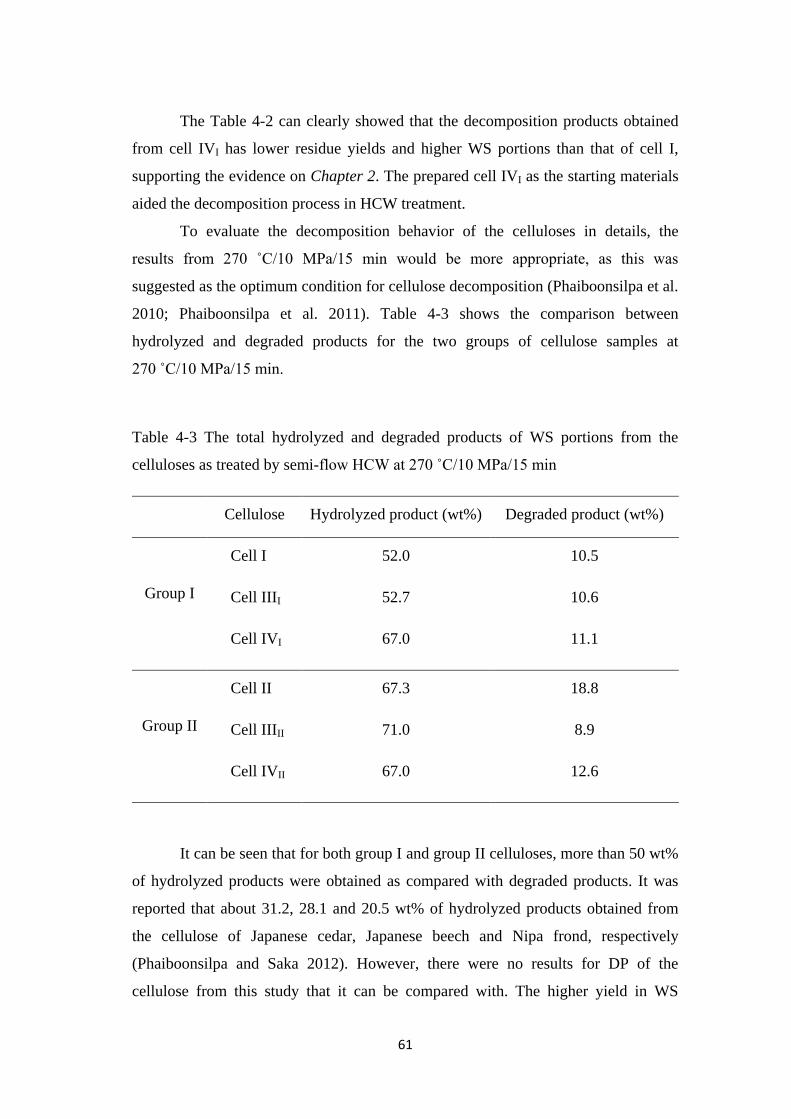
61
The Table 4-2 can clearly showed that the decomposition products obtained
from cell IVI has lower residue yields and higher WS portions than that of cell I,
supporting the evidence on Chapter 2. The prepared cell IVI as the starting materials
aided the decomposition process in HCW treatment.
To evaluate the decomposition behavior of the celluloses in details, the
results from 270 ˚C/10 MPa/15 min would be more appropriate, as this was
suggested as the optimum condition for cellulose decomposition (Phaiboonsilpa et al.
2010; Phaiboonsilpa et al. 2011). Table 4-3 shows the comparison between
hydrolyzed and degraded products for the two groups of cellulose samples at
270 ˚C/10 MPa/15 min.
Table 4-3 The total hydrolyzed and degraded products of WS portions from the
celluloses as treated by semi-flow HCW at 270 ˚C/10 MPa/15 min
Cellulose Hydrolyzed product (wt%) Degraded product (wt%)
Group I
Cell I 52.0 10.5
Cell IIII 52.7 10.6
Cell IVI 67.0 11.1
Group II
Cell II 67.3 18.8
Cell IIIII 71.0 8.9
Cell IVII 67.0 12.6
It can be seen that for both group I and group II celluloses, more than 50 wt%
of hydrolyzed products were obtained as compared with degraded products. It was
reported that about 31.2, 28.1 and 20.5 wt% of hydrolyzed products obtained from
the cellulose of Japanese cedar, Japanese beech and Nipa frond, respectively
(Phaiboonsilpa and Saka 2012). However, there were no results for DP of the
cellulose from this study that it can be compared with. The higher yield in WS
62
portions observed in this present work could probably due to the shorter DP
celluloses used for the starting materials.
According to Fig. 4-3, the hydrolyzed products were produced at the early
stage of cellulose decomposition pathway. This could signify that these celluloses
have resistance against decomposition. The total hydrolyzed products for cell I and
cell IIII is similar but much lesser than cell IVI, whereas the highest hydrolyzed
products obtained in group II is from cell IIIII, followed by cell IVII and cell II.
Overall, celluloses in group II have resulted more hydrolyzed products than those in
group I. The observation is similar for the degraded products.
Figures 4-4 and 4-5, respectively, illustrated how the hydrolyzed and
degraded products were obtained at every 5 min intervals at 270 ˚C/10 MPa/15 min.
In Fig. 4-4, only the yields of cello-oligosaccharides, glucose and fructose were
shown. These yields are comparable with the results in the literatures (Lu et al. 2009;
Phaiboonsilpa et al. 2010; 2011). Based on these results, the cellulose has been
cleaved into cello-oligosaccharides at the early stage of the treatment time and the
production of glucose and fructose was seen to occur simultaneously. Celluloses in
both group I and group II have similar behaviors; however, more products were seen
from group II celluloses. The cello-oligosaccharides and glucose were recovered
from the treatment time of 35 min. The crystalline structure of cellulose remained
unchanged at temperatures around 230 ˚C (Phaiboonsilpa et al. 2009), thus, the WS
portions emerged from the time-up (0-20 min treatment time) could be from
paracrystalline cellulose, and the time at (20-35 min treatment time) was from
cellulose.
Generally, these monosaccharides are further degraded by dehydration or
fragmentation process (Kruse and Dinjus 2007; Lu et al. 2009; Kumar et al. 2010;
Xiao et al. 2011). Figure 4-5 illustrated more dehydrated products were obtained than
fragmented products and organic acids. During the treatments, it can be seen that the
degraded products were generated at almost similar time as the hydrolyzed products
(Fig. 4-4). Moreover, the productions of dehydrated and fragmented products as well
as organic acids were generated concurrently.

63
Fig. 4-4 The hydrolyzed products of cello-oligosaccharides, glucose and fructose in
the WS portions from the celluloses as treated by semi-flow HCW at
270 ˚C/10 MPa/15 min. Top figure corresponds to treatment temperature (open
squares)
50
100
150
200
250
300
0
5
10
15
0
5
10
15
0 5 10 15 20 25 30 35
0
5
10
15
Group II
Cell IIIII
Cell IVII
Cell II
Group I
Cell IIII
Cell IVI
Cell I
Time (min)0
Fru
cto
se (w
t%)
5 10 15 20 25 30 35
0
10
5
150
5
10
150
5
10
Glu
co
se (
wt%
)C
ell
o-o
ligo
sacc
har
ides
(w
t%)
Time (min)
200
250
Tem
p (
˚C)
15
300
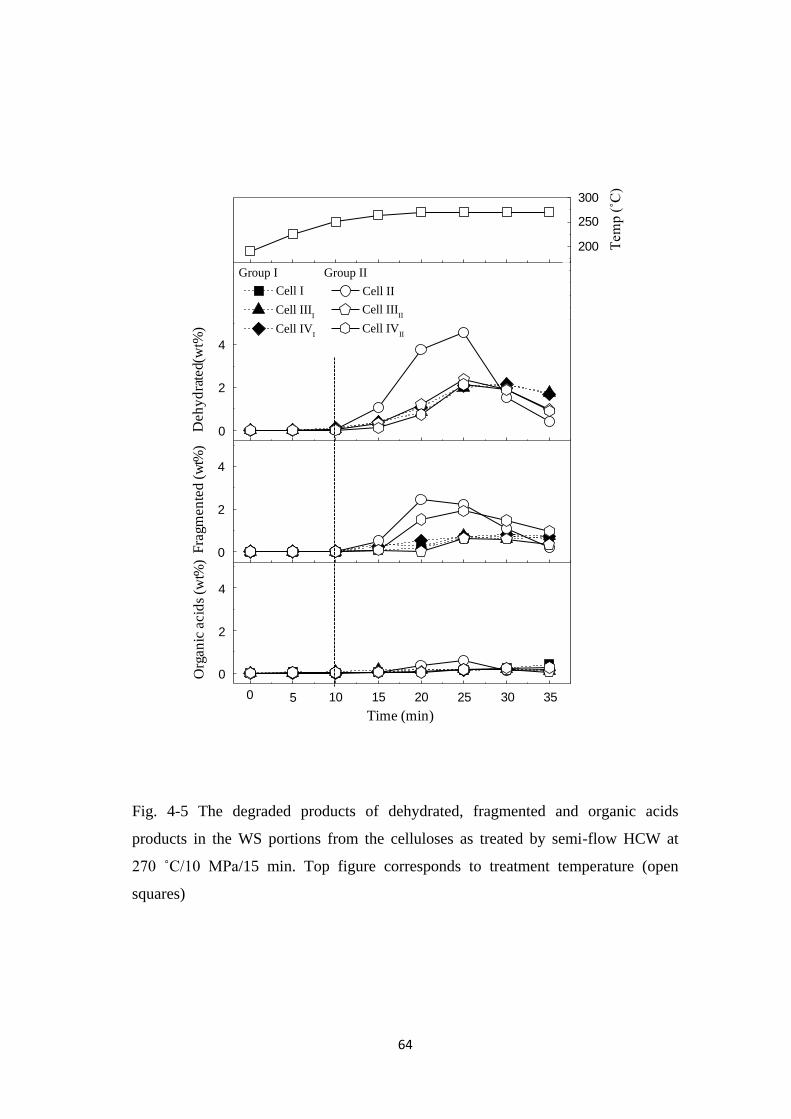
64
Fig. 4-5 The degraded products of dehydrated, fragmented and organic acids
products in the WS portions from the celluloses as treated by semi-flow HCW at
270 ˚C/10 MPa/15 min. Top figure corresponds to treatment temperature (open
squares)
50
100
150
200
250
300
0
2
4
0
2
4
0 5 10 15 20 25 30 35
0
2
4
Group IIGroup I
Cell IIIII
Cell IVII
Cell II
Cell IIII
Cell IVI
Cell I
0
4
Org
an
ic a
cid
s (w
t%)
Time (min)
5 10 15 20 25 30 35
2
0
Fra
gm
en
ted
(w
t%)
Deh
yd
rate
d(w
t%)
4
2
0
4
2
0
200
250
300
Tem
p (
˚C)
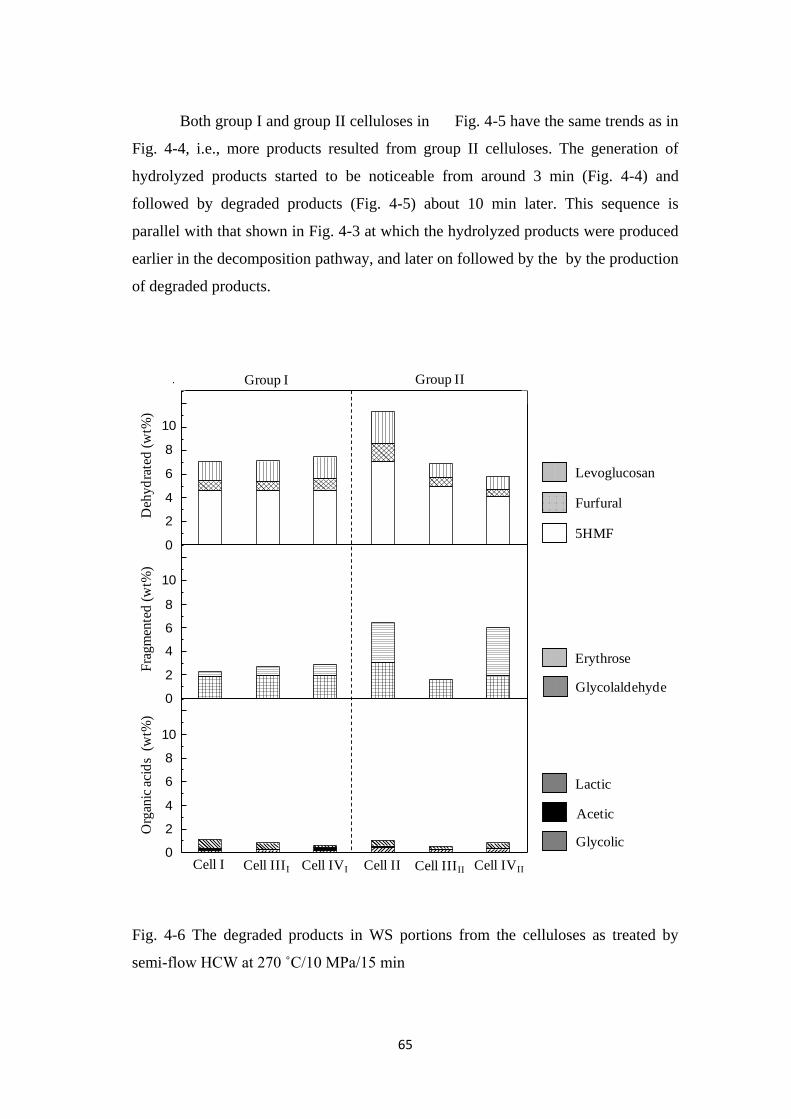
65
Both group I and group II celluloses in Fig. 4-5 have the same trends as in
Fig. 4-4, i.e., more products resulted from group II celluloses. The generation of
hydrolyzed products started to be noticeable from around 3 min (Fig. 4-4) and
followed by degraded products (Fig. 4-5) about 10 min later. This sequence is
parallel with that shown in Fig. 4-3 at which the hydrolyzed products were produced
earlier in the decomposition pathway, and later on followed by the by the production
of degraded products.
Fig. 4-6 The degraded products in WS portions from the celluloses as treated by
semi-flow HCW at 270 ˚C/10 MPa/15 min
Cell I -- Cell III -- Cell IVI -- Cell II -- Cell III2 -- Cell IV2 --0
2
4
6
8
10
12
14
16
18
20
Cell I
Group IIGroup I
De
hyd
rate
d (
wt%
)
Cell I Cell IICell IIII
Cell IVI
Cell IIIII
Cell IVII
Cell I -- Cell III -- Cell IVI -- Cell II -- Cell III2 -- Cell IV2 --0
2
4
6
8
10
12
14
16
18
20
Fra
gm
ente
d (
wt%
)
Cell I Cell IIII
Cell IVI
Cell II Cell IIIII
Cell IVII
Cell I -- Cell III -- Cell IVI -- Cell II -- Cell III2 -- Cell IV2 --0
2
4
6
8
10
12
14
16
18
20
Org
anic
aci
ds
(wt%
)
Cell I Cell IIII
Cell IVI
Cell II Cell IIIII
Cell IVII
Group I Group II
Deh
yd
rate
d (
wt%
)F
rag
men
ted
(w
t%)
Org
anic
aci
ds
(w
t%)
Cell I Cell IIII Cell IVI Cell II Cell IIIII Cell IVII
0
8
6
4
2
10
0
0
10
8
6
4
2
10
8
6
4
2
Levoglucosan
Furfural
5HMF
Erythrose
Glycolaldehyde
Lactic
Acetic
Glycolic

66
Figure 4-6 shows the yield in wt% for the individual degraded products in the
WS portions for both group I and group II celluloses as treated by semi-flow HCW at
270 ˚C/10 MPa/15 min. The dehydrated products detected were consisted of
levoglucosan, furfural and 5HMF, whereas fragmented products such as erythrose,
glycolaldehyde and methylglyoxal. While for organic acids; lactic, acetic, glycolic
and formic acids were identified. The furfural in Fig. 3-6 can not only be produced
from pentose but also from hexose such as glucose. This means that the formation of
furfural is possible without pentose via five-carbon ketoses pathway as proposed in
the literature (Kallury et al. 1986).
Glycolaldehyde and erythrose were formed via retro-aldol condensation in
glycolaldehyde/erythrose pathway (Kabyemela et al. 1999; Sasaki et al. 2002), while
methylglyoxal was produced via glyceraldehyde/dihdroxyacetone pathway in hexose
fragmentation. Nevertheless, the production of methylglyoxal in this case was too
minute that it was excluded from Fig. 4-6. The production of furfural and 5HMF was
significant as compared with other degraded products. The organic acids produced
are the results of further degradation of dehydrated and fragmented products
(Kabyemela et al. 1999; Yoshida et al. 2005). Formic acid production was only a
trace to be included in Fig. 4-6. All the sequences of degradation reactions and
productions are agreeable with Fig. 4-3.
Based on those results above, it can be seen that group II celluloses
dominated both the hydrolyzed and degraded products as compared with group I
celluloses. The result on the WS portions at 270 ˚C/10 MPa/15 min revealed that the
degree of difficulty for decomposition is greater for celluloses in group I than those
in group II.
4.4 Concluding Remarks
This study shows the essential effects of various crystalline celluloses
on their hydrothermal decomposition and its kinetic behaviors as treated by semi-
flow HCW. Both decomposition rate and Ea are helpful in defining the degree of
difficulty for decomposition of the celluloses, however, the Ea obtained were merely
based on empirical relationships of Arrhenius equation. Consequently, the direct

67
method is more preferable than the latter. Nevertheless, this study showed the new
kinetic data as there was no previous data on these specific reaction systems.
These treatments can be used as viable decomposition media for celluloses at
which under the given treatment conditions, cellulose is more readily hydrolyzed
with less degraded products. Group I celluloses (cell I, cell IIII, cell IVI) have shown
to have more resistance to decompose than group II celluloses (cell II, cell IIIII, cell
IVII). Based on this evidence, it was clear that the decomposition behaviors are due
to the different crystalline forms of celluloses. These presented data are useful for
understanding how the celluloses are hydrothermally decomposed, providing useful
insights to efficient utilization of lignocelluloses for biofuels and biochemicals.

68
CHAPTER 5
Conversion of Cellulose III to Its Parent Cellulose in Hydrothermal
Treatment
5.1 Introduction
In previous chapters, the decomposition behaviors of various crystalline
celluloses by semi-flow hot-compressed water (HCW) and enzymatic treatment were
carefully discussed. Both treatment conditions resulted in similar decomposition
behaviors. The treatment with enzyme at 50 ˚C/0.1MPa for ~14 days showed better
hydrolysis for celluloses in group II and cell IIII, and simultaneously, interconversion
of celluloses occurred. Meanwhile, the treatment with semi-flow HCW at
230-270 ˚C/10 MPa/15 min illustrated that celluloses in group II hydrolyzed better,
despite the occurrence of cellulose interconversion.
Amongst the prepared celluloses, cellulose (cell III) has shown a peculiar behavior.
Since cell III is the basis for composite cellulose, it is considered as an important cellulose
allomorph. As mentioned previously in section 1.3.3.3 of Chapter 1, cell III can be further
classified into two polymorphs, cell IIII and cell IIIII. Their unit cells are found to be very
similar, with some differences in intensities of the meridional reflections only (Sarko et al.
1976; Wada et al. 2004b). Even so, one cannot use the crystal model of cell IIII for cell IIIII
and vice versa. The model for crystalline structure of cell IIII (details in Chapter 6) could be
constructed from the work of Wada et al. (2004b), while, for cell IIIII, its structure has yet to
be solved (Zugenmaier 2008). Thus, cell IIIII are not very commonly discussed in literatures
and most findings or studies usually are focussing on cell IIII.
Despite of the reasons mentioned above, investigation on the conversion
behavior of cell III under different temperature and pressure conditions in
hydrothermal treatment would be interesting. Hence, this chapter describes a concise
report to clarify the behavior of cell III qualitatively, in various treatment conditions
as treated by semi-flow HCW.
The original publication is available at Springer via http://link.springer.com/book/10.1007/978-
4-431-54264-3

69
5.2 Materials and Methods
5.2.1 Preparation of cellulose III
Both cell I and cell II were, respectively, converted into cell IIII and cell IIIII
by ethylenediamine (EDA) treatment as described previously. After drying process,
the prepared cellulose samples were stored in desiccators over silicon pellets until
further usage.
5.2.2 Semi-flow hot-compressed water treatment and cellulose residues analyses
The semi-flow HCW system and its operational procedures as carried out in
earlier chapters were used in this study. Here, the cellulose samples were treated at
temperatures between 100 to 270 ˚C under 4, 6 and 10 MPa for 5-15 min. The
insoluble residues left in the reaction cell after treatment were collected, oven-dried
and analyzed independently.
X-ray diffraction (XRD) diagrams of the untreated samples and residues after
the treatment were recorded using an imaging plate (IP) of 80 x 100 mm, mounted on
the X-ray box of Rigaku RINT 2200V. Ni-filtered Cu-Kα radiation (λ=0.15418nm)
generated at 40 kV and 30 mA was used. The samples were irradiated using an
incident X-ray beam that was collimated in the box. The IP was then converted to
XRD diagrams via high sensitivity IP reader RAXIA-Di. In addition, the XRD
pattern was also obtained using X-ray diffractometry and its crystallinity was
measured accordingly.
5.3 Results and Discussion
5.3.1 The X-ray diffraction diagrams of celluloses IIII and IIIII
Figure 5-1 showed the XRD diagrams of cell IIII before (left) and after (right)
the HCW treatment at 270 ˚C/10 MPa/15 min. The diagram of cell IIII (left) has a
strong reflections indexed 010 and 11_
0 located at the equator at d= 0.76 and 0.43 nm
(Wada et al. 2001), respectively. Figure 5-1 (right) illustrated the XRD diagram of
the converted cell IIII to cell I at 270 ˚C/10 MPa/15 min. The reflections indexed
11_
0, 110 and 200 occurred on the equator at d= 0.62, 0.55 and 0.40 nm, respectively.

70
Fig. 5-1 The XRD diagrams of cell IIII before (left) and after (right) the HCW
treatment at 270 ˚C/10 MPa/15 min
All reflection indices in the diagram of Fig. 5-1 (right) closely resembles that
of the Iβ monoclinic unit cell (Woodcock et al. 1980; Sugiyama et al. 1991b), which
indicated that cell IIII fully converted into cell I (Iβ phase) by the HCW treatment at
270 ˚C/10 MPa/15 min. The XRD diagrams to demonstrate the fully converted
cell IIII to cell I at lower temperatures and pressures for 15 min, were not shown here,
which however found to be similar. By using the same treatment time, cell IIII was
shown to convert into cell I at 180 and 230 ˚C under the pressures of 4 and 6 MPa,
respectively.
Fig. 5-2 The XRD diagrams of cell IIIII before (left) and after (right) the HCW
treatment at 230 ˚C/10 MPa/15 min
As for cell IIIII, in general, the full conversion to cell II occurred at lower
temperatures as compared with that of cell IIII. Figure 5-2 illustrated the XRD
(010)
(110)
(110),(110)
(200)
(110)
(010)
(110), (020)

71
diagrams of cell IIIII before (left) and after (right) the HCW treatment at
230 ˚C/10 MPa/15 min. In Fig. 5-2 (left), the reflection of cell IIIII indexed 010 and
11_
0 located at the equator at d= 0.74 and 0.44 nm, respectively. As shown in Fig. 5-2
(right) after the HCW treatment, the reflections were then changed to 110 and 020,
which occurring on the equator at d=0.46 and 0.41 nm, respectively. These
reflections are the characteristic of cell II, which took place at 230 ˚C/10 MPa/15 min.
The XRD diagrams for the conversion of cell IIIII to cell II at other treatment
conditions (at 4, 6 MPa/15 min) were found to be similar. For 5 min treatment time
at 190 ˚C/4 MPa and 200 ˚C/6 MPa, the conversions of cell IIIII to cell II were
already seen to occur.
5.3.2 The X-ray diffraction patterns of celluloses IIII and cell IIIII
In Fig. 5-3, the XRD patterns were plotted over various temperatures in order
to observe the full conversion of cell IIII to cell I, at constant pressure. For 10 MPa at
15 min treatment time, the full conversion occurred at 270 ˚C. Two equatorial
reflections of cell IIII, labelled as 1 and 2 indexed at 010 and 11_
0, respectively, were
observed for the cell IIII (before treatment). As soon as cell IIII treated at lower
temperature at 10 MPa/15 min, a peak 2 shifted noticeably to the smaller angles
because of thermal expansion, in accordance with the peak 1 being smaller.
When the temperature is at 100 ˚C, the peak 1 slowly disappeared and peak 2
became smaller at 150 ˚C and diminished. Whereas peaks 3, 4 and 5 that correspond
to cell I appeared markedly. Consequently, at 200 ˚C, cell IIII was almost completely
converted into cell Iβ phase, with a full transformation at 270 ˚C. The XRD peaks
showed that the 11_
0 lattice diffraction angles for treated crystalline cell IIII were
shifted to around 22.5 ˚ from about 20.8 ˚. The XRD pattern obtained at 270 ˚C
showed that cell I has a cell Iβ pattern. The XRD patterns under 4 and 6 MPa at
various temperatures for 15 min (data not presented) followed a similar pattern as in
Fig. 5-3. The same results were also obtained under wet condition.
Earlier in section 2.3.1 of Chapter 2, it was stated that the conversion of cell
IIII to cell I at lower temperature (230 ˚C/10 MPa) has already started at an early

72
Fig. 5-3 The XRD patterns for cell IIII, converting to cell I (cell Iβ) as treated by HCW at
various temperatures under 10MPa/15min. Peaks 1, 2 and peaks 3, 4, 5 are diffraction angles
of cell IIII and cell I, respectively
270oC
200oC
5 10 15 20 25 30 35
2
Untreated
150oC
100
oC
Cell I (Iβ)
Cell IIII
200˚C
Arb
itra
ry in
ten
sity
2θ (˚)35
1
43
2
270˚C
150˚C
100˚C
5 10 15 20 25 30
5

73
stage of the HCW treatment. The peaks indexed 11_
0 for cell IIII disappeared even
after 2 min treatment. However, at lower temperature and pressure treatment
conditions, 180 ˚C/4 MPa and 230 ˚C/6 MPa at shorter treatment time, 5 min, the full
XRD pattern for cell I was not obtained, as in Fig. 5-4. Here, it can be seen that
peaks 3, 4 and 5 have not yet completely shifted to cell I index planes.
In the case of Fig. 5-5, the XRD patterns for cell IIIII are shown to convert to
cell II when treated by HCW at various temperatures under 10 MPa at 15 min. For
10 MPa/15 min, the full conversion to cell II occurred at 230 ˚C. The equatorial
reflections of cell IIIII, labelled as 1 which indexed 11_
0, totally disappeared and
replaced by the characteristic peaks of cell II; peaks 2 and 3. The behavior is very
similar for treatment at lower pressures (4 and 6 MPa) for 15 min treatment time,
thus, the data are not presented.
Fig. 5-4 The XRD patterns for the residues from cell IIII after treated by semi-flow HCW at
180 ˚C/4 MPa and 230 ˚C/6 MPa at 5 min. Peaks 1, 2 and peaks 3, 4, 5 are diffraction angles
of cell IIII and cell I, respectively
180deg
230deg
270oC
5 10 15 20 25 30 35
2
UntreatedCell IIII
Arb
itra
ry in
ten
sity
2θ (˚)35
1
43
2
5 10 15 20 25 30
5
230˚C/6MPa/5min
180˚C/4MPa/5min
Cell I (Iβ)
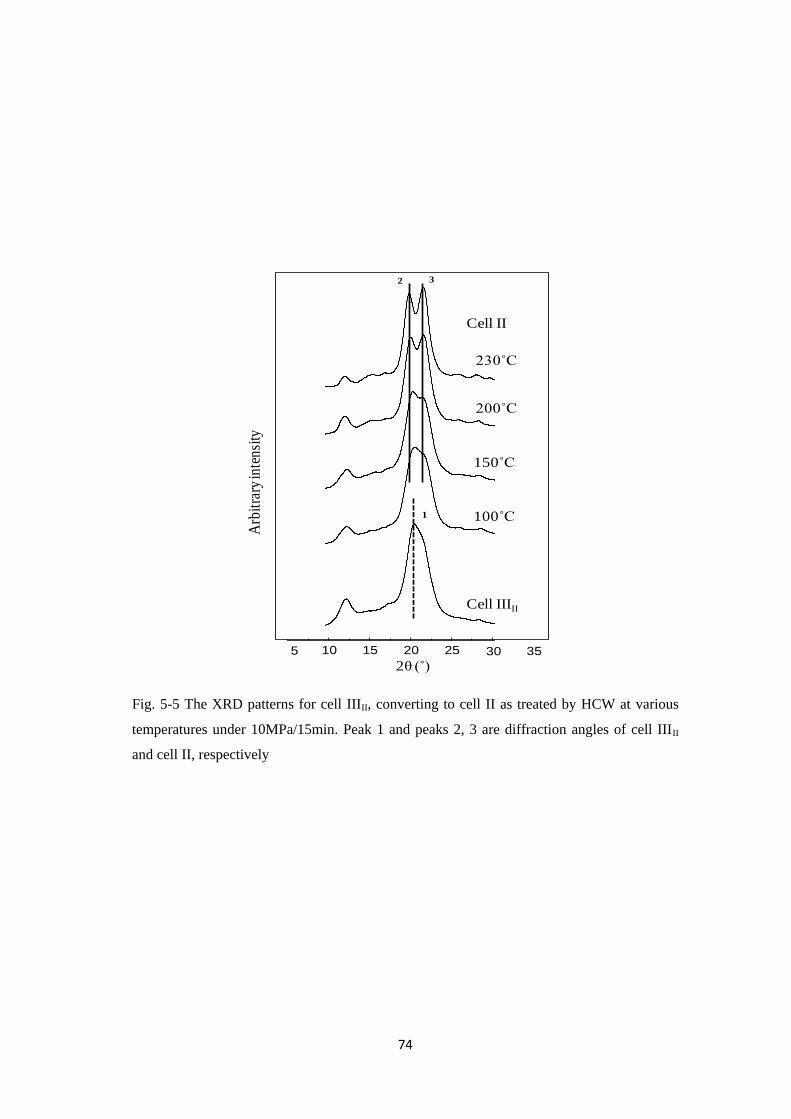
74
Fig. 5-5 The XRD patterns for cell IIIII, converting to cell II as treated by HCW at various
temperatures under 10MPa/15min. Peak 1 and peaks 2, 3 are diffraction angles of cell IIIII
and cell II, respectively
5 10 15 20 25 30 35
C3ii
100deg
150deg
200deg
230deg
Cell II
Cell IIIII
200˚C
Arb
itra
ry in
ten
sity
2θ (˚)35
1
32
230˚C
150˚C
100˚C
5 10 15 20 25 30

75
Fig. 5-6 The XRD patterns for the residues from cell IIIII after treated by semi-flow HCW at
190 ˚C/4 MPa and 200 ˚C/6 MPa at 5 min Peak 1 and peaks 2, 3 are diffraction angles of cell
IIIII and cell II, respectively
Figure 5-6 shows the XRD pattern for conversion of cell IIIII to cell II at
190 ˚C/4 MPa and 200 ˚C/6 MPa for shorter treatment time, 5 min. It can be noticed
that the peaks 2 and 3 are readily shown, however, not as sharp as in cell II. Cell IIIII
converted to its parent cellulose much faster, as compared with the conversion of cell
IIII to cell I, in such treatment conditions.
As for the overall crystallinity of residues, from cell IIII (i.e. cell I) and cell
IIIII (i.e. cell II) after HCW treatments they have not change tremendously and
remained almost constant. The results have no significant difference when they are
treated under different pressure conditions.
5.4 Concluding Remarks
This short experiment has shown how the polymorphs of cell III behave in
lower temperature, pressure and treatment time, within the limits of HCW conditions.
200deg
5 10 15 20 25 30 35
C3ii
Cell IIIII
Arb
itra
ry in
ten
sity
2θ (˚)35
1
32
5 10 15 20 25 30
Cell II
190˚C/4MPa/5min
200˚C/6MPa/5min

76
It can be seen that the conversion of cell III to its parent cellulose are dependent on
pressure and temperature in HCW treatments. The semi-flow HCW treatment
conditions at a range of temperatures between 100-270 ˚C under 4-10 MPa for
5-15 min resulted a slower conversion of cell IIII and cell IIIII to their parent
celluloses. The results are useful additional information to the earlier discussed
studies. Nevertheless, further qualitative and quantitative investigation would be
needed in the future for more in details to reason why such behaviors are occurring in
the HCW conditions.

77
CHAPTER 6
Molecular Dynamics Simulation on Decomposition Behaviors of the Celluloses
6.1 Introduction
In Chapters 2 and 4, the decomposition behaviors of various crystalline
celluloses by hydrothermal treatment i.e., semi-flow hot-compressed water (HCW)
treatments at 230-270 ˚C/10 MPa/15 min have been discussed and shown that the
degree of difficulty for decomposition was dependent on the crystalline structure of
the starting celluloses (Abdullah et al. 2013; 2014). It was concluded that the cell I,
cell IIII and cell IVI (i.e. group I) have more resistance to be decomposed than cell II,
cell IIIII and cell IVII (i.e. group II). Furthermore, observable crystallographic
changes have occurred for cell IIII, cell IVI and cell IIIII during the HCW treatment.
The results above, nevertheless, were not succeeded in explaining the
mechanism that occurred during the HCW treatment. The knowledge on the
interaction process between the water molecules and the celluloses in the HCW
condition would give a better understanding on the decomposition process. Hence, it
is necessary to study the reaction process that takes place during the treatments. The
relationship between cellulose decomposition and various cellulose crystalline
structures is made possible by using computer simulation techniques.
There have been many studies done on molecular dynamics (MD) simulations
for the investigation of crystalline cellulose structures (Bellesia et al. 2010). Some of
them involved the behaviors of cellulose at high temperature conditions. Shen et al.
(2009) performed replica exchange MD simulation at the temperature regions from
~2 to 284˚C by using oligomer model of cellulose. It was demonstrated that the
increment on the flexibility of the glucosidic torsion angles (φ=O5‘-C1‘-O4-C4;
ψ=C1‘-O4-C4-C5), which fluctuated from the global minimum of (-75˚, -120˚) to the
neighbor energy minima at (60 ˚, -120 ˚) and (-80 ˚, 70 ˚), followed according to the
The original publication is available at Springer via http://dx.doi.org/ 10.1007/s10570-014-
0343-y

78
increment of the temperatures. Queyroy et al. (2004) studied the MD simulation of
tetraose and octaose of cellulose and observed that most of the glucopyranose rings
assumed a puckered un-chaired conformation at ~527 ˚C. As the decomposition of
cellulose was considered to relate to the ring conformation change, the evaluation of
the conformational changes would be important (Hosoya et al. 2009).
It is common to use mini crystalline cellulose structure for MD simulation
studies at high temperature regions. The MD simulation of cellulose chains at high
temperature suggested the possibility of the folding of cellulose in its chain
conformation (Tanaka and Fukui 2004). Subsequently, Bergenstråhle et al. (2007)
reported the conformational behavior of cellulose Iβ (cell Iβ) under the high
temperature condition using GROMOS 45a4 force field. They observed that most of
the orientation of hydroxyl group changed from tg to gt conformation and the intra-
molecular hydrogen bond between O2-H and O6 disappeared at high temperature.
Moreover, the unit cell dimension of the crystalline structure shrunk 0.5 % along to
c-axis and elongated 7.4 and 6.0 % along to a- and b- axes, respectively. The value
of γ angle at ~227 ˚C became 2.9 % smaller than that of room temperature.
Another MD simulation by Zhang et al. (2011) indicated the existence of the
phase transition temperature of cell Iβ at ~200 to 227 ˚C. Matthew et al. (2011) used
two different force fields of CHARMM35 and GLYCAM06 to perform a detail
investigation on the temperature effect on cell Iβ. They observed the change of the
side chain orientation from tg to gt in the ‗origin‘ chain and tg to gg in the ‗center‘
chain, respectively.
Crystalline cellulose Iα (cell Iα) converts to cell Iβ (Horii et al. 1987;
Yamamoto et al. 1989; Debzi et al. 1991) and cell IIII to cell Iβ (Roche and Chanzy
1981; Yatsu et al. 1986; Wada 2001) under high temperature region treatments. The
MD simulation on the conversion cell Iα to cell Iβ was reported by Matthews et al.
(2012) and the existence of the intermediate state between cell Iα and cell Iβ is
suggested in their works. Whereas, the conversion from cell IIII to cell Iβ by using
MD simulation were studied by Yui and Hayashi (2007; 2009), Yui (2012) and Uto
et al. (2013). Although the above works discussed the transition behavior of the
crystalline cellulose in details, the decomposition behavior at high temperature and

79
pressure have not been explored fully, except, the investigation on the behavior of
cell Iβ structure in supercritical water (Ito et al. 2002).
This chapter is, therefore, examined the relationship between the crystalline
structures of cellulose and cellulose decomposition in HCW by using MD simulation
by using mini crystalline models of various celluloses. This methodology also
provides the information about the interaction of hydrogen bonds of the models in
HCW conditions, as well as hints in solving the decomposition mechanism.
6.2 Computational Procedures
The MD simulations were carried out with the Gromacs 4.5.5 (Berendsen et
al. 1995; Lindahl et al. 2001; Van Der Spoel et al. 2005; Hess et al. 2008), utilizing
the CHARMM 35 force field for mini crystalline cellulose (Guvench et al. 2008;
2009) and TIP3P for water models (Jorgensen et al. 1983; Durell et al. 1994). The
initial cellulose models used in this study were constructed from the crystalline
coordinates of cell Iβ (Nishiyama et al. 2002) – cotton linter mainly consisted of Iβ
phase, cell II (Langan et al. 2001), cell IIII (Wada et al. 2004b), and cell IVI
(Gardiner and Sarko 1985), respectively. The initial structures of these four
crystalline celluloses are shown in Fig. 6-1. Each model of mini crystalline cellulose
consists of 36 chains with degree of polymerization 10. The mini crystalline surfaces
of the cell Iβ used in our model are (110) and (11_
0), which are known as a lattice
imaging of cotton microfibrils (Abdullah et al. 2013).
Other simulation models with cellulose polymorphs of cell II, cell IIII, and
cell IVI are also constructed to have the same number and the same length of chains
with the model of cell Iβ. The mini crystalline surfaces of the simulation models of
cell II and cell IVI are (110) and (11_
0), which is generally expected as the surface of
these microcrystallites.
Yui and Hayashi (2007; 2009) and Yui (2012) discussed the structure of the
simulation model to investigate the crystalline transformation from cell IIII to cell I.
They reported that the a- and b- planes are very critical for the change of the
hydrogen bonding system when the cell IIII model is simulated at high temperature

80
~97 ˚C. From their results, the mini crystalline with planar (100) and (010) surfaces
was used in our simulation model of cell IIII.
Each crystalline model was placed in an equilibrated cubic box of water
molecules with 8 nm length. All those water molecules that overlapped with the
carbohydrate heavy atoms were deleted. The system first minimized on the water
molecules, while the cellulose chains were fixed at their initial position during 500 ps
with 1.0 fs time step in an NPT ensemble. A Leap-frog algorithm was applied to
integrate the equations of motion in the MD simulations (Hockney 1970). Van der
Waals interactions were smoothly truncated on an atom-by-atom basis using
switching functions from 1.2 to 1.35 nm. Electrostatic interactions were treated using
the particle-mesh Ewald method (Darden et al, 1993; Essmann et al. 1995) with a
real space cut-off of 1.35 nm.
Fig. 6-1 Projection of the initial mini crystalline structures: (a) cell Iβ, (b) cell II, (c)
cell IIII and (d) cell IVI. C, O, and H are represented as gray, red, and white line,
respectively
(a) (b)
(c) (d)

81
The simulation was run at a constant temperature of 230 ˚C and a constant
pressure of 10 MPa, maintained using a constant Nose-Hoover temperature (Nose
1984; Hoover 1985) and Parrinello-Rahman pressure algorithm (Parrinello and
Rahman 1981). The trajectories were run for 10 ns with a step size of 1 fs using full
periodic boundary conditions. For comparison purposes, the systems were also run at
27 ˚C and 0.1 MPa for 10 ns. Molecular graphics were generated with the Visual
Molecular Dynamics (VMD1.9) program (Humphrey et al. 1996).
6.3 Results and Discussion
6.3.1 Dynamics behaviors of the celluloses
Fig. 6-2 Snapshots of cellulose mini crystalline structure after 10 ns MD simulations
at 230 ˚C/10 MPa: (a) cell Iβ, (b) cell II, (c) cell IIII and (d) cell IVI. Solvent water
molecules are not shown in the figures for simplicity
Figure 6-2 shows the snapshots of the final structures on mini crystalline
celluloses at 230 ˚C/10 MPa after the 10 ns dynamics run. In each model, the
disordering of the crystalline structures and the decomposition of a few chains from
(a) (b)
(c) (d)

82
the mini crystalline structures were observed. It can be seen that the behavior of the
disordering were dependent on the types of the crystalline structures i.e., cell II and
cell IIII degrade earlier than those of cell Iβ and cell IVI.
To investigate the disordering behavior on these crystalline structures in more
detail, time dependence of the interaction energies during the simulation were
analyzed and the results are shown in Fig. 6-3. The interaction energies among the
cellulose chains in the crystalline structures are shown in Fig. 6-3 (a), whereas, the
interaction energies between cellulose chains and the surrounding water molecules
are illustrated in Fig. 6-3 (b). The interaction energies of cell Iβ among the cellulose
chains decreased at the beginning stage of the simulation time. However, they keep
almost at constant values most the simulation time. This behavior is very similar to
cell IVI.
These behaviors are well explained from the snapshot conformation in Fig. 6-
2 (a) and (d), that some of the chains existed at the surface area of the mini
crystalline structures decomposed into the water, but the core part of the mini
crystalline structures keep their original arrangement in both cell Iβ and cell IVI. It is
also observed that no water molecules penetrate into the core part of both crystalline
structures.
Although the chains at the surface area are affected by the high temperature
and high pressure conditions, the core part of the crystalline structure remained,
which are observed as the constant interaction energies in the simulation for both
mini crystalline cell Iβ and cell IVI. The similarity on the properties between cell Iβ
and cell IVI has been discussed experimentally as a transition of the crystalline
structure from cell IVI to cell Iβ. We also reported that cell IVI is easily converted to
cell I as treated by HCW experiment over 250 ˚C (Abdullah et al. 2013). Wada et al.
(2004a) mentioned that the crystalline structure of cell IVI is essentially the same
with cell Iβ but it contains lateral disorder in the structure. The results of our
simulation also show that the mini crystalline cell Iβ and cell IVI behave almost the
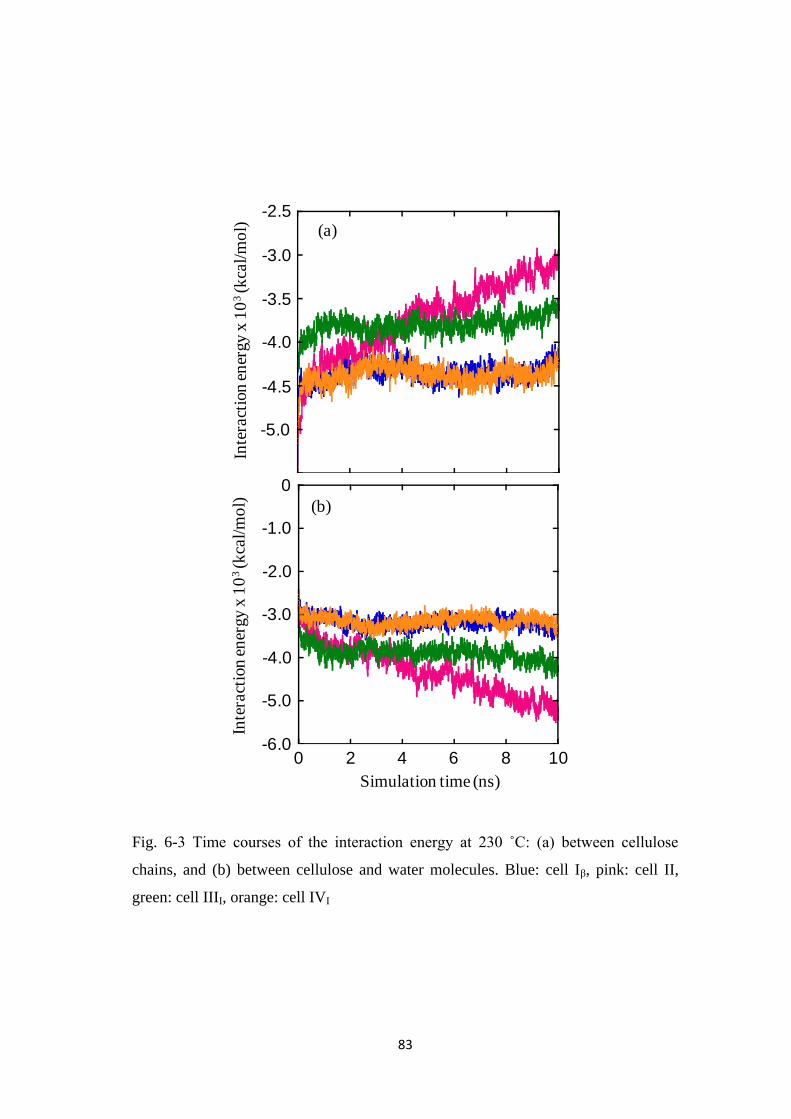
83
Fig. 6-3 Time courses of the interaction energy at 230 ˚C: (a) between cellulose
chains, and (b) between cellulose and water molecules. Blue: cell Iβ, pink: cell II,
green: cell IIII, orange: cell IVI
-5.5x10³
-5x10³
-4.5x10³
-4x10³
-3.5x10³
-3x10³
-2.5x10³
0 2 4 6 8 10
simulation time / ns
(a)In
tera
ctio
n e
ner
gy
x 1
03(k
cal/
mo
l)
-5.0
-4.5
-4.0
-3.5
-3.0
-2.5
-6x10³
-5x10³
-4x10³
-3x10³
-2x10³
-1x10³
0
0 2 4 6 8 10
simulation time / ns
(b)
Inte
ract
ion
en
ergy
x 1
03(k
cal/
mo
l)
Simulation time (ns)
0 2 4 6 8 10
-5.0
-6.0
-4.0
-3.0
-2.0
-1.0
0

84
same under the HCW conditions which implies the occurrence of the transformation
from cell IVI to cell I in an early stage of the simulation.
On the other hand, Fig. 6-3 (a) and (b), respectively, showed the interaction
energy between cellulose chains for cell II increases proportionally with the
simulation time, and, the interaction energy between the cellulose and water
molecules decreases with the simulation time. This indicates that the disordering of
mini crystalline cell II and decomposition of chains progress proportionally
according to the simulation time. In contrast, the interaction energies of cell IIII is
observed to decrease until around 2 ns and then becoming constant until the end of
the simulation time. This behavior is well explained by the snapshot obtained for cell
IIII, Fig. 6-2(c), where two types of behaviors can be observed i.e., on the cellulose
chains at the surface and also at the core regions.
The core part of the cell IIII should be considered to be transformed to the
crystalline structure of cell I (the details will be discussed in the following section).
The transformation of the crystalline structure of cell IIII to cell I have been reported
experimentally and theoretically by some researchers (Wada 2001; Yui and Hayashi
2007; 2009; Yui 2012).
In our experimental report, we observed that the X-ray peak at 2θ ≈ 11.7 o
from cell IIII totally disappeared after the HCW treatments at
230-270 ˚C/10 MPa/15 min and instead, the peaks of cell I appeared at 2θ ≈ 14.4,
16.3 and 22.5 ˚ (Abdullah et al. 2013). Our simulation results could explain the
experimental results from the atomistic scale point of view that the conversion from
cell IIII to cell I occurs at the core part of the mini crystalline structure. From the
observation of the MD simulation, the general behavior of these four crystalline
structures can be summarized in the order of stability under high temperature and
pressure conditions: cell II < cell IIII < cell IVI ≈ cell Iβ. The decomposition
processes of these crystalline structures are discussed in the next sections.
6.3.2 Decomposition processes of celluloses Iβ and IVI
As stated in the previous section, the behavior of cell IVI is very similar to that
of cell Iβ. This similarity is probably due to the transformation of the crystalline
structure from cell IVI to cell Iβ at an early stage of the simulation. This is confirmed

85
by the analyses of the hydrogen bonding networks and the side chain conformation
of cellulose as describe below.
It is known that the major intra-molecular hydrogen bonds of cell Iβ exist at
O3–H…O5 and O6–H…O2 (Nishiyama et al. 2002), and the minor hydrogen bonds
exits at O2-H…O6 and O6-H…O4 (Nishiyama et al. 2002). As the hydrogen should
exchange its position between donor and acceptor atoms during the dynamics run in
the hydrogen bond formation because of the thermal fluctuation, the occupancy
ratios of the hydrogen bonds between the donor and acceptor atoms are calculated
and shown in Table 6-1. As an example, the occupancy ratio of the O3…O5 shows
the addition of the results separately calculated on the O3-H…O5 and O3…H-O5.
The occupancy ratio of the intra-molecular hydrogen bonds of O3…O5 is 0.62. The
occupancy ratio for O6…O2 is also shown in the same table as 0.28. On the other
hand, those in cell IVI are found to be 0.62 and 0.30.
Table 6-1 The occupancy ratio of the hydrogen bond of cell Iβ and cell IVI during the
MD simulation. Only hydrogen bonds with an occurrence above 0.09 are shown.
The criteria used for the hydrogen bonds are A-H distance is less than 2.8 Å
and the D-H-A angle is greater than 110˚, where A and D represent acceptor
and donor atoms, respectively.
It can be seen that the occupancy ratios of the intra-molecular hydrogen bonds
of cell IVI are very similar to those of cell Iβ. This indicates the occurrence on the
Cellulose
Intra-molecular
hydrogen bonds
Inter-molecular
hydrogen bond
O3…O5 O6…O2 O6…O3 O6…O2
Cell Iβ 0.62 0.28 0.09 0.62
Cell IVI 0.62 0.30 0.09 0.63

86
transition of crystalline cell IVI to cell Iβ during the simulation under high pressure
and temperature conditions in the earlier stage of the simulation.
Nishiyama et al. (2002) reported that the inter-molecular hydrogen bonds of
cell Iβ exist between O6–H…O3 of the ‗origin‘ (the notations are shown in the paper)
chains and between O6–H…O3, O6–H…O2, and O2–H…O6 of the ‗center‘ chains.
However, the analysis shows that the inter-molecular hydrogen bonds between
O6…O3 are almost disappeared in our simulation as listed in table 6-1.
On the other hand, inter-molecular hydrogen bonds of O6…O2 remains. The
same analysis was performed to the mini crystalline structure of cell IVI and the
results are shown in the same table. The behavior of cell IVI is almost similar to the
case of cell Iβ, which again indicates the occurrence of the transition from crystalline
structure of cell IVI to cell Iβ. There are various studies on the hydrogen bonding
systems at high temperature conditions by MD simulation. Those studies mentioned
that the O6…O2 inter-molecular hydrogen bond appeared during the simulations of
cell IVI (Bergenstråhle et al. 2007; Zhang et al. 2011; Agarwal et al. 2011), which we
observed the same behavior.
The torsion angle distributions of the hydroxymethyl side group (O5–C5–C6–
O6) are analyzed for two mini crystalline structures of cell Iβ and cell IVI. It has three
low-energy conformations of gg, gt and tg. The ratios of these conformers are
calculated to be 0.35, 0.26 and 0.39 for the both cases of cell Iβ and cell IVI,
respectively. This result agrees well with the results obtained by other researchers
(Bergenstråhle et al. 2007; Zhang et al. 2011; Matthews et al. 2011). As a summary,
all these results indicate that the structure of cell IVI is transformed into cell Iβ in an
earlier stage of the simulation.
6.3.3 Decomposition process of cellulose II
Previously, we observed that the mini crystalline structures of cell II and cell
IIII decomposed more easily than those of cell Iβ and cell IVI. In this section, the
decomposition process of cell II is discussed in more detail. Figure 6-4 shows some
snapshots of the decomposition behavior of cell II during the 10 ns simulation. Here,

87
Fig. 6-4 The snapshots of decomposition process of cell II during the MD simulation. The water molecules (yellow) were shown only when
they were placed within 3.0 Å from cellulose molecules
(110)
5700 ps0 ps 1050 ps 2690 ps
(a) (b) (c) (d)

88
the water molecules are shown only when they are located within 3.0 Å from the
cellulose chains. It can be observed that the water molecules began to enter the inside
of crystalline cell II according to the progress of the simulation time. After 1 ns
dynamics run, the cellulose chains located at the edge of the mini crystalline
structures are found to be surrounded by the water molecules. Then, these chains
decomposed into the water environment as shown in Fig. 6-4 (c).
Another interesting feature is that some waters are entering the crystalline
structure not only to surround the chains at the edge region but also to enter between
the chains along to the (11_
0) crystalline plane. Even after 1 ns simulation, some
water molecules can be observed at the inter-space between the chains along to the (1
1_
0) crystalline plane as shown in Fig.6-4 (b).
It is well known that the cellulose molecules have intrinsically structural
anisotropy (Yamane et al. 2006). i.e., the equatorial direction of the glucopyranose
ring is hydrophilic due to the three hydroxyl groups on the glucopyranose ring. In
contrast, the axial direction of the ring is hydrophobic because of the CH groups that
are located on the axial positions of the ring. Because of this hydrophobic properties
of the glucopyranose plane, the cellulose chains along to the (11_
0) direction can
stack with each other by hydrophobic interactions and forms a sheet like structure.
As a result, the surface of this sheet structure should be surrounded by the
hydroxyl groups with high density, which makes the surface of this sheet hydrophilic.
It is reasonable to say that the water molecules should enter the crystalline structure
of cell II along the (11_
0) surface because the water molecules can make hydrogen
bond with the hydroxyl groups on the (11_
0) surface. Figure 6-4 (c) shows that the
whole sheet like structure along to the (11_
0) surface is completely surrounded by the
water molecules. Then the whole sheet like structure is observed to be dissociated
into the water.
To investigate the breakage of the hydrogen bonds between the chains in the
mini crystalline structure of cell II, the time courses of the occupancy ratio of the
inter-molecular hydrogen bonds in the cell II were analyzed and the results are

89
shown in Fig. 6-5. Langan et al. (1999) investigated the inter-molecular hydrogen
bonds in the crystalline structure of cell II and reported the patterns of them as
follows: O6-H…O2 for center–center chains, O2-H…O6 for origin–origin chains,
and O6…O3, O2-H…O2 and O6-H…O6 for origin–center chains. Note that, all
these inter-molecular hydrogen bonds of cell II are formed between the cellulose
chains are along to the (11_
0) crystalline plane.
Among the above hydrogen bonds, we analyzed the inter-molecular hydrogen
bonds that were formed between O2…O2, O6…O6 and O6…O2, and the results are
shown in Fig. 6-5. The criteria of the hydrogen bonds are the A–H distance is less
than 2.8 Å and the D–H–A angle is greater than 110°, where A and D are acceptor
and donor atoms, respectively. Occupancy ratio is the percentage of the formation of
hydrogen bond in whole. It can be seen that the occupancy ratio of these hydrogen
bonds monotonically decreases with the progress of the simulation time. These
results suggest that water molecules gradually enter the crystalline structure along the
(11_
0) plane by breaking the inter-molecular hydrogen bonds between cellulose
chains and instead forming the hydrogen bonds between water and cellulose chains.
Hayashi et al. (1974) and Hermans (1949) experimentally identified the existence of
the molecular sheet structures in regenerated cellulose although they called this
structure as plane lattice structures and sheet-like structures, respectively.
Fig. 6-5 Time courses of the occupancy ratio of the inter-molecular hydrogen bonds
in the cell II: (a) O2…O2, (b) O6…O6 and (c) O2…O6
0
0.2
0.4
0.6
0.8
1
0 2 4 6 8 100
0.2
0.4
0.6
0.8
1
0 2 4 6 8 100
0.2
0.4
0.6
0.8
1
0 2 4 6 8 10
(a) (b) (c)
Simulation time / ns
Occ
up
ancy
rat
io
O2…O2 O6…O6 O2…O6

90
We previously proposed a structural formation for regenerated cellulose from
a cellulose/aqueous system using MD simulations (Miyamoto et al. 2009). From the
study, a mechanism of the initial step of the formation of crystalline structure from
the solution was proposed: (i) glucopyranose rings are first stacked with each other
by a hydrophobic interaction and form molecular sheets; (ii) the randomly dispersed
sheet like structures in solution associate by hydrogen bonds with each other to form
three-dimensional structures.
In the case of the structural decomposition mechanism like hydrolysis, the
process might take place with a reverse way of the structural formation mechanism
as follows: (i) water molecules enter the cell II crystalline structures along the (11_
0)
surface, and then the inter-molecular hydrogen bonds between the cellulose sheets
are broken and substituted by the hydrogen bond with water molecules; (ii)
molecular sheets formed by hydrophobic interactions are dissociated from the
remaining mini crystalline structure (see Fig. 6-4 (d)); (iii) the molecular sheets are
dispersed into individual chains, and then each chain is hydrolyzed. These processes
are clearly observed in Fig. 6-4, except the hydrolysis process which cannot be
observed in the MD simulation.
6.3.4 Decomposition process of cellulose IIII
Figure 6-6 shows some snapshots of the decomposition process of mini
crystalline structure of cell IIII during the MD simulation. Water molecules are again
shown when they locate within 3.0 Å from the cellulose molecules. It is observed
that the water molecules enter in between the cellulose chains at an early stage of the
simulation and the disruption of the crystalline arrangement of the chains occurs at
the surface area of the mini crystalline structure. However, it is also observed that the
core part of the crystalline structure still keep its ordered structure even after the 5 ns
simulations run (Fig. 6-6(d)). To investigate the structure change at the core part of
cell IIII during the simulation, the time dependence of the inter-molecular hydrogen
bonds, which is formed between the chains in the cell IIII, were analyzed.

91
Fig.6-6 Snapshots of decomposition process of cell IIII during the MD simulation. The water molecules (green) were shown only when
they were placed within 3.0 Å from cellulose molecule.
5000 ps0 ps 200 ps 1075 ps
(a) (b) (c) (d)

92
Fig. 6-7 Time dependence of the occupancy ratio of the inter-molecular hydrogen
bonds O6…O2 in cell IIII performed at two separate regions; the surface area (blue)
and the core area (pink), as in (a). The time courses of the occupancy ratio of these
inter-molecular hydrogen bonds are shown in (b) and (c), respectively.
0
0.2
0.4
0.6
0.8
1
0 2 4 6 8 10
occu
pa
ncy r
atio
simulation time / ns
(b)
(c)
0
0.2
0.4
0.6
0.8
1
0 2 4 6 8 10
occu
pa
ncy r
atio
simulation time / ns
(a)

93
Wada et al. (2004b) investigated the crystalline structure of cell IIII by using
X-ray diffraction experiment and reported that the inter-molecular hydrogen bonds
exist between O2-H…O6 and O6-H…O2 in the crystalline structure. According to
their results, the formation of the inter-molecular hydrogen bonds in the mini
crystalline structure was investigated. The analyses were separately performed in two
regions, one is the surface area (blue) and the other is the core area (pink), as are
shown in Fig.6-7(a). Its time courses of the occupancy ratio of the inter-molecular
hydrogen bonds are shown in Fig.6-7(b) and (c), respectively.
It is seen that the inter-molecular hydrogen bonds at the surface area of cell
IIII decreases rapidly at an early stage of the simulation. However, in the core part,
the O2…O6 inter-molecular hydrogen bonds decreases but still keep about 40% of
the formation. This result can well be explained when we assume the transformation
of the crystalline structure from cell IIII to cell I as is discussed with Fig.6-8.
.
Fig. 6-8 The transition behaviors of four core chains in cell IIII mini crystalline
structure located at the center in Fig. 6-7 (a) and coloured by pink, are shown for (a)
initial and (b) after 2 ns simulation. Dotted green lines indicate the inter-molecular
hydrogen bonds between O2…O6. Views along to the molecular axis before and
after 2 ns simulation are shown in the lower part of the figures. C-axis is staggered
by ± c/4 along to the c-axis after 2 ns
ii
iii
iv(a) (b) iv
iii
ii
i
i

94
Figure 6-8 shows four chains in the core region of cell IIII model before and
after 2 ns dynamics run. At the beginning of the simulation, inter-molecular
hydrogen bonds of O2…O6 formed between chains i and iii, and between ii and iv,
respectively. These two hydrogen bonds indicate the typical characteristic feature of
the cell IIII crystalline structure
Fig. 6-9 Distribution of the torsion angle of O5–C5–C6–O6. Solid lines analyzed for
four core chains (pink in Fig. 6-7 (a)) and the dotted lines analyzed for twenty outer
chains (blue in Fig.6-7 (a)). (a) cell Iβ at 27 ˚C/0.1 MPa, (b) cell IIII at 27 ˚C/0.1 MPa,
(c) cell Iβ at 230 ˚C/10 MPa and (d) cell IIII at 230 ˚C/10 MPa, respectively
On the other hand, the arrangements of these four chains changes after the 2
ns simulation. The inter-molecular hydrogen bonds can be observed between chain i
and iii, where a hydrogen bond formed between O2…O6. However, the hydrogen
bond between the chain i and iv disappeared after the transition. This transition
0
0.01
0.02
0.03
0.04
0.05
-180 -90 0 90 180
dist
ribu
tion
torsion angle / °
0
0.01
0.02
0.03
0.04
0.05
-180 -90 0 90 180
dist
ribu
tion
0
0.01
0.02
0.03
0.04
0.05
-180 -90 0 90 180
dist
ribu
tion
torsion angle / °
Cell Iβ, 230 ̊ C
Cell IIII, 27˚C Cell IIII, 230 ̊ C(b)
(c)
(d)
0
0.01
0.02
0.03
0.04
0.05
-180 -90 0 90 180
dist
ribu
tion
Cell Iβ, 27 ̊ C (a)tg
gt
gg
Dis
trib
uti
on
Dis
trib
uti
on
Torsion angle (˚) Torsion angle (˚)

95
should reduce the number of the hydrogen bond to the half of cell IIII as was
observed in Fig. 6-7.
The arrangement of the chains and the hydrogen bond pattern in Fig. 6-8(b)
shows the characteristic feature of the crystalline structure of cell I. These results
indicate the occurrence of the transformation of the crystalline structure to cell I at
the core part of the cell IIII under high temperature and pressure conditions.
Another characteristic feature of the transformation from cell IIII to cell I can be seen
in the arrangement of the chains. The observed arrangements of the crystal along to
the fiber axis are shown at the bottom of each Fig. 6-8(a) and (b), respectively. The
slide of chain arrangement along to the c-axis by c/4 can be observed after 2 ns
simulation, which is another characteristic feature of cell I crystal.
The similarity between cell I and core part of cell IIII after 2 ns simulation is
also found in the conformation of the torsion angle at 6 position of glucopyranose
ring. Figure 6-9(c) and (d) shows the torsion angle distribution of O5–C5–C6–O6
for cell I and cell IIII at 230 ˚C. As a comparison, MD simulations at 27 ˚C were also
performed and the results of the torsion angle distribution are shown in the same Fig.
6-9(a) and (b), respectively.
In cell Iβ, the well known tg conformation appeared at 27 ˚C. However, at
230 ˚C, the proportion of tg conformer decreased because of the thermal fluctuation
of the side chain even in the cell Iβ structure (Fig. 6-9 (a) and (c)). In contrast, the
torsion angle distribution of cell IIII had almost no tg conformation at 27˚C. However,
tg conformation increases at high temperature, 230 ˚C. Moreover, torsion angle
distribution of cell IIII at 230 ˚C is similar to that of cell Iβ (Fig.6-9 (c) and (d)). This
supports that the core chains of cell IIII were transformed into cell I.
It is concluded that the process of the decomposition mechanism of cell IIII
crystalline structure is as follows: under high temperature and pressure, cell IIII
transforms to cell I. During the transition process, half number of the inter-molecular
hydrogen bonds is broken and therefore, the cellulose chains at the surface of the
crystal should make hydrogen bonds with water molecules, instead. The surface
chains which are fully solvated by hydrogen bonds with surrounding waters are then
decomposed into the water region. On the other hand, the cellulose chains at the core
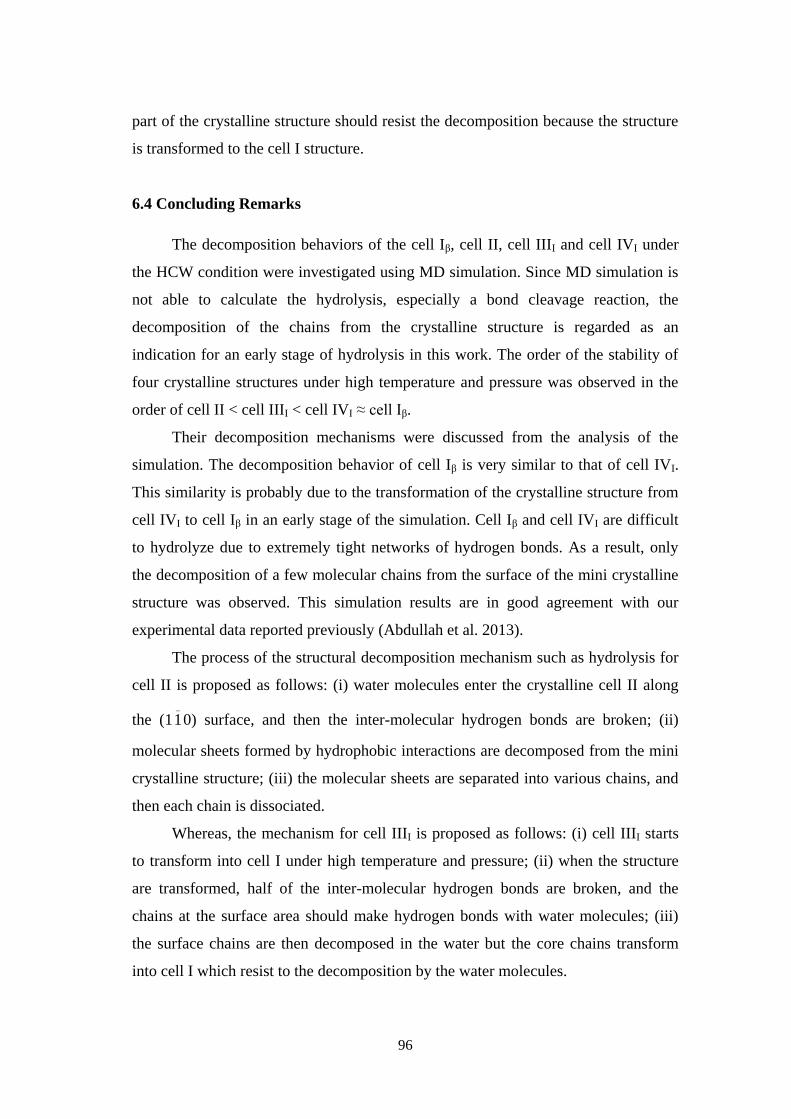
96
part of the crystalline structure should resist the decomposition because the structure
is transformed to the cell I structure.
6.4 Concluding Remarks
The decomposition behaviors of the cell Iβ, cell II, cell IIII and cell IVI under
the HCW condition were investigated using MD simulation. Since MD simulation is
not able to calculate the hydrolysis, especially a bond cleavage reaction, the
decomposition of the chains from the crystalline structure is regarded as an
indication for an early stage of hydrolysis in this work. The order of the stability of
four crystalline structures under high temperature and pressure was observed in the
order of cell II < cell IIII < cell IVI ≈ cell Iβ.
Their decomposition mechanisms were discussed from the analysis of the
simulation. The decomposition behavior of cell Iβ is very similar to that of cell IVI.
This similarity is probably due to the transformation of the crystalline structure from
cell IVI to cell Iβ in an early stage of the simulation. Cell Iβ and cell IVI are difficult
to hydrolyze due to extremely tight networks of hydrogen bonds. As a result, only
the decomposition of a few molecular chains from the surface of the mini crystalline
structure was observed. This simulation results are in good agreement with our
experimental data reported previously (Abdullah et al. 2013).
The process of the structural decomposition mechanism such as hydrolysis for
cell II is proposed as follows: (i) water molecules enter the crystalline cell II along
the (11_
0) surface, and then the inter-molecular hydrogen bonds are broken; (ii)
molecular sheets formed by hydrophobic interactions are decomposed from the mini
crystalline structure; (iii) the molecular sheets are separated into various chains, and
then each chain is dissociated.
Whereas, the mechanism for cell IIII is proposed as follows: (i) cell IIII starts
to transform into cell I under high temperature and pressure; (ii) when the structure
are transformed, half of the inter-molecular hydrogen bonds are broken, and the
chains at the surface area should make hydrogen bonds with water molecules; (iii)
the surface chains are then decomposed in the water but the core chains transform
into cell I which resist to the decomposition by the water molecules.

97
It has been shown that all the mechanisms above can well explain the observed
phenomena found in the experiments. It is hoped that these findings will be able to
assist further development of the new methods in the dissolution and the
decomposition of the cellulosic materials.

98
CHAPTER 7
Concluding Remarks
7.1 Conclusions
The knowledge on lignocellulosic decomposition in various decomposition
systems is very useful for better and efficient exploitation of wood cellulose. One of
the common current issues is that almost all ethanol from renewable carbon is
obtained from food-based sources. Therefore, such information as above would
certainly affect and possibly reduce the topic of food versus fuel, plus increasing
cellulose utilization in biorefinery. Though a lot of conventional methods have been
proven to utilize lignocelluloses for biofuel and biorefinery; more efficient processes,
techniques as well as products are still in need.
In this dissertation, wood celluloses from cotton linter in various crystalline
forms, as the feedstocks, have been used for hydrothermal treatment by means of a
semi-flow hot-compressed water (HCW) system. This treatment has proven to be
effective in providing hydrolyzed and degraded products as separate product streams.
The physical and hydrothermal conversions of these celluloses treated in HCW
conditions have been discussed in Chapters 2 and 4.
In the HCW treatment condition, at 230˚C/10MPa/15min, the paracrystalline
part of cellulose, whose crystalline structure is somewhat disordered, is readily
decomposed. Furthermore, 270˚C/10MPa/15min is still an optimum condition for the
decomposition of cellulose into glucose and various other cello-oligosaccharides
products. In addition, minimal amounts of degraded products consisted of dehydrated,
fragmented compounds as well as organic acids were also recovered.
The crystallinity is still one of the limiting factors for hydrolysis of cellulose.
It remained unaffected even at a severe treatment condition of 270˚C/10MPa/15min.
The degree of polymerization (DP) is a good parameter to be observed for direct
comparison between various crystalline celluloses. Here, the DP decreased with
treatment temperatures. The crystalline celluloses, which are grouped into group I
(cell I, cell IIII, cell IVI) and group II (cell II, cell IIIII, cell IVII), showed similar

99
behaviors according to their groups. Group I has higher resistance to be decomposed
than group II and the decomposition behaviors were dependent on the different
crystalline forms of the starting celluloses. The decomposition behaviors of these
celluloses were found to follow the native cellulose decomposition pathway under
HCW condition, as reported in literature.
The HCW treatment was also compared with the low temperature/pressure
enzymatic treatment. The modification on the crystalline cell I into other crystalline
structures has someway assisted the enzyme to perform better during hydrolysis
reaction. Among all celluloses, it is shown that enzymatic hydrolysis treatment is
better with cell IIII, and equivalent to group II celluloses, than cell I. Here, the
crystallinity was observed to reduce. This is believed to occur due to the enzyme.
The observation on the DP was similar as in that of HCW treatment. From the results
presented in Chapter 3, it can be said that, the prepared various crystalline celluloses
have assisted the hydrolysis and decomposition process in enzymatic treatments.
In Chapter 5, further investigation was done to observe the physical behaviors
of cell III at lower pressures in HCW environment. During the HCW treatment at a
temperature range between 20-270 ˚C under 4-10 MPa for 5-15 min, it was found
that cell IIII and cell IIIII were reconverted into their respective parent celluloses. The
transformation is observed to be slower at lower temperature and pressures. For that
reason, the physical behaviors of the polymorphs in HCW are dependent on pressure
and temperature within the limit of HCW condition.
The work for this dissertation would not be complete without understanding
the interaction process between the water molecules and the celluloses during the
HCW treatment. Hence, in Chapter 6, a detail investigation by using MD simulation
was performed in order to understand the decomposition behaviors of the crystalline
cellulose structures of cell Iβ, cell II, cell IIII and cell IVI under the HCW condition.
Since MD simulation is not able to calculate hydrolysis, especially a bond cleavage
reaction, the decomposition of the chains from the crystal is then defined as an
indication for an early stage of hydrolysis.
Their decomposition mechanisms were discussed from the analysis of the
simulation. It was found that the decomposition behavior of cell Iβ is very similar to
cell IVI, which probably due to the conversion of cell IVI to cell Iβ in an early stage
100
of the simulation. Both celluloses are more difficult to hydrolyze than cell II and cell
IIII because of the extremely tight networks of hydrogen bonds. As a result, only the
decomposition of few molecular chains from surface of the mini crystal was
observed, agreeable with the experimental data of HCW treatments in Chapter 2.
From the MD simulation analysis, the process of the structural decomposition
mechanism, such as hydrolysis, for cell II and cell IIII are proposed. All the
mechanisms described above can well explain what have been observed
experimentally.
The information discovered from this comprehensive study may lead to a
better way to learn and assist further development of the newer methods in the
liquefaction or decomposition of the cellulosic materials. Not only for bioethanol
productions, the variety of products from celluloses can suggest a great prospect for
their application in many purposes.
7.2 Prospects for Future Researches
This dissertation has successfully demonstrated that hydrothermal technology,
such as non-catalytic HCW, can play important roles in decomposition of cellulosic
materials by producing various bio-products. Though it features many similar trends
with the established non-catalytic sub/supercritical methods of lignocelluloses, yet, it
offers a new alternative process for bioethanol productions. The present research has
opened up few avenues for continuing the development research works on biofuels
or biorefineries. The following research topics may be further explored to acquire a
more inclusive representation of this work: (1) Thorough kinetic studies on the
decomposition of model compounds in both HCW and enzymatic treatments. This
would be useful for reactor design. The enzymatic treatment may proceed better if
potential additives are also included. (2) Developing a suitable catalyst to enhance
and facilitate the decomposition process at a much lower temperature/pressure in
HCW system, thus, higher hydrolysis reactions and lesser production of degraded
products may be achieved. (3) Details investigation of cell IV by high temperature
hydrothermal treatment.

101
References
Abdullah R, Ueda K, Saka S (2013) Decomposition behaviors of various crystalline
celluloses as treated by semi-flow hot-compressed water. Cellulose
20:2321-2333
Abdullah R, Ueda K, Saka S (2014) Hydrothermal decomposition various crystalline
celluloses as treated by semi-flow hot-compressed water. J. Wood Sci.
60:278-286
Aden A, Ruth M, Ibsen K, Jechura J, Neeves K, Sheehan J, Wallace B, Montague L,
Slayton A, Lukas J (2002) Lignocellulosic biomass to ethanol process design
and economics utilizing co-current dilute acid prehydrolysis and enzymatic
hydrolysis for corn stover. Colorado, US, NREL/TP-510-32438
Adschiri T, Hirose S, Malaluan RM, Arai K (1993) Non-catalytic conversion of
cellulose in supercritical and subcritical water. J. Chem. Eng. Jpn.
26:676-680
Agarwal V, Huber GW, Curtis Conner W Jr, Auerbach SM (2011) Simulating
infrared spectra and hydrogen bonding in cellulose Iβ at elevated temperatures.
J Chem. Phys. 135:134506-1–134506-13
Aida TM, Sato Y, Watanabe M, Tajima K, Nonaka T, Hattori H, Arai K (2007)
Dehydration of D-glucose in high temperature water at pressures up to
80 MPa. J. Supercrit. Fluids 40:381-388
Ando H, Sakaki T, Kokusho T, Shibata M, Uemura Y, Hatate Y (2000)
Decomposition behavior of plant biomass in hot-compressed water. Ind. Eng.
Chem. Res. 39:3688-3693
Antal MJ, Mok WSL (1990a) Four-carbon model compounds for the reactions of
sugars in water at high temperature. Carbohydr. Res. 199:111-115
Antal MJ, Mok WSL (1990b) Mechanism of formation of 5-(hydroxymethyl)-2-
furaldehyde from D-fructose and sucrose. Carbohydr. Res. 199:91-109
Ashby MF, Gibson LJ, Wegst U, Olive R (1995) The mechanical properties of
natural materials. I. Material property charts. Proceedings: Mathematical and
Physical Sciences 450:123-140

102
Atalla RH, VanderHart DL (1984) Native cellulose: a composite of two distinct
crystalline forms. Science 223:283-285
Beckham GT, Matthews JF, Peters B, Bomble YJ, Himmel ME, Crowley MF (2011)
Molecular-level origins of biomass recalcitrance: Decrystallization free
energies for four common cellulose polymorphs. J. Phys. Chem. B
115:4118-4127
Bellesia G, Asztalos A, Shen T, Langan P, Redondo A, Ganakaran S (2010) In silico
studies of crystalline cellulose and its degradation by enzymes. Acta Cryst.
D66:1184–1188
Berendsen HJC, Van der Spoel D, Van Drunen R (1995) GROMACS: A message-
passing parallel molecular dynamics implementation. Comput. Phys.
Commun. 91:43-56
Bergenstråhle M, Berglund LA, Mazeau K (2007) Thermal response in crystalline Iβ
cellulose: a molecular dynamics study. J. Phys. Chem. B. 111:9138-9145
Béguin P, Aubert JP (1994) The biological degradation of cellulose. FEMS
Microbial. Rev. 13:25-58
Bisaria VS (1991) Bioprocessing of agro-residues to glucose and chemicals. In:
Martin AM (ed) Bioconversion of waste materials to industrial products,
Elsevier, London, p210-213
Bjeree AB, Olesen AB, Fernqvist T (1996) Pretreatment of wheat straw using
combined wet oxidation and alkaline hydrolysis resulting in convertible
cellulose and hemicellulose. Biotechnol. Bioeng. 49:568-577
Bobleter O, Niesner R, Rohr M (1976) The hydrothermal degradation of cellulosic
matter to sugars and their fermentative conversion to protein. J. Appl. Polym.
Sci. 20:2083-2093
Bobleter O, Bonn G, Concin R (1983) Hydrothermalysis of biomass-production of
raw material for alcohol fermentation and other motor fuels. Alternative En.
Sourc. 3:323-332
Bommarius A, Katona A, Cheben SE, Patel AS, Ragauskas AJ, Knudson K, Pu Y
(2008) Cellulase kinetics as a function of cellulose pretreatment. Metab. Eng.
10:370-381

103
Bracmort K (2013) Algae‘s potential as transportation biofuel. Washington DC, US,
CRS/R42122
Camacho F, González-Tello P, Jurado E, Robles A (1996) Microcrystalline cellulose
hydrolysis with concentrated sulphuric acid. J. Chem. Tech. Biotechol.
67:350-356
Cao Y, Tan H (2002) Effects of cellulase on the modification of cellulose.
Carbohydr. Res. 337:1291-1296
Cao Y, Tan H (2005) Study on crystal structures of enzyme-hydrolyzed cellulosic
materials by X-ray diffraction. Enzyme Microb. Technol. 36:314-317
Cetinkol OP, Dibble DC, Cheng G, Kent MS, Knierim B, Auer M, Wemmer DE,
Pelton JG, Melnichenko YB, Ralph J, Simmons BA, Holmes BM (2010)
Understanding the impact of ionic liquid pretreatment on eucalyptus. Biofuels
1:33-36
Chanzy H, Imada K, Mollard A, Vuong R, Barnoud F (1979) Crystallographic
aspects of sub-elementary cellulose fibrils occurring in the wall of rose cells
cultured in vitro. Protoplasma 100:303-316
Chanzy H, Henrissat B, Noe P, Roche E, Smith P (1983) Subfibrillation of Valonia
cellulose microfibrils. Tappi Proceedings Int. Dissolving and Speciality Pulps
Tappi Press, Atlanta, p203-206
Chidambareswaran PK, Sreenivasan S, Patil NB (1982) Further studies on cellulose
III polymorphs. Transformations to cellulose IV lattices and subsequent
reactions. J. Appl. Polym. Sci. 27:709-730
Classen PAM, Sijtsma L, Stams AJM, De Vries SS, Weusthuis RA (1999)
Utilization of biomass for the supply of energy carriers. Appl. Microbiol.
Biotechnol. 52:741-755
Da Silva Perez D, Montanari S, Vignon MR (2003) TEMPO-mediated oxidation of
cellulose III. Biomacromolecules 4:1417-1425
Dadi AP, Varanasi S, Schall CA (2006) Enhancement of cellulose saccharification
kinetics using an ionic liquid pretreatment step. Biotechnol. Bioeng.
95:904-910
Darden T, York D, Pedersen L (1993) Particle mesh Ewald: An N • log(N) method
for Ewald sums in large systems. J. Chem. Phys. 98:10089-10092

104
Debzi EM, Chanzy H, Sugiyama J, Tekely P, Excoffier G (1991) The Iα→Iβ
transformation of highly crystalline cellulose by annealing in various media.
Macromolecules 24:6816-6822
Deguchi S, Tsujii K, Horikoshi K (2008) Crystalline-to-amorphous transformation of
cellulose in hot and compressed water and its implications for hydrothermal
conversion. Green Chem. 10:191-196
Dinjus E, Kruse A (2004) Hot-compressed water - a suitable and sustainable solvent
and reaction medium? J. Phys.: Condens. Matter 16:S1161-S1169
Duff SJB, Murray WD (1996) Bioconversion of forest products industry waste
cellulosics to fuel ethanol: a review. Bioresour. Technol. 55:1-33
Durell SR, Brooks BR, Ben-Naim A (1994) Solvent induced forces between two
hydrophilic groups. J. Phys. Chem. 98:2198-2202
Ehara K, Saka S (2002) A comparative study on chemical conversion of cellulose
between the batch-type and flow-type systems in supercritical water.
Cellulose 9:301-311
Ehara K, Saka S, Kawamoto H (2002) Characterization of the lignin-derived
products from wood as treated in supercritical water. J. Wood Sci.
48:320-325
Ehara K, Saka S (2005) Decomposition behavior of cellulose in supercritical water,
subcritical water, and their combined treatments. J. Wood Sci. 51:148-153
Essmann U, Perera L, Berkowitz ML, Darden T, Lee H, Pedersen LG (1995) A
smooth particle mesh Ewald potential. J. Chem. Phys. 103:8577-8592
Eriksson KE (1982) Degradation of cellulose. Experientia 38:156-159
Evans R, Wearne RH, Adrian FA (1989) Molecular weight distribution of cellulose
as its tricarbanilate by high performance size exclusion chromatography.
J. Appl. Polym. Sci. 37:3291-3303
Fan LT, Lee YH, Beardmore DH (1980) Mechanism of the enzymatic hydrolysis of
cellulose: effect of major structural features of cellulose on enzymatic
hydrolysis. Biotechnol. Bioeng. 23:177-199
Fan LT, Gharpuray MM, Lee YH (1987) Cellulose hydrolysis biotechnology
monographs. Springer, Berlin, p57-59

105
Favier V, Chanzy H, Cavaille JY (1995) Polymer nanocomposites reinforced by
cellulose whiskers. Macromolecules 28:6365-6367
Fávaro1 SL, Ganzerli TA, de Carvalho Neto AGV, Da Silva ORRF, Radovanovic E
(2010) Chemical, morphological and mechanical analysis of sisal fiber-
reinforced recycled high-density polyethylene composites. Express Polym.
Lett. 4:465–473
Fischer G, Schrattenholzer L (2001) Global bioenergy potentials through 2050.
Biomass Bioenerg. 20:151-159
Franck EU (1987) Fluids at high pressures and temperatures. Pure Appl. Chem.
59:25-34
French AD, Miller DP, Aabloo A (1993) Miniature crystal models of cellulose
polymorphs and other carbohydrates. Int. J. Biol. Macromol. 15:30-36
French AD (2014) Idealized powder diffraction patterns for cellulose polymorphs.
Cellulose 21:885-896
Fujita M, Harada H (2001) Ultrastructure and formation of wood cell wall. In: Hon
DN-S, Shiraishi N (eds) Wood and Cellulosic Chemistry. 2nd ed., New
York, Marcel Dekker, p1-5
Gardiner ES, Sarko A (1985) Packing analysis of carbohydrates and polysaccharides.
16. The crystal structures of cellulose IVI and IVII. Can. J. Chem. 63:173-180
Gardner KH, Blackwell J (1974) The structure of native cellulose. Biopolym.
13:1975-2001
Gray KA, Zhao L, Emptage M (2006) Bioethanol. Cur. Opin. Chem. Biol.
10:141-146
Guvench O, Greene SN, Kamath G, Brady JW, Venable RM, Pastor RW, Mackerell
AD (2008) Additive empirical force field for hexopyranose monosaccharides.
J. Comput. Chem. 29:2543-2564
Guvench O, Hatcher E, Venable RM, Pastor RW, Mackerell AD (2009) CHARMM
additive all-atom force field for glycosidic linkages between hexopyranoses.
J. Chem. Theory Comput. 5:2353-2370
Hall M, Bansal P, Lee JH, Realff MJ, Bommarius AS (2010) Cellulose crystallinity -
a key predictor of the enzymatic hydrolysis rate. J. FEBS 277:1571-1582

106
Harris EE, Beglinger E (1946) Madison wood sugar process. Indus. Eng. Chem.
38:890-895
Hayashi J, Masuda S, Watanabe S (1974) Plane lattice structure in amorphous region
of cellulose fibers. Nippon Kagaku Kaishi 5:948-954
Hayashi J, Sufoka A, Ohkita J, Watanabe S (1975) The confirmation of existences of
celluloses IIII, IIIII, IVI and IVII by the X-ray method. Polym. Lett. Ed.
13:23-27
Heinze T (1998) New ionic polymers by cellulose functionalization. Macromol.
Chem. Phys. 199:2341-2364
Hermans PH (1949) Degree of lateral order in various rayons as deduced from X-ray
measurements. J. Polym. Sci. 4:145-151
Hess B, Kutzner C, Van Der Spoel D, Lindahl E (2008) GROMACS 4: Algorithms
for highly efficient, load-balanced, and scalable molecular simulation.
J. Chem. Theory Comput. 4:435-447
Hockney RW (1970) The potential calculation and some applications. Methods
Comput. Phys. 9:135-211
Hon DNS (1994). Cellulose: a random walk along its historical path. Cellulose
1:1-25
Hon DNS (1996) Functional polymers: a new dimensional creativity in
lignocellulosic chemistry. In: Hon DNS (ed) Chemical modification of
lignocellulosic materials. Dekker, New York, p1-10
Hoover WG (1985) Canonical dynamics: Equilibrium phase-space distributions.
Phys. Rev. A 31:1695-1697
Horii F, Yamamoto H, Kitamaru R, Tanahashi M, Higuchi T (1987) Transformation
of native cellulose crystals induced by saturated steam at high-temperatures.
Macromolecules 20:2946-2949
Horii F (2000) Structure of cellulose: recent developments in its characterization. In:
Hon DN-S, Shiraishi N (eds) Wood and Cellulosic Chemistry. 2nd edition,
New York, Marcel Dekker, p83-91
Hosoya T, Nakao Y, Sato H, Kawamoto H, Sakaki S (2009) Thermal degradation of
methyl β-D-glucoside. A theoretical study of plausible reaction mechanisms.
J. Org. Chem. 74:6891-6894

107
Hsu TA (1996) Pretreatment of biomass. In: Wyman CE (ed) Handbook on
bioethanol: production and utilization. Taylor and Francis, Bristol,
p179-195
Humphrey W, Dalke A, Schulten K (1996) VMD: visual molecular dynamics. J. Mol.
Graphics 14:33-38
Igarashi K, Wada M, Samejima M (2007) Activation of crystalline cellulose to
cellulose IIII results in efficient hydrolysis by cellobiohydrolase. FEBS J.
274:1785-1792
IEA, International Energy Agency (2012). IEA on renewable: An expert view.
J. International Energy Agency, Issue 2, p11-13
IEA, International Energy Agency (2013). Retrieved June 2014:
[http://www.iea.org/aboutus/faqs/renewableenergy/]
Isogai A, Usuda M, Kato T, Uryu T, Atalla RH (1989) Solid-state CP/MAS
13
C NMR study of cellulose polymorphs. Macromolecules 22:3168-3172
Isogai A (1994) Allomorphs of cellulose and other polysaccharides. In: Gilbert RD
(ed) Cellulosic Polymers. Munich, Hanser, p1-24
Isogai A, Atalla RH (1998) Dissolution of cellulose in aqueous NaOH solutions.
Cellulose 5:309-319
Ito T, Hirata Y, Sawa F, Shirakawa N (2002) Hydrogen bond and crystal
deformation of cellulose in sub/super-critical water. Jpn. J. Appl. Phys., Part
141:5809-5814
Jollet V, Chambon F, Rataboul F, Cabiac A, Pinel C, Guillon E, Essayem N (2009)
Non-catalyzed and Pt/γ-Al2O3-catalyzed hydrothermal cellulose dissolution-
conversion: influence of the reaction parameters and analysis of the unreacted
cellulose. Green Chem. 11:2052-2060
Jones JL, Semrau KT (1984) Wood hydrolysis for ethanol production - previous
experience and the economics of selected processes. Biomass 5:109-135
Jorgensen WL, Chandrasekhar J, Madura JD, Impey RW, Klein ML (1983)
Comparison of simple potential functions for simulating liquid water.
J. Chem. Phys. 79:926-935
Jörgensen L (1950) Swelling and heterogeneous hydrolysis of cotton linters and
wood pulp fibers related to their fine structure. Acta Chem. Scand. 4:185-199

108
Kabyemela BM, Adschiri T, Malaluan RM, Arai K (1999) Glucose and fructose
decomposition in subcritical and supercritical water: detailed reaction
pathway, mechanisms and kinetics. Ind. Eng. Chem. Res. 8:2888-2895
Kadam KL, Rydholm EC, McMillan JD (2004) Development and validation of a
kinetic model for enzymatic saccharification of lignocellulosic. Biotechnol.
Progr. 20:698-705
Kalinichev AG, Churakov SV (1999) Size and topology of molecular clusters in
supercritical water: a molecular dynamics simulation. Chem. Phys. Letters,
302:411-417 ISSN 2091-2730
Kalita BB, Gogoi N, Kalita S (2013) Properties of ramie and its blends. Int. J. Eng.
Res. Gen. Sci. 1:1-6
Kallury RKMR, Ambidge C, Tidwell TT, Boocock DGB, Anglevor FA, Steward DJ
(1986) Rapid hydrothermolysis of cellulose and related carbohydrate.
Carbohydr. Res. 158:253-261
Kamio E, Takahashi S, Noda H, Fukuhara C, Okamura T (2006) Liquefaction of
cellulose in hot-compressed water under variable temperatures. Ind. Eng.
Chem. Res. 45:4944-4953
Karr WE, Holzapple MT (2000) Using lime pretreatment to facilitate the enzymatic
hydrolysis of corn stover. Biomass Bioenerg. 18:189-199
Kheshgi HS, Prince RC, Marland G (2000) The potential of biomass fuels in the
context of global climate change: Focus in transportation fuels. Annu. Rev.
Energy Environ. 25:199-244
Klemm D, Heublein B, Fink HP, Bohn A (2005) Cellulose: fascinating biopolymer
and sustainable raw material. Angew. Chem. Int. Ed. 44:3358-3393
Kokot S, Czarnik-Matusewicz B, Ozaki Y (2002) Two-dimensional correlation
spectroscopy and principal component analysis studies of temperature-
dependent IR spectra of cotton-cellulose. Biopolymers (Biospectroscopy),
67:456-469
Kolpak FJ, Weih M, Blackwell J (1978) Mercerization of cellulose: 1. Determination
of the structure of mercerized cotton. Polymer 19:123-131
109
Kroon-Batenburg LMJ, Bouma B, Kroon J (1996) Stability of cellulose structures
studied by MD simulations. Could mercerized cellulose II be parallel?
Macromolecules 29:5695-5699
Kruse A, Gawlik A(2003) Biomass conversion in water at 330-410 ˚C and 30-50
MPa. Identification of key compounds for indicating different chemical
reaction pathways. Ind. Eng. Chem. Res. 42:267-279
Kruse A, Dinjus E (2007) Hot-compressed water as reaction medium and reactant.
Properties and synthesis reactions. J. Supercrit. Fluids 39:362-380
Kulshreshtha AK (1979) A review of the literature on the formation of cellulose IV,
its structure, and its significance in the technology of rayon manufacture.
J. Textile Inst. 70:13-18
Kumar S, Gupta RB (2008) Hydrolysis of microcrystalline cellulose in subcritical
and supercritical water in a continuous flow reactor. Ind. Eng. Chem. Res.
47:9321-9329
Kumar S, Gupta R, Lee YY, Gupta RB (2010) Cellulose pretreatment in subcritical
water; effect of temperature on molecular structure and enzymatic reactivity.
Biores. Technol. 101:1337-1347
Kusdiana D, Minami E, Ehara K, Saka S (2002) Development of the batch-type and
flow-type supercritical fluid biomass conversion systems. In: Proceedings of
the 12th
European Conference and Technology Exhibition on Biomass for
Energy, Industry and Climate Protection, Amsterdam, Germany, p789-792
Langan P, Nishiyama Y, Chanzy H (1999) A revised structure and hydrogen-bonding
system in cellulose II from a neutron fiber diffraction analysis, J. Am. Chem.
Soc. 121:9940-9946
Langan P, Nishiyama Y, Chanzy H (2001) X-ray structure of mercerized cellulose II
at 1Å Resolution. Biomacromolecules 2:410-416
Lee SB, Kim IH, Ryu DDY, Taguchi H (1983) Structural properties of cellulose and
cellulase reaction mechanism. Biotechnol. Bioeng. 25:33-51
Lee SH, Doherty TV, Linhardt RJ, Dordick JS (2009) Ionic liquid-mediated
selective extraction of lignin from wood leading to enhanced enzymatic
cellulose hydrolysis. Biotechnol. Bioeng. 102:1368-1376

110
Lindahl E, Hess B, Van Der Spoel D (2001) GROMACS 3.0: A package for
molecular simulation and trajectory analysis. J. Mol. Model. 7:306-317
Liu C, Wyman CE (2003) The effect of flow rate of compressed-hot water on xylan,
lignin, and total mass removal from corn stover. Indus. Eng. Chem. Res.
42:5409-5416
Liu C, Wyman CE (2005) Partial flow of compressed-hot water through corn stover
to enhance hemicelluloses sugar recovery and enzymatic digestibility of
cellulose. Bioresour. Technol. 96:1978-1985
Loeb L, Segal L (1955) Studies of the ethylenediamine-cellulose complex. I.
Decomposition of the complex by solvents. J. Polym. Sci. 15:343-354
Lu X, Yamauchi K, Phaiboonsilpa N, Saka S (2009) Two-step hydrolysis of
Japanese beech as treated by semi-flow hot-compressed water. J. Wood Sci.
55:367-375
Lynd LR, Cushman JH, Nichols RJ, Wyman CE (1991) Fuel ethanol from cellulosic
biomass. Science 251:1318-1323
Marchessault RH, Liang CY (1960) Infrared spectra of crystalline polysaccharides.
III. Mercerized cellulose. J. Polym. Sci. 43:71-84
Marcus Y (1999) On transport properties of hot liquid and supercritical water and
their relationship to the hydrogen bonding. Fluid Phase Equilib. 164:131-142
Marshall WL, Franck EU (1981) Ion product of water substance, 0-1000 ˚C,
1-10000 bars new international formulation and its background. J. Phys.
Chem. Ref. Data. 10:295-304
Marrinan HJ, Mann J (1956) Infrared spectra of crystalline modifications of cellulose.
J. Polym. Sci. 21:301-311
Matsuoka S, Kawamoto H, Saka S (2011) Thermal glycosylation and degradation
reactions occurring at the reducing ends of cellulose during low-temperature
pyrolysis. Carbohydr. Res. 346:272–279
Matthews JF, Bergenstråhle M, Beckham GT, Himmel ME, Nimlos MR, Brady JW,
Crowly MF (2011) High-temperature behavior of cellulose I. J. Phys. Chem.
B. 115:2155-2166

111
Matthews JF, Himmel ME, Crowly MF (2012) Conversion of cellulose Iα to Iβ via a
high temperature intermediate (I-HT) and other cellulose phase
transformations. Cellulose 19:297-306
McMillan JD (1994) Pretreatment of lignocellulosic biomass. In: Himmel ME, Baker
JO, Overend RP (eds) Enzymatic conversion of biomass for fuels production.
American Chemical Society, Washington DC, p292-324
Meyer KH, Misch L (1937) Positions des atomes dans le nouveau modéle spacial de
la cellulose. Helv. Chim. Acta. 20:232-244
Minowa T, Zhen F, Ogi T, Va´rhegyi G, (1998) Decomposition of cellulose and
glucose in hot-compressed water under catalyst-free conditions. J. Chem. Eng.
Jpn. 31:131-134
Mittal A, Katahira R, Himmel ME, Johnson DK (2011) Effects of alkaline or liquid-
ammonia treatment on crystalline cellulose: changes in crystalline structure
and effects on enzymatic digestibility. Biotechnology for Biofuels 4:1-16
Miyafuji H, Miyata K, Saka S, Ueda F, Mori M (2009) Reaction behavior of wood in
an ionic liquid, 1-ethyl-3-methylimidazolium chloride. J. Wood Sci.
55:215-219
Miyamoto H, Umemura M, Aoyagi T, Yamane C, Ueda K, Takahashi K (2009)
Structural reorganization of molecular sheets derived from cellulose II by
molecular dynamics simulations. Carbohydr. Res. 344:1085-1094
Mok WS, Antal MJ Jr (1992) Uncatalyzed solvolysis of whole biomass
hemicelluloses by hot-compressed liquid water. Ind. Eng. Chem. Res.
31:1157-1161
Mok WSL, Antal MJ, Varhegyi G (1992) Productive and parasitic pathways in
dilute acid-catalyzed hydrolysis of cellulose. Ind. Eng. Chem. Res.
31:94-100
Mormann W, Michel U (2002) Improved synthesis of cellulose carbamates without
by-products. Carbohydr. Polym. 50:201-208
Nakashima K, Yamada L, Satou Y, Azuma J, Satoh N (2004) The evolutionary
origin of animal cellulose synthase. Dev. Genes Evol. 214:81-88
Newman RH (2008) Simulation of X-ray diffractograms relevant to the purported
polymorphs cellulose IVI and IVII. Cellulose 15:769–778

112
Nishiyama Y, Langan P, Chanzy H (2002) Crystal structure and hydrogen-bonding
system in cellulose Iβ from synchrotron X-ray and neutron fiber diffraction.
J. Am. Chem. Soc. 124:9074-9082
Nishiyama Y, Sugiyama J, Chanzy H, Langan P (2003) Crystal structure and
hydrogen-bonding system in cellulose Iα from synchrotron X-ray and neutron
fiber diffraction. J. Am. Chem. Soc. 125:14300-14306
Nose S (1984) A molecular dynamics method for simulations in the canonical
ensemble. Mol. Phys. 52:255-268
Oilgae (2010) Cellulosic ethanol from algae - facts and status. Retrieved August
2014 [http://www.oilgae.com/blog/2010/09/cellulosic-ethanol-from-algae-
%E2%80%93-facts-and-status.html]
Olanrewaju KB (2012) Reaction kinetics of cellulose hydrolysis in subcritical and
supercritical water, Doctoral Dissertation, University of Iowa, United States.
Retrieved August 2014 [http://ir.uiowa.edu/cgi/viewcontent.cgi?article=3101
&context=etd]
O‘Sullivan AC (1997) Cellulose: the structure slowly unravels. Cellulose 4:173–207
Palmqvist E, Hahn-Hägerdal B (2000) Fermentation of lignocellulosic hydrolysates.
II: inhibitors and mechanisms of inhibition. Bioresour. Technol. 74:25-33
Park S, Baker JO, Himmel ME, Parilla PA, Johnson DK (2010) Cellulose
crystallinity index: measurement techniques and their impact on interpreting
cellulase performance. Biotechnology for Biofuels 3:1-10
Parrinello M, Rahman A (1981) Polymorphic transitions in single crystals: a new
molecular dynamics method. J. Appl. Phys. 52:7182-7190
Pereira AN, Mobedshahi M, Ladisch MR (1988) Preparation of cellodextrin.
Methods in Enzymol. 160:26-38
Peterson AA, Vogel F, Lachance RP, Froling M, Antal MJ Jr, Tester JW (2008)
Thermochemical biofuel production in hydrothermal media: A review of sub-
and supercritical water technologies. Energy Environ. Sci. 1:32-65
Phaiboonsilpa N, Lu X, Yamauchi K, Saka S (2009) Chemical conversion of
lignocellulosics as treated by two-step semi-flow hot-compressed water. In:
Proceedings of the World Renewable Energy Congress 2009—Asia, May 19–
21, 2009, Bangkok, p 235–240
113
Phaiboonsilpa N (2010) Chemical conversion of lignocellulosics as treated by two-
step semi-flow hot-compressed water, (Unpublished) Doctoral Dissertation,
Kyoto University, Japan
Phaiboonsilpa N, Yamauchi K, Lu X, Saka S (2010) Two-step hydrolysis of
Japanese cedar as treated by semi-flow hot-compressed water. J. Wood Sci.
56:331-338
Phaiboonsilpa N, Tamunaidu P, Saka S (2011) Two-step hydrolysis of nipa (Nypa
fruiticans) frond as treated by semi-flow hot-compressed water.
Holzforschung 65:659-666
Phaiboonsilpa N, Saka S (2012) Hydrolysis behaviors of lignocellulosics as treated
by two-step semi-flow hot-compressed water. Proceedings of the 10th
International Symposium on Supercritical Fluids (ISSF 2012), May 13-16,
2012, San Fransisco, California, USA. Retrieved June 2014
[http://issf2012.com/handouts/documents/144_004.pdf]
Puri VP (1984) Effect of crystallinity and degree of polymerization of cellulose on
enzymatic saccharification. Biotechnol. Bioeng. 26:1219-1222
Queyroy S, Muller-Plathe F, Brown D (2004) Molecular dynamics simulations of
cellulose oligomers: Conformational analysis. Macromol. Theory Simul.
13:427-440
Rabemanolonstsoa H, Saka S (2013) Comparative study on chemical composition of
various biomass species. RSC Advances 3:3946-3956
Reese ET, Segal L, Tripp VW (1957) The effect of cellulose on the degree of
polymerization of cellulose and hydrocellulose. Text. Res. J.
27:626-632
REN21 Renewable Energy Policy Network (2005) Renewables 2005 Global Status
Report. Washington, DC: Worldwatch Institute
Ribeiro KS, Kobayashi S, Beuthe M, Gasca J, Greene D, Lee DS, Muromachi Y,
Newton PJ, Plotkin S, Sperling D, Wit R, Zhou PJ (2007) Transport and its
infrastructure. In Climate Change 2007: Mitigation. Contribution of Working
Group III to the Fourth Assessment Report of the Intergovernmental Panel on
Climate Change [Metz B, Davidson OR, Bosch PR, Dave R, Meyer LA

114
(eds)], Cambridge University Press, Cambridge, United Kingdom and New
York, NY, USA
Roche E, Chanzy H (1981) Electron microscopy study of the transformation of
cellulose I into cellulose IIII in Valonia. Int. J. Biol. Macromol. 3:201-206
Roelofsen PA (1965) Ultrastructure of the wall in growing cells and its relation to the
direction of the growth. Ad. Bot. Res. 2:69-149
Rogalinski T, Ingram T, Brunner G (2008) Hydrolysis of lignocellulosics biomass in
water under elevated temperatures and pressures. J. of Supercrit. Fluids
47:54-63
Saka S, Ueno T (1999) Chemical conversion of various celluloses to glucose and its
derivatives in supercritical water. Cellulose 6:177-191
Sakaki T, Shibata M, Sumi T, Yasuda S (2002) Saccharification of cellulose using a
hot-compressed water-flow reactor. Ind. Eng. Chem. Res. 41: 661-665
Sarko A, Southwick J, Hayashi J (1976) Packing analysis of carbohydrates and
polysaccharides. 7. Crystal structure of cellulose IIII and its relationship to
other cellulose polymorphs. Macromolecules 9:857-863
Sasaki T, Tanaka T, Nanbu N, Sato Y, Kainuma K (1979) Correlation between X-ray
diffraction measurements of cellulose crystalline structure and the
susceptibility to microbial cellulose. Biotechnol. Bioeng. 21:1031-1042
Sasaki M, Kabyemela B, Malaluan R, Hirose S, Takeda N, Adschiri T, Arai K (1998)
Cellulose hydrolysis in subcritical and supercritical water. J. Supercrit.
Fluids 13:261-268
Sasaki M, Fang Z, Fukushima Y, Adschiri T, Arai K (2000) Dissolution and
hydrolysis of cellulose in subcritical and supercritical water. Ind. Eng. Chem.
Res. 30:2883-2890
Sasaki M, Furukawa M, Minami M, Adschiri T, Arai K (2002) Kinetics and
mechanism of cellobiose hydrolysis and retro-aldol condensation in
subcritical and supercritical water. Ind. Eng. Chem. Res. 41:6642-6649
Sasaki M, Adschiri T, Arai K (2003) Production of cellulose II from native cellulose
by near- and supercritical water solubilization. J. Agric. Food Chem.
51:5376-5381

115
Sasaki M, Adschiri T, Arai K (2004) Kinetics of cellulose conversion at 25 MPa in
sub- and supercritical water. J. Amer. Inst. Chem. Engrs. 50:192-202
Savage PE (1999) Organic chemical reactions in supercritical water. Chem. Rev.
99:603-621
Schacht C, Zetzl C, Brunner G (2008) From plant materials to ethanol by means of
supercritical fluid technology. J. Supercrit. Fluids 46:299-321
Schulz GV, Husemann E (1942) Uber die Verteilung der Molekulargewichte in
abgebauten cellulosen und ein periodisches aufbauprinzip im
cellulosemolekul. Z. Phys. Chem. B 52:23–49
Shen T, Langan P, French AD, Johnson GP, Gnanakaran S (2009) Conformational
flexibility of soluble cellulose oligomers: chain length and temperature
dependence. J. Am. Chem. Soc. 131:14786-14794
Shibazaki H, Kuga S, Okano T (1997) Mercerization and acid hydrolysis of bacterial
cellulose. Cellulose 4:75-87
Sievers C, Valenzuela-Olarte MB, Marzialetti T, Musin I, Agrawal PK, Christopher
WJ (2009) Ionic-liquid-phase hydrolysis of pine wood. Ind. Eng. Chem. Res.
48:1277-1286
Sihtola H, Kyrklund B, Laamanen L, Palenius I (1963) Comparison and conversion
of viscosity and DP-values determined by different methods. Paperi ja
Puu 45:225-232
Sivers MV, Zacchi G (1995) A techno-economical comparison of three processes for
the production of ethanol from pine. Bioresour. Technol. 51:43-52
Srokol Z, Bouche AG, Estrik AV, Strik RCJ, Maschmeyer T, Peters JA (2004)
Hydrothermal upgrading of biomass to fuel; studies on some monosaccharide
model compounds. Carbohydr. Res. 339:1717-1726
Stenberg D (1976) Production of cellulose by Trichoderma. Biotechnol. Bioeng.
Symp. 6:35-53
Stone B (2005) Cellulose: Structure and distribution. In: eLS. John Wiley & Sons
Ltd, Chichester. Retrieved June 2014 [http://onlinelibrary.wiley.com/doi
/10.1038/npg.els.0003892/full]

116
Sueoka A, Hayashi J, Watanabe S (1973) Differences between native cellulose I
and regenerated cellulose I (I‘) (in Japanese). Nippon Kagaku Kaishi
3:594-602
Sugiyama J, Vuong R, Chanzy H (1991a) Electron diffraction study on the two
crystalline phases occurring in native cellulose from an algal cell wall.
Macromolecules 24:4168-4175
Sugiyama J, Persson J, Chanzy H (1991b) Combined infrared and electron
diffraction study of the polymorphism of native celluloses. Macromolecules
24:2461-2466
Sun Y, Cheng J (2002) Hydrolysis of lignocellulosic materials for ethanol production:
a review. Bioresour. Technol. 83:1-11
Tanaka F, Fukui N (2004) The behavior of cellulose molecules in aqueous
environments. Cellulose 11:33-38
TAPPI Standard Methods T230 om-82 (1982)
Tirtowidjojo S, Sarkanen KV, Pla F, McCarthy JL (1988) Kinetics of organosolv
delignification in batch and flow-through reactors. Holzforschung 42:177-183
Tolonen LK, Zuckerstätter G, Penttilä PA, Milacher W, Habicht W, Serimaa R,
Kruse A, Sixta H (2011) Structural changes in microcrystalline cellulose in
subcritical water treatment. Biomacromolecules 12:2544-2551
UNEP, United Nations Environment Programme (2009). Toward sustainable
production and use of resources: Assessing biofuels. Retrieved June 2014
[http://www.unep.org/pdf/biofuels/Assessing_Biofuels_Full_Report.pdf]
Uto T, Hosoya T, Hayashi S, Yui T (2013) Partial crystalline transformation of
solvated cellulose IIII crystals reproduced by theoretical calculations.
Cellulose 20:605-612
U.S. EPA, U.S. Environmental Protection Agency (2011) Biofuels and the
environment: The first triennial report to congress (External Review Draft).
U.S. Environmental Protection Agency, Washington, DC, EPA/600/R-
10/183A
Van Wyk JPH (1997) Cellulose hydrolysis and cellulose adsorption after
pretreatment of cellulose materials. Biotechnol. Tech. 11:443-335

117
Vanderghem C, Boquel P, Blecker C, Paquot M (2010) A multistage process to
enhance cellobiose production from cellulosic materials. Appl. Biochem.
Biotechnol. 160:2300-2307
Van Der Spoel D, Lindahl E, Hess B, Groenhof G, Mark AE, Berendsen HJC (2005)
GROMACS: Fast, Flexible and Free. J. Comput. Chem. 26:1701-1719
Wada M (2001) In situ observation of the crystalline transformation from cellulose
IIII to Iβ. Macromolecules 34:3271-3275
Wada M, Heux L, Isogai A, Nishiyama Y, Chanzy H, Sugiyama J (2001) Improved
structural data of cellulose IIII prepared in supercritical ammonia.
Macromolecules 34:1237-1243
Wada M, Heux L, Sugiyama J (2004a) Polymorphism of cellulose I family:
Reinvestigation of cellulose IV. Biomacromolecules 5:1385-1391
Wada M, Chanzy H, Nishiyama Y, Langan P (2004b) Cellulose IIII crystal structure
and hydrogen bonding by synchrotron X-ray and neutron fiber diffraction.
Macromolecules 37:8548-8555
Wada M, Kwon GU, Nishiyama Y (2008) Structure and thermal behavior of a
cellulose I-ethylenediamine complex. Biomacromolecules 9:2898-2904
Wada M, Ike M, Tokuyasu K (2010) Enzymatic hydrolysis of cellulose I is greatly
accelerated via its conversion to the cellulose II hydrate form. Polym.
Degrad. Stab. 95:543-548
Wang WM, Cai ZS, Yu JY (2008) Study on the chemical modification process of
jute fiber. J. Eng. Fiber. Fabr. 3:1-11
Ward RJ (2011) Cellulase engineering for biomass saccharification. In: Buckeridge
MS, Goldman GH (eds) Routes to cellulosic ethanol. Springer, New York,
p135-151
Weimer PJ, French AD, Calamari TA Jr (1991) Differential fermentation of cellulose
allomorphs by ruminal cellulolytic bacteria. Appl. Environ. Microbiol.
57:3101-3106
Weimer PJ, Hackney JM, French AD (1995) Effects of chemical treatments and
heating on the crystallinity of celluloses and their implications for evaluating
the effect of crystallinity on cellulose biodegradation. Biotechnol. Bioeng.
48:169-178

118
Wheals AE, Basso LC, Alves DMG, Amorim HV (1999) Fuel ethanol after 25 years.
Trends Biotechnol. 17:482-487
Whittaker RH (1970) Communities and ecosystems. The Macmillan Company,
New York, p1-113
Woodcock C, Sarko A (1980) Packing analysis of carbohydrates and polysaccharides.
11. Molecular and crystal structure of native ramie cellulose. Macromolecules
13:1183-1187
Wright JD (1998) Ethanol from biomass by enzymatic hydrolysis. Chem. Eng. Prog.,
84:62-74
Xiao LP, Sun ZJ, Shi ZJ, Xu F, Sun RC (2011) Impact of hot compressed water
pretreatment on the structural changes of woody biomass for bioethanol
production. Bioresources 6:1576-1598
Xin J, Imahara H, Saka S (2009) Kinetics on the oxidation of biodiesel stabilized
with antioxidant. Fuel 88:282-286
Yamane C, Aoyagi T, Ago M, Sato K, Okajima K, Takahashi T (2006) Two different
surface properties of regenerated cellulose due to structural anisotropy.
Polym. J. 38: 819-826
Yamamoto H, Horii F, Odani H (1989) Structural-changes of native celluloses
crystals induced by annealing in aqueous alkaline and acidic solutions at
high-temperatures. Macromolecules 22:4130-4132
Yamamoto H, Horii F (1993) CP/MAS 13
C NMR analysis of the crystal
transformation induced for Valonia cellulose by annealing at high
temperatures. Macromolecules 22:1313-1317
Yang J, Zhang X, Yong Q, Yu S (2010) Three-stage hydrolysis to enhance
enzymatic saccharification of steam-exploded corn stover. Bioresour.
Technol. 101:4930-4935
Yatsu LY, Calamari TA, Jr and Benerito RR (1986) Conversion of cellulose I to
stable cellulose III. Text. Res. J. 56:419-424
Yoshida K, Kusaki J, Ehara K, Saka S (2005) Characterization of low molecular
weight organic acids from beech wood treated in supercritical water. Appl.
Biochem. Biotechnol. 121-124:795-806

119
Yoshida M, Liu Y, Uchida S, Kawarada K, Ukagami Y, Ichinose H, Kaneko S,
Fukuda K (2008) Effects of cellulose crystallinity, hemicellulose, and
lignin on the enzymatic hydrolysis of Miscanthus sinensis to
monosaccharides. Biosci. Biotechnol. Biochem. 72:805-810
Yu Y and Wu H (2009) Characteristics and precipitation of glucose oligomers in the
fresh liquid products obtained from the hydrolysis of cellulose in hot-
compressed water. Ind. Eng. Chem. Res. 48:10682-10690
Yu Y, Wu HW (2010) Understanding the primary liquid products of cellulose
hydrolysis in hot-compressed water at various reaction temperatures.
Energy Fuels 24:1963-1971
Yui T, Hayashi S (2007) Molecular dynamics simulations of solvated crystal models
of cellulose Iα and IIII. Biomacromolecules 8:817-824
Yui T, Hayashi S (2009) Structural stability of the solvated cellulose IIII crystal
models: a molecular dynamics study. Cellulose 16:151-165
Yui T (2012) Crystal structure conversions observed in cellulose IIII crystal models.
Cellulose Commun. (In Japanese) 19:7-11
Zhang Q, Bulone V, Agren H, Tu Y (2011) A molecular dynamics study of the
thermal response of crystalline cellulose Iβ. Cellulose 18:207-22
Zhang YHP, Lynd LR (2004) Toward an aggregated understanding of enzymatic
hydrolysis of cellulose: noncomplexed cellulose systems. Biotech. Bioeng.
88:797-824
Zhang YHP, Lynd LR (2005) Determination of the number-average degree of
polymerization of cellodextrins and cellulose with application to enzymatic
hydrolysis. Biomacromolecules 6:1510-1515
Zhu S, Wu Y, Chen Q, Yu Z, Wang C, Jin S, Ding Y, Wu G (2006) Dissolution of
cellulose with ionic liquids and its application: a mini-review. Green Chem.
8:325-327
Zugenmaier P (2008) Crystalline cellulose and cellulose derivatives: characterization
and structures. Springer, Heidelberg, Germany, p101-151

120
List of Publications and Award
Original papers
1. Abdullah R, Saka S (2012) Hydrolysis behavior of various crystalline celluloses
from cotton linter as treated by one-step semi-flow hot-compressed water. In: Yao
T (ed.) Zero-Carbon Energy Kyoto 2011, Green Energy and Technology, Springer,
Tokyo, 141-146
2. Abdullah R, Saka S (2013) Transformation of crystalline cellulose IIII to cellulose
Iβ in semi-flow hot-compressed water treatment. In: Yao T (ed.) Zero-Carbon
Energy Kyoto 2012, Green Energy and Technology, Springer, Tokyo, 105-111
3. Abdullah R, Ueda K, Saka S (2013) Decomposition behaviors of various
crystalline celluloses as treated by semi-flow hot-compressed water. Cellulose
20:2321-2333
4. Abdullah R, Ueda K, Saka S (2014) Hydrothermal decomposition of various
crystalline celluloses as treated by semi-flow hot-compressed water. J. Wood Sci.
60:278-286
5. Miyamoto H, Abdullah R, Tokimura H, Hayakawa D, Ueda K, Saka S Molecular
dynamics simulation of dissociation behavior of various crystalline celluloses as
treated with hot-compressed water. Cellulose DOI: 10.1007/s10570-014-0343-y
(Published online: 08 July 2014)
6. Abdullah R, Saka S Hydrolysis behaviors of various crystalline celluloses as
treated by cellulase of Tricoderma viride. Cellulose DOI: 10.1007/s10570-014-
0410-4 (Published online: 26 August 2014)

121
Abstracts and Proceedings of International Conferences
1. Abdullah R, Saka S (2011) Hydrolysis behavior of various crystalline celluloses
from cotton linter as treated by one-step semi-flow hot-compressed water.
Abstracts of the 3rd
GCOE International Symposium, August 18-19, 2011,
Suwon, Korea, 96
2. Abdullah R, Saka S (2012) Observation on crystalline cellulose IIII transformed
to Iβ as treated by one-step semi-flow hot-compressed water. Abstracts of the 4th
GCOE International Symposium, May 22-23, 2012, Bangkok, Thailand, 91
3. Abdullah R, Saka S (2012) Decomposition of various crystalline celluloses
treated by semi-flow hot-compressed water. Abstracts of the 4th
GCOE
International Symposium, May 22-23, 2012, Bangkok, Thailand, 51
4. Miyamoto H, Abdullah R, Tokimura H, Hayakawa D, Saka S, Ueda K (2014)
Molecular dynamics simulation on dissociation behaviors of various crystalline
celluloses treated by hot-compressed water. Proceedings of the International
Symposium organized by the Institute for Chemical Research, March 10-12,
2014, Kyoto, Japan, 138-139
5. Abdullah R, Ueda K, Saka S (2014) Comparative study of various crystalline
celluloses in their decomposition behaviors as treated by semi-flow hot-
compressed water. Proceedings of the Grand Renewable Energy 2014
International Conference and Exhibition, July 27-August 1, 2014, Tokyo, Japan,
207
Abstracts and Proceedings in Domestic Meetings
1. Abdullah R, Saka S (2012) One-step hydrolyses of various crystalline celluloses
from cotton linter as treated by semi-flow hot-compressed water. Abstracts of
the 62nd
Annual Meeting of the Japan Wood Research Society, March 15-17,
2012, Sapporo, Japan, 161

122
2. Abdullah R, Saka S (2012) Hydrolyses of cotton linter in various crystalline
forms as treated by one-step semi-flow hot-compressed water. Abstracts of the
19th
Annual Meeting of the Cellulose Society of Japan, Nagoya, Japan, 2012,
July 12-13, 7-8
3. Abdullah R, Ueda K, Saka S (2013) Decomposition behaviors of various
crystalline celluloses as treated by semi-flow hot-compressed water. Abstracts of
the 20th
Annual Meeting of the Cellulose Society of Japan, July 18-19, 2013,
Kyoto, Japan, 27-28
4. Abdullah R, Saka S (2014) Hydrolysis behaviors of various crystalline structures
by enzymatic saccharification. Abstracts of the 21st Annual Meeting of the
Cellulose Society of Japan, July 17-18, 2014, Kagoshimia, Japan, 121
Award
1. Best Group Research Presentation Award in the GCOE Group Presentation
Session, August 3, 2012, Kyoto, Japan
(Presentation title: Hour-by-hour simulation of an energy-independent office
building)
Copyrights on original papers
The author would like to express her sincere appreciations to Springer for its kind
permission in using the accepted manuscripts of the original papers for her
dissertation. Each chapter concerned is acknowledged by providing the original
source of publication and link to the published article on Springer‘s website.

123
Acknowledgments
In the name of Allah, the Most Gracious and the Most Merciful.
First and foremost, I would like to thank Allah for all the blessings that have
been bestowed upon me to be able to pursue and complete this study.
I would like to convey my sincere gratitude to my advisor Professor Shiro
Saka of the Laboratory of Energy Ecosystems, Department of Socio-Environmental
Energy Science, Graduate School of Energy Science, Kyoto University, who is
incredibly supportive with all dissertation, professional and personal issues. His
continued guidance, discussion, motivation and support throughout my research
training in the laboratory are very much appreciated and remembered, otherwise, the
completion of this work would have been impossible. Meeting him for the first time
at the biomass seminar in Jakarta back in 2009 gave the impression that he was a
strict person and I actually felt a little scared and anxious in the beginning. Even so, I
was determined to work under his supervision and became his research student. All
the way through, my thoughts about him were wrong, in fact, knowing him has been
a very great pleasure indeed.
I wish to express my appreciation to Associate Professor Haruo Kawamoto of
Laboratory of Energy Ecosystems, Department of Socio-Environmental Energy
Science, Graduate School of Energy Science, Kyoto University, for his constructive
comments and valuable suggestions, particularly, during weekly student seminars.
My appreciation also goes to Professor Junji Sugiyama, Division of Forest and
Biomaterials Science, Graduate School of Agriculture, Kyoto University, for his
advice and considerations toward the betterment of this dissertation.
For the former GCOE Specific Assistant Professor Kazuchika Yamauchi, I
thank him for his contribution and help, especially on equipment troubleshooting.
His friendly and approachable character in assisting the nitty-gritty part of my
nihongo-wakarimasen experiences in the lab is very much treasured. For Assistant

124
Professor Eiji Minami of Laboratory of Energy Ecosystems, Department of Socio-
Environmental Energy Science, Graduate School of Energy Science, Kyoto
University, his comments and suggestions are very much valued.
A token of appreciation goes to Professor Kazuyoshi Ueda, Dr Hitomi
Miyamoto and the group members of the Department of Advanced Materials
Chemistry, Graduate School of Engineering, Yokohama National University, who
have been very supportive and accommodating in conducting the collaborative works.
Hopefully, they would not be the last ones.
My special thanks to the government of Brunei for generously funding my
four years of study in Kyoto University, as well as the staff members of the Embassy
of Brunei in Japan for their help in everything. In addition, I would like to thank the
GCOE Program from the Graduate School of Energy Science, Kyoto University for
the research funds.
To dear colleagues, Dr Nathanoon, Dr Pramila, Dr Harifara, Dr Fadjar, Dr
Zul Ilham, Dr Asmadi, Dr Mahendra, Mai Ogura, Phoo, Takada, Nakahara,
Fukutome, Sugami and the rest of Saka lab members, I am thankful for their
assistances, moral and emotional supports. To amazing friends Az, Deejah, Erne,
Ezan, Siti, Suzi, Zab, Shaheeda and Sabrina thanks for your invariable love and
support. To my FOS PhD colleagues Zimah, Arif, Rozy, Daphne, Elvy, Hussein and
Hong your constant support in my pursuit of a PhD is very much treasured. For the
charming and kawaii Ms Nakanishi, Ms Senoue, Ms Kyomi and Ms Shibayama, I
thank them for their kindness and help with the logistic, academic and financial
matters.
On a personal note, my sincere thanks extended to my parents and parents-in-
law for their supports beyond measure during my transition period here and always
been there for my family back at home. To my beloved husband, Pg. Hazman Pg.
Jaludin, I am truly grateful for his sacrifices in carrying out the family
responsibilities during my absence. To my precious munchkins, Haziq Izzuddin,

125
Zahra Zulaikha and Aleesya Zaira, the love and smiles from all of them through
Skype/Face Time have always been a source of rejuvenation after long, exhaustive
lab works and they all deserve credit for all my achievements. I am sorry that I have
missed your growing years. They all have supported me wholeheartedly in all my
endeavours. I also wish to thank the entire family members for their love and support.
I love them all dearly.
To my late grandmother, she will remain as the source of inspiration
throughout my life, and I will always remember her words – ―Knowledge is
everything‖. She had inculcated the fighting spirit in me. How I wish she was here…
I miss her…
Last but not least, I would like to thank the others who are not mentioned
here for their continued support and being a part of this journey.
Alhamdulillah….
Rosnah Abdullah
2014