tnz ppt template - tourismnewzealand.com · sources/notes: 1. national bureau of statistics of...
TRANSCRIPT


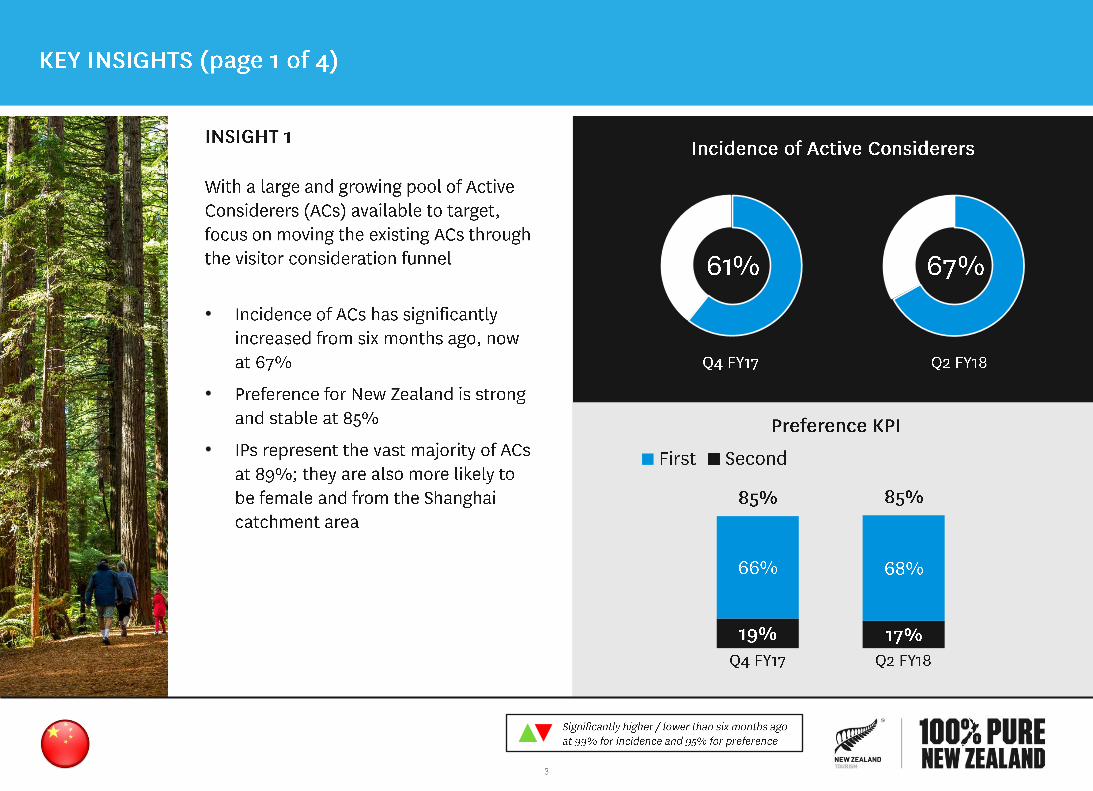
•
•
•
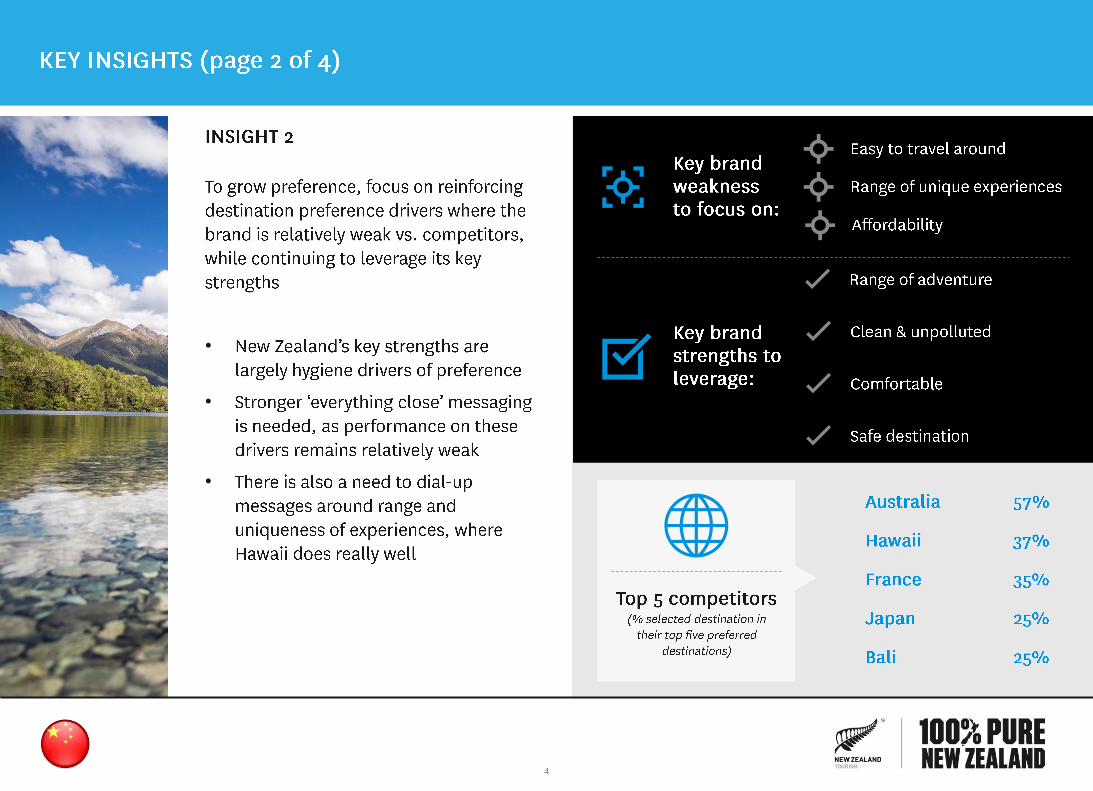
•
•
•
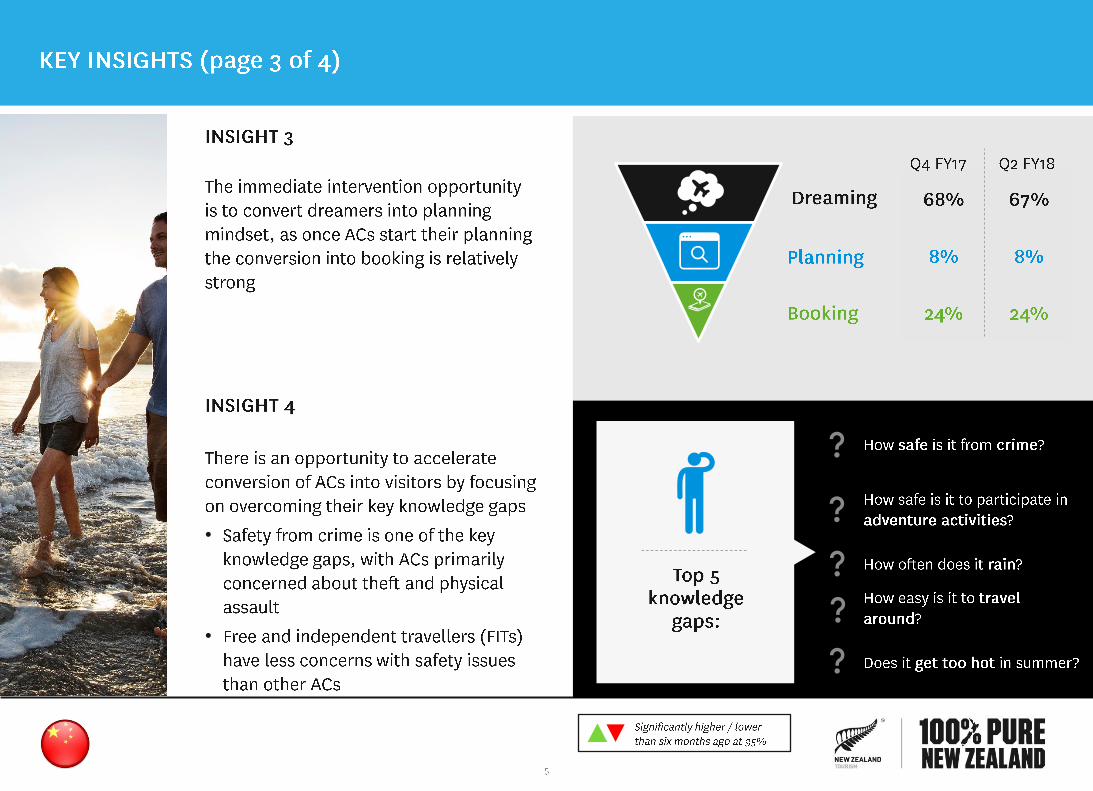
•
•
•
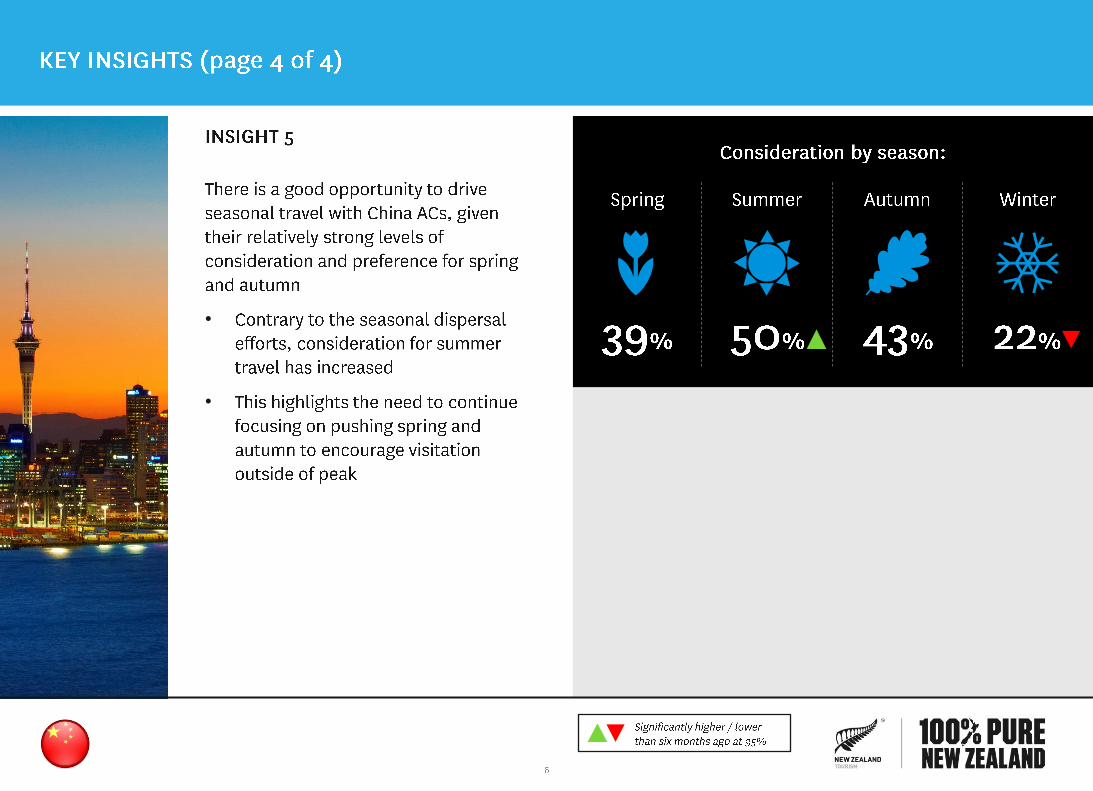
•
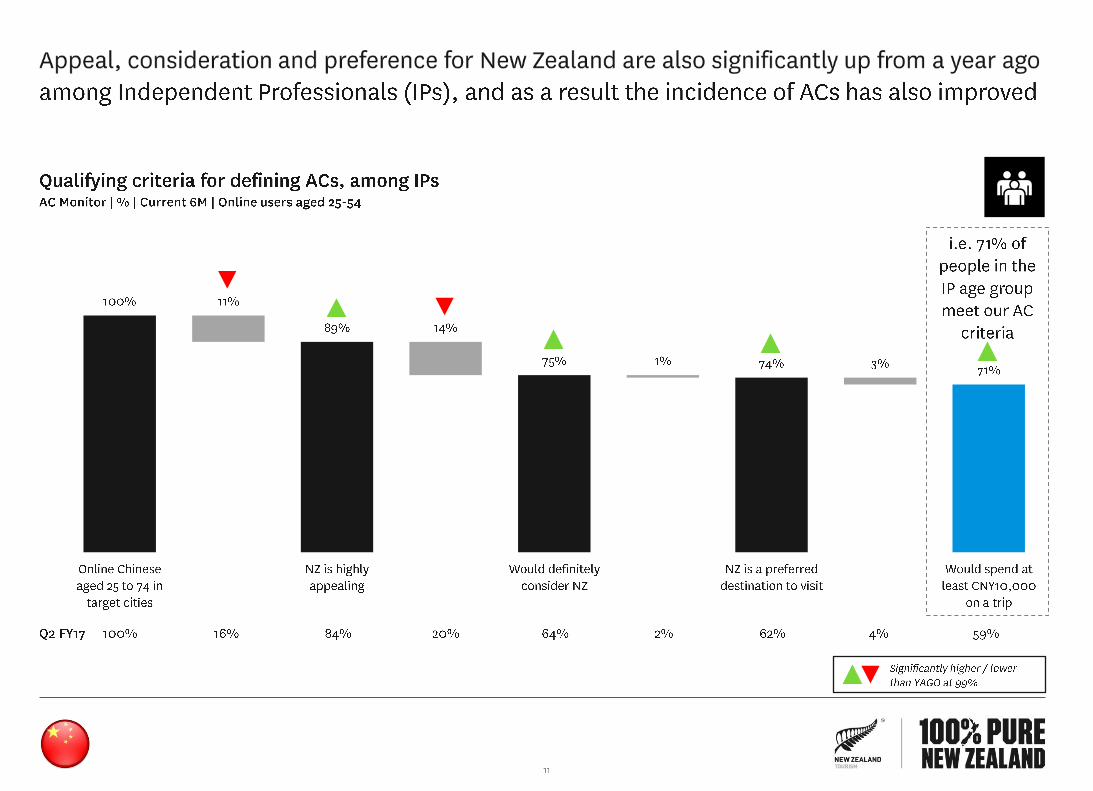
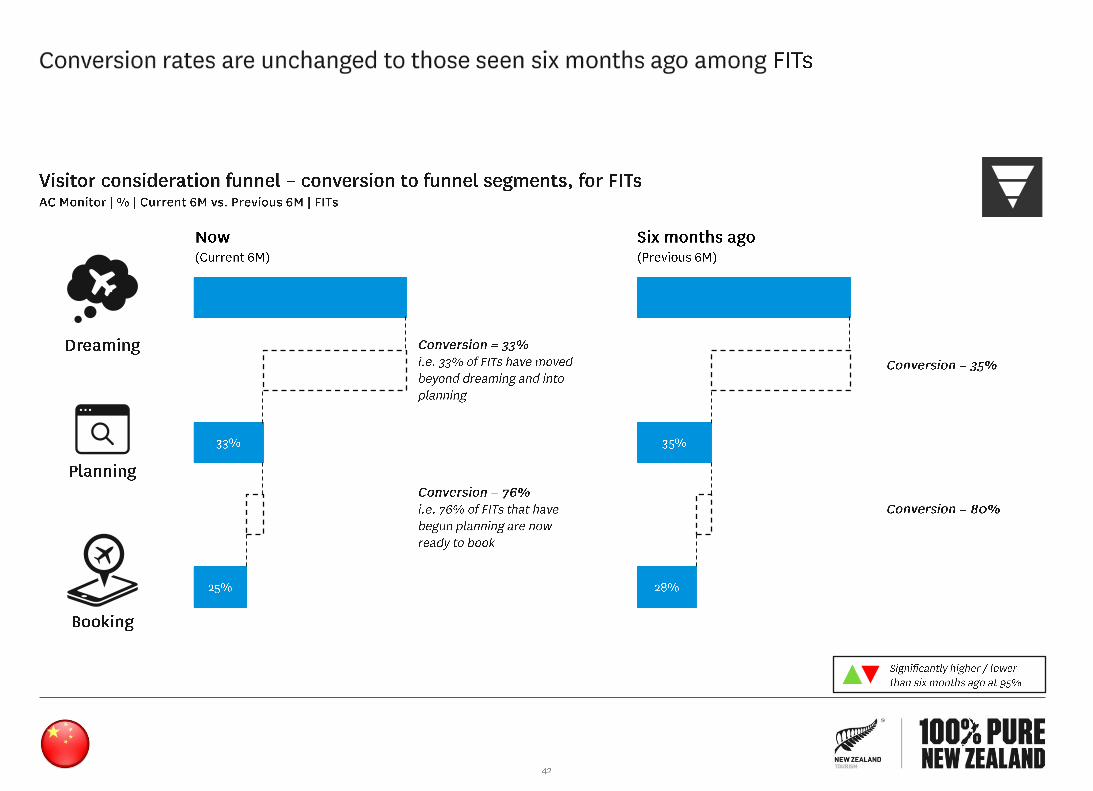
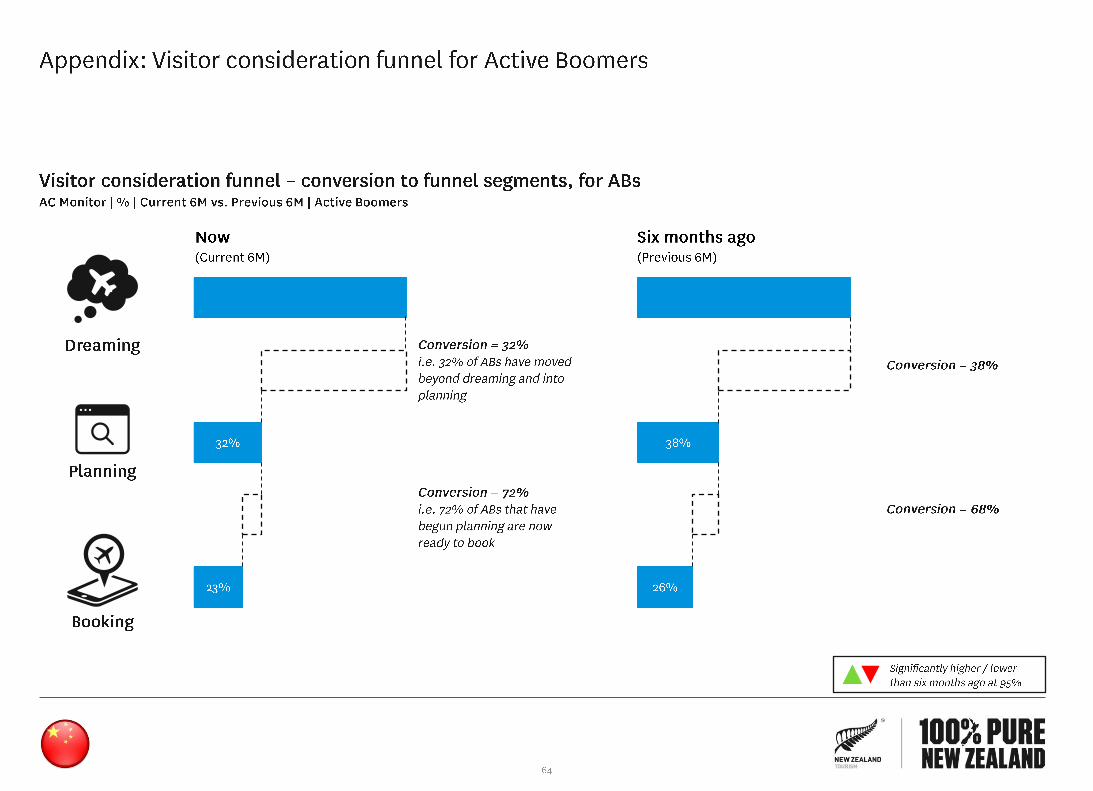
Conversion
Conversion
Conversion
Conversion
Conversion
Conversion
•
•
•
•
•
•
•
•
•
•
•
•
•
•
•
•
•
•
•
•
•
•
•
•
•
•
•
•
•
•
•
•
•
•
•
•
•
•
•
•

•
•
•

•
•
•
•
•
•
•
•
•
•
•
•
•
•
•
•
•
•
•
•
•
•
•
•
•
•
•
•
•
•
•
•
•


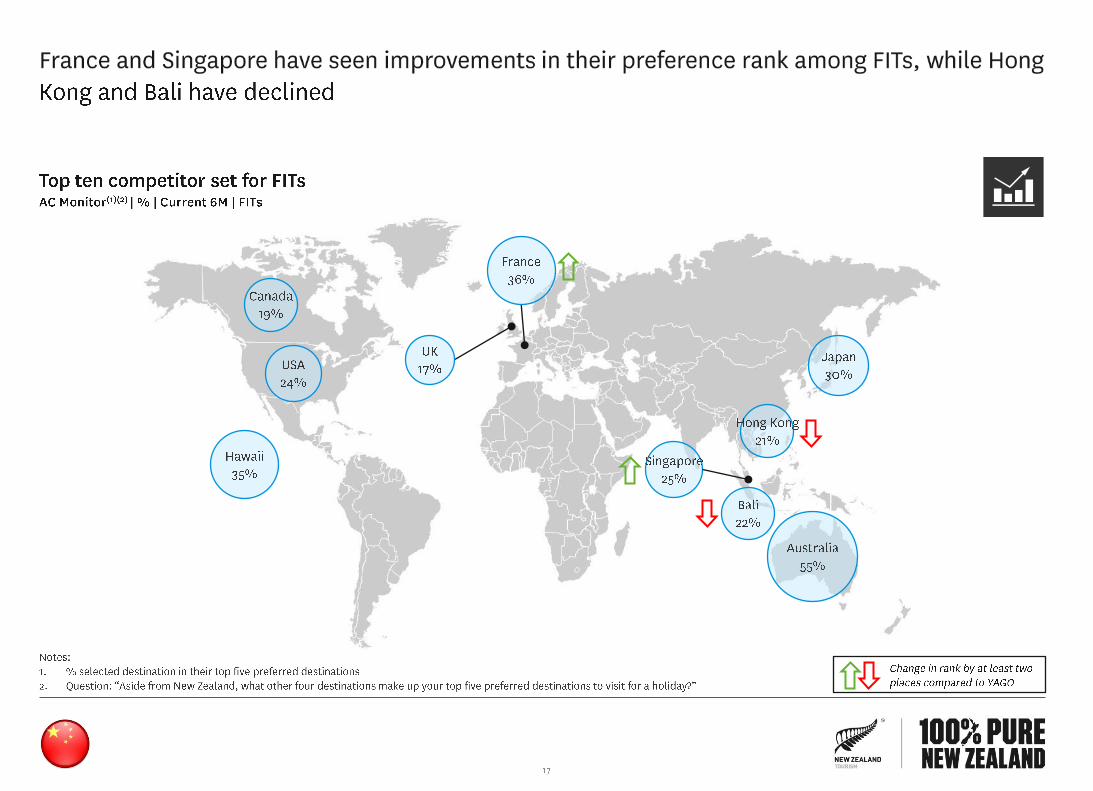
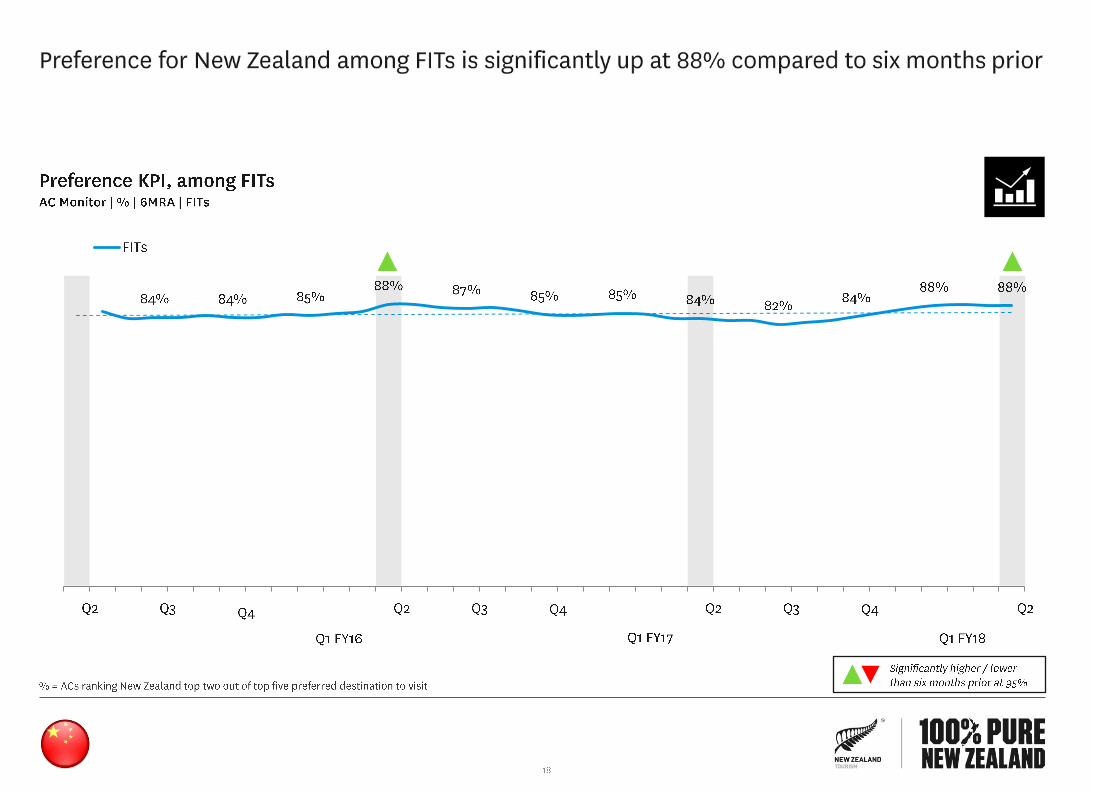
IPs FITs
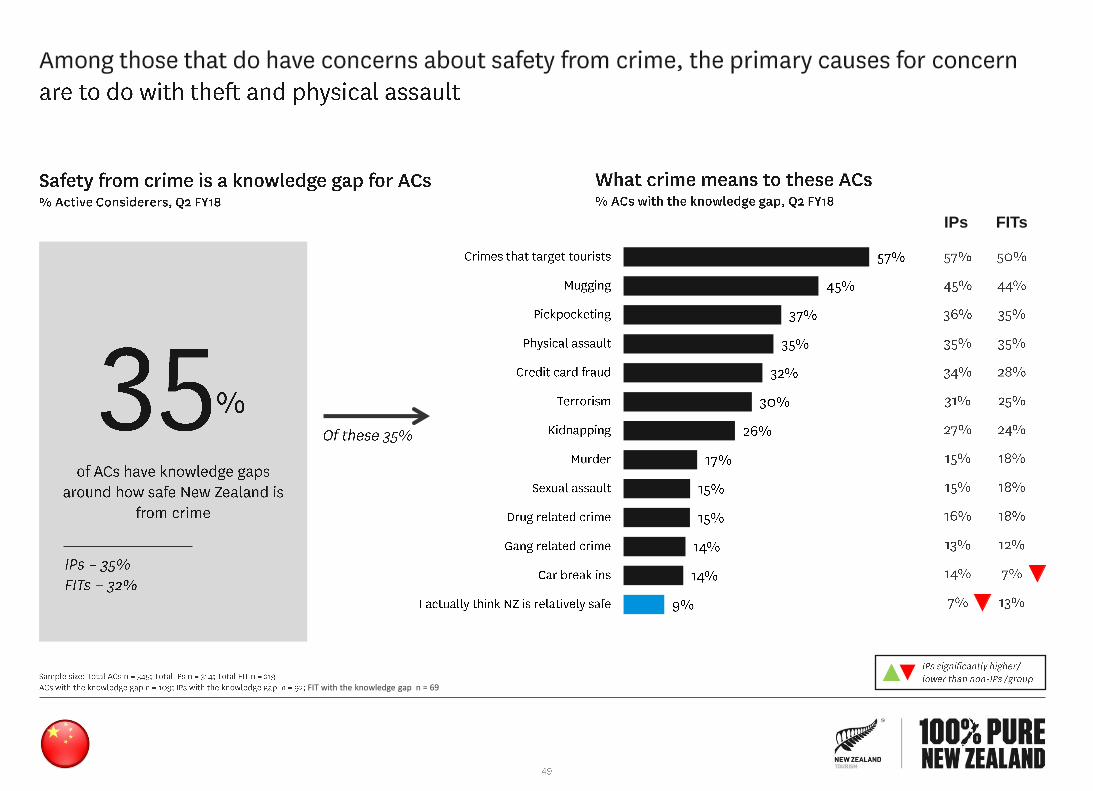
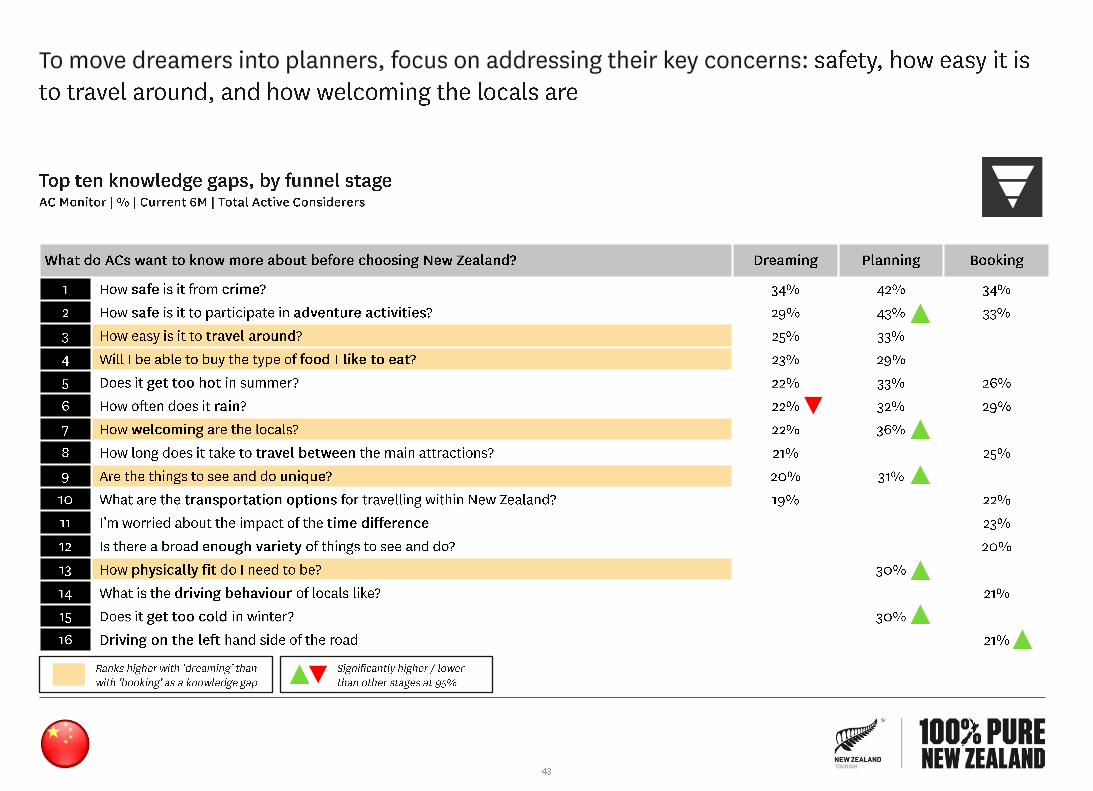
FIT with the knowledge gap n = 69
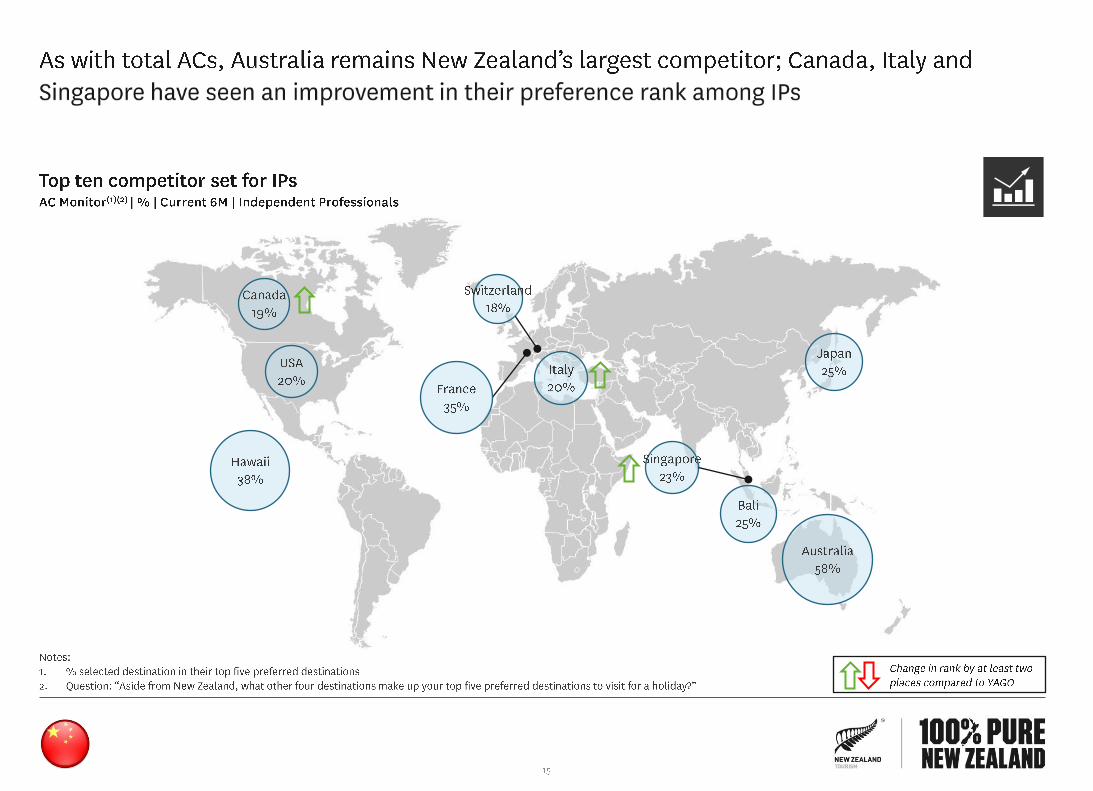
IPs FITs
•
•
•
•
•
•
•
•
•
•
o
•
o
•
o
•
o
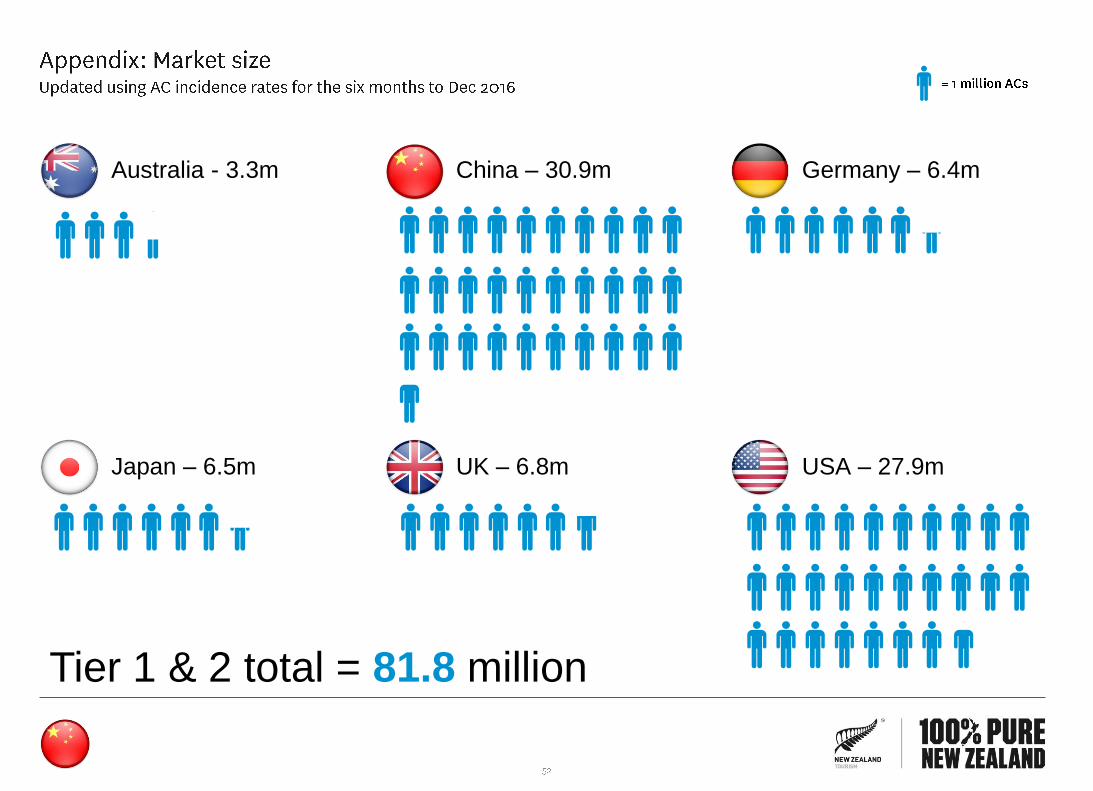
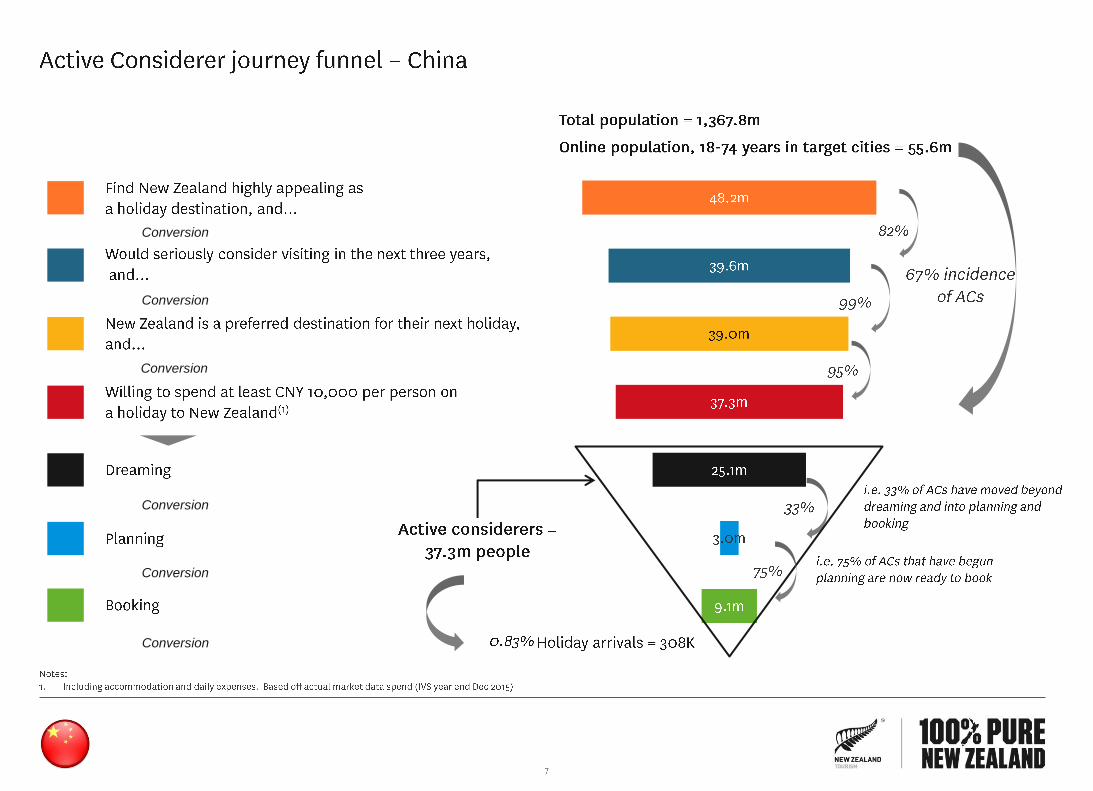
Australia - 3.3m China – 30.9m Germany – 6.4m
USA – 27.9m UK – 6.8m Japan – 6.5m
Tier 1 & 2 total = 81.8 million

SOURCES/NOTES:
1. National Bureau of Statistics of China, National Data, Total population by age, urbanisation and sex taken from website; Time period: 31st Dec 2014 ; Coverage: All Chinese individuals, excludes Hong Kong, Macau and Taiwan
2. World Bank, Health Nutrition and Population Statistics: Population estimates and projections; Time period: 2014; Coverage: All Chinese individuals by age and gender; World Bank staff estimates based on United Nations
Population Division, World Population Prospects
3. CNNIC, Statistical Report on Internet Development 35th China Internet Network; Time period: December 2014; Coverage: Chinese residents aged 6+; Internet user definition: Have used Internet in the past 6 months
4. United Nations, World Urbanization Prospects, 2014 revision; Time period: July 2014; Coverage: Population of Chinese urban agglomerations with more than 5 million inhabitants
5. Official website of Changsha, http://en.changsha.gov.cn/news/Local/201504/t20150428_717148.html?yundun=cb2ce675a21202445bf0; Time period: December 2014; Coverage: Changsha urban resident population
6. Target Cities: Beijing, Changsha, Chengdu, Guangzhou, Hangzhou, Nanjing, Shanghai, Shenyang, Shenzhen, Wuhan and Xi'an
7. Tourism New Zealand, Active Considerer Monitor China; Time period: Jul16 – Dec16, under the latest AC definition
8. TNS Analysis
Updated using the
AC incidence rate
for the six months
to Dec 2016
•
•
•
•
•
•
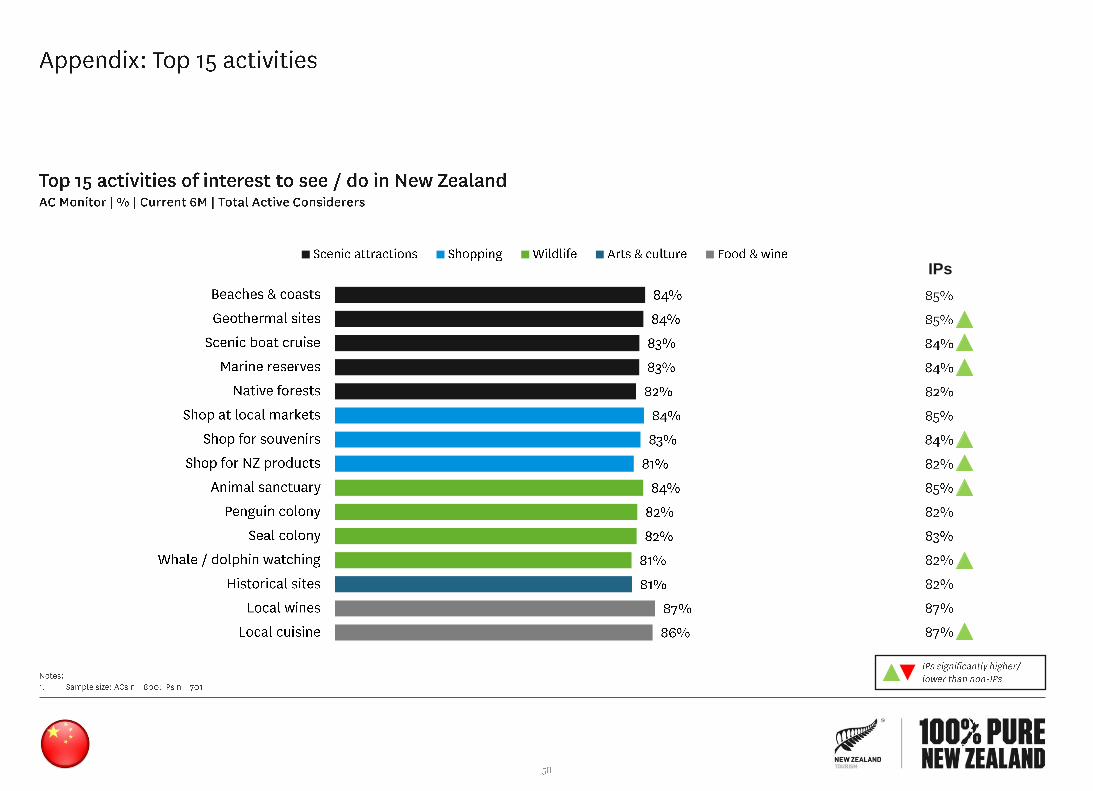
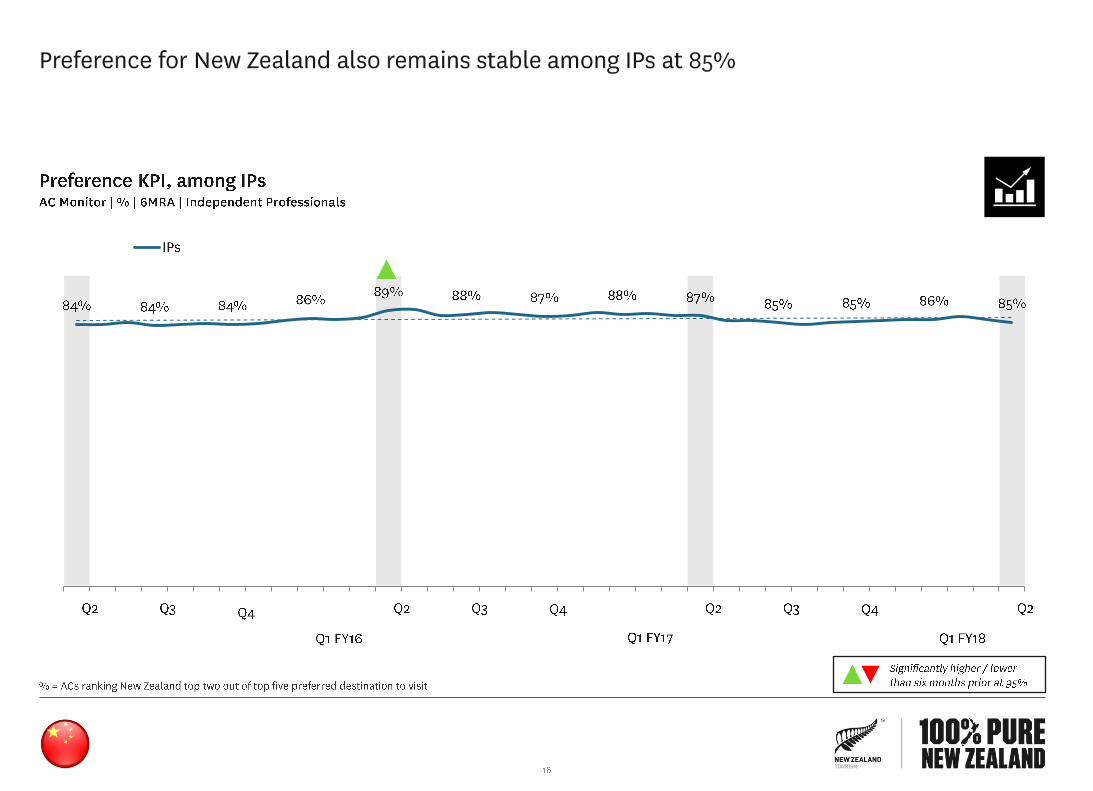
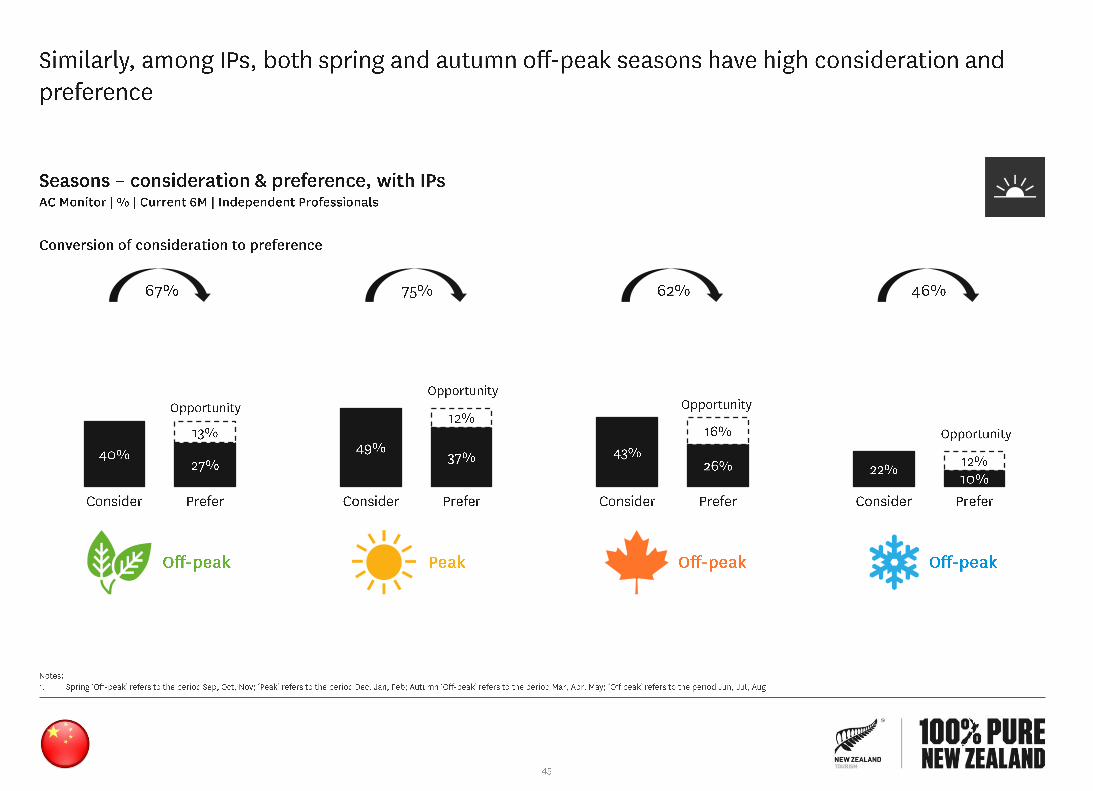
IPs

•
•
•
•
•