treatment and improvement of the … · treatment and improvement of the geotechnical properties of...
TRANSCRIPT
TREATMENT AND IMPROVEMENT OF THE GEOTECHNICAL PROPERTIES OF DIFFERENT SOFT FINE-GRAINED SOILS USING
CHEMICAL STABILIZATION
Dissertation
zur Erlangung des akademischen Grades
doctor rerum naturalium (Dr. rer. nat.)
vorgelegt der
Mathematisch-Naturwissenschaftlich-Technischen Fakultät
(mathematisch-naturwissenschaftlicher Bereich) der Martin-Luther-Universität Halle-Wittenberg eingereicht
von
Hesham Ahmed Hussin Ismaiel geb. am 12.12.1969 in Qena Stadt, Ägypten
1. Gutachter: Prof. Dr. Christof Lempp (Martin-Luther Universität Halle- Wittenberg) 2. Gutachter: Prof. Dr. Karl Josef Witt (Bauhaus-Universität Weimar)
Verteidigungsdatum: 13.07.2006
urn:nbn:de:gbv:3-000010545[http://nbn-resolving.de/urn/resolver.pl?urn=nbn%3Ade%3Agbv%3A3-000010545]

Dedicated to my family
I
tAbstrac
In general, fly ash (a by-product from the burning of coal in the electric power plants) is currently in use for soil stabilization in some countries like USA, Japan, Scandinavian countries, India, and some other countries and has several recommendations and regulations. In Germany, however, fly ash is not used for soil-stabilization. The present study is an attempt to estimate how the use of fly ash (from a local electric power plant at Lippendorf, South of Leipzig city, Saxony, Germany), hydrated lime, and lime/fly ash could improve the geotechnical properties [including consistency limits, compaction properties, unconfined compressive strength (qu), elasticity modulus (Esecant), durability, California bearing ratio (CBR), indirect tensile strength (σt), and the hydraulic conductivity (K-value)] of three different soft fine-grained soils [tertiary clay, organic silt, and weathered soil] collected from Halle-city region, Saxony-Anhalt, Germany. One of the most significant objectives of the present study is to use the ultrasonic p-wave velocity testing as non-destructive method to evaluate the improvement of the geotechnical properties of the stabilized soils and to correlate the p-wave velocity values of the stabilized soils with the other geotechnical parameters (qu-, Esecant-, CBR-, and σt-value). In addition, the study is designed to evaluate the effect of lime-, fly ash-, and lime/fly ash-stabilization process on the microstructures and on the mineralogical composition of the three studied soils using scanning electron microscope (SEM)- and X-ray diffraction (XRD)-analysis, respectively. Furthermore, one of the objectives of this study is to estimate the heat flow of the soil-chemical additive mixtures and their hydration reactions using calorimetry-analysis. The results of the present study illustrated the following findings: * The addition of lime, fly ash, and lime/fly ash to the three tested soils led to a reduction of the plasticity index and contributed to an increase in the optimum moisture content and a decrease in the maximum dry density. The moisture-density curves of the stabilized soils have typical flattened form compared to the natural soils. The qu-, Esecant-, CBR-, and the Vp-values increased slightly with an increment of the dry density of the untreated compacted soils (due to the compaction process) and strongly due to the addition of the chemical stabilizing agents (lime, fly ash, and lime/fly ash) whereas the formed cementitious compounds (as a result of the chemical reactions between the silica and the alumina and the additives) joined the soil particles.
* The optimum lime content (according to pH-method) of tertiary clay, organic silt, and weathered soil is 4.5, 3, and 5%, respectively. Tertiary clay is strongly reactive with lime. Unconfined compressive strength, California bearing ratio, indirect tensile strength, and p-wave velocity of the lime-stabilized tertiary clay increased continuously with the increase in lime content, because it contains a high amount of the clay particles (< 2µm = 47%) including kaolinite, montmorolinite, and halloysite where montmorolonite reacts strongly and fast with the additional lime. Both the organic silt and the weathered soil react weakly with lime where they contain relatively small amount of the clay particles including kaolinite (in weathered soil) and halloysite (in organic silt) which react slowly with the additional lime in comparison to montmorolinite in tertiary clay.
* The optimum fly ash content (according to pH-method) of tertiary clay, organic silt, and weathered soil is 16, 20, and 35%, respectively. The qu-, CBR-, σt-, and the Vp-values increased with an increase in the fly ash content in case of both the organic silt and the weathered soil. In the case of tertiary clay, the values increased with an increase in the fly ash content (from 8 to 20%) and decreased with continuous increase in the fly ash content (above 20%). The improvement of the geotechnical properties for both the organic silt and the weathered soil with fly ash is relatively smaller than the improvement for tertiary clay, at the same fly ash contents.
* The optimum lime/fly ash content (according to pH-method) of tertiary clay, organic silt, and weathered soil is (2.5%L+8%F), (2%L+12%F), and (3%L+20%F), respectively. The addition of lime and fly ash together to the three studied soils increased the qu-, CBR-, σt-, and the Vp-values strongly compared to the addition of lime and fly ash separately. Lime/fly ash-tertiary clay mixtures have qu-, CBR-, σt-, and Vp-values higher than the values of both lime/fly ash-organic silt and –weathered soil mixtures. The qu-, CBR-, σt-, and the Vp-values increased with an increase in the lime/fly ash ratio
II
and the maximum values of these parameters are at the optimum lime/fly ash-ratio, above the optimum lime/fly ash-ratio, the values decreased. The optimum lime/fly ash-ratio of tertiary clay and organic silt is 0.16 and 0.15, respectively (about 1 lime: 6 fly ash by weight) and the ratio of weathered soil is 0.14 (about 1 lime: 7 fly ash by weight).
* In case of the three studied stabilized soils, elasticity modulus (Esecant) increased and failure axial strain (εf) decreased as a consequence of either the separate or the joined effects of lime and fly ash contents. The Esecant increased and the failure axial strain decreased dramatically with the addition of both the lime and the fly ash together, especially in the case of tertiary clay. The mechanical behavior of the three studied soils was changed from ductile to brittle. This development was relatively weak in case of the weathered soil. The development of the mechanical behavior from ductile to brittle of the three stabilized soils was strong through the long-term curing except for the stabilized weathered soil. The influence of curing time was strong on the lime/fly ash-stabilization process compared to the effect on the fly ash-stabilization process, especially in the case of tertiary clay whereas the improvement of the lime/fly ash tertiary clay mixtures with the long-term curing was dramatic. The effect of long-term curing on fly ash- and lime/fly ash-stabilized weathered soil was weaker than the effect on both fly ash and lime/fly ash stabilized-tertiary clay and -organic silt.
* The correlation between qu-, CBR-, and σt-measurement (on one hand) and Vp-measurement (on the other hand) for the three tested stabilized soils showed that the variation of Vp-values of the three studied soils [due to the addition of lime, fly ash, and lime/fly ash (cured at 7 days)] is relatively similar to the variation of qu-, CBR-, and σt-values. The correlation between Vp-, qu-, and Esecant -measurement of the three tested lime-, fly ash-, and lime/fly ash-stabilized soils with long-term curing provided that the variation of Vp-values with curing time is similar to the variation of both the unconfined compressive strength (qu) and the elasticity modulus (Esecant) values. The ultrasonic testing method is a practical, simple, and fast method to evaluate lime-, fly ash-, and lime/fly ash-stabilized soil characteristics and the soil stabilization process.
* The compaction process without chemical additives can be contributed to a reduction of the hydraulic conductivity (K-value) of the three tested soils compared to the K-value of the natural soils. The K-value of organic silt was strongly affected by the compaction process compared to both the tertiary clay and the weathered soil. In the case of both fly ash- and lime/fly ash-stabilization process, the fly ash- and lime/fly ash-addition to the three tested soils resulted in an increment of the hydraulic conductivity in comparison to the untreated compacted soils. The maximum increase in K-value was at 28 days in the case of both fly ash and lime/fly ash stabilized soils (except, the K-values of fly ash-stabilized weathered soil after 7 days were higher than the K-values after 28 days). With an increase in the curing time, 56 and 180 days, the hydraulic conductivity reduced.
* The influence of lime-, fly ash-, and lime/fly ash-addition to the studied soils on the geotechnical properties is unique for each soil and chemical additive. The presence of sulfate (in case of the weathered soil) led to a formation of ettringite crystals (after the compaction) which resulted in a destruction of the compacted soil structure and, subsequently, a reduction of the strength gain development especially with the long-term curing. All the tested stabilized mixtures passed successively in the freeze-thaw durability test. Scanning electron microscope studies indicated that the microstructures of the tested soils changed due to lime-, fly ash- and lime/fly ash-stabilization process and developed with the long-term curing. Additionally, the SEM-micrograph of fly ash- and lime/fly ash-stabilized weathered soil showed rod-like crystals (ettringite) and XRD-analysis confirmed the formation of ettringite.
* The calorimetry-analysis illustrated that the high value of CaO-content and the presence of calcite mineral in the natural organic silt contributed to an acceleration of the hydration reaction of the optimum lime- and the lime/fly ash-organic silt mixtures. Finally, Lippendorf fly ash can be utilized to treat and stabilize the soft fine grained soils as economical (cheaper) alternative to Portland cement and other (expensive) chemical stabilizers. The use of fly ash for stabilization applications is an environmental solution of the problems associated with its disposal process.

III
menteknowledgcA
I am grateful to my Almighty God for giving me the patience to complete this work.
I would like to express my deepest and heartily thanks and great indebtedness and gratitude to
my supervisor Prof. Dr. Christof Lempp, Engineering Geology Group, Institute of Geology,
Faculty of Mathematics, Natural Science, and Technology, Martin Luther Halle-Wittenberg
University, Germany, for his kind supervision, valuable courses during my developing study
“Aufbau Studium”, guidance, valuable advice, reviewing the manuscript, and support during
my study program.
I am deeply grateful to Prof. Dr. Karl Josef Witt, Foundation Engineering Group,
Geotechnical Institute, Faculty of Civil Engineering, Bauhaus-University Weimar, Germany,
for his supervision.
I would like to express my indebtedness and gratitude to Prof. Dr. Herbert Poellmann,
Mineralogy and Geochemistry Group, Institute of Geology, Martin Luther Halle-Wittenberg
University, Germany, for his valuable advice and discussion. I am heartily grateful to Prof.
Dr. Peter Wycisk, Hydrogeology and Environment Group, and to Dr. Christian Hecht,
Engineering Geology Group, Institute of Geology, Martin Luther Halle-Wittenberg
University, Germany, for the valuable courses during my developing study.
I express my sincere thanks to all my colleagues at the Engineering Geology Group,
especially Mr. Enrico Bauch for his laboratory help, Mr. Juri Buchantscheko for his both field
and laboratory help, Mrs. Elisabeth Schnerch, and Ms. Carola Boensch for laboratory help. I
am also grateful to all my colleagues at the Institute of Geology, Martin Luther Halle-
Wittenberg University, especially Dr. Mulugheta Tewelde, Ms. Nicole Winkler, and Mr.
Matthias Zoetzl for the kind help and to Mrs. Angelika Seiferheld for the laboratory help.
Thanks to staff members of the electric power plant, Lippendorf, South of Leipzig city,
Germany, for providing me the fly ash used in the present study. I extend my heartily thanks
to my colleagues and friends Dr. Peer Zada (India) and Dr. Abd Alrhman Turki (Egypt) for
their help in the final draft of this thesis. I would like to acknowledge my colleagues at the
Geology Department, Qena faculty of science, South valley university, Egypt, for their
continuous moral support.
I extend my special and heartily thanks and gratitude to my country (Egypt) for awarding
me an Egyptian scholarship to do doctoral work in Engineering Geology Group, Institute of
Geology, Martin Luther Halle-Wittenberg University, Germany.
Halle (Saale), 8.02.2006 Hesham Ahmed Hussin Ismaiel

IV
Contents Page No.
Abstract ………………………………………………………………………... I Acknowledgement …………………………………………………………….. III Contents .……………………………………………………………..………… IV List of figures ………………………………………………………………….. VI List of tables …………………………………………………………………... VIII
1 Introduction ………………………………………………………………………….. 1 1.1 General description ……………………………………………………..... 1 1.2 Review of literature ………………………………………………............. 3 1.2.1 Lime stabilization …………………………………………............. 3 1.2.2 Fly ash stabilization ……………………………………………….. 5 1.2.3 Lime/fly ash stabilization ………………………………….............. 8 1.3 Scope of the present work ………………………………………………... 9
2 Materials and methods ……………………………………………………………….. 12 2.1 Lime ………………………………………………………………............. 12 2.1.1 Background and composition ……………………………………… 12 2.2 Fly ash …………………………………………………………………….. 14 2.2.1 Background ………………………………………………………... 14 2.2.2 Source and composition ………………………………………….... 15 2.2.3 Index- and compaction-properties ……………………………….... 16 2.3 Natural fine grained soils …………………………………………............. 18 2.3.1 Sources and Geology ………………………………………............. 18 2.3.2 Soil index properties ………………………………………………. 19 2.3.3 Chemical and mineralogical analysis ……………………………... 23 2.3.4 Compaction characteristics and geotechnical properties ………….. 24 2.4 Test procedures …………………………………………………………… 26 2.4.1 Unconfined compressive strength test ……………………………... 26 2.4.2 CBR test …………………………………………………………… 27 2.4.3 Indirect tensile strength test ………………………………………... 29 2.4.4 Hydraulic conductivity test ………………………………………... 30 2.4.5 Ultrasonic p-waves velocity test …………………………………… 31 2.5 procedures of the stabilization process in the laboratory ………………… 31 2.5.1 procedures of lime-stabilization process …………………………… 31 2.5.2 procedures of fly ash-stabilization process ………………………… 34 2.5.3 procedures of lime/fly ash-stabilization process …………………… 34
3 Results: Plasticity, compaction, and unconfined compressive strength (qu) ………… 37 3.1 Plasticity …………………………………………………………………… 37 3.2 Compaction ………………………………………………………………… 37 3.3 Unconfined compressive strength of untreated compacted soils ………….. 40 3.4 Unconfined compressive strength of treated stabilized soils ……………… 42 3.4.1 General effect of lime-, fly ash-, and lime/fly ash-stabilization process 45 3.4.2 Effect of curing time ……………………………………………….. 49 3.4.3 Stress-strain behavior ………………………………………………. 50 3.5 Durability …………………………………………………………………… 55 3.6 Conclusions …………………………………………………………………. 57

V
4 Results: California bearing ratio (CBR) ………………………………………………. 60 4.1 CBR of untreated compacted soils ………………………………………… 60 4.2 CBR of treated stabilized soils …………………………………………….. 60 4.2.1 General effect of lime-, fly ash-, and lime/fly ash-stabilization process 61 4.2.2 Effect of curing time ……………………………………………….. 64 4.3 Conclusions ………………………………………………………………… 66
5 Results: Indirect tensile strength (σt) ………………………………………………….. 68 5.1 Indirect tensile strength of treated stabilized soils ………………………….. 68 5.1.1 General effect of lime-, fly ash-, and lime/fly ash-stabilization process 71 5.1.2 Effect of curing time ……………………………………………….. 72 5.2 Conclusions …………………………………………………………………. 77
6 Results: Hydraulic conductivity (K) …………………………………………………... 79 6.1 Hydraulic conductivity of natural and untreated compacted soils …………. 79 6.2 Hydraulic conductivity of treated stabilized soils ………………………….. 79 6.2.1 General effect of fly ash- and lime/fly-ash stabilization process …… 81 6.2.2 Effect of curing time ………………………………………………... 82 6.3 Conclusions …………………………………………………………………. 84
7 Results: Velocity of ultrasonic p-waves (Vp) ………………………………………….. 85 7.1 Vp of natural and untreated compacted soils ………………………………... 85 7.2 Vp of treated stabilized soils ………………………………………………… 86 7.2.1 General effect of lime-, fly ash-, and lime/fly ash-stabilization process 88 7.2.2 Effect of curing time ………………………………………………… 92 7.3 Conclusions …………………………………………………………………. 97
8 Results: SEM-, XRD-, and Calorimetry-analysis …………………………………..….. 99 8.1 SEM-analysis (Microstructural analysis) …………………………………….. 99 8.1.1 Microstructural analysis of natural soils ………………………………. 99 8.1.2 Microstructural analysis of treated stabilized soils ……………………. 99 8.2 XRD-analysis (X-rays powder diffraction analysis) …...…………………....105 8.3 Calorimetry-analysis ………………………………………………………..107 8.4 Conclusions ………………………………………………………………….109
9 Discussions, final conclusions, and suggestions for the future ………...………………111 9.1 Plasticity and compaction ……………………………………………………111 9.2 Strength, bearing capacity, and ultrasonic p-wave velocity …………………112 9.2.1 Lime-stabilization …………………………………………………...112 9.2.2 Fly ash-stabilization …………………………………………………113 9.2.3 Lime/fly ash-stabilization …………………………………………...113 9.3 Hydraulic conductivity ……………………………………………………...115 9.4 Effect of soil type and organic matter on the stabilization process …………117 9.5 Durability ……………………………………………………………………118 9.6 SEM-, XRD-, and Calorimetry-analysis …………………………………….119 9.7 Emphasis …………………………………………………………………….119 9.8 Suggestions for the future …………………………………………………...120 References ……………………………………………………………………………….121 Appendixes (from No. 1 to No. 30) Curriculum vitae Announcement
VI
List of figures Figure No. Page No. 1- Figure (1) A typical flexible pavement structure with its four components……………. 4 2- Figure (2.1) Particle size distribution of Lippendorf fly ash…………………................ 17 3- Figure (2.2) Compaction curve of Lippendorf fly ash (compacted immediately after adding water)……………………………………………….......... 17 4- Figure (2.3, a) Location map of Germany illustrates the studied area………………….. 18 5- Figure (2.3, b) Location map of the study specimens, after Microsoft Encarta Worldatlas (1998)……………………………………………………… 19 6- Figure (2.4) Tertiary clay from old Sand/Gravel quarry area (Lower Oligocene, Rupel-Succession) near Sieglitz village………………………………... 20 7- Figure (2.5) Quaternary organic silt from ehemaliger Salziger See-area, at the East of Eisleben city……………………………………………………. 20 8- Figure (2.6) Weathered soil of Muschelkalk Formation is collected from old quarry between Zappendorf and Koellme villages (NW of Halle city)… 21 9- Figure (2.7) Particle size distributions of the studied soils and fly ash………………….. 22 10- Figure (2.8) Compaction curves of the studied natural soils………………………….... 25 11- Figure (2.9) Temperature-humidity chamber…………………………………………... 27 12- Figure (2.10) Computerized triaxial cell to measured the unconfined compressive strength (σ 3 = zero)………………………………………………......... 27 13- Figure (2.11) Standard proctor instruments………...……………………………........... 28 14- Figure (2.12) Computerized CBR-instrument, CBR-test conducted on tertiary clay specimen………………………………………………………………... 28 15- Figure (2.13) CBR curves after TPBF-StB, part B7.1, 1988…………………………… 29 16- Figure (2.14) Indirect tensile strength instrument………………………………………. 30 17- Figure (2.15) Triaxial cell to measure K-value…………………………………………. 30 18- Figure (2.16) illustrated the principles of tensile measurement after Maidl B., 1988…...30 19- Figure (2.17) Ultrasonic instrument…………………………………………………….. 31 20- Figure (2.18) Typical waveform………………………………………………………… 31 21- Figure (2.19) The relationship between pH-values and hydrated lime content (%) to determine the optimum lime-content of soils using pH-test (Appendix 7) 22- Figure (2.20) The relationship between pH-values and fly ash content (%) to determine the optimum fly ash content of soils……………………….(Appendix 8) 23- Figure (2.21) The relationship between pH-values and lime/fly ash content (%) to determine the optimum lime/fly ash content of soils………(Appendix 9) 24- Figure (2.22) Flowchart of geotechnical laboratory program to evaluate lime-, fly ash-, and lime/fly ash-stabilization process of fine grained soils…………….. 36 25- Figure (3.1, a) Effect on lime-, fly ash-, and lime/fly ash-addition on consistency limits of tertiary clay……………………………………………………………… 38 26- Figure (3.1, b) Effect on lime-, fly ash-, and lime/fly ash-addition on consistency limits of organic silt……………………………………………………………….. 39 27- Figure (3.1, c) Effect on lime-, fly ash-, and lime/fly ash-addition on consistency limits of weathered soil…………………………………………………………… 39 28- Figure (3.2, a) Moisture-density relationship for tertiary clay is an evidence of the physical changes (after 2-hr delay) during lime-, fly ash-, and lime/fly ash- treatment…………………………………………………………………. 40 29-Figure (3.2, b) Moisture-density relationship for organic silt is an evidence of the Physical changes (after 2-hr delay) during lime-, fly ash-, and lime/fly ash- treatment…………………………………………………………………. 40
VII
Figure No. Page No. 30- Figure (3.2, c) Moisture-density relationship for weathered soil is an evidence of the physical changes (after 2-hr delay) during lime-, fly ash-, and lime/fly ash-treatment……………………………………………………………. 41 31- Figure (3.3, a) Unconfined compressive strength (qu-value) of untreated compacted and treated stabilized soil with lime…………………………………….. 46 32- Figure (3.3, b) Unconfined compressive strength (qu-value) of untreated compacted and treated stabilized soil with fly ash………………………………….. 46 33- Figure (3.3, c) Unconfined compressive strength (qu-value) of untreated compacted and treated stabilized soil with lime/fly ash…………………………….. 47 34- Figure (3.4) Strength gain factors of untreated compacted and treated stabilized soils… 49 35- Figure (3.5) Response of qu-value to variable lime/fly ash ratios………………………. 49 36- Figure (3.6) Effect of curing time on unconfined compressive strength of fly ash- and lime/fly ash-stabilized soils………………………………………… 51 37- Figure (3.7) Photos of specimens after unconfined compressive strength illustrated the development of the mechanical behavior from ductile to brittle due to the stabilization process and the curing time………………………… 51 38- Figure (3.8, a) Stress-strain curves of tertiary clay……………………………………… 52 39- Figure (3.8, b) Stress-strain curves of organic silt………………………………………. 52 40- Figure (3.8, c) Stress-strain curves of weathered soil…………………………………… 53 41- Figure (3.9) Elasticity modulus (Esecant) of treated stabilized soils with curing time…… 53 42- Figure (3.10) Failure axial strain of treated stabilized soils with curing time…………... 55 43- Figure (3.11) Unconfined compressive strength of stabilized soils after 7 days under different conditions…………………………………………………….. 57 44- Figure (4.1, a) California bearing ratio (CBR-value, laboratory) of untreated compacted- and treated stabilized-soils with lime…………………………………... 62 45- Figure (4.1, b) California bearing ratio (CBR-value, laboratory) of untreated compacted- and treated stabilized-soils with fly ash…………………………………63 46- Figure (4.1, c) California bearing ratio (CBR-value, laboratory) of untreated compacted- and treated stabilized-soils with lime/fly ash……………………………63 47- Figure (4.2) CBR-gain factors of untreated compacted- and treated stabilized-soils…… 65 48- Figure (4.3) Variation of CBR-value with variable ratios of lime to fly ash……………. 65 49- Figure (4.4) Effect of curing time on the CBR-value of fly ash- and lime/fly ash- stabilized soils…………………………………………………………...66 50- Figure (5.1, a) Effect of lime content on tensile strength………………………………...73 51- Figure (5.1, b) Effect of fly ash content on tensile strength……………………………...73 52- Figure (5.1, c) Effect of lime/fly ash content on tensile strength………………………...74 53- Figure (5.2) Response of tensile strength to variable lime/fly ash-ratios………………...74 54- Figure (5.3) Photos of different treated stabilized soils illustrate the tensile fractures after indirect tensile strength test………………………………………..75 55- Figure (5.4) Effect of curing time on tensile strength of fly ash- and lime/fly ash- stabilized soils…………………………………………………………...76 56- Figure (5.5) Effect of curing time on tensile/compressive strength ratio of fly ash- and lime/fly ash-stabilized soils……………………………………………...77 57- Figure (6.1, a) Effect of curing time on the hydraulic conductivity (K-value) of fly ash- and lime/fly ash-stabilized tertiary clay………………………………….82 58- Figure (6.1, b) Effect of curing time on the hydraulic conductivity (K-value) of fly ash- and lime/fly ash-stabilized organic silt…………………………………..83 59- Figure (6.1, c) Effect of curing time on the hydraulic conductivity (K-value) of fly ash- and lime/fly ash-stabilized weathered soil……………………………….83

VIII
Figure No. Page No. 60- Figure (6.2, a) K-value gain factor of fly ash- and lime/fly ash-stabilized tertiary clay….. ……………………………………………………………….(Appendix 25) 61- Figure (6.2, b) K-value gain factor of fly ash- and lime/fly ash-stabilized organic silt…… ……………………………………………………………….(Appendix 26) 62- Figure (6.2, c) K-value gain factor of fly ash- and lime/fly ash-stabilized weathered soil... ………………………………………………………………(Appendix 27) 63- Figure (7.1, a) P-wave velocity (Vp-value) of untreated compacted- and treated stabilized-soils with lime………………………………………………..89 64- Figure (7.1, b) P-wave velocity (Vp-value) of untreated compacted- and treated stabilized-soils with fly ash……………………………………………...90 65- Figure (7.1, c) P-wave velocity (Vp-value) of untreated compacted- and treated stabilized-soils with lime/fly ash………………………………………...90 66- Figure (7.2) Vp-gain factors of untreated compacted- and treated stabilized-soils………91 67- Figure (7.3) Response of Vp-value to different lime/fly ash-ratios………………………92 68- Figure (7.4) Effect of curing time on the P-wave velocity (Vp-value) of fly ash- and lime/fly ash-stabilized soils………………………………………….94 69- Figure (7.5, a) P-wave velocity (Vp-values) and unconfined compressive strength (qu-value) versus curing time for fly ash- and lime/fly ash- stabilized tertiary clay……………………………………………………94 70- Figure (7.5, b) P-wave velocity (Vp-values) and unconfined compressive strength (qu-value) versus curing time for fly ash- and lime/fly ash- stabilized organic silt…………………………………………………….95 71- Figure (7.5, c) P-wave velocity (Vp-values) and unconfined compressive strength (qu-value) versus curing time for fly ash- and lime/fly ash- stabilized weathered soil…………………..……………………………..95 72- Figure (7.6, a) P-wave velocity (Vp-values) and elasticity modulus (Esecant) versus curing time for fly ash- and lime/fly ash-stabilized tertiary clay………...96 73- Figure (7.6, b) P-wave velocity (Vp-values) and elasticity modulus (Esecant) versus curing time for fly ash- and lime/fly ash-stabilized organic silt…………96 74- Figure (7.6, c) P-wave velocity (Vp-values) and elasticity modulus (Esecant) versus curing time for fly ash- and lime/fly ash-stabilized weathered soil……...97 75- Figure (8.1) Scanning electron micrographs illustrate the microstructural changes of tertiary clay due to lime-, fly ash-, and lime/fly ash-stabilization process….101 76- Figure (8.2) Scanning electron micrographs illustrate the microstructural changes of oganic silt due to fly ash- and lime/fly ash-stabilization process…….103 77- Figure (8.3) Scanning electron micrographs illustrate the microstructural changes of weathered soil due to fly ash- and lime/fly ash-stabilization process..104 78- Figure (8.4) Calorimeter with 4-cells and its peripheral tools (modified after Poellmann et al., 1991)...........................................................................108 79- Figure (8.5) Calorimetric curves of the three studied soils mixed with optimum lime and lime/fly ash contents (W/S=1)...........................................................109
List of tables Table No. Page No. 1- Table (2.1) General recipe of lime- and cement-stabilization modified after the German standard……………………………………………………………………… 13 2- Table (2.2) Physical properties, chemical composition and classification of fly ashes………………………………………………………………………….. 15

IX
Table No. Page No. 3- Table (2.3) Chemical composition of Lippendorf fly ash and typical chemical composition of both class C and F fly ashes………………………………… 16 4- Table (2.4) Index properties and classification of the natural studied soils…………….... 22 5- Table (2.5) Chemical composition of both natural soils and chemical additives (Hydrated lime and Fly ash)………………………………………………….. 23 6- Table (2.6) Mineralogical composition of the studied natural soils……………………… 24 7- Table (2.7) illustrated compaction characteristics, qu-, CBR-, k-, and p-waves velocity (Vp)-values of the studied natural soils…………………………….. 25 8- Table (2.8) Description of the quality of natural and untreated compacted soils after Das B, 1994 and Bowles J., 1992………………………………………. 26 9- Table (3.1) Unconfined compressive strength (qu-value), qu-gain, California bearing ratio (CBR-value), and CBR-gain of untreated compacted- and treated stabilized-tertiary clay with several blending………………………... 43 10- Table (3.2) Unconfined compressive strength (qu-value), qu-gain, California bearing ratio (CBR-value), and CBR-gain of untreated compacted- and treated stabilized- organic silt with several blending……………………….. 44 11- Table (3.3) Unconfined compressive strength (qu-value), qu-gain, California bearing ratio (CBR-value), and CBR-gain of untreated compacted- and treated stabilized- weathered soil with several blending…………………… 44 12- Table (3.4) Description of the quality of both untreated compacted- and treated stabilized- soils (according to Das B., 1994 & Bowles J., 1992)…..………. 48 13- Table (3.5) illustrates unconfined compressive strengths (qu-values), failure axial strains (εf), and elasticity modulus (ESecant) of untreated compacted- and treated stabilized- soils at different mixtures and curing time………..………….… 54 14- Table (3.6) Unconfined compressive strength, strength gain, and strength loss of the treated stabilized soils under different conditions…………………………... 56 15- Table (3.7) Durability test weight loss criteria (Durability requirements) according to (ASTM D559 and D560)…………………………………………………… 56 16- Table (3.8) Durability test results……………………………………………………….. 57 17- Table (5.1) Tensile strength, unconfined compressive strength, and tensile/compressive strength ratio of treated stabilized tertiary clay with several blending………69 18- Table (5.2) Tensile strength, unconfined compressive strength, and tensile/compressive strength ratio of treated stabilized organic silt with several blending……….70 19- Table (5.3) Tensile strength, unconfined compressive strength, and tensile/compressive strength ratio of treated stabilized weathered soil with several blending…....70 20- Table (6.1) K-value and K-value gain factor of untreated compacted- and treated stabilized-tertiary clay………………………………………………………..80 21- Table (6.2) K-value and K-value gain factor of untreated compacted- and treated stabilized-organic silt…………………………………………………….......81 22- Table (6.3) K-value and K-value gain factor of untreated compacted- and treated stabilized-weathered soil……………………………………………………..81 23- Table (7.1) P-wave velocity (Vps) and Vps/Vpu ratio (Vp-gain factor) of treated stabilized tertiary clay with several blending………………………………...86 24- Table (7.2) P-wave velocity (Vps) and Vps/Vpu ratio (Vp-gain factor) of treated stabilized organic silt with several blending………………………………....87 25- Table (7.3) P-wave velocity (Vps) and Vps/Vpu ratio (Vp-gain factor) of treated stabilized weathered soil with several blending……………………………...87
Introduction1 1
Introduction 1.1 General description
Geotechnical properties of problematic soils such as soft fine-grained and expansive soils
are improved by various methods. The problematic soil is removed and replaced by a good
quality material or treated using mechanical and/or chemical stabilization.
Different methods can be used to improve and treat the geotechnical properties of the
problematic soils (such as strength and the stiffness) by treating it in situ. These methods
include densifying treatments (such as compaction or preloading), pore water pressure
reduction techniques (such as dewatering or electro-osmosis), the bonding of soil particles (by
ground freezing, grouting, and chemical stabilization), and use of reinforcing elements (such
as geotextiles and stone columns) (William Powrie, 1997).
The chemical stabilization of the problematic soils (soft fine-grained and expansive soils)
is very important for many of the geotechnical engineering applications such as pavement
structures, roadways, building foundations, channel and reservoir linings, irrigation systems,
water lines, and sewer lines to avoid the damage due to the settlement of the soft soil or to the
swelling action (heave) of the expansive soils.
Generally, the concept of stabilization can be dated to 5000 years ago. McDowell (1959)
reported that stabilized earth roads were used in ancient Mesopotamia and Egypt, and that the
Greek and the Romans used soil-lime mixtures. Kézdi (1979) mentioned that the first
experiments on soil stabilization were achieved in the USA with sand/clay mixtures round
1906. In the 20th century, especially in the thirties, the soil stabilization relevant to road
construction was applied in Europe.
In Germany, Vosteen (1998 & 1999) reported that the use of cement or lime for the
stabilization of pavement bases (during the past few decades) was investigated and developed
into practical construction procedures. These practical procedures have been improved and
covered periodically by the technical standards for road and traffic. Fly ash-soil stabilization
for road construction is applied in USA, Japan, Scandinavian countries, and some other
countries like India. In Germany, fly ash-soil stabilization for road construction is not applied
and there are no German recommendations and regulations for soil stabilization using fly ash.
The Engineers are often faced with the problem of constructing roadbeds on or with soils
(especially soft clayey and expansive soils). These problematic soils do not possess enough
strength to support the wheel loads upon them either in construction or during the service life
of the pavement. These soils must be, therefore, treated to provide a stable sub-grade or a
working platform for the construction of the pavement. One of the strategies to achieve this is

Introduction1 2
soil stabilization. The soil stabilization includes both physical stabilization [such as dynamic
compaction] and chemical stabilization [such as mixing with cement, fly ash, lime, and lime
by-Products, etc] (Materials & Tests Division, Geotechnical Section, Indiana, 2002).
Chemical stabilization involves mixing chemical additives (binding agents) with natural
soils to remove moisture and improve strength properties of the soil (sub-grade). Generally,
the role of the stabilizing (binding) agent in the treatment process is either reinforcing of the
bounds between the particles or filling of the pore spaces. Most of these chemical stabilizing
agents are not available in Egypt, except cement and lime which are well- known. The
chemical stabilizing agents are relatively expensive compared with other methods of
stabilization, so that the soil stabilization technique is an open-field of research with the
potential for its use in the near future (Egyptian Code, 1995).
There are two types of chemical stabilization depending to the depth of the problematic
soil and the type of geotechnical application: surface or deep stabilization. The traditional
surface stabilization begins by excavating and breaking up the clods of the soil followed by
the addition of stabilizing agent (additive). Soil and additives are mixed together with known
amounts of water and compacted. Depths of the order of 150 to 250 mm can be strengthened
by this surface method. The depth of the stabilized and strengthened zone may be increased
up to one meter by using heavy equipment with appropriate modification. These methods are
used extensively to stabilized bases and sub-bases of highways and airfield pavements
(Nagaraj & Miura, 2001).
The following general terminology is typically used in the pavement and stabilization
applications.
Additives refer to manufactured commercial products that, when added to the soil and
thoroughly mixed, will improve the quality of the soil. Examples of additives include Portland
cement, lime, fly ash, bitumen, and any combination of the cement, lime, and fly ash
materials (Tensar Technical Note, TTN, BR10, 1998).
Chemical (Additive) soil stabilization is achieved by the addition of proper percentages of
cement, lime, fly ash, bitumen, or combinations of these materials to the soil. The selection of
the type and the determination of the percentage of the additive to be used are dependent upon
the soil classification and the degree of improvement in soil quality desired. In general,
smaller amounts of additives are required when it is simply desired to modify soil properties
such as gradation, workability, and plasticity. When it is desired to improve the strength and
durability significantly, larger quantities of additive are used. After the additive has been

Introduction1 3
mixed with soil, spreading and compaction are achieved by conventional means (U.S. Army,
Air Force & Navy, 2005).
Soil modification refers to the chemical stabilization process that results in improvements
of some properties of the soil for improved constructability, but does not provide the designer
with a significant increase in soil strength and durability.
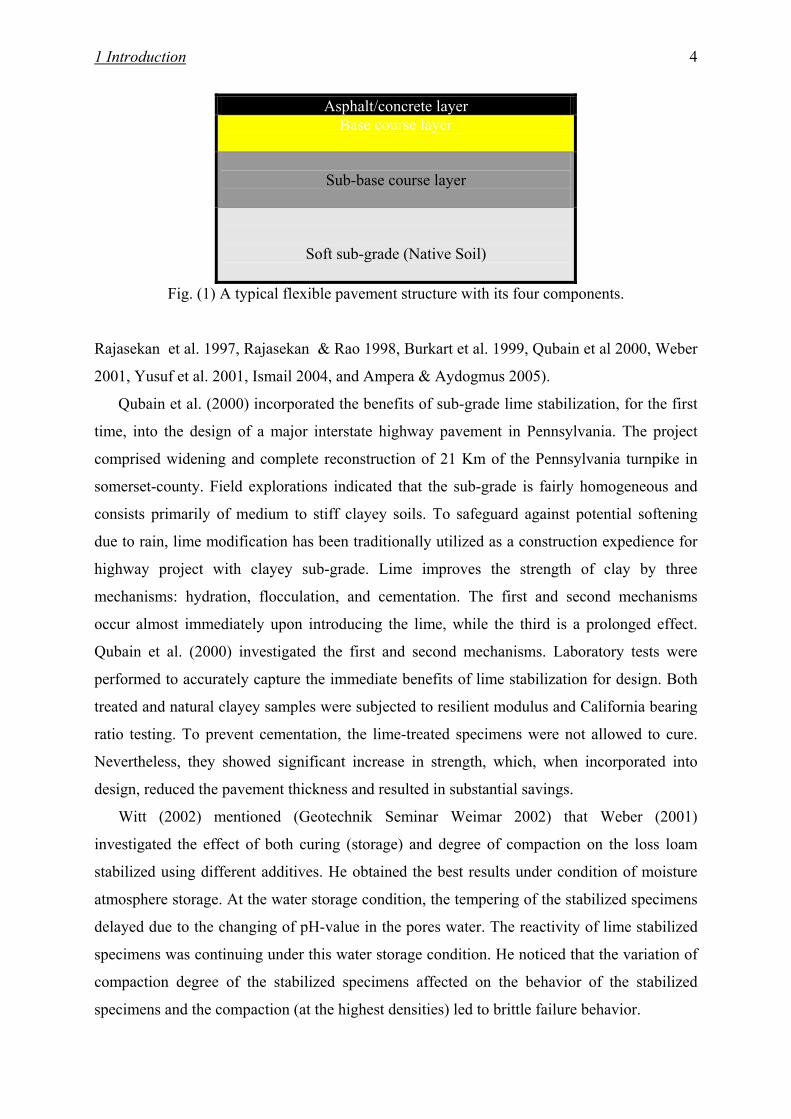
A roadway section consists of a complete pavement system (Fig. 1) including its
associated base course, sub-base course, sub-grade, and required system drainage components
(Tensar Technical Note, TTN, BR10, 1998).
The Sub-grade refers to the in situ soils on which the stresses from the overlying roadway
will be distributed. The Sub-base or Sub-base course and the base or base course materials
are stress distributing layer components of a pavement structure.
The Pavement structure consists of a relatively thin wearing surface constructed over a
base course and a sub-base course, which rests upon an in situ sub-grade. The wearing surface
is primarily asphalt/concrete. The properties of all of the pavement structure layers are
considered in the design of the flexible pavement system (Yoder & Witczak, 1975). They
notified that the construction of long lasting, economical flexible pavement structures requires
sub-grade materials with good engineering properties. The sub-grade should possess desirable
properties to extend the service life of the roadway section and to reduce the required
thickness of the flexible pavement structure. These desirable properties include strength,
drainage, ease and permanency of compaction, and permanency of strength.
The quality of the sub-grade soil used in pavement applications is classified into 5-types
(soft, medium, stiff, very stiff, and hard sub-grade) depending on unconfined compressive
strength values (Das, 1994). The quality of the sub-grade soil used in pavement applications is
classified into 5-types (very poor, poor to fair, fair, good, and excellent) depending on the
CBR values (Bowles, 1992). The sub-grades having CBR–values of 0 – 7% are very poor and
poor to fair and the sub-grades having unconfined compressive strength values of (25 – 100
KN/m2) are soft and medium. These types are considered as unstable sub-grades and need to
be stabilized, especially, in terms of pavement applications.
1.2 Review of literature
1.2.1 Lime stabilization
Several investigations were done to evaluate the soil stabilization process using lime [either
CaO or Ca(OH)2] (Parkash & Sridhran 1989, Wild et al. 1993, Bell 1996,
Introduction1 4
Asphalt/concrete layer Base course layer
Sub-base course layer
Soft sub-grade (Native Soil)
Fig. (1) A typical flexible pavement structure with its four components.
Rajasekan et al. 1997, Rajasekan & Rao 1998, Burkart et al. 1999, Qubain et al 2000, Weber
2001, Yusuf et al. 2001, Ismail 2004, and Ampera & Aydogmus 2005).
Qubain et al. (2000) incorporated the benefits of sub-grade lime stabilization, for the first
time, into the design of a major interstate highway pavement in Pennsylvania. The project
comprised widening and complete reconstruction of 21 Km of the Pennsylvania turnpike in
somerset-county. Field explorations indicated that the sub-grade is fairly homogeneous and
consists primarily of medium to stiff clayey soils. To safeguard against potential softening
due to rain, lime modification has been traditionally utilized as a construction expedience for
highway project with clayey sub-grade. Lime improves the strength of clay by three
mechanisms: hydration, flocculation, and cementation. The first and second mechanisms
occur almost immediately upon introducing the lime, while the third is a prolonged effect.
Qubain et al. (2000) investigated the first and second mechanisms. Laboratory tests were
performed to accurately capture the immediate benefits of lime stabilization for design. Both
treated and natural clayey samples were subjected to resilient modulus and California bearing
ratio testing. To prevent cementation, the lime-treated specimens were not allowed to cure.
Nevertheless, they showed significant increase in strength, which, when incorporated into
design, reduced the pavement thickness and resulted in substantial savings.
Witt (2002) mentioned (Geotechnik Seminar Weimar 2002) that Weber (2001)
investigated the effect of both curing (storage) and degree of compaction on the loss loam
stabilized using different additives. He obtained the best results under condition of moisture
atmosphere storage. At the water storage condition, the tempering of the stabilized specimens
delayed due to the changing of pH-value in the pores water. The reactivity of lime stabilized
specimens was continuing under this water storage condition. He noticed that the variation of
compaction degree of the stabilized specimens affected on the behavior of the stabilized
specimens and the compaction (at the highest densities) led to brittle failure behavior.
Introduction1 5
Ismail (2004) studied materials and soils derived from the Feuerletten (Keuper) and
Amaltheenton (Jura) formations along the new Nuernberg-Ingolstadt railway line (Germany).
His work included petrological, mineralogical studies and scanning electron microscop-
analysis. Ismail (2004) treated and stabilized these materials related to road construction using
lime (10%), cement (10%), and lime/cement (2.5%/7.5%). He determined consistency limits,
compaction properties, and shear- and uniaxial-strength. Ismail (2004) concluded that by
increasing the optimum moisture content (%) of the treated-materials (soils mixtures), the
maximum dry density (g/cm3) decreased. The cohesion and the friction angle of the improved
materials increased for all the treated mixtures. In case of the lime-treated materials, the
cohesion decreased by curing time. For Feuerletten materials, uniaxial strength increased
strongly using lime and cement together. For Amaltheenton, uniaxial strength increased
strongly with cement alone. He also noticed that the loss of weight during freezing and
thawing test was low and depended on the material type.
Ampera & Aydogmust (2005) treated Chemnitz clayey soil (A-7-6 Group) [according to
American Association of State Highway and Transportation Officials (AASHTO)] using lime
(2, 4, and 6%) and cement (3, 6, and 9%). They conducted compaction-, unconfined
compressive strength-, and direct shear- tests on untreated and treated specimens. They
concluded that the strength of cement-treated soil was generally greater than the strength of
lime-treated-soil. They also reported that lime-stabilization is (in general, more tolerant of
construction delay than cement-stabilization) more suitable for the clayey soils. The
relationships determined from direct shear tests were similar to those determined from
unconfined compressive strength tests. Thus, the results of shear strength tests showed a
similar trend to that of the unconfined compressive strength tests.
1.2.2 Fly ash stabilization
Various studies were carried out in several countries like USA, Japan, etc to verify the soil
stabilization process using fly ash (by-product) either class F or class C and other off-
specification types of fly ash (Lee & Fishman 1992, Ferguson 1993, Turner 1997, Sahu 2001,
Acosta et al. 2002, Edil et al. 2002, Şenol et al. 2002, and Thomas & White 2003).
Edil et al. (2002) conducted a field evaluation of several alternatives for construction over
soft sub-grade soils. The field evaluation was performed along a 1.4 Km segment of
Wisconsin state highway 60 and consisted of several test sections. By products such as fly
ash, bottom ash, foundry slag, and foundry sand were used. A class C fly ash was used for one
test section. Unconfined compression testing showed that 10% fly ash (on the basis of dry

Introduction1 6
weight) was sufficient to provide the strength necessary for the construction on the sub-grade.
Data were obtained before and after fly ash placement by testing undisturbed samples in the
laboratory and by using a soil stiffness gauge (SSG) and a dynamic cone penetrometer (DCP)
in the field. Unconfined compressive strength, soil stiffness, and dynamic cone penetration of
the native soil before fly ash placement ranged between 100 - 150 KPa, 4 - 8 MN/m², and 30 -
90 mm/blow, respectively. After fly ash addition, the unconfined compressive strength
reached as high as 540 KPa, the stiffness ranged from 10 to 18 MN/m2, and the Dynamic
Penetration Index (DPI) was less variable and ranged between 10 and 20 mm/blow. CBR of
32% was reported for the stabilized sub-grade, which is rated as “good” for sub-base highway
construction. CBR of the untreated sub-grade was 3%, which is rated as “very poor”
according to Bowles, 1992.
Acosta et al. (2002) estimate the self-cementing fly ashes as a sub-grade stabilizer for
Wisconsin soils. A laboratory-testing program was conducted to evaluate the mechanical
properties of fly ash alone, and also to evaluate how different fly ashes can improve the
engineering properties of a range of soft sub-grade soil from different parts of Wisconsin.
Seven soils and four fly ashes were considered for the study. Soil samples were prepared with
different fly ash contents (i.e., 0, 10, 18, and 30%), and compacted at different soil water
contents (optimum water content, 7% wet of optimum water content “approximate natural
water content of the soil”, and a very wet conditions “9 to 18% wet of optimum water
content”). Three types of tests were performed: California bearing ratio test, resilient modulus
test, and unconfined compressive strength test. The soils selected represented poor sub-grade
conditions with CBR ranging between 0 and 5 in their natural condition. A substantial
increase in the CBR was achieved when soils were mixed with fly ash. Specimens prepared
with 18% fly ash content and compacted at the optimum water content show the best
improvement, with CBR ranging from 20 to 56. Specimens prepared with 18% fly ash and
compacted at 7% wet of optimum water content showed significant improvement compared to
the untreated soils, with CBR ranging from 15 to 31 (approximately an average CBR gain of
8 times). On the other hand, less improvement was noticed when the specimens were prepared
with 18% fly ash and compacted in very wet condition (CBR ranging from 8 to 15).
Soil-fly ash mixtures prepared with 18% fly ash content and compacted at 7% wet of
optimum water content had similar or higher modulus than untreated specimens compacted at
optimum water content. Resilient modulus of specimens compacted in significantly wet
conditions, in general, had lower module compared to the specimen compacted at optimum
water content. The resilient modulus increased with increasing the curing time. The resilient
Introduction1 7
modulus of specimens prepared at 18% fly ash content and compacted at 7% wet of optimum
water content was 10 to 40% higher after 28 days of curing, relative to that at 14 days of
curing. Unconfined compressive strength of the soil-fly ash mixtures increased with
increasing fly ash content. Soil-fly ash specimens prepared with 10 and 18% fly ash content
and compacted 7% wet of optimum water content had unconfined compressive strength that
were 3 and 4 times higher than the original untreated soil specimen compacted at 7% wet of
optimum water content. CBR and resilient modulus data was used for a flexible pavement
design. Data developed from stabilized soils showed that a reduction of approximately 40% in
the base thickness could be achieved when 18% fly ash is used to stabilize a soft sub-grade.
Şenol et al. (2002) studied the use of self-cementing class C fly ash for the stabilization of
soft sub-grade of a city street in cross plains, Wisconsin, USA. Both strength and modulus-
based approaches were applied to estimate the optimum mix design and to determine the
thickness of the stabilized layer. Stabilized soil samples were prepared by mixing fly ash at
three different contents (12, 16, and 20%) with varying water contents. The samples were
subjected to unconfined compression test after 7 days of curing to develop water content-
strength relationship. The study showed that the engineering properties, such as unconfined
compressive strength, CBR, and resilient modulus increase substantially after fly ash
stabilization. The stabilization process is construction sensitive and requires strict control of
moisture content. The impact of compaction delay that commonly occurs in field
construction, was evaluated, one set of the samples was compacted just after mixing with
water, while the other set after two hours. The results showed that the strength loss due to
compaction delay is significant and, therefore, must be considered in design and construction.
CBR and resilient modulus tests were conducted and used to determine the thickness of the
stabilized layer in pavement design.
Thomas & White (2003) used self-cementing fly ashes (from eight different fly ash
sources) to treat and stabilize five different soil types (ranging from ML to CH) in Iowa for
road construction applications. They investigated various geotechnical properties (under
different curing-conditions) such as compaction, qu-value, wet/dry and freeze/thaw durability,
curing time effect, and others. They reported that Iowa self-cementing fly ashes can be an
effective means of stabilizing Iowa soil. Unconfined compressive strength, strength gain, and
CBR-value of stabilized soils increased especially with curing time. Soil-fly ash mixtures
cured under freezing condition and soaked in water slaked and were unable to be tested for
strength. They also noticed that stabilized paleosol exhibited an increase in the freeze/thaw
durability when tested according to ASTM C593, but stabilized Turin loess failed in the test.
Introduction1 8
1.2.3 Lime/fly ash stabilization
Several works were done to treat and stabilize various types of the problematic soils using
lime and fly ash together (Nicholson & Kashyap 1993, Nicholson et al. 1994, Indraratna et al.
1995, Virendra & Narendra 1997, Shirazi 1999, Muntuhar & Hantoro 2000, Lav A. & Lav M.
2000, Cokca 2001, Consoli et al. 2001, Nalbantoglu 2001, Nalbantoglu & Tuncer 2001,
Yesiller et al. 2001, Nalbantoglu & Gucbilmez 2002, Zhang & Cao 2002, Beeghly 2003, and
Parson & Milburn 2003).
Nalbantoglu & Gucbilmez (2002) studied the utilization of an industrial waste in
calcareous expansive clay stabilization, where the calcareous expansive soil in Cyprus had
caused serious damage to structures. High-quality Soma fly ash admixture has been shown to
have a tremendous potential as an economical method for the stabilization of the soil. Fly ash
and lime-fly ash admixtures reduce the water absorption capacity and the compressibility of
the treated soils. Unlike some of the previously published research, an increase in hydraulic
conductivity of the treated soils was obtained with an increase in percent fly ash and curing
time. X-ray diffractograms indicate that pozzolanic reactions cause an alteration in the
mineralogy of the treated soils, and new mineral formations with more stable silt-sand-like
structures are produced. The study showed that, by using cation exchange capacity (CEC)
values, with increasing percentage of fly ash and curing time, soils become more granular in
nature and show higher hydraulic conductivity values.
Zhang & Cao (2002) conducted an experimental program to study the individual and
admixed effects of lime and fly ash on the geotechnical characteristics of expansive soil. Lime
and fly ash were added to the expansive soil at 4 - 6% and 40 - 50% by dry weight of soil,
respectively. Testing specimens were determined and examined in chemical composition,
grain size distribution, consistency limits, compaction, CBR, free swell and swell capacity.
The effect of lime and fly ash addition on a reduction of the swelling potential of an
expansive soil texture was reported. It was revealed that a change of expansive soil texture
takes place when lime and fly ash are mixed with expansive soil. Plastic limit increases by
mixing lime and liquid limit decreases by mixing fly ash, and this decreased plasticity index.
As the amount of lime and fly ash is increased, there is an apparent reduction of maximum
dry density, free swell, and of swelling capacity under 50 KPa pressure and a corresponding
increase in the percentage of coarse particles, optimum moisture content, and in the CBR
value. They concluded that the expansive soil can be successfully stabilized by lime and fly
ash.
Introduction1 9
Beeghly (2003) evaluated the use of lime together with fly ash in stabilization of soil sub-
grade (silty and clayey soils) and granular aggregate base course beneath the flexible asphalt
layer or rigid concrete layer. He reported that lime alone works well to stabilize clay soils but
a combination of lime and fly ash is beneficial for lower plasticity (higher silt content) soils.
He noticed that both unconfined compressive strength- and CBR-values of treated stabilized
soils (moderate plasticity “PI < 20” and high silt content “i.e. > 50%”) with lime and fly ash
together are higher than the values with lime alone. Beeghly (2003) also concluded that the
capillary soak of the stabilized specimens led to a loss of unconfined compressive strength (15
- 25%). Finally, lime/fly ash admixtures resulted in cost savings by increment material cost by
up to 50% as compared to Portland cement stabilization.
Parson & Milburn (2003) conducted a series of tests to evaluate the stabilization process
of seven different soils (CH, CH, CH, CL, CL, ML, and SM) using lime, cement, class C fly
ash, and an enzymatic stabilizer. They determined Atterberg limits and unconfined
compressive strengths of the stabilized soils before and after carrying out of durability tests
(freeze/thaw, wet/dry, and leach testing). They reported that lime- and cement-stabilized soils
showed better improvement compared to fly ash-treated soils. In addition, the enzymatic
stabilizer did not strongly improve the soils compared to the other stabilizing agents (cement,
lime, and fly ash).
1.3 Scope of the present work
Generally, fly ash (a by-product) is currently in use for soil stabilization in some countries
like USA, Japan, Scandinavian countries, India, and some other countries and has several
recommendations and regulations. In Germany, however, fly ash is not used for soil
stabilization and there are no German standards and practical procedures for fly ash soil
stabilization. This study is an attempt to utilize the German fly ash (by-product) for soil
stabilization using a fly ash from a local electric power plant at Lippendorf, South of Leipzig
city, Germany. The present study includes the use of some new methods systematically to
investigate and evaluate the lime-, fly ash-, and lime/fly ash-stabilization processes including
the ultrasonic p-wave velocity- (non-destructive) and the Calorimetry- method.
The first objective of this study was to determine how the use of fly ash, hydrated lime,
and lime/fly ash-admixture could improve the geotechnical properties of three different soft
fine-grained soils and to determine systematically the optimum hydrated lime, fly ash and
lime/fly ash contents to treat and stabilize these soils using the pH-method. The three studied
soils were selected from the Halle-city region: one is inorganic tertiary clay which has high
Introduction1 10
plasticity; the second type of soil is organic silt having relatively low plasticity and high
organic content compared to tertiary clay; the third soil is a weathered soil from Muschelkalk
formation and has low pH-value and contains gypsum crystals. Why these three different soils
were selected? The reason is that these soils are problematic concerning the geotechnical
properties and applications and represent three different soil-characters to evaluate the
influence of the soil type on the chemical stabilization process with different chemical
additives. To achieve the first objective, a laboratory-testing program was conducted where
compacted soil-lime, -fly ash, and -lime/fly ash mixtures were prepared with several lime-, fly
ash- and lime/fly ash-contents. Subsequently, the mixtures were tested to determine their
geotechnical properties, especially, related to road construction. The laboratory program
included compaction, consistency, unconfined compressive strength, California bearing ratio,
indirect tensile strength, hydraulic conductivity and velocity of ultrasonic P-wave tests, which
was performed on natural, untreated compacted, and treated stabilized soils. The second
objective of the study was a try to establish a new method (fast and practical) to evaluate the
behavior of the treated stabilized soils and the chemical stabilization processes using the
measurement of the P-waves ultrasonic velocity as non-destructive method. Steel and
concrete are commonly evaluated using ultrasonic testing in civil engineering application,
where established procedures and standards are available for ultrasonic evaluation of these
materials (Mclntire 1991). Conversely, there are no established procedures and standards
available for ultrasonic evaluation of chemical stabilized soils. A very small number of
studies (Yesiller et al., 2001) focused on the use of ultrasonic p-wave velocity to evaluate
stabilized-fly ash and -soil. Yesiller et al. (2001) reported that “non-destructive test methods”
such as ultrasonic testing can provide a fast and simple alternative approach for analyzing
chemical stabilized mixtures, and they pointed to the need to develop criteria and guidelines
to incorporate the ultrasonic test method into mixture design. This means that the evaluation
of stabilized soils using ultrasonic method is a new field and needs in-depth studies and
further development. The third aim of this study was to verify the hydraulic conductivity of
the treated stabilized soils, since the available data concerning the hydraulic conductivity (K-
value) of fly ash and lime/fly ash treated stabilized soils are very limited. Townsend & Kylm
(1966), Brandl (1981), Nablantoglu & Tuncer (2001), and Nablantoglu & Gucbilmez (2002)
noted an increment of the hydraulic conductivity while others (Terashi et al., 1980 and Locat
et al., 1996) reported a decrement of the hydraulic conductivity. This means that hydraulic
conductivity studies of fly ash and lime/fly ash treated stabilized soils are widely variable,
problematic and need more investigations.

Introduction1 11
The fourth objective was to evaluate the long-term stability or durability of the fly ash-, and
lime/fly ash-stabilized soils under different weathering-circumstances including water
soaking, freezing/thawing, and drying/wetting tests. Durability of treated stabilized soils is a
problematic geotechnical parameter and previous studies on durability are very restricted and
the results are variable and require to further studies. Turner (1997) evaluated the wet-dry and
freeze-thaw durability of different low plasticity clayey soils treated with both class F and C
fly ash. Although the unconfined compressive strength values of the compacted soil-fly ash
mixtures were high and satisfactory, the wet-dry and freeze-thaw durability tests results
exhibited a weight loss of more than 14% meaning that the mixtures failed in durability test.
The fifth aim of this study was to investigate and evaluate the lime/fly ash ratio for lime/fly
ash-stabilization process. Some standards (U.S. army, air force, and navy, 2005) reported that
ratios lie between 1 : 3, 1 : 4, and 1 : 5 or about 0.33, 0.25, and 0.20, respectively, where the
best lime/fly ash ratio will yield highest strength and best durability results. Other studies
(Virendra & Narendra, 1997) obtained the best results (maximum unconfined compressive
strength and CBR-values) of alluvial soil stabilized with 15% of lime and fly ash in
proportion of 1 : 3 by weight or about 0.33 lime of fly ash weight. A question arises as to
whether lime/fly ash ratio is constant or variable based on the type and the chemical
composition of both the fly ash and the soil? The sixth objective of this study was to
determine the effect of soil type, organic matter, and curing time (7, 28, 56, and 180 days) on
the chemical stabilization process. The seventh aim was to estimate the effect of lime-, fly
ash-, and lime/fly ash-stabilization process on the microstructure (micro-fabric) of the treated
stabilized soils using scanning electron microscope (SEM). The eighth objective was to
estimate lime-, fly ash-, and lime/fly ash-soil mixtures and their hydration reactions through
the heat-flow calorimetry using a high-sensitive calorimeter developed by Poellmann et al.,
1991. Finally, the increasing trend towards electrical power generation through coal
combustion has aggravated the problems associated with the disposal of the fly ash “by-
product” (Nablantolu, 2001), so that, use of fly ash as a stabilizing agent plays an important
environmental and economical role. Economically, use of fly ash as a chemical additive in
chemical soil stabilization and for the geotechnical applications is cheaper than Portland
cement and other (expensive) chemical stabilizers.

sMaterials and method2 12
Materials and methods2
2.1 Lime
2.1.1 Background and composition
Lime can be used either to modify some of the physical properties and thereby improve
the quality of soil or to transform the soil into a stabilized mass, which increases its strength
and durability. The amount of lime additive will depend upon either the soil to be modified or
stabilized. Generally, lime is suitable for clay soils with PI ≥ 20% and > 35% passing the
No.200 sieve (0.074 mm). Lime stabilization is applied in road construction to improve sub-
base and sub-grades, for railroads and airports construction, for embankments, for soil
exchange in unstable slopes, for backfill, for bridge abutments and retaining walls, for canal
linings, for improvement of soil beneath foundation slabs, and for lime piles (Anon, 1985 &
1990). Lime stabilization includes the use of burned lime products, quicklime and hydrated
lime (oxides and hydroxides, respectively), or lime by-products (codel) (TTN, 1998).
The improvement of the geotechnical properties of the soil and the chemical stabilization
process using lime take place through two basic chemical reactions as follow: I) Short-term
reactions including cation exchange and flocculation, where lime is a strong alkaline base
which reacts chemically with clays causing a base exchange. Calcium ions (divalent) displace
sodium, potassium, and hydrogen (monovalent) cations and change the electrical charge
density around the clay particles. This results in an increase in the interparticle attraction
causing flocculation and aggregation with a subsequent decrease in the plasticity of the soils.
II) Long-term reaction including pozzolanic reaction, where calcium from the lime reacts
with the soluble alumina and silica from the clay in the presence of water to produce stable
calcium silicate hydrates (CSH), calcium aluminate hydrates (CAH), and calcium alumino-
silicate hydrates (CASH) which generate long-term strength gain and improve the
geotechnical properties of the soil. These hydrates were observed by many researchers
(Diamond et al., 1964; Sloane, 1965; Ormsby & Kinter, 1973; and Choquette et al., 1987).
The use of lime for soil stabilization is either in the form of quicklime (CaO) or hydrated lime
Ca(OH)2. Agricultural lime or other forms of calcium carbonate, or carbonated lime, will not
provide the necessary reactions to improve sub-grade soils mixed with lime.
In the present study, hydrated lime (according to DIN 1060) was used. The chemical
composition of the hydrated lime illustrated in table 2.5. Hydrated lime is calcium hydroxide,
Ca (OH)2. It is produced by reacting quicklime (CaO) with sufficient water to form a white
powder. This process is referred to as slaking.

sMaterials and method2 13
High calcium quicklime + water Hydrated lime + Heat
CaO + H2O Ca(OH)2 + Heat
Hydrated lime is used in most of the lime stabilization applications. Quicklime represents
approximately 10% of the lime used in lime stabilization process. Other forms of lime
sometimes used in lime stabilization applications are dehydrated dolomitic lime,
monohydrated dolomitic lime, and dolomitic quicklime (TTN, 1998). Calcium oxide (quick
lime) may be more effective in some cases, however the quick lime will corrosively attack
equipment and may cause severe skin burns to personnel (Muntohar & Hantoro, 2000). The
Addition of the hydrated lime Ca(OH)2, in situ or in laboratory, is either as slurry formed by
the slaking of quicklime, or as dry form (dry powder). In the present study, the addition of the
hydrated lime is in a dry form. In general, all lime treated fine-grained soils exhibit decreased
plasticity, improved workability and reduced volume change characteristics. However, not all
soils exhibit improved strength characteristics. It should be emphasized that the properties of
soil-lime mixtures are dependent on many factors such as soil type, lime type, lime
percentage, and curing conditions (time, temperature, and moisture) (U.S. Army, Air Force,
and Navy, 2005). Table 2.1 shows a general recipe of soils treatment using lime- and cement-
stabilization modified after German standard of FGSV, 1997 (Leaflet for soil stabilization and
soil improvement; soil stabilization using binding agents, 1997).
Table (2.1) General recipe of lime- and cement-stabilization modified after the German standard (Leaflet for soil stabilization and soil improvement; soil stabilization using binding agents, 1997). X = suitable (X) = conditional suitable - = unsuitable
Binding agent
Soil type Quicklime and hydrated lime after
DIN (10 60)
Cement after DIN (11 64)
Coarse grain size soil - X Mixed grain size soil (X) X
Low plasticity X X Medium P.
X (X) silt
High P. X -
Low plasticity X (X) Medium P.
X -
Fine grain size soil
clay
High P. X -
silt X (X) Organic soil
clay X -

sMaterials and method2 14
2.2 Fly ash
2.2.1 Background
Fly ash is a by-product (waste material) of burring coal at electric power plants. It is a fine
residue composed of unburned particles that solidifies while suspended in exhaust gases. Fly
ash is carried off in stack gases from a boiler unit, and is collected by mechanical methods or
electrostatic precipitators. Fly ash is composed of fine spherical silt size particles in the range
of 0.074 to 0.005 mm (Ferguson, 1993). Fly ash collected using electrostatic precipitators
usually has finer particles than fly ash collected using mechanical precipitators. Fly ash is one
of the most useful and versatile industrial by-products (Collins & Ciesielski, 1992).
When geotechnical Engineers are faced with problematic soils (such as clayey or
expansive soils), the engineering properties of those soils may need to be improved to make
them suitable for construction. Waste materials such as fly ash or pozzolanic materials
[pozolanic materials “pozzolans” are a source of silica and alumina with high surface area
(Choquette el al., 1987)] have been used for soil improvement. Recent investigations reported
that fly ash is a potential material to be utilized for soil improvement (Muntohar & Hantoro,
2000).
Fly ash is generated in huge quantities (more than 65 million metric tons per year in the
USA) as a by-product of burning coal at electric power plants (Ferguson, 1993). The potential
for using fly ash in soil stabilization has increased significantly in many countries (for
example in Wisconsin, USA) due to the increased availability and the introduction of new
environmental regulation (NR 538, Wisconsin Administrative Code) that encourage the use of
fly ash in geotechnical applications since it is environmentally safe (Şenol et al., 2002).
Classification and chemical reactions of fly ash:
Fly ash is classified into two classes: F and C. Class F fly ash (non-self-cementing fly ash)
is produced from burning anthracite and bituminous coals and contains small amount of lime
(CaO) to produce cementitious products. An activator such as Portland cement or lime must
be added. This fly ash (pozzolans) has siliceous and aluminous material, which itself
possesses little or no cementitious value but it reacts chemically (in the presence of moisture)
with lime at ordinary temperature to form cementitious compounds (Chu et al., 1993).
Class C fly ash (self-cementing fly ash) is produced from lignite and sub-bituminous coals
(low-sulfur subbituminous coals), and usually contains significant amount of lime (Cockrell
& Leonard, 1970). This type (class C) is self-cementing because it contains a high percent of
calcium oxide (CaO) ranging from 20 to 30%.

sMaterials and method2 15
Formation of cementitious material by the reaction of lime with the pozzolans (Al2O3,
SiO2, and Fe2O3) in the presence of water is known as hydration of fly ash. The hydrated
calcium silicate (gel) or calcium aluminate (fibrous), as cementitious material, can join inert
materials together. The pozzolanic reactions for soil stabilization are as follow (TRB, 1987):
CaO + H2O Ca(OH)2 + Heat
Ca(OH)2 Ca ++ + 2 (OH)
Ca ++ + 2 (OH) + SiO2 CSH “Calcium silicate hydrate“
(silica) (gel)
Ca ++ + 2 (OH) + Al2 O3 CAH “Calcium aluminate hydrate”
(alumina) (fibrous)
In case of the class C fly ash, the lime present (in the fly ash) reacts with the siliceous and
aluminous materials “pozzolans” (in the fly ash). A similar reaction can occur in class F fly
ash, but lime must be added because of the low lime content of the fly ash class F (Şenol et
al., 2002).
2.2.2 Source and composition
The fly ash used in the present study is from a local electric power plant at Lippendorf,
South of Leipzig city, Saxony, Germany. Physical and chemical properties of the Lippendorf
fly ash are summarized in Table 2.2 along with physical properties of class C and class F fly
ashes. The fly ash has a powdery texture. It is light grey in colour, which indicates high
calcium oxide content (Meyers et al., 1976). The types of coal of this fly ash are lignite and
subbituminous.
Table (2.2) Physical properties, chemical composition and classification of fly ashes
Fly ash
Classification after ASTM
Standard C 618
Gs
g/cm3
Speci- fic
surfa- ce area
m²/g
PercentFines
(%)
Moist-
ure content
(%)
LOI
(%)
LimeCaO
(%)
Other oxides (SiO2 + Al2O3 + Fe2O3)
(%)
Sulfur
Trioxide( SO3 )
(%)
Type 1 Class C** - - - 3 6 24.3* 50 5 Type 2 Class F** - - - 3 6 8.7* 70 5
Lippendorf Off-spec. 2.8 1.1 81.5 0.11 0.22 38.3 46.00 9.1 Notes: Gs = Specific gravity LOI = Loss of ignition * After Ferguson et al., 1999 ** After ASTM Standard C 618
sMaterials and method2 16
The chemical composition of fly ash is one of the most important indicators of material
quality for various applications. Detailed chemical composition of Lippendorf fly ash is
summarized in Table 2.3, along with typical chemical composition of class C and F fly ashes.
Table (2.3) Chemical composition of Lippendorf fly ash and typical chemical composition of both class C and F fly ashes.
Chemical elements
Lippendorffly ash (%)
Typical class C
(%)
Typical class F
(%) SiO2 Al2O3 Fe2O3 CaO MgO SO3 LOI
32.20 11.20 2.60 38.3 4.10 9.10 0.22
39.9 16.7 5.8 24.3 4.6 3.3 6
54.9 25.8 6.9 8.7 1.8 0.6 6
LOI = Loss of ignition
Lippendorf fly ash is classified as off-specification fly ash (ASTM C618). It has high
calcium oxide (CaO) content (38.3%) and an organic content of 0.11%. Lippendorf fly ash is
off-specification, since the (SiO2+Al2O3+Fe2O3) content is below 50% and the sulfur trioxide
(SO3) content exceeds 5%. It is close to class C. The silicon dioxide (SiO2) content of
Lippendorf fly ash (32.2%) is below the typical amount of class C fly ash (39.9%). Al2O3
content of Lippendorf fly ash (11.2%) is below the typical amount of class C fly ash (16.7%).
Both Fe2O3 and MgO contents of Lippendorf fly ash (2.6 and 4.1%, respectively) are close to
typical class C fly ash (5.8 and 4.6%, respectively). The sulfur trioxide (SO3) content (9.1%)
is higher compared to typical (SO3) content of class C and class F ashes (3.3 and 0.6%,
respectively).
The mineral composition of Lippendorf fly ash is illustrated in Appendix 1a. The main
component is calcium alumino-silicate glass (amorphous). Lippendorf fly ash contains free
lime CaO, quartz SiO2, periclase MgO, anhydrite Ca (SO4), etc. (see Appendix 1a). It does
not contain mineral phases (such as tricalcium aluminate C3A and tricalcium silicate C3S)
which have fast hydration reactions.
2.2.3 Index- and compaction-properties
The specific gravity and the specific surface area of Lippendorf fly ash is showed in Table
2.2. The specific gravity of Lippendorf fly ash (2.8 g/cm3) is high relative to the typical values
of the fly ashes (specific gravity typically range from 2.11 to 2.71) (Chu & Kao, 1993).
sMaterials and method2 17
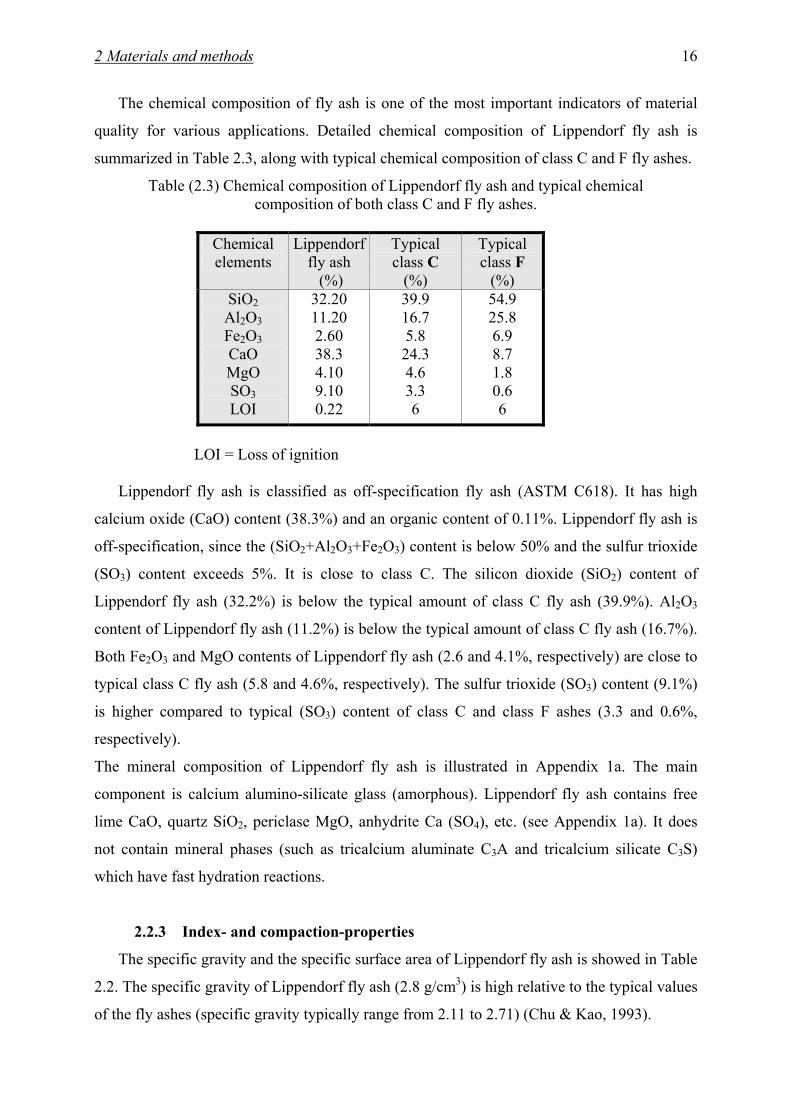
In general, as mentioned before, Fly ash collected using electrostatic precipitators, like
Lippendorf fly ash usually has finer particles than fly ash collected using mechanical
precipitators. Figure 2.1 illustrates the particle size distribution of Lippendorf fly ash
(according to DIN 18 123). Grain size analysis of fly ash was carried out through combination
of dry sieving- and sedimentation-analysis. Sedimentation-analysis was conducted by
granulometer CILAS 920 using the fine fraction < 400 µm (resulted from the dry sieving) in
suspension in an appropriate (Isopropanol) liquid.
Fig. (2.1) Particle size distribution of Lippendorf fly ash
0102030405060708090
100
0.0010.010.1110Particle size (mm)
Per
cent
pas
sing
(%)
Lippendorf fly ash
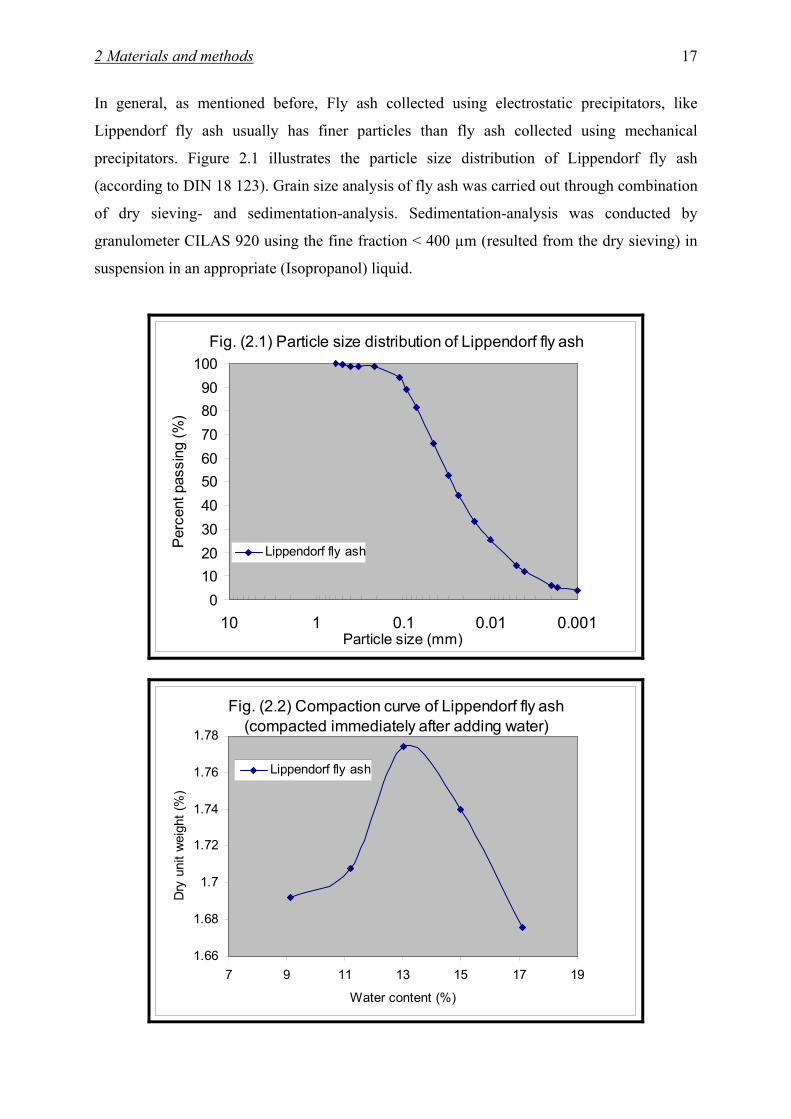
Fig. (2.2) Compaction curve of Lippendorf fly ash (compacted immediately after adding water)
1.66
1.68
1.7
1.72
1.74
1.76
1.78
7 9 11 13 15 17 19
Water content (%)
Dry
uni
t wei
ght (
%)
Lippendorf fly ash

sMaterials and method2 18
Specific gravity of both the fly ash and the tested soils was measured using Multipycnometer
(Quantachrome) with helium gas. Specific surface area of both the fly ash and the tested soils
was measured using Micromeritic-Instrument (FlowSorb II 2300) with two mixed gases (30%
nitrogen and 70% helium).
Compaction properties of the fly ash using the standard proctor compaction procedure
(DIN 18 127) are shown in Figure 2.2. The compaction curve is more bell-shaped curve
relative to the typical bell-shaped curves of the fine grained studied soils (Fig. 2.8). The
maximum dry unit weight of Lippendorf fly ash is (1.77 g/cm³). Generally, a decrease in the
organic content (0.11%) leads to an increase in the maximum dry unit weight. The optimum
water content of Lippendorf fly ash is (13.03%).
2.3 Natural fine grained soils
2.3.1 Sources and Geology
Three fine grained soils were considered for the testing geotechnical laboratory program.
The locations where the soils were collected are shown in Figure 2.3 (a & b).
Saxony-Anhalt
Fig. (2.3, a) Location map of Germany illustrates the studied area
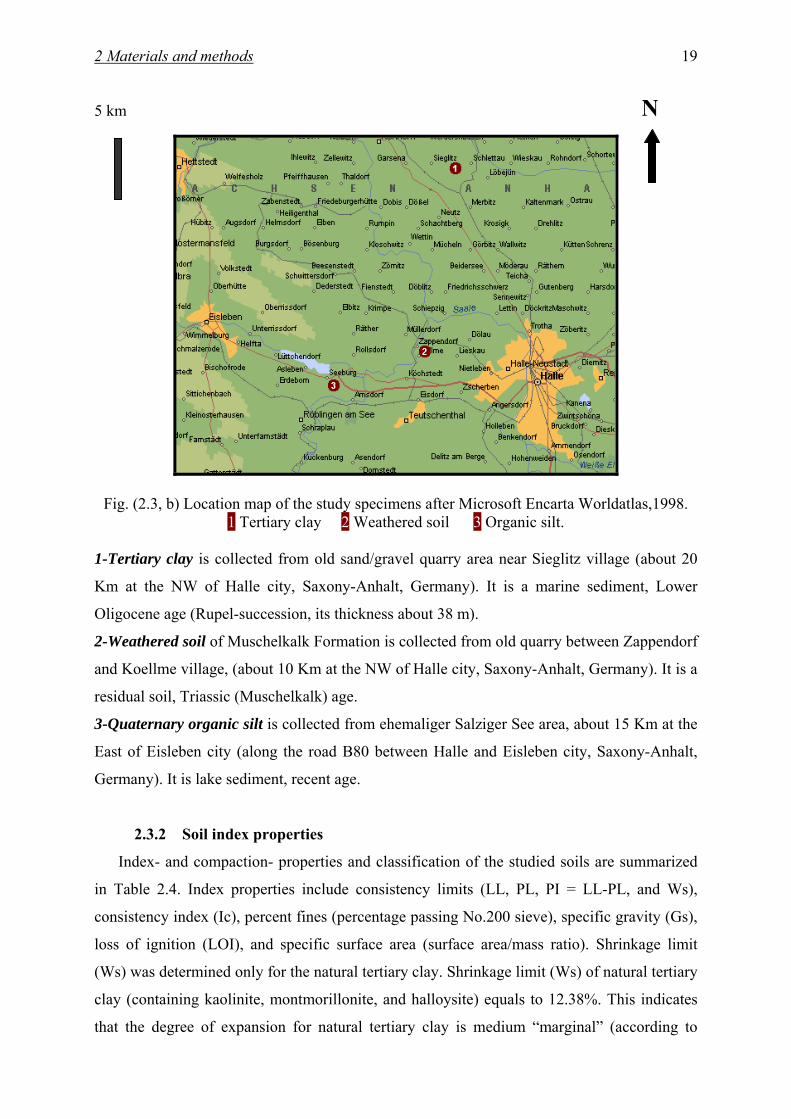
sMaterials and method2 19
5 km N
Fig. (2.3, b) Location map of the study specimens after Microsoft Encarta Worldatlas,1998. 1 Tertiary clay 2 Weathered soil 3 Organic silt.
1-Tertiary clay is collected from old sand/gravel quarry area near Sieglitz village (about 20
Km at the NW of Halle city, Saxony-Anhalt, Germany). It is a marine sediment, Lower
Oligocene age (Rupel-succession, its thickness about 38 m).
2-Weathered soil of Muschelkalk Formation is collected from old quarry between Zappendorf
and Koellme village, (about 10 Km at the NW of Halle city, Saxony-Anhalt, Germany). It is a
residual soil, Triassic (Muschelkalk) age.
3-Quaternary organic silt is collected from ehemaliger Salziger See area, about 15 Km at the
East of Eisleben city (along the road B80 between Halle and Eisleben city, Saxony-Anhalt,
Germany). It is lake sediment, recent age.
2.3.2 Soil index properties
Index- and compaction- properties and classification of the studied soils are summarized
in Table 2.4. Index properties include consistency limits (LL, PL, PI = LL-PL, and Ws),
consistency index (Ic), percent fines (percentage passing No.200 sieve), specific gravity (Gs),
loss of ignition (LOI), and specific surface area (surface area/mass ratio). Shrinkage limit
(Ws) was determined only for the natural tertiary clay. Shrinkage limit (Ws) of natural tertiary
clay (containing kaolinite, montmorillonite, and halloysite) equals to 12.38%. This indicates
that the degree of expansion for natural tertiary clay is medium “marginal” (according to
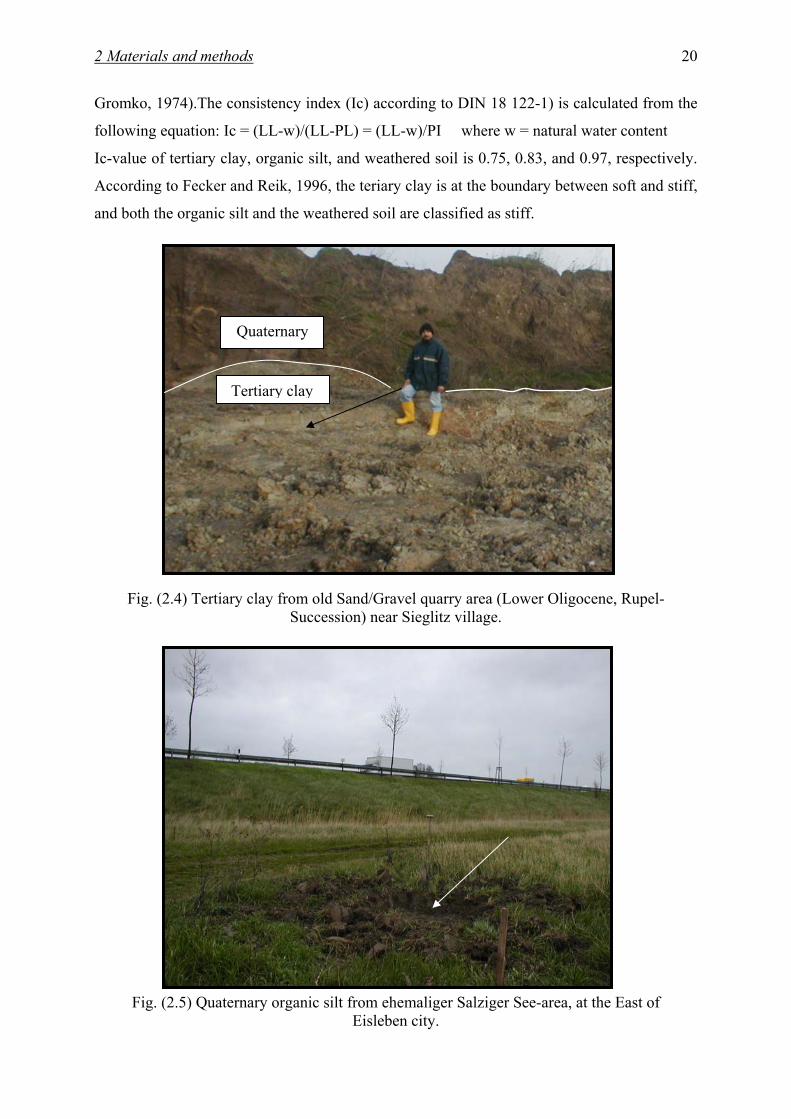
sMaterials and method2 20
Gromko, 1974).The consistency index (Ic) according to DIN 18 122-1) is calculated from the
following equation: Ic = (LL-w)/(LL-PL) = (LL-w)/PI where w = natural water content
Ic-value of tertiary clay, organic silt, and weathered soil is 0.75, 0.83, and 0.97, respectively.
According to Fecker and Reik, 1996, the teriary clay is at the boundary between soft and stiff,
and both the organic silt and the weathered soil are classified as stiff.
Fig. (2.4) Tertiary clay from old Sand/Gravel quarry area (Lower Oligocene, Rupel-
Succession) near Sieglitz village.
Fig. (2.5) Quaternary organic silt from ehemaliger Salziger See-area, at the East of
Eisleben city.
Quaternary
Tertiary clay

sMaterials and method2 21
Fig. (2.6) Weathered soil of Muschelkalk Formation is collected from old quarry between Zappendorf and Koellme villages (NW of Halle city).
The specific surface area plays a significant role in the reactivity between clay particles and
chemical additives. Clay mineral particles have plate like form with high specific surface area
(Craig, 1997). According to Hardt, 1985, the specific surface area of montmorillonite, illite,
and kaolinite is 800, 100, and 10m²/g, respectively.
According to the unified soil classification system (USCS):
Tertiary clay sample is classified as CH (Inorganic clays of high plasticity).
Organic silt sample is classified as OH (Organic silt of high plasticity).
Weathered soil is classified as MH (Inorganic clayey silt and very fine sand of high plasticity)
According to (DIN 18 196):
Tertiary clay sample is classified as TA (Distinct plasticity clay).
Organic silt sample is classified as OU (Silt with organic matter).
Weathered soil is classified as UA (Distinct plasticity clayey silt).
According to the highway research board classification (H.R.B)/ (AASHTO):
Tertiary clay sample is classified as A-7-6 Group, the general rating as sub-grade is fair to
poor.
Organic silt sample is classified as A-7-6 Group, the general rating as sub-grade is fair to
poor.
Weathered soil is classified as A-7-5 Group, the general rating as sub-grade is fair to Poor.

sMaterials and method2 22
The particle size distribution of the studied soils and fly ash (after DIN 18 123) are
presented in Figure 2.7. Tertiary clay is finer than the other soils (percent fines = 91%).
Organic silt and weathered soil contain 87 and 85% fines, respectively. All the other index
properties of the natural soils are presented in Table 2.4.
Table (2.4) Index properties and classification of the natural soil soils.
Classification Soil Type
LL (%)
PL (%)
PI (%)
Percent
Fines
(%)
Gs g/cm3
Specific surface
area m²/g
LOI (%)
USCS AASHTO DIN 18196
Wn (%)
OMC(%)
γd kN/m³
MDD kN/m³
Clay 61.5 28.6 32.9 91 2.65 28.53 3 CH A-7-6 TA 36.7 23.8 13.4 14.17 Silt 50.0 29.2 20.8 87 2.55 13.56 6.4 OH A-7-6 OU 29.8 27.61 14.2 14.27
W.S. 63.7 32.4 31.4 85 2.64 8.45 3.4 MH A-7-5 UA 37.5 25.74 13.3 14.73 Notes: LL = Liquid limit PL = Plastic limit PI = Plasticity index (PI = LL-PL) Percent Fines = Percentage passing No.200 sieve (0.074 mm) Gs = Specific gravity LOI = Loss of ignition, at 550°C, after (DIN 18 128) Wn = Natural water content γd = Natural dry unit weight MDD = Maximum dry density (Proctor dry density) OMC = Optimum moisture content (in Proctor test) W.S = Weathered soil USCS = Unified soil classification system AASHTO = American Association of State Highway and Transportation Officials DIN = (Deutsche Institut fuer Normung) German Institute of standard specification.
Fig. (2.7) Particle size distributions of the studied soils and the fly ash
010
2030
405060
7080
90100
0.0010.010.1110Particle size ( mm )
Per
cent
pas
sing
(%)
Tertiary clay
Organic silt
Weathered soil
Fly ash

sMaterials and method2 23
2.3.3 Chemical and mineralogical analysis
I- Chemical analysis: X-ray fluorescence spectrometry (XRF)
X-ray fluorescence analysis of both natural soils and chemical additives was investigated
using XRF-technique (type of the instrument is SRS 3000 Siemens).
Chemical compositions of the three different studied natural soils, fly ash, and the
hydrated lime are summarized in Table 2.5.
II- Mineralogical analysis: X-ray powder diffraction (XRD)
X-ray powder diffraction technique with Cu Kα radiation (type of instrument is Siemens
D 5000 diffractometer with a generator operating at 40KV, 30mA and with Ni-Filter) was
used to determine the mineralogical composition of the natural soils and the chemical
additives. Soil mineralogy provides the basis for understanding the basic mechanisms of
chemical stabilization. It also helps to identify types of clay minerals in the studied soils in
order to determine the ability of the soils to expand. The presence of some clay minerals, like
Table (2.5) Chemical composition of both natural soils and chemical additives (Hydrated lime and Fly ash)
Chemical Elements
Tertiary Clay (%)
Weathered soil (%)
Organic Silt (%)
Hydrated lime (%)
Fly ash
(%) SiO2 Al2O3 Fe2O3
∑ = SiO2/Al2O3
CaO MgO Na2O K2O MnO TiO2 P2O5 SO3 LOI
54.9 18.50 5.73 79.13 2.97 2.41 1.86 0.140 2.98
0.0261 0.974 0.116 4.23
6
52.1 21.3 6.26 79.66 2.45 1.34 1.65 0.179 3.66
0.0132 1.78
0.0919 1.92 6.8
41.70 11.80 4.24 57.74 3.53 18.70 1.79 0.36 2.60 0.105 0.711 0.444 4.64 12.8
0.503 0.279 0.225 1.007 1.802 73.4 0.556 0.0321 0.0737 0.0359 0.0185 0.0288 0.191 24.6
32.20 11.20 2.60 46.00 2.88 38.3 4.10 0.160 0.267 0.113 0.99
0.0758 9.10 0.22
LOI = Loss of ignition, at 1000 °C.
high-activity smecite clays as montmorillonite in the soil is a good indication of the swell
potential. These clays cause problems of excessive expansive characteristics, which lead to
much damage to the structures built in and on them (Nicholson, et al., 1994). The mineral
composition of natural tertiary clay, organic silt, and weathered soil is shown in Appendixes
(1b, 2, and 3, respectively) and in Table 2.6.

sMaterials and method2 24
Table (2.6) Mineralogical composition of the studied natural soils.
Soil type
Arrangement of the minerals according to the majority (from primary to
secondary components) Tertiary clay Quartz, Kaolinite, Montmorillonite,
Muscovite, and Halloysite Organic silt Calcite, Quartz, Muscovite, and
Halloysite Weathered soil Quartz, Muscovite, Kaolinite, and
Gypsum
2.3.4 Compaction characteristics and geotechnical properties
Compaction characteristics:
Compaction curves corresponding to standard proctor effort (see Fig. 2.11) were
determined for each soil following the procedure in (DIN 18 127). Typical bell-shaped
compaction curves were obtained (see Fig. 2.8). The maximum dry unit weights and optimum
water contents are summarized in Table 2.4. Organic silt has the highest optimum water
content (27.61%). It is relatively near its natural water content (29.8%), and its maximum dry
unite weight is 17.27 KN/m3. The curve has narrow bell-shaped form compared to the other
two soils. Weathered soil has the highest maximum dry unit weight (14.73 KN/m3), which
reflects the relative larger fraction of coarse particles in the sample. The optimum water
content is 25.74%. Tertiary clay has the lowest maximum dry unite weight (14.17 KN/m3)
and its optimum water content is 23.8%.
Geotechnical properties:
Unconfined compression tests (qu-tests) were conducted on each soil according to (DIN
18 136). The qu-values are summarized in Tables 2.7 and 2.8. The qu-value of natural
undisturbed (with natural water content and natural unit weight) and of untreated compacted
samples (with optimum water content) was measured according to DIN 18 136. Unconfined
compressive strength (qu-value) of natural tertiary clay, organic silt, and weathered soil is
40.90, 77.71, and 42.34 KN/m², respectively. These values indicate that tertiary clay, organic
silt, and weathered soil are classified as soft, medium, and soft sub-grade, respectively (Das,
1994). After compaction (with optimum water content and without chemical additive) the qu-
value of tertiary clay, organic silt, and weathered soil increased to 131.21, 136.91, and 173.25
KN/m², respectively and the three soils are classified as stiff sub-grade (Das, 1994).
California bearing ratio tests (CBR-tests) were conducted on each soil following the
methods described in TPBF-StB, part B 7.1. The CBR-values are summarized in Tables 2.7

sMaterials and method2 25
and 2.8. CBR-value of compacted soils (with natural water content) and of untreated
compacted (with optimum water content) samples, using standard proctor effort, was
measured. California bearing ratio (CBR-value) of tertiary clay, organic silt, and weathered
soil (compacted with natural water content) is 2.1, 2.1, and 2.6%, respectively. These values
indicate that tertiary clay, organic silt, and weathered soil are classified as very poor sub-
grade (Bowles, 1992). After compaction (with optimum water content and without chemical
additive) the CBR-value of tertiary clay, organic silt, and weathered soil increased to 4.6, 3.2,
and 5.4%, respectively and the three soils are classified as poor to fair sub-grade (Bowles,
1992).
Fig. (2.8) Compactions curves of the studied natural soils.
13
13,2
13,4
13,6
13,8
14
14,2
14,4
14,6
14,8
15
10 15 20 25 30 35 40Water content (%)
Dry
uni
t wei
ght (
KN
/m³)
Tertiary clayOrganic siltWeathered soil
Soil type
MDD
(KN/m³)
OMC
(%)
qu- value
KN/m2
CBR-value
%
K- value m/sec
Vp- value m/sec
Tertiary clay 14.17 23.8 40.90 2.1 1.9 E-11 643 Weathered soil 14.73 25.74 42.34 2.6 3.2 E-11 700
Organic silt 14.27 27.61 77.71 2.1 5.5 E-07 424
Table (2.7) illustrated compaction characteristics, qu-, CBR-, k-, and p-waves velocity (Vp)-values of the studied natural soils.

sMaterials and method2 26
qu-value kN/m²
Quality after
qu (Das, 1994)
CBR-value
(%)
Quality after CBR (Bowles,
1992)
Soil type Natural
soil Untreated compacted
Natural soil
Untreated compacted
Natural soil
Untreatedcompacted
Naturalsoil
Untreated compacted
Tertiary Clay 40.90 131.21 soft stiff 2.1 4.6 Very poor
Poor to fair
Weathered Soil
42.34 173.25 soft stiff 2.6 5.4 Very poor
Poor to fair
Organic Silt 77.71 136.91 medium stiff 2.1 3.2 Very poor
Poor to fair
Table (2.8) Description of the quality of natural and untreated compacted soils after Das, 1994
and Bowles, 1992.
2.4 Test procedures
2.4.1 Unconfined compressive strength test
Unconfined compressive strength tests were conducted according to DIN 18 136. A
photograph of a soil specimen subjected to unconfined compression is shown in Figure 2.10.
Unconfined compressive strength for natural soils, for untreated compacted, and for treated
stabilized specimens is determined by using computerized triaxial instrument without
application of the cell pressure (σ3 = zero). The dimensions of the tested specimens (for
natural specimens) are 120 mm height and 95 mm diameter and the dimensions of untreated
compacted and treated stabilized specimens are 120 mm height and 100 mm diameter.
The maximal vertical strain according to DIN 18 136 is equal to 20% from the maximal
height of the tested specimen, so that, the maximal vertical strain = 20 / 100 * 120 mm = 24
mm.
Unconfined compressive strength (qu–value) of the tested specimens is either at the
failure of the specimen or at the maximal vertical strain (ε) equal to 20% of the original height
of the soil specimen (DIN 18 136). The speed of deformation (strain rate), according to DIN
18 136, is at least equal to 1% of the maximal height of the tested sample = 1/100 * 120 mm =
1.2 mm/min. In the present study, the strain rate for both undisturbed natural soils, untreated
compacted, and for treated stabilized specimens was equal to 0.2% of the maximal height of
the tested specimens. The strain rate is 120 mm * 0.2 /100 = 0.24 mm/min, according to DIN
18 136 for the cemented and stabilized specimens.
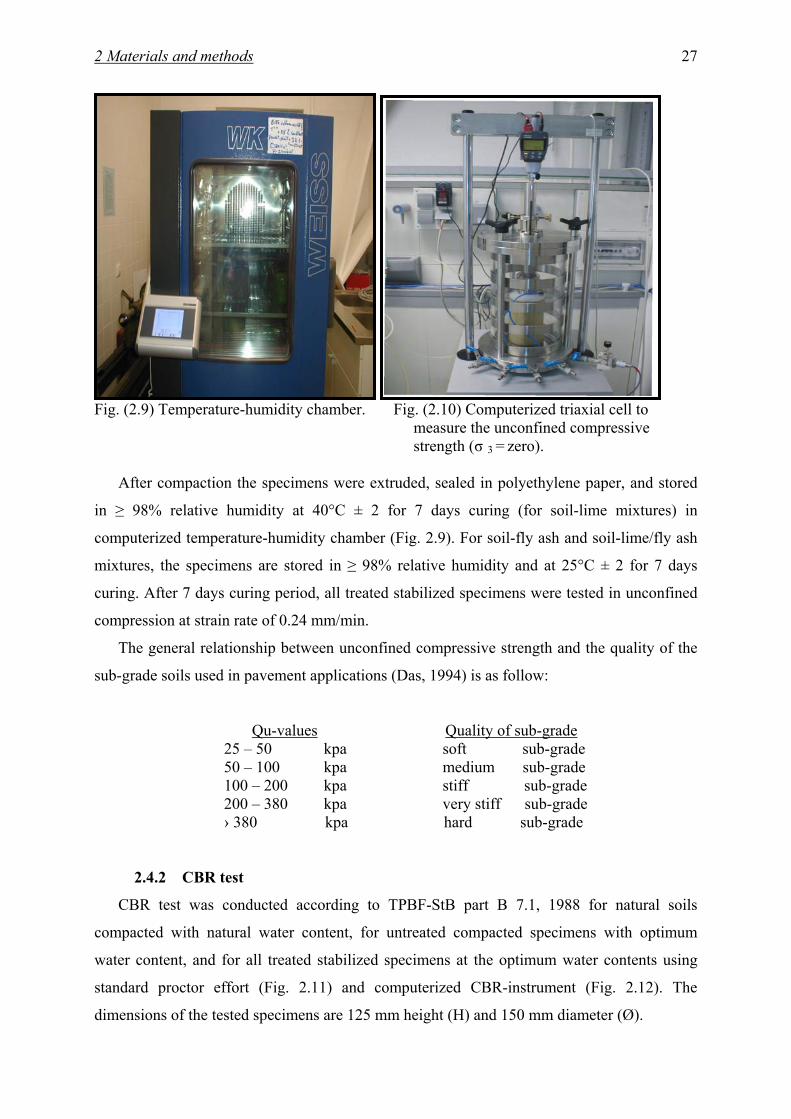
sMaterials and method2 27
Fig. (2.9) Temperature-humidity chamber. Fig. (2.10) Computerized triaxial cell to
measure the unconfined compressive strength (σ 3 = zero).
After compaction the specimens were extruded, sealed in polyethylene paper, and stored
in ≥ 98% relative humidity at 40°C ± 2 for 7 days curing (for soil-lime mixtures) in
computerized temperature-humidity chamber (Fig. 2.9). For soil-fly ash and soil-lime/fly ash
mixtures, the specimens are stored in ≥ 98% relative humidity and at 25°C ± 2 for 7 days
curing. After 7 days curing period, all treated stabilized specimens were tested in unconfined
compression at strain rate of 0.24 mm/min.
The general relationship between unconfined compressive strength and the quality of the
sub-grade soils used in pavement applications (Das, 1994) is as follow:
Qu-values Quality of sub-grade 25 – 50 kpa soft sub-grade 50 – 100 kpa medium sub-grade 100 – 200 kpa stiff sub-grade 200 – 380 kpa very stiff sub-grade › 380 kpa hard sub-grade
2.4.2 CBR test
CBR test was conducted according to TPBF-StB part B 7.1, 1988 for natural soils
compacted with natural water content, for untreated compacted specimens with optimum
water content, and for all treated stabilized specimens at the optimum water contents using
standard proctor effort (Fig. 2.11) and computerized CBR-instrument (Fig. 2.12). The
dimensions of the tested specimens are 125 mm height (H) and 150 mm diameter (Ø).
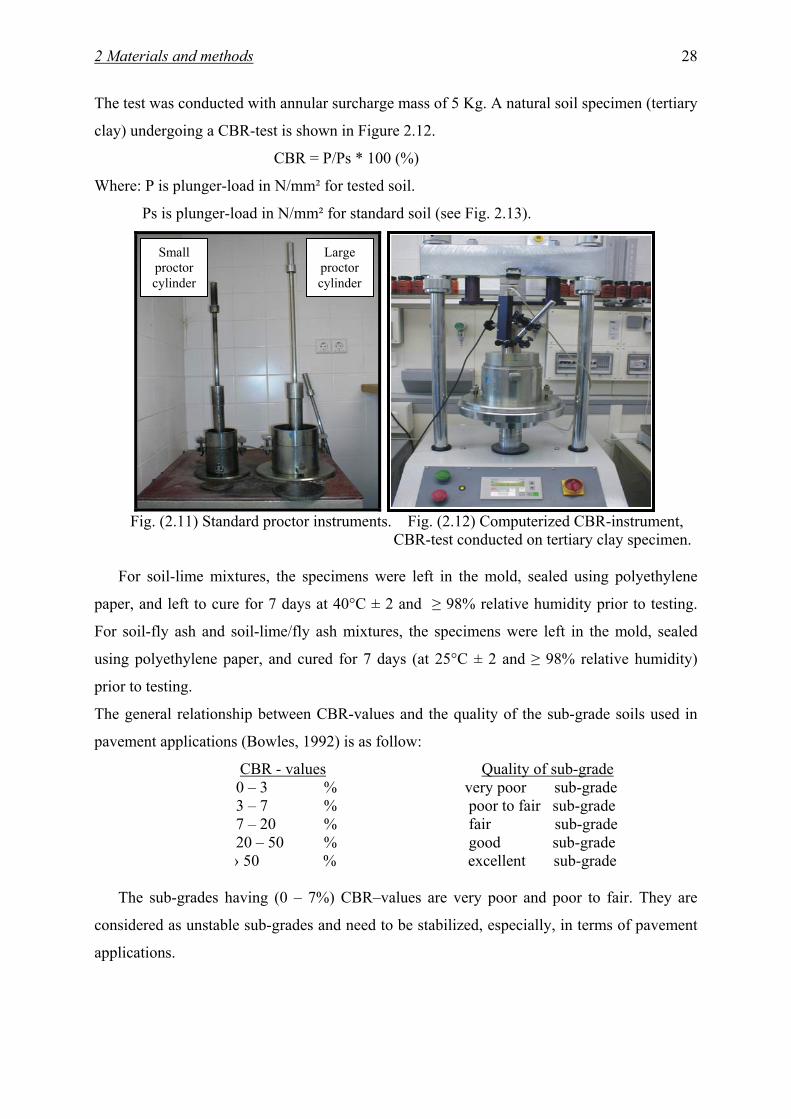
sMaterials and method2 28
The test was conducted with annular surcharge mass of 5 Kg. A natural soil specimen (tertiary
clay) undergoing a CBR-test is shown in Figure 2.12.
CBR = P/Ps * 100 (%)
Where: P is plunger-load in N/mm² for tested soil.
Ps is plunger-load in N/mm² for standard soil (see Fig. 2.13).
Fig. (2.11) Standard proctor instruments. Fig. (2.12) Computerized CBR-instrument, CBR-test conducted on tertiary clay specimen. For soil-lime mixtures, the specimens were left in the mold, sealed using polyethylene
paper, and left to cure for 7 days at 40°C ± 2 and ≥ 98% relative humidity prior to testing.
For soil-fly ash and soil-lime/fly ash mixtures, the specimens were left in the mold, sealed
using polyethylene paper, and cured for 7 days (at 25°C ± 2 and ≥ 98% relative humidity)
prior to testing.
The general relationship between CBR-values and the quality of the sub-grade soils used in
pavement applications (Bowles, 1992) is as follow:
CBR - values Quality of sub-grade 0 – 3 % very poor sub-grade 3 – 7 % poor to fair sub-grade 7 – 20 % fair sub-grade 20 – 50 % good sub-grade
› 50 % excellent sub-grade The sub-grades having (0 – 7%) CBR–values are very poor and poor to fair. They are
considered as unstable sub-grades and need to be stabilized, especially, in terms of pavement
applications.
Small proctor cylinder
Large proctor cylinder

sMaterials and method2 29
Fig. (2.13) CBR curves after TPBF-StB, part 7.1, 1988.
2.4.3 Indirect tensile strength test
Indirect tensile strength tests were conducted loosely based on the International Society
for Rock Mechanics (ISRM), for all the treated stabilized specimens at the optimum water
contents using manual tensile strength-instrument with two horizontal steel-plates (with felt-
streaks) instead of the standard steel-plates as in Brazilian test. The dimensions of each plate
are 12 cm long and 8 cm width (Fig. 2.14). The dimensions of the tested stabilized specimens
are 100 mm thickness “height” (H) & 100 mm diameter (Ø), where H/Ø ratio is equal to 1.
Tensile strength (σt) of the specimens was calculated according to ISRM by the
following formula:
σ t = 2P/ π*D*L = 0.636 P/ D*L
Where: σ t = tensile strength (MPa)
P = Load at failure (N)
D =Diameter of the tested specimen (mm)
L = Thickness “height” measured at the center (mm) (see Fig. 2.16).

sMaterials and method2 30
Fig. (2.14) Indirect tensile strength Fig. (2.15) Triaxial cell to measure instrument. K-value.
Fig. (2.16) illustrated the principles of tensile measurement after Maidl, 1988.
2.4.4 Hydraulic conductivity test
Hydraulic conductivity tests were conducted following the procedure in Laboratory test of
DIN 18 130-1. A photograph of a triaxial cell, in which the K-value of the studied specimens
was measured, is shown in Figure 2.15. K-value for natural soils, for untreated compacted
specimens, and for treated stabilized specimens is determined by using triaxial cell with
constant hydraulic gradient equal to 50 and with cell pressure, in-pressure, and out-pressure
equal to 5, 2.6, and 2 bars, respectively. The dimensions of the tested specimens (for natural
soil specimens) are 120 mm height and 95 mm diameter and the dimensions of untreated
compacted and treated stabilized specimens are 120 mm height and 100 mm diameter. The
analysis of the measured values (volume of water, time, and pressure) of the test and the
calculation of K-value were conducted using GGU-software program.

sMaterials and method2 31
2.4.5 Ultrasonic P-waves velocity test
P-wave velocities were measured using ultrasonic measurement instrument, USME-C.
The measurement system consisted of two P-wave transducers and a pulser-receiver. One of
the P-wave transducer is for transmitting waveforms, 64 KHz frequency, the other is for
receiving waveforms, 40 - 700 KHz frequency. The P-wave velocity of the samples was
determined using the through-transmission inspection method with the transmitting transducer
placed on one end of the sample and the receiving transducer placed on the opposite end of
the sample (Fig. 2.17).
This arrangement is typically used for highly attenuating materials such as concrete. The
velocity of the p-waves was obtained as the quotient of the travel pass “x” (the height of the
specimens) and the travel time of the P-waves “ta” (P-waves velocity “Vp” = x/ta) (Yesiller
et al., 2001). The height of the specimens is 0.12 m. The travel time was obtained from
ultrasonic measurements (with resolution of 0.1 μs). It is defined as the first arrival time of the
waves at the receiving transducer. A typical waveform obtained in the tests is presented in
Figure 2.18. The first arrival time of the P-wave is indicated on the waveform.
X
Transmitting Transducer
Receiving Transducer
Arriva l Time ( )ta
Ampl
itude
( Vo l
ts)
Time ( µs)0 50 100 150 200
Fig. (2.17) Ultrasonic instrument. Fig. (2.18) Typical waveform.
2.5 Procedures of the stabilization process in the laboratory
2.5.1 Procedures of lime-stabilization process
1- Preparation of the soil sample; soil sample was dried in the air and then it was put into the
oven at 50°C for 24 hours. The dried soil was crushed in crushing-machine.
2- Determination of the reactivity of the soil for lime stabilization; the reaction of a soil-lime
or a soil-cement mixture is important for stabilization and design methodology. It should be
based on an increase in the unconfined compression strength test data (Materials and Tests
Division, Geotechnical Section, Indiana, 2002). To determine the reactivity of the soils for
lime-stabilization, the following steps were followed:

sMaterials and method2 32
A- Mixing at least 5% lime by dry weight of the natural untreated soil.
B- Carrying out of a standard proctor test to determine both optimum water content and
maximum dry density for the lime-soil mixture.
C- Construction of a compacted sample of the lime-soil mixture at optimum water content and
maximum dry density.
D- Curing of the compacted sample for 48 hours at 50°C in a constant temperature chamber
and at humidity ≥ 98%.
E- Measurement of an unconfined compressive strength (qu-value) for the treated lime-
stabilized compacted sample by using triaxial instrument with σ 3 = zero.
In case of the reactive soil (with lime): the strength gain of the treated sample must be at least
50 Psi = 350 KN/m2 greater than the strength of the natural untreated soil (Materials and Tests
Division, Geotechnical Section, Indiana, 2002).
In the present study, according to the results of reactivity tests of the three tested soils mixed
with 5% hydrated lime, the unconfined compression strength of tertiary clay, organic silt and
weathered soil is 1050.96 KN/m2 (reactive), 249.68 KN/m2 (not reactive), and 256.10 KN/m2
(not reactive), respectively.
3- Determination of the optimum lime content for lime stabilization using Eades and Grim
pH-test, 1966.
First: measurement of the pH-value for natural soil and lime samples separately.
Second: addition of sufficient amount of lime to soils to produce a pH of 12.4 or equal to a
pH-value of lime itself. A graph is plotted between pH-value (at Y-Axis) versus lime
percentage (at X-Axis). Optimum lime content should be determined corresponding to
maximum pH-value of lime-soil mixture.
Procedures:
A- Representative samples of air-dried, minus No.40 sieve (0.42 mm), were dried in oven (60
°C). About 20 gm for each sample is weighed to the nearest 0.1 gm and poured into 150-ml
(or larger) plastic bottle with screw top.
B- It is advisable to set up eight bottles with lime percentages of 1, 2, 3, 4, 5, 6, 7, and 8. This
will ensure, in most cases, that the percentage of lime required can be determined in one hour.
Weigh the lime to the nearest 0.01 gm and add it to the soil. Shake to mix soil and dry lime.
C- Add 100 ml of CO2 – free distilled water to the bottles.
D- Shake the soil-lime and water until there is no evidence of dry material on the bottom.
Shake for a minimum of 30 seconds.
E- Shake the bottles for 30 seconds every 10 minutes.
sMaterials and method2 33
After one hour, transfer part of the slurry to a plastic beaker and measure the pH-value.
F- Record the pH-value for each of the lime-soil mixtures. The lowest percent lime that gives
a pH-value of 12.40 is the percent required to stabilize the soil. If the pH-value does not go
beyond 12.30 and 2 percents lime give the same reading, the lowest percent which gives a
pH-value of 12.30 is that required to stabilize the soil. If the highest pH-value is 12.30 and
only 1 percent lime gives a pH-value of 12.30, additional test bottles should be started with
larger percentages of lime.
In the present study, optimum lime content of tertiary clay, organic silt and weathered soil is
4.5, 3, and 5%, respectively (see Appendix 6 and Fig. 2.19 in Appendix 7).
4- Preparation of the treated lime-stabilized compacted samples with optimum lime content at
maximum dry density and optimum water content.
A- After the optimum lime content has been estimated, a standard proctor test (according to
DIN 18 127 and TPBF-StB, part B 11.5, 1991) for the lime-soil mixture with optimum lime
content was conducted to determine the maximum dry density and the optimum water content
and to plot the water content-dry density curve.
B- Then, construction of compacted sample of optimum lime-soil mixture through
homogenously mixing of both optimum lime content and the dried soil (2 minutes). This is
followed by addition of the optimum water content on the dry mixture and mixing
homogenously (2 minutes). The mixture should be allowed to cure no less than 1 hour and no
more than 2 hours in a sealed container, followed by remixing (2 minutes) before compaction.
C- Construction of two other samples with increasing lime content (+ 2 and + 4% above the
optimum lime content) to study the effect of an increase in the percentage of lime content
(above the optimum lime content) on the geotechnical properties. After the compaction, the
specimens were prepared to measure the geotechnical properties. The samples should be
wrapped securely with polyethylene paper, laid in a plastic bag to prevent moisture loss, and
cured in a constant temperature and humidity chamber (at 40 °C ± 2°C and at humidity ≥ 98
%) to 7 days. Finally, the geotechnical parameters of the different stabilized lime-soil
mixtures were measured.

sMaterials and method2 34
2.5.2 Procedures of fly ash-stabilization process
1- Preparation of soil sample, soil sample was dried in the air then it was put into oven at 50
°C for 24 hours. The dried soil was crushed in crushing-machine.
2- Determination of the optimum fly ash content for fly ash stabilization using the basis of
Eades and Grim pH-test, 1966. The determination of the fly ash content using the same
procedures taken for lime stabilization, except that, five bottles, instead of eight in lime
stabilization, were prepared with fly ash percentages of 8, 12, 16, 20, and 25.
In the present study, optimum fly ash content of tertiary clay, organic silt and weathered soil
is 16, 20, and 35%, respectively (see Appendix 6 and Fig. 2.20 in Appendix 8).
3- Mixtures were prepared with optimum fly ash content and with other fly ash contents,
under and above the optimum fly ash content, as follows: 8, 12, 16, 20, and 25% on dry
weight basis with the soil to determine the effect of a decrease and an increase in the fly ash
contents compared to the optimum fly ash content.
4- Carrying out of the standard proctor test (DIN 18 127) to determine both the maximum dry
density and the optimum water content for each mixture. Compaction of the samples should
be carried out after mixing with water (2-hours delay) to simulate the typical duration
between mixing and compaction that occurs in the field (Şenol et al., 2002).
5- Construction of compacted samples of the all fly ash-soil mixtures at their maximum dry
densities and their optimum water contents, through homogeneous mixing of fly ash contents
with the dried soils. This followed by addition of the optimum water content on the dry
mixture and homogenously mixing (2 minutes). The mixture must be cured for 2-hours,
where the mixture should be compacted after 2-hours delay from the mixing with water.
6- After the compaction, each specimen should be wrapped with polyethylene paper, laid in
plastic bags, and allowed to cure for 7 days in a humidity-temperature chamber (at ≥ 98%
humidity and at temperature 25 °C ± 2). The optimum fly ash-soil mixture is cured for 28, 56,
and 180 days in a humidity-temperature chamber (at the same conditions of humidity and
temperature) to determine the influence of the curing time factor on the geotechnical
properties and on the process of fly ash-stabilization.
2.5.3 Procedures of lime/fly ash-stabilization process
1- Preparation of soil sample; as the procedure 1 in the fly ash-stabilization process.
2- Determination of the optimum lime/fly ash content for lime/fly ash-stabilization using
Eades and Grim pH-test, 1966. The method of lime/fly ash content determination is similar to
the lime content method, except five bottles were used instead of eight in lime content

sMaterials and method2 35
method. The bottles were prepared at small lime percent (optimum lime content minus 2% for
both the tertiary clay and the weathered soil and optimum lime content minus 1% for the
organic silt) with different fly ash contents as follows: 8, 12, 16, 20, and 25%.
In the present study, optimum lime/fly ash content of tertiary clay, organic silt and weathered
soils according to pH-test is (2.5%L/8%F), (2%L/12%F), and (3%L/20%F), respectively (see
Appendix 6 and Fig. 2.21 in Appendix 9).
3- Other mixtures (at optimum fly ash content with different lime percentages as follow:
optimum lime-2%, optimum lime, and optimum lime+2% in the case of both tertiary clay and
weathered soil and optimum lime-1%, optimum lime, and optimum lime+2% in the case of
organic silt) were prepared to estimate the effect of the increase in the lime content and the
lime/fly ash ratio on the lime/fly ash-stabilization process.
4- Conduction of a standard proctor test (DIN 18 127) to determine both the maximum dry
density and the optimum water content for each mixture. The mixture should be allowed to
cure no less than 1 hour and no more than 2 hours in a sealed container, followed by remixing
(2 minutes) before compaction.
5- Construction of compacted samples, for each mixture, at the maximum dry density and the
optimum water content.
6- After the compaction, each sample should be wrapped securely to prevent moisture loss
and cured in a constant temperature-humidity chamber (at 25°C ± 2 and at relative humidity ≥
98%) for 7 days. Some of the lime/fly ash mixtures were cured for 28, 56, and 180 days to
estimate the influence of curing time factor on the geotechnical properties and on the lime/fly
ash-stabilization process. The lime/fly ash-soil mixtures should remain securely wrapped until
testing.
Figure (2.22) illustrates a flowchart including the present geotechnical laboratory program to
evaluate lime-, fly ash-, and lime/fly ash-stabilization process of the studied soils.

sMaterials and method2 36
Fig. (2.22) Flowchart of geotechnical laboratory program to evaluate lime-, fly ash-, and lime/fly ash-stabilization process of fine grained soils
Chemical additives
Hydrated Lime (DIN
1060)
Fly ash Lippendorf
Lime + Fly ash
Natural fine grained soil
Tertiary clay
Organic silt
Weathered soil
3-9 %L After pH
8,12,16,20,25, & 35%F
(1.5-8%L) + (8-35%F)
Properties estsT) Index(
Chemical Analysis (XRF)
LOI (DIN
18128)
Grain Size Analysis
(DIN 18123)
Specific Gravity
(DIN 18124)
& Surface area
Standard
Compaction (DIN 18127)
Properties (Index) Tests
1- Water Content (DIN 18121) 2- LOI (DIN18128) 3- Grain Size Analysis (DIN18123) 4- Specific Gravity (DIN18124) 5- Specific Surface Area 6- Atterberg Limits (DIN18122-1) 7- Standard Compaction (DIN18127) 8- Classification after USCS & DIN18196 & AASHTO
Chemical Analysis (XRF)
Mineralogi-cal Analysis
(XRD)
SEM
Geotechnical Properties
qu-, CBR-, K-, &
Vp-value
Air- Drying
followed by
Oven-Drying 24 h at 50°C
Crushing
Compaction at op.W% (without chemical
additives)
Geotechnical Properties
qu-, CBR-, K-, &
Vp-value
Dry Mixing
Addition op.W%
Mixing 2 minutes
Curing 2 hours
Remixing 2 minutes
Standard Compaction
Calorimetry W/S=1
Curing at 7, 28, 56, and 180 days
98% Humidity & 25°C and 40°C
Durability Tests including
Freeze/Thaw (ASTM D560)
Wet/Dry (ASTM D559)
Soaking (ASTM C593)
SEM
Mineralogi-cal Analysis
(XRD)
Geotechnical Properties
.) destructive M-as non (Vp & )1-18130DIN (value-K, )ISRM (tσ, ).17StB-TPBF(CBR , )18136DIN (qu
)qu(and unconfined compressive strength , compaction, Plasticity: Results3 37
3 Results: Plasticity, compaction, and unconfined compressive strength (qu)
3.1 Plasticity
Atterberg limits (Plastic limit “PL”, Liquid limit “LL”, and Plasticity index “PI” = LL-PL)
play an important role in soil identification and classification. These parameters indicate to
some of the geotechnical problems such as swell potential and workability. One of the
important and principle aims of this study was to evaluate the changes of liquid, plastic limits,
and plasticity index with addition of lime, fly ash, and lime/fly ash together to the three
studied soils. To achieve this objective, Atterberg limits test (including PL, LL, and PI) was
conducted on both natural soils and different lime-, fly ash-, and lime/fly ash-soil mixtures,
for the three studied soils according to consistency test of DIN 18 122-1.
PL and LL of the different soil-lime, -fly ash, -lime/fly ash mixtures were determined after
1 day curing according to DIN 18 122-1 and TPBF-StB, part B 11.5, 1991. The results of the
tests were calculated using GGU-software program. Figure 3.1 (a, b, & c) illustrates both
liquid limit (LL), plastic limit (LL), and plasticity index (PI) of tertiary clay, organic silt, and
weathered soil, respectively with different chemical additives. In general, the figures show
that the addition of lime, fly ash, and lime/fly ash together, in case of the three studied soils,
led to an increase in both the liquid limit and the plastic limit. The increase of the plastic limit
is greater than that of the liquid limit. This resulted in a reduction of the plasticity index [PI =
LL-PL] (see Appendixes 10, 11, & 12).
3.2 Compaction
The geotechnical properties of soil (such as swell potential, compressive strength, CBR,
permeability, and compressibility etc) are dependent on the moisture and density at which the
soil is compacted. Generally, a high level of compaction of soil enhances the geotechnical
parameters of the soil, so that achieving the desired degree of relative compaction necessary
to meet specified or desired properties of soil is very important (Nicholson et al., 1994). The
aim of the proctor test (moisture-density test) was to determine the optimum moisture
contents of both untreated compacted and treated stabilized soil-mixtures. Standard proctor
test was carried out according to DIN 18 127. The test-results were calculated using GGU-
software program. Figure 3.2 (a, b, & c) illustrates the moisture-density relationship of
tertiary clay, organic silt, and weathered soil, respectively.
The curves show the physical changes that occur (after 2-hr delay) during lime, fly ash,
and lime/fly ash treatment. In general, the addition of lime, fly ash, and lime/fly ash together,
for the three studied soils, led to an increase in the optimum moisture content and to a

)qu(and unconfined compressive strength , compaction, Plasticity: Results3 38
decrease in the maximum dry density. The bell-shaped compaction curves of the three studied
soils were converted to flattened-shaped compaction curves (see Appendixes 10, 11, & 12).
In the case of tertiary clay, the maximum dry density due to fly ash addition decreased
with continuous increase in fly ash content. In the case of organic silt and weathered soil, the
maximum dry density decreased with the fly ash addition, and with continuous increase in fly
ash content, it increased relatively. This may be due to the different mineralogical
composition, where tertiary clay contains montmorolonite which reacts fast with the chemical
additives (lime & fly ash) in comparison to kaolinite and halloysite in both weathered soil and
organic silt, respectively (Kézdi, 1979). In the case of tertiary clay, the addition of lime and
fly ash together led to a more decrease of the maximum dry density compared to the addition
of lime and fly ash separately. In the case of both weathered soil and organic silt, the addition
of lime and fly ash together resulted in a more decrease of the maximum dry density
compared to the addition of fly ash alone.
Fig. (3.1, a) Effect of lime-, fly ash-, and lime/fly ash-addition on consistency limits of tertiary clay
0
10
20
30
40
50
60
70
80
90
Natural
soil
4.5% Li
me
6.5% Li
me
8.5% Li
me
8% Fly
ash
12% Fly
ash
16% Fly
ash
20% Fly
ash
25% Fly
ash
2.5%L+
8%F
2.5%L+
16%F
4.5%L+
16%F
6.5%L+
16%F
Percent admixture
Moi
stur
e co
nten
t (%
)
Liquid limit (%)Plastic limit (%)Plasticity index (%)

)qu(and unconfined compressive strength , compaction, Plasticity: Results3 39
Fig. (3.1, b) Effect of lime-, fly ash-, and lime/fly ash- addition on consistency limits of organic silt
0
10
20
30
40
50
60
Natural
soil
3%Lim
e
5%Lim
e
7%Lim
e
8% Fl
y ash
12%
Fly as
h
16%
Fly as
h
20%
Fly as
h
25%
Fly as
h
2%L+
12%F
2%L+
20%F
3%L+
20%F
5%L+
20%F
Percent admixture
Moi
stur
e co
nten
t (%
)
Liquid limit (%)Plastic limit (%)Plasticity index (%)
Fig. (3.1, c) Effect of lime-, fly ash-, and lime/fly ash-addition on consistency limits of weathered soil
0
10
20
30
40
50
60
70
80
90
100
Natural
soil
5%Lim
e
7%Lim
e
9%Lim
e
8% Fly a
sh
12% Fly a
sh
16% Fly a
sh
20% Fly a
sh
25% Fly a
sh
30% Fly a
sh
35% Fly a
sh
40% Fly a
sh
3%L+
20%F
3%L+
35%F
5%L+
35%F
7%L+
35%F
Percent admixture
Moi
stur
e co
nten
t (%
)
Liquid limit (%)Plastic limit (%)Plasticity index (%)

)qu(and unconfined compressive strength , compaction, Plasticity: Results3 40
Fig. (3.2, a ) Moisture-density relationship for tertiary clay is an evidence of the physical changes (after 2-hr delay) during lime-,
fly ash-, and lime/fly ash-treatment
1.2
1.25
1.3
1.35
1.4
1.45
1.5
15 20 25 30 35 40 45Moisture content (%)
Dry
den
sity
(g/c
m³)
Natural soil
4.5%L
6.5%L
8.5%L
8%F
12%F
16%F
20%F
25%F
2.5%L/8%F
2.5%L/16%F
4.5%L/16%F
6.5%L/16%F
Fig. (3.2, b) Moisture-density relationship for organic silt is an evidence of the physical changes (after 2-hr delay) during lime-,
fly ash-, and lime/fly ash-treatment
1.28
1.3
1.32
1.34
1.36
1.38
1.4
1.42
1.44
1.46
1.48
15 20 25 30 35 40Moisture content (%)
Dry
den
sity
(g/c
m³)
Natural soil3%L5%L7%L8%F12%F16%F20%F25%F2%L/12%F2%L/20%F3%L/20%F5%L/20%F
3.3 Unconfined compressive strength of untreated compacted soils
Compressive strength of a soil is a significant factor to estimate the design criteria for the
use as a pavement and construction material. The lime- and fly ash-stabilization of soil,
generally, leads to increase in the strength of the soil. Therefore, lime and fly ash become
cost-effective and efficient material for use in road construction, embankment, and earth fills.

)qu(and unconfined compressive strength , compaction, Plasticity: Results3 41
Fig. (3.2, c ) Moisture-density relationship for weathered soil is an evidence of the physical changes (after 2-hr delay) during
lime-, fly ash-, and lime/fly ash-treatment
1.15
1.2
1.25
1.3
1.35
1.4
1.45
1.5
1.55
15 20 25 30 35 40 45Moisture content (%)
Dry
den
sity
(g/c
m³)
Natural soil5%L7%L9%L8%F12%F16%F20%F25%F35%F3%L/20%F3%L/35%F5%L/35%F7%L/35%F
The strength gain of lime- and fly ash-stabilized soil is primarily caused by the formation of
various calcium silicate hydrates and calcium aluminate hydrates. The exact products formed,
however, depend on the type of clay mineralogy and the reaction conditions including
temperature, moisture, and curing conditions (Nicholson et al., 1994).
Unconfined compression tests were conducted to characterize the strength of soils and
their mixtures with lime, fly ash and lime/fly ash. The test procedures and the preparation of
the specimens were performed according to the procedures in chapter 2.4.1 and 2.5,
respectively.
Unconfined compressive strengths of the three studied soils, compacted at optimum water
content and without chemical additives, are described in chapter 2.3.4 and given in Tables
2.8, 3.1, 3.2, and 3.3. Unconfined compressive strengths for tertiary clay, organic silt, and
weathered soil were measured after carrying out of the ultrasonic p-wave velocity (Vp) test.
All the specimens were prepared using a standard proctor test. Untreated compacted soil
specimens (without chemical additives) of tertiary clay, organic silt, and weathered soil
(compacted at optimum water content) had unconfined compressive strengths of 131.21,
136.91, and 173.25 KN/m2, respectively. Unconfined compressive strengths of untreated
compacted soils need to be interpreted in the context of the general relationship between the
unconfined compressive strength and the consistency (quality) of the soils used in pavement
applications according to Das, 1994 (see chapter 2.4.1). Unconfined compressive strength

)qu(and unconfined compressive strength , compaction, Plasticity: Results3 42
ranging from 100 to 200 Kpa (KN/m2) is considered as a stiff consistency. This means that
the three tested untreated compacted soils are stiff consistency due to compaction process at
the optimum water content and without chemical additives (lime & fly ash).
3.4 Unconfined compressive strength of treated stabilized soils
Unconfined compressive strength of different soil-lime, soil-fly ash and soil-lime/fly ash
mixtures prepared at optimum water content are given in Tables 3.1, 3.2, and 3.3. The
unconfined compressive strength was measured after 7 days curing and after carrying out of
the p-wave velocity (Vp) test for the three studied stabilized soils.
Soil-lime mixtures of the three tested soils were prepared at the optimum lime content,
2%, and 4% above the optimum lime content (compacted at optimum water content) and
cured for 7 days (see chapter 2.5.1). The values of unconfined compressive strength are
illustrated in Tables 3.1, 3.2, & 3.3 and in Figures 3.3 a & 3.4.
Soil-fly ash mixtures were prepared at 8, 12, 16, 20, and 25% fly ash for both the tertiary
clay and the organic silt and at 8, 12, 16, 20, 25, and 35% fly ash for the weathered soil. All
the mixtures were compacted at the optimum water content, two hours after mixing with
water to simulate the construction delay that typically occurs in the field before sub-grade
compaction due to construction operations, and cured for 7 days (see chapter 2.5.2).
Soil-fly ash mixtures of tertiary clay, organic silt and weathered soil were prepared (at
optimum water contents) at the optimum fly ash content 16, 20, and 35%, respectively.
Subsequently, they were cured for 7, 28, 56, and 180 days to evaluate the effect of long-term
curing on the unconfined compressive strength and on the fly ash-stabilization process. The
values of unconfined compressive strength are shown in Tables 3.1, 3.2, & 3.3 and in Figures
3.3 b & 3.4.
Soil-lime/fly ash mixtures were prepared (at optimum water contents) at the optimum
lime/fly ash contents, according to pH-test, as follows: for tertiary clay (2.5%L/8%F), for
organic silt (2%L/12%F), and for weathered soil (3%L/20%F). All the mixtures were cured
for 7 days. Other mixtures were prepared at the optimum fly ash content with different lime
percentages to evaluate the influence of the increase in the lime and the lime/fly ash ratio on
the lime/fly ash-stabilization process (see chapter 2.5.3).
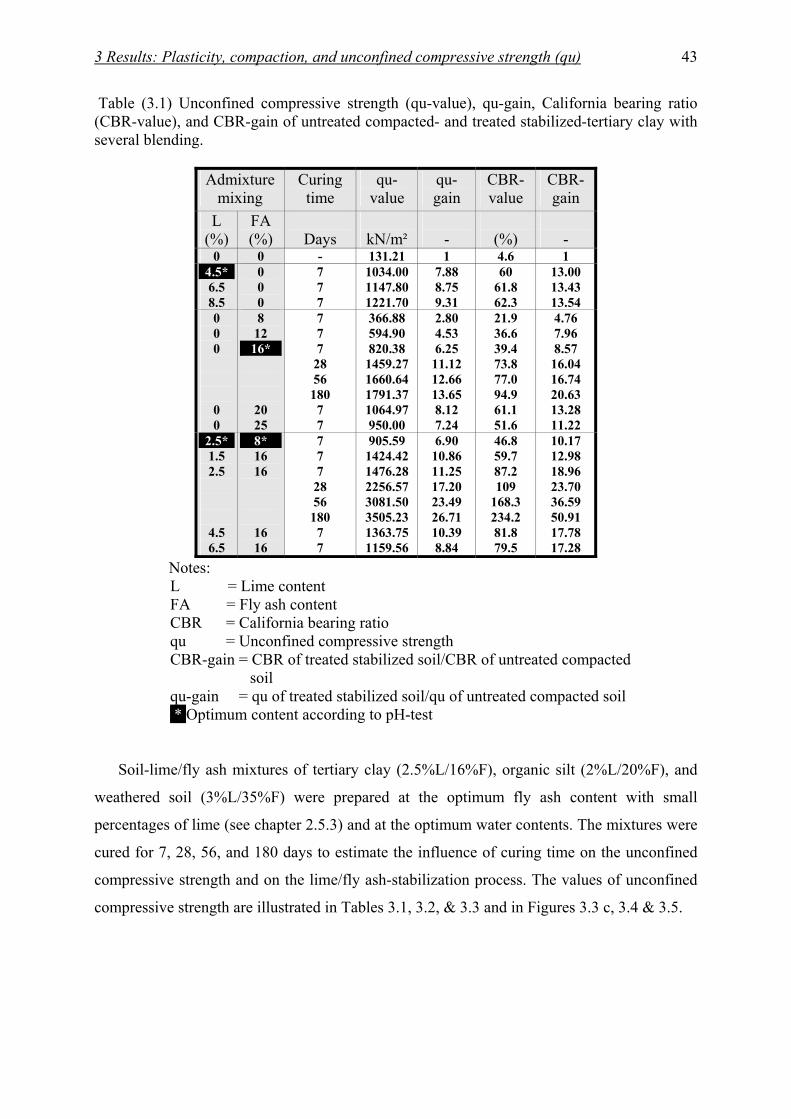
)qu(and unconfined compressive strength , compaction, Plasticity: Results3 43
Table (3.1) Unconfined compressive strength (qu-value), qu-gain, California bearing ratio (CBR-value), and CBR-gain of untreated compacted- and treated stabilized-tertiary clay with several blending.
Admixture
mixing Curing
time qu-
value qu-gain
CBR- value
CBR-gain
L (%)
FA (%)
Days
kN/m²
-
(%)
-
0 0 - 131.21 1 4.6 1 4.5* 6.5 8.5
0 0 0
7 7 7
1034.00 1147.80 1221.70
7.88 8.75 9.31
60 61.8 62.3
13.00 13.43 13.54
0 0 0
0 0
8 12 16* 20 25
7 7 7
28 56 180 7 7
366.88 594.90 820.38
1459.27 1660.64 1791.37 1064.97 950.00
2.80 4.53 6.25
11.12 12.66 13.65 8.12 7.24
21.9 36.6 39.4 73.8 77.0 94.9 61.1 51.6
4.76 7.96 8.57 16.04 16.74 20.63 13.28 11.22
2.5* 1.5 2.5 4.5 6.5
8* 16 16 16 16
7 7 7
28 56 180 7 7
905.59 1424.42 1476.28 2256.57 3081.50 3505.23 1363.75 1159.56
6.90 10.86 11.25 17.20 23.49 26.71 10.39 8.84
46.8 59.7 87.2 109
168.3 234.2 81.8 79.5
10.17 12.98 18.96 23.70 36.59 50.91 17.78 17.28
Notes: L = Lime content FA = Fly ash content CBR = California bearing ratio qu = Unconfined compressive strength CBR-gain = CBR of treated stabilized soil/CBR of untreated compacted soil qu-gain = qu of treated stabilized soil/qu of untreated compacted soil
test-Optimum content according to pH *
Soil-lime/fly ash mixtures of tertiary clay (2.5%L/16%F), organic silt (2%L/20%F), and
weathered soil (3%L/35%F) were prepared at the optimum fly ash content with small
percentages of lime (see chapter 2.5.3) and at the optimum water contents. The mixtures were
cured for 7, 28, 56, and 180 days to estimate the influence of curing time on the unconfined
compressive strength and on the lime/fly ash-stabilization process. The values of unconfined
compressive strength are illustrated in Tables 3.1, 3.2, & 3.3 and in Figures 3.3 c, 3.4 & 3.5.

)qu(and unconfined compressive strength , compaction, Plasticity: Results3 44
Table (3.2) Unconfined compressive strength (qu-value), qu-gain, California bearing ratio (CBR-value), and CBR-gain of untreated compacted- and treated stabilized-organic silt with several blending.
Admixture mixing
Curing time
qu-value
qu- gain
CBR- value
CBR-gain
L (%)
FA (%)
Days
kN/m²
-
(%)
-
0 0 - 136.91 1 3.2 1 3* 5 7
0 0 0
7 7 7
439.49 634.40 628.03
3.21 4.63 4.59
16.8 23.4 23.4
5.25 7.31 7.31
0 0 0 0
0
8 12 16 20* 25
7 7 7 7
28 56 180 7
322.29 532.48 620.38 685.35
1331.26 1385.55 1738.98 964.33
2.35 3.89 4.53 5.01 9.72 10.12 12.70 7.04
14.7 28.7 37
45.8 58.2 94.4
105.0 47.8
4.59 8.97 11.56 14.31 18.19 29.50 32.81 14.94
2* 2
3 5
* 12 20 20 20
7 7
28 56 180 7 7
729.65 866.43
1348.78 1648.44 2148.35 871.88 796.11
5.33 6.33 9.85 12.04 15.69 6.37 5.82
35.2 38.4 61.1 80.4
103.1 40.2 27.4
11.00 12.00 19.09 25.13 32.22 12.56 8.56
Table (3.3) Unconfined compressive strength (qu-value), qu-gain, California bearing ratio (CBR-value), and CBR-gain of untreated compacted- and treated stabilized-weathered soil with several blending.
Admixture mixing
Curing time
qu-value
qu-gain
CBR- value
CBR- gain
L (%)
FA (%)
Days
kN/m²
-
(%)
-
0 0 - 173.25 1 5.4 1 5* 7 9
0 0 0
7 7 7
309.55 329.90 298.09
1.79 1.90 1.72
17.1 17.6 16.8
3.17 3.26 3.11
0 0 0 0 0 0
8 12 16 20 25 35*
7 7 7 7 7 7
28 56 180
294.27 301.54 335.50 389.81 526.12 938.85
1151.07 1184.21 1412.79
1.70 1.74 1.94 2.25 3.04 5.42 6.64 6.84 8.16
15.3 17.5 22.8 26.4 43.5 50.2 51.0 62.9 95.3
2.83 3.24 4.22 4.89 8.06 9.30 9.44 11.65 17.65
3* 3
5 7 8
20* 35 35 35 35
7 7
28 56 180 7 7 7
713.39 1327.30 1619.81 1751.11 2297.16 1421.54 1416.49 1376.68
4.12 7.66 9.35 10.11 13.26 8.21 8.18 7.95
44.5 79.2 84.4
103.3 115.0 80.2 76.6 72.4
8.24 14.67 15.63 19.13 21.30 14.85 14.19 13.41

)qu(and unconfined compressive strength , compaction, Plasticity: Results3 45
3.4.1 General effect of lime-, fly ash-, and lime/fly ash-stabilization
process
The general effect of lime-, fly ash-, and lime/fly ash-stabilization process on the three
studied soils is illustrated in Figure 3.3 a, b, and c, respectively.
The addition of optimum lime content led to an increase in the unconfined compressive
strength for the three different studied soils. Lime-tertiary clay mixtures have the highest
unconfined compressive strength values and lime-weathered soil mixtures have the lowest
values. The reactivity of tertiary clay with lime is strong and the unconfined compressive
strength increased with increasing lime content (2 and 4% above the optimum lime content).
The reactivity of both organic silt and weathered soil with lime is weak according to reactivity
test (see chapter 2.5.1). The lime-organic silt mixtures have unconfined compressive strength
values relatively higher than the values of lime-weathered soil mixtures. The unconfined
compressive strengths of both lime-organic silt and -weathered soil mixtures increased with
increase in the lime content (2% above the optimum lime content) and decreased slightly with
continuous increasing the lime content (4% above the optimum lime content).
The ratio of the unconfined compressive strength of the lime-, fly ash-, and lime/fly ash-
stabilized soil to that of the untreated compacted soil is known as strength gain factor (see
Tables 3.1, 3.2, & 3.3 and Fig. 3.4). The strength gain factor, due to optimum lime content, of
tertiary clay, organic silt, and weathered soil is 7.88, 3.21, and 1.79 (time), respectively. The
final consistency (quality) of the mixtures is hard, hard, and very stiff, respectively (see Table
3.4).
The addition of fly ash contents resulted in an increase in the unconfined compressive
strength for the three tested soils. Fly ash-tertiary clay mixtures have the highest unconfined
compressive strength values and fly ash-weathered soil mixtures have the lowest values, at the
same fly ash contents. The unconfined compressive strength values increased with continuous
increasing the fly ash content (from 8 to 20% fly ash). Above 20% fly ash, for example 25%,
the unconfined compressive strength value of the fly ash-tertiary clay mixture decreased.
The qu-values of both fly ash-organic silt and -weathered soil mixtures are lower than the
values of fly ash-tertiary clay mixtures, at the same fly ash contents. Fly ash-organic silt
mixtures have unconfined compressive strength values relatively higher than the values of fly
ash-weathered soil mixtures, at the same fly ash contents. The unconfined compressive
strength values for both fly ash-organic silt and -weathered soil mixtures increased with
increasing the fly ash content.

)qu(and unconfined compressive strength , compaction, Plasticity: Results3 46
The strength gain factor of optimum fly ash-tertiary clay, optimum fly ash-organic silt, and
optimum fly ash-weathered soil mixtures is 6.25, 5.01, and 5.42, respectively (see Fig. 3.4).
Fig. (3.3, a) Unconfined compressive strength (qu-value) of untreated compacted and treated stabilized soil with
lime
0
200
400
600
800
1000
1200
1400
0 1 2 3 4 5 6 7 8 9 10Lime content (%)
qu-v
alue
( K
N/m
²)
Tertiary clay 7 daysOrganic silt 7 daysWeathered soil 7 days
Fig. (3.3, b) Unconfined compressive strength (qu-value) of untreated compacted and treated stabilized soil with fly
ash
0
200
400
600
800
1000
1200
0 4 8 12 16 20 24 28 32 36 40Fly ash content (%)
qu-v
alue
(KN
/m²)
Tertiary clay 7 days
Organic silt 7 days
Weathered soil 7 days

)qu(and unconfined compressive strength , compaction, Plasticity: Results3 47
Fig. (3.3, c ) Unconfined compressive strength (qu-value) of untreated compacted and treated stabilized soil with
lime/fly ash
0L/0F
8L/35F
6.5L/16F4.5L/16F
2.5L/16F1.5L/16F
2.5L/8F
5L/20F
3L/20F
2L/20F
2L/12F
0L/0F
7L/35F5L/35F
3L/35F
3L/20F
0L/0F
0
200
400
600
800
1000
1200
1400
1600
Lime/fly ash content (%)
qu-v
alue
(KN
/m²)
Tertiary clay 7 daysOrganic silt 7 daysWeathered soil 7 days
The strength gain factor of weathered soil is relatively higher than the gain factor of
organic silt, this may be, since the optimum fly ash content of weathered soil (35% fly ash) is
greater than the optimum fly ash of organic silt (20% fly ash). The final consistency (quality)
of the three mixtures is hard (see Table 3.4).
The addition of lime and fly ash together led to an increase in the unconfined compressive
strength values for the three studied soils strongly compared to the addition of lime and fly
ash separately. Lime/fly ash-tertiary clay mixtures have unconfined compressive strength
values higher than the values of both lime/fly ash-weathered soil and lime/fly ash-organic silt
mixtures. The reactivity of tertiary clay with lime and fly ash together is stronger than the
reactivity of both weathered soil and organic silt. The strength gain factors (due to addition of
the optimum lime/fly ash content, according to the pH-test) of tertiary clay, organic silt, and
weathered soil are 6.90, 5.33, and 4.12, respectively. The strength gain factor (due to addition
of the optimum fly ash with small percent of lime) of tertiary clay (2.5%L/16%F), organic silt
(2%L/20%F), and weathered soil (3%L/35%F) is 11.25, 6.33, and 7.66, respectively (see Fig.
3.4). The final consistency (quality) of the three mixtures is hard (see Table 3.4). The reaction
of the three studied soils with lime and fly ash together is stronger than the reaction with lime
and fly ash separately. The unconfined compressive strength values of the three studied soils
increased with increasing the lime/fly ash ratio. The optimum lime/fly ash ratio of tertiary
clay, organic silt, and weathered soil is 0.16, 0.15, and 0.14, respectively (see Fig. 3.5). Above
the ratio of 0.16 in the case of tertiary clay and 0.15 in the case of organic silt (about 1 lime: 6
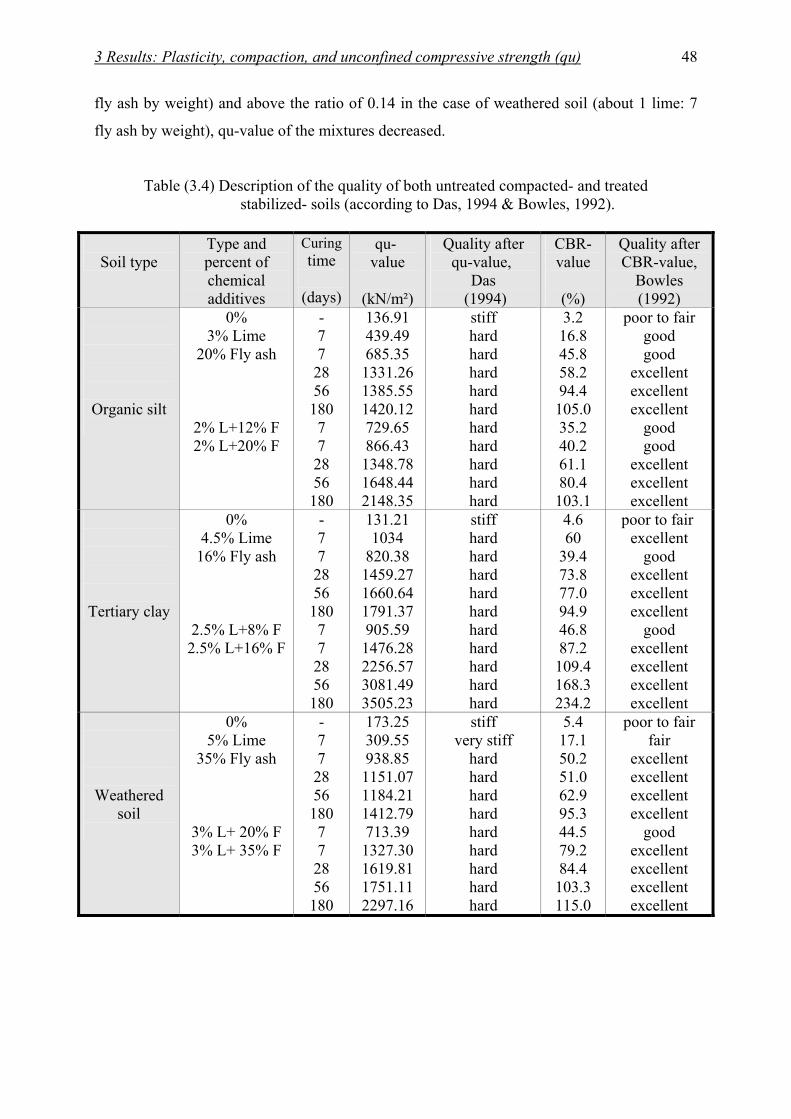
)qu(and unconfined compressive strength , compaction, Plasticity: Results3 48
fly ash by weight) and above the ratio of 0.14 in the case of weathered soil (about 1 lime: 7
fly ash by weight), qu-value of the mixtures decreased.
Table (3.4) Description of the quality of both untreated compacted- and treated stabilized- soils (according to Das, 1994 & Bowles, 1992).
Soil type Type and percent of chemical additives
Curing time
(days)
qu- value
(kN/m²)
Quality after qu-value,
Das (1994)
CBR- value
(%)
Quality after CBR-value,
Bowles (1992)
Organic silt
0% 3% Lime
20% Fly ash
2% L+12% F 2% L+20% F
- 7 7 28 56 180 7 7 28 56 180
136.91 439.49 685.35 1331.26 1385.55 1420.12 729.65 866.43 1348.78 1648.44 2148.35
stiff hard hard hard hard hard hard hard hard hard hard
3.2 16.8 45.8 58.2 94.4 105.0 35.2 40.2 61.1 80.4 103.1
poor to fair good good
excellent excellent excellent
good good
excellent excellent excellent
Tertiary clay
0% 4.5% Lime
16% Fly ash
2.5% L+8% F 2.5% L+16% F
- 7 7 28 56 180 7 7 28 56 180
131.21 1034
820.38 1459.27 1660.64 1791.37 905.59 1476.28 2256.57 3081.49 3505.23
stiff hard hard hard hard hard hard hard hard hard hard
4.6 60
39.4 73.8 77.0 94.9 46.8 87.2 109.4 168.3 234.2
poor to fair excellent
good excellent excellent excellent
good excellent excellent excellent excellent
Weathered soil
0% 5% Lime
35% Fly ash
3% L+ 20% F 3% L+ 35% F
- 7 7 28 56 180 7 7 28 56 180
173.25 309.55 938.85 1151.07 1184.21 1412.79 713.39 1327.30 1619.81 1751.11 2297.16
stiff very stiff
hard hard hard hard hard hard hard hard hard
5.4 17.1 50.2 51.0 62.9 95.3 44.5 79.2 84.4 103.3 115.0
poor to fair fair
excellent excellent excellent excellent
good excellent excellent excellent excellent
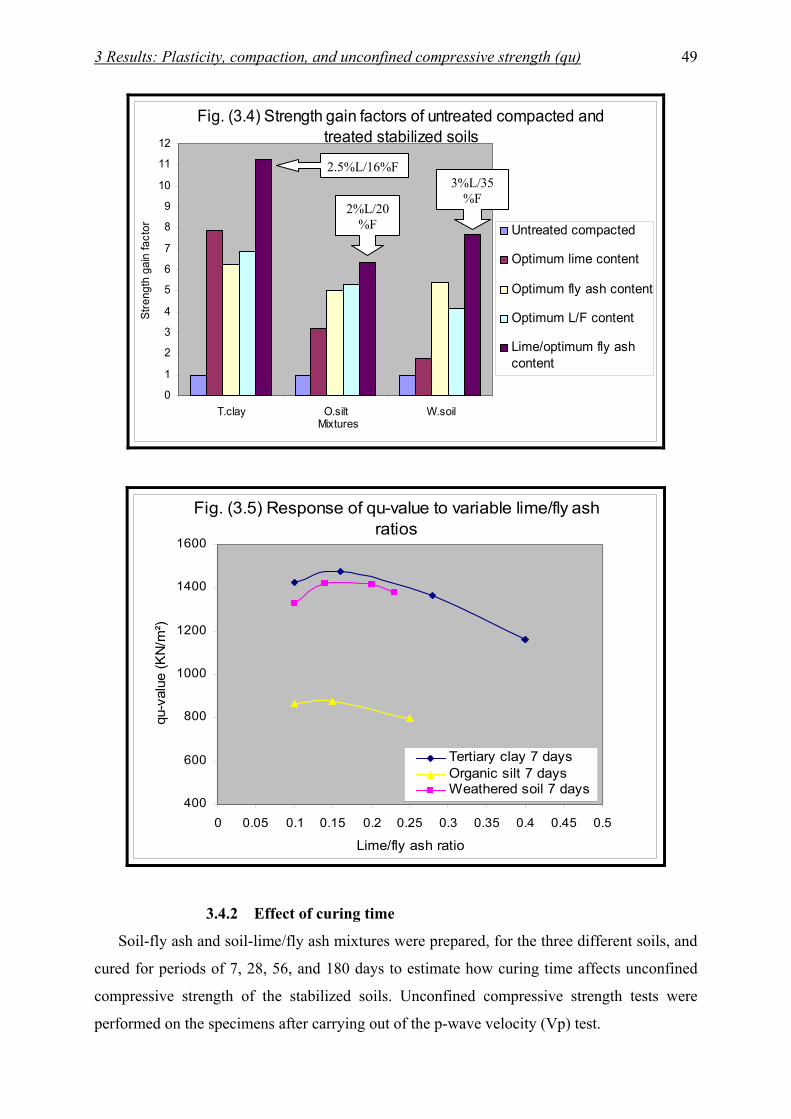
)qu(and unconfined compressive strength , compaction, Plasticity: Results3 49
Fig. (3.4) Strength gain factors of untreated compacted and treated stabilized soils
0
1
2
3
4
5
6
7
8
9
10
11
12
T.clay O.silt W.soilMixtures
Stre
ngth
gai
n fa
ctor
Untreated compacted
Optimum lime content
Optimum fly ash content
Optimum L/F content
Lime/optimum fly ashcontent
Fig. (3.5) Response of qu-value to variable lime/fly ash ratios
400
600
800
1000
1200
1400
1600
0 0.05 0.1 0.15 0.2 0.25 0.3 0.35 0.4 0.45 0.5
Lime/fly ash ratio
qu-v
alue
(KN
/m²)
Tertiary clay 7 daysOrganic silt 7 daysWeathered soil 7 days
3.4.2 Effect of curing time
Soil-fly ash and soil-lime/fly ash mixtures were prepared, for the three different soils, and
cured for periods of 7, 28, 56, and 180 days to estimate how curing time affects unconfined
compressive strength of the stabilized soils. Unconfined compressive strength tests were
performed on the specimens after carrying out of the p-wave velocity (Vp) test.
2.5%L/16%F
2%L/20%F
3%L/35%F
)qu(and unconfined compressive strength , compaction, Plasticity: Results3 50
All the specimens were prepared at the optimum water content. The effect of long-term curing
on the unconfined compressive strength of soil-fly ash and soil-lime/fly ash mixtures is shown
in Figure 3.6. The unconfined compressive strength values of both soil-fly ash and soil-
lime/fly ash mixtures increased with long-term curing. Unconfined compressive strength
values of soil-lime/fly ash mixtures were strongly affected by the long-term curing compared
to the strength values of soil-fly ash mixtures. Unconfined compressive strength values of
tertiary clay-optimum fly ash mixtures increased strongly with curing time compared to
unconfined compressive strength values of both weathered soil- and organic silt-optimum fly
ash mixtures. Unconfined compressive strength values of weathered soil-optimum fly ash
mixtures increased slightly with curing time. Unconfined compressive strength value of
tertiary clay-lime/fly ash mixtures increased dramatically with long-term curing compared to
both weathered soil- and organic silt-lime/fly ash mixtures (see Fig. 3.6 and Tables 3.1, 3.2, &
3.3).
3.4.3 Stress-strain behavior
Figure 3.8 (a, b, & c) shows stress-strain curves, at confining pressure σ3 = zero, for the
three studied soils at different soil-chemical additives with different curing time (7, 28, and
180 days). All the specimens were compacted at optimum water content. It was observed that
the overall soil behavior was significantly influenced by both lime- and fly ash-addition.
Unconfined compressive strength, elasticity modulus at the first loading (Esecant), failure axial
strain (εf), and brittleness changed as a consequence of either the separate or the joined effects
of lime and fly ash contents. By comparing the curves, for all the three tested soils, showed
that the natural soils have ductile behavior, where the unconfined compressive strength equal
to stress-value at 20% strain (according to DIN 18 136).
The untreated compacted soils have relatively similar behavior, which means that the
compaction process for the natural soils at optimum water content and without chemical
additives, does not affect the stress-stain behavior to large amplitude. Peak strength and
elasticity modulus increased slightly, while axial strain at the failure decreased in case of the
tertiary clay and the weathered soil and remained quite similar in case of the organic silt (see
Table 3.5 and Fig. 3.7).

)qu(and unconfined compressive strength , compaction, Plasticity: Results3 51
Fig. (3.6) Effect of curring time on unconfined compressive strength of fly ash- and lime/fly ash-treated stabilized soils
0
500
1000
1500
2000
2500
3000
3500
4000
7 28 49 70 91 112 133 154 175 196Curing time (days)
qu-v
alue
(KN
/m²)
Tertiary clay 16% F
Organic silt 20% F
Weathered soil 35% F
Tertiary clay 2.5%L/16%F
Organic silt 2%L/20%F
Weathered soil3%L/35%F
Fig. (3.7) Photos of specimens after unconfined compressive strength illustrated the development of the mechanical behavior from ductile to brittle due to the stabilization process and the curing time.
A1= Natural clay, A2= Untreated compacted clay, A3= Clay+16%ash 7 days, A4= Clay+2.5%lime+16%ash 7 days, A5= Clay+2.5%lime+16%ash 180 days. B1= Natural organic silt, B2= Untreated compacted organic silt, B3= Organic silt+20%ash 28 days, B4= Organic silt+2%lime+20%ash 7 days, B5= Organic silt+2%lime+20% ash 180 days. C1= Natural weathered soil, C2= Untreated compacted weathered soil, C3= Weathered soil+35%ash 180 days, C4= Weathered soil+3%lime+20%ash 7 days, C5= Weathered soil+3%lime+35%ash 180 days.

)qu(and unconfined compressive strength , compaction, Plasticity: Results3 52
Fig. (3.8, a) Stress-strain curves of tertiary clay
0200400600800
10001200140016001800200022002400260028003000320034003600
0.0 2.5 5.0 7.5 10.0 12.5 15.0 17.5 20.0Strain (%)
Stre
ss (K
N/m
²)Natural soil
Untreated, compacted
4,5%L7
16%F7days
16%F28days
16%F180days
2,5%L8%F7days
2,5%L16%F7days
2,5%L16%F28days
2.5%L16%F180days
Fig. (3.8, b) Stress-strain curves of organic silt
0
200
400
600
800
1000
1200
1400
1600
1800
2000
2200
2400
0.0 2.5 5.0 7.5 10.0 12.5 15.0 17.5 20.0Strain (%)
Stre
ss (K
N/m
²)
natural soilUntreated, compacted3%L7days20%F7days20%F28days20%F180days2L12F7days2L20F7days2L20F28days2L20F180days
The addition of both optimum lime content and optimum fly ash content, separately, led to
an increment of the Esecant and a decrement of the failure axial strain (εf) for the three studied
soils. The increase in Esecant and the reduction of the failure axial strain (εf) were relatively
high with the addition of optimum fly ash content compared to the addition of optimum lime
content for the three studied soils.
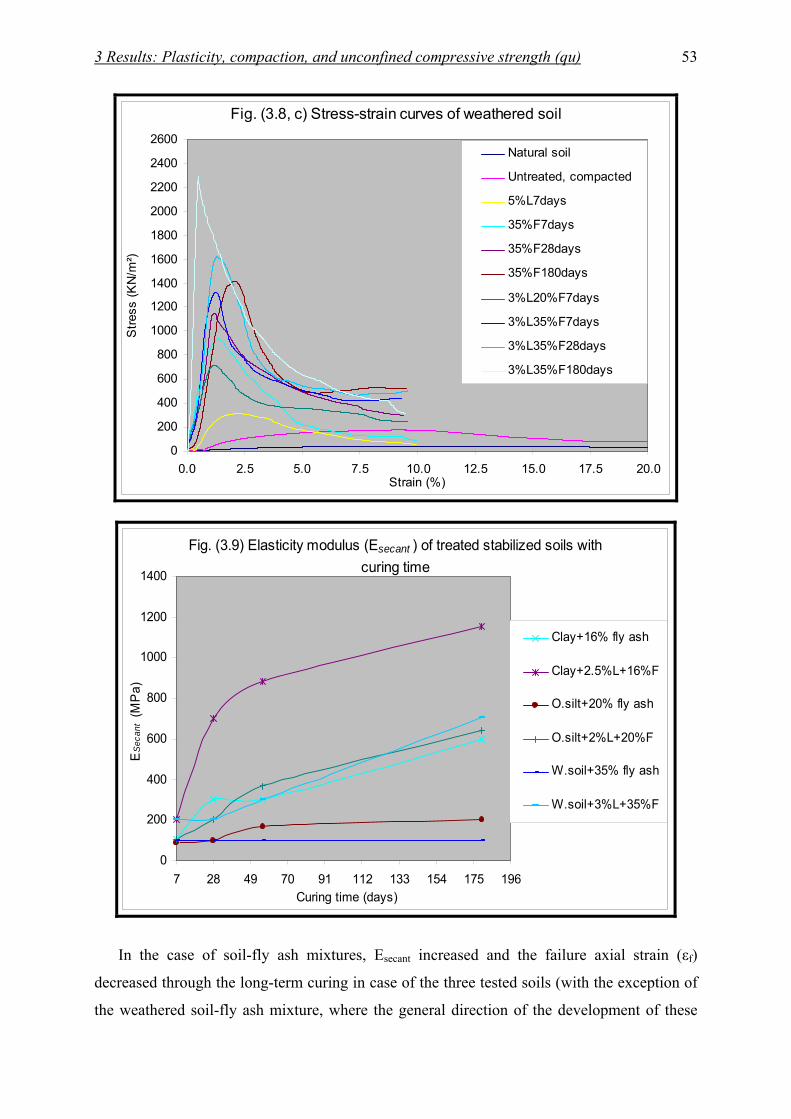
)qu(and unconfined compressive strength , compaction, Plasticity: Results3 53
Fig. (3.8, c) Stress-strain curves of weathered soil
0
200
400
600
800
1000
1200
1400
1600
1800
2000
2200
2400
2600
0.0 2.5 5.0 7.5 10.0 12.5 15.0 17.5 20.0Strain (%)
Stre
ss (K
N/m
²)
Natural soil
Untreated, compacted
5%L7days
35%F7days
35%F28days
35%F180days
3%L20%F7days
3%L35%F7days
3%L35%F28days
3%L35%F180days
Fig. (3.9) Elasticity modulus (Esecant ) of treated stabilized soils with curing time
0
200
400
600
800
1000
1200
1400
7 28 49 70 91 112 133 154 175 196Curing time (days)
ES
ecan
t (M
Pa)
Clay+16% fly ash
Clay+2.5%L+16%F
O.silt+20% fly ash
O.silt+2%L+20%F
W.soil+35% fly ash
W.soil+3%L+35%F
In the case of soil-fly ash mixtures, Esecant increased and the failure axial strain (εf)
decreased through the long-term curing in case of the three tested soils (with the exception of
the weathered soil-fly ash mixture, where the general direction of the development of these

)qu(and unconfined compressive strength , compaction, Plasticity: Results3 54
two parameters (Esecant and εf ) with the long-term curing is relatively constant). In the case of
soil-lime/fly ash mixtures, unconfined compressive strength qu-value and Esecant increased and
the failure axial strain (εf) decreased through the long-term curing for the three different soils
especially in the case of lime/fly ash-stabilized tertiary clay, where the change was dramatic.
Finally, the soil-lime/fly ash mixtures showed an extremely brittle behavior especially
through the long-term curing in comparison to the soil-fly ash mixtures which showed
relatively smaller change (see Table 3.5, Appendix 13, and Fig. 3.9 & 3.10).
Table (3.5) illustrates unconfined compressive strengths (qu-values), failure axial strains (εf), and elasticity modulus (ESecant) of untreated compacted- and treated stabilized-soils at
different mixtures and curing time.
Soil type Mixtures qu-value (KN/m2)
εf (%)
Esecant (MPa)
Tertiary clay
Untreated compacted 4.5% lime 7 days 16% fly ash 7 days 16% fly ash 28 days 16% fly ash 56 days 16% fly ash 180 days 2.5% lime/ 8% fly ash7 2.5% L/16% fly ash 7 2.5% L/16% fly ash 28 2.5% L/16% fly ash 56 2.5% L/16%fly ash180
131.21 1034.00 820.38
1459.27 1660.64 1791.37 905.59
1476.28 2256.57 3081.49 3505.23
6.10 1.37 1.20 0.93 0.92 0.78 1.46 1.33 1.19 0.84 0.70
5 101 101 300 300 600 100 201 701 882
1157
Organic silt
Untreated compacted 3% lime 7 days 20% fly ash 7 days 20% fly ash 28 days 20% fly ash 56 days 20% fly ash 180 days 2% lime/12% fly ash 7 2% L/20% fly ash 7 2% L/20% fly ash 28 2% L/20% fly ash 56 2% L/20% fly ash 180
136.91 439.49 685.35
1331.26 1385.55 1420.12 729.65 866.43
1348.78 1648.44 2148.35
20 3
2.51 1.40 1.33 1.00 1.72 1.52 1.20 0.91 0.67
2 43 90 101 169 201 100 101 200 370 642
Weathered soil
Untreated compacted 5% lime 7 days 35% fly ash 7 days 35% fly ash 28 days 35% fly ash 56 days 35% fly ash 180 days 3% lime/20% fly ash 7 3% L/35% fly ash 7 3% L/35% fly ash 28 3% L/35% fly ash 56 3% L/35% fly ash 180
173.25 309.55 938.85
1151.07 1184.21 1412.79 713.39
1327.30 1619.81 1751.11 2297.16
8.91 2.08 1.33 1.19 1.38 1.20 1.20 1.27 1.22 1.38 0.48
7 33 100 100 98 101 72 200 201 299 709
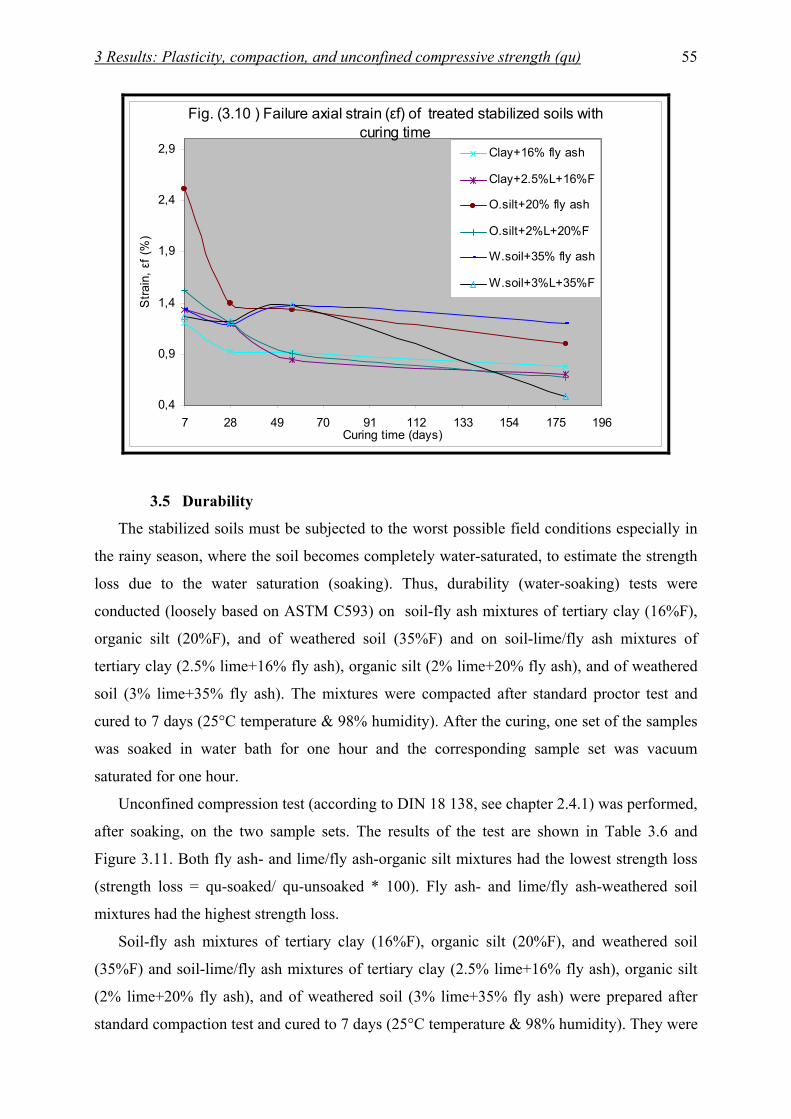
)qu(and unconfined compressive strength , compaction, Plasticity: Results3 55
Fig. (3.10 ) Failure axial strain (εf) of treated stabilized soils with curing time
0,4
0,9
1,4
1,9
2,4
2,9
7 28 49 70 91 112 133 154 175 196Curing time (days)
Stra
in, ε
f (%
)Clay+16% fly ash
Clay+2.5%L+16%F
O.silt+20% fly ash
O.silt+2%L+20%F
W.soil+35% fly ash
W.soil+3%L+35%F
3.5 Durability
The stabilized soils must be subjected to the worst possible field conditions especially in
the rainy season, where the soil becomes completely water-saturated, to estimate the strength
loss due to the water saturation (soaking). Thus, durability (water-soaking) tests were
conducted (loosely based on ASTM C593) on soil-fly ash mixtures of tertiary clay (16%F),
organic silt (20%F), and of weathered soil (35%F) and on soil-lime/fly ash mixtures of
tertiary clay (2.5% lime+16% fly ash), organic silt (2% lime+20% fly ash), and of weathered
soil (3% lime+35% fly ash). The mixtures were compacted after standard proctor test and
cured to 7 days (25°C temperature & 98% humidity). After the curing, one set of the samples
was soaked in water bath for one hour and the corresponding sample set was vacuum
saturated for one hour.
Unconfined compression test (according to DIN 18 138, see chapter 2.4.1) was performed,
after soaking, on the two sample sets. The results of the test are shown in Table 3.6 and
Figure 3.11. Both fly ash- and lime/fly ash-organic silt mixtures had the lowest strength loss
(strength loss = qu-soaked/ qu-unsoaked * 100). Fly ash- and lime/fly ash-weathered soil
mixtures had the highest strength loss.
Soil-fly ash mixtures of tertiary clay (16%F), organic silt (20%F), and weathered soil
(35%F) and soil-lime/fly ash mixtures of tertiary clay (2.5% lime+16% fly ash), organic silt
(2% lime+20% fly ash), and of weathered soil (3% lime+35% fly ash) were prepared after
standard compaction test and cured to 7 days (25°C temperature & 98% humidity). They were

)qu(and unconfined compressive strength , compaction, Plasticity: Results3 56
subjected to wetting/drying-, and freezing/thawing-durability tests according to ASTM D559
and D560, respectively including 12 cycles of wetting/drying and 12 cycles of
freezing/thawing. The procedures of the tests are similar to the procedures of the standards
test methods for compacted cement mixtures except wire brushing after each cycle is omitted
(U.S. Army, Air force, and Navy, 2005). Each test consists of twelve two-day cycles of
wetting/drying or freezing/thawing, which means that each test requires 24 days to complete.
Stabilized soil mixtures, that satisfy strength requirements, are required to pass these tests to
prove their ability to withstand environmental conditions (Baghdadi el al., 1995). The results
of the durability test were expressed in terms of weight loss at the end of the 12 cycles. The
weigh loss criteria and the durability test results of the stabilized soils after 12 cycles are
shown in Tables 3.7 and 3.8, respectively. In the case of freezing/thawing durability test, all
the mixtures passed successively. In the case of wetting/drying durability test, three mixtures
passed successively (tertiary clay-lime/fly ash, organic silt-fly ash, and -lime/fly ash mixtures)
while the other three mixtures failed (see Tables 3.7 & 3.8 and Appendixes 14 & 15).
Table (3.6) Unconfined compressive strength, strength gain, and strength loss of the treated stabilized soils under different conditions
Unconfined compressive strength after 7 days curing
(under 25°C temperature & 98 % humidity) Unsoaked
Plain soaked loosely based on
(ASTM C593) Vacuum saturated soaked
loosely based on (ASTM C593)
qu-value at different
conditions
Samples
qu-value
(KN/m²)
Strength gain
qu-value
(KN/m²)
Strength gain
Strength loss (%)
qu-value
(KN/m²)
Strength gain
Strength loss (%)
Clay 16% FClay 2.5% L/ 16%F
820.38 1476.28
6.25 11.25
646.45 706.75
4.93 5.39
21.20 52.13
643.27 824.64
4.90 6.28
21.59 44.14
Silt 20% FSilt 2% L/ 20% F
685.35 866.43
5.01 6.33
615.15 654.66
4.49 4.78
10.24 24.44
615.89 668.34
4.50 4.88
10.13 22.86
W.soil 35% FW.soil 3% L/ 35% F
938.85 1327.30
5.42 7.66
472.30 601.50
2.73 3.47
49.69 54.68
456.01 735.28
2.63 4.24
51.43 44.60
Table (3.7) Durability test weight loss criteria (Durability requirements) according to (ASTM
D559 and D560).
Type of soil stabilized
Maximum allowable weight loss after 12 wet-dry or freeze-thaw cycles percent of
initial specimen weight Granular, PI < 10 11 Granular, PI > 10 8
Silt 8
Clay 6
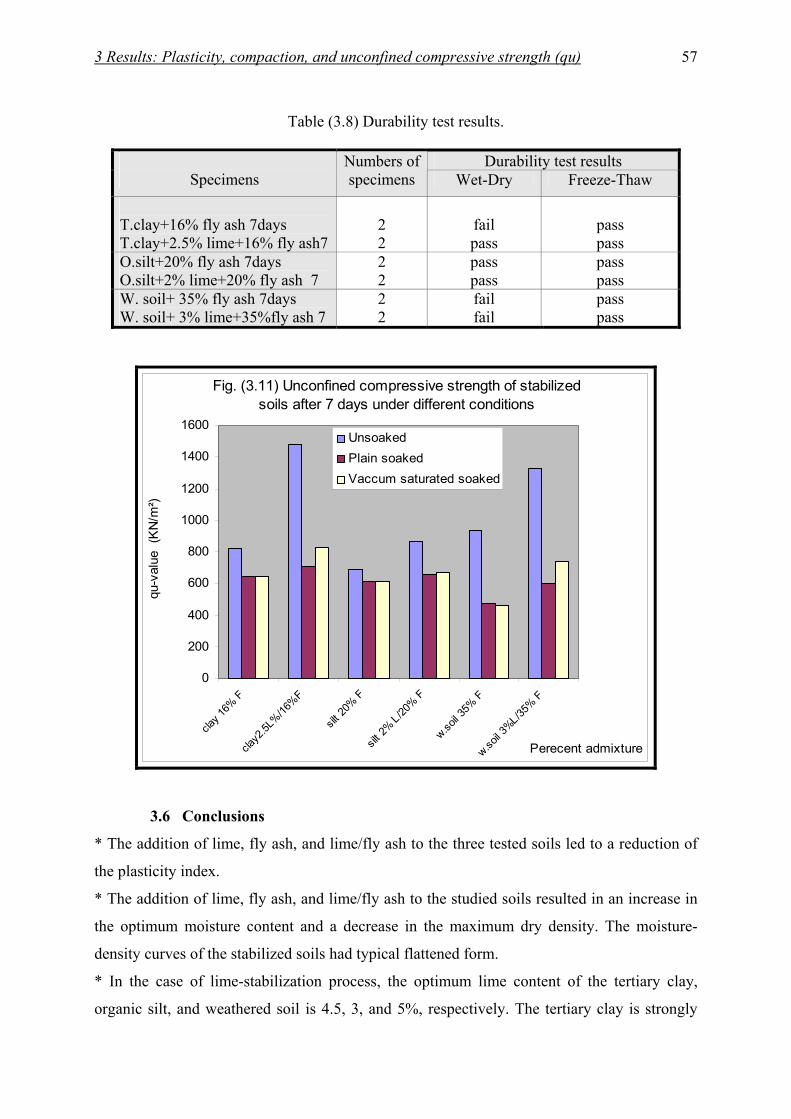
)qu(and unconfined compressive strength , compaction, Plasticity: Results3 57
Table (3.8) Durability test results.
Durability test results
Specimens Numbers of specimens Wet-Dry Freeze-Thaw
T.clay+16% fly ash 7daysT.clay+2.5% lime+16% fly ash7
2 2
fail pass
pass pass
O.silt+20% fly ash 7daysO.silt+2% lime+20% fly ash 7
2 2
pass pass
pass pass
W. soil+ 35% fly ash 7daysW. soil+ 3% lime+35%fly ash 7
2 2
fail fail
pass pass
Fig. (3.11) Unconfined compressive strength of stabilized soils after 7 days under different conditions
0
200
400
600
800
1000
1200
1400
1600
clay 1
6% F
clay2
.5L%/16
%F
silt 20
% F
silt 2%
L/20% F
w.soil 3
5% F
w.soil 3
%L/35% F
Perecent admixture
qu-v
alue
(K
N/m
²)
UnsoakedPlain soakedVaccum saturated soaked
3.6 Conclusions
* The addition of lime, fly ash, and lime/fly ash to the three tested soils led to a reduction of
the plasticity index.
* The addition of lime, fly ash, and lime/fly ash to the studied soils resulted in an increase in
the optimum moisture content and a decrease in the maximum dry density. The moisture-
density curves of the stabilized soils had typical flattened form.
* In the case of lime-stabilization process, the optimum lime content of the tertiary clay,
organic silt, and weathered soil is 4.5, 3, and 5%, respectively. The tertiary clay is strongly

)qu(and unconfined compressive strength , compaction, Plasticity: Results3 58
reactive with lime and the unconfined compressive strength increased continuously with an
increase in the lime content. Both the weathered soil and the organic silt failed in the
reactivity test. The unconfined compressive strength increased at the optimum lime content
and 2% above the optimum compared to the strength of the untreated compacted specimens.
The continuous increase in the lime (4% above the optimum lime content) led to a decrease in
the unconfined compressive strength.
* In the case of fly ash-stabilization process, the optimum fly ash content (according to pH-
method) of the tertiary clay, organic silt, and weathered soil is 16, 20, and 35%, respectively.
The unconfined compressive strength increased with increasing the fly ash content for both
the organic silt and weathered soil. In case of the tertiary clay, the unconfined compressive
strength increased with increasing fly ash content (from 8 to 20%) and decreased with
continuous increase in fly ash content (above 20% fly ash content). Fly ash-organic silt
mixtures have lower qu- and strength gain-values compared to fly ash-inorganic tertiary clay
mixtures. These values are satisfactory and higher than qu-values of fly ash-weathered soil
mixtures.
* In the case of lime/fly ash-stabilization process, the optimum lime/fly ash content
(according to pH-method) of tertiary clay, organic silt, and weathered soil is (2.5%L+8%F),
(2%L+12%F), and (3%L+20%F), respectively. The addition of lime and fly ash together
increased the unconfined compressive strength- and the strength gain-values of the three
studied soils strongly compared to the addition of lime and fly ash separately. Lime/fly ash-
tertiary clay mixtures have qu- and strength gain-values higher than the values of both
lime/fly ash-organic silt and –weathered soil mixtures.
In the present study, the strength gain increased for all the three tested soils with an increase
in both the lime and the fly ash contents, but this increase has upper limit at the optimum
lime/fly ash ratio. The optimum ratio of tertiary clay and organic silt is 0.16 and 0.15,
respectively (about 1 lime: 6 fly ash by weight) and the ratio of weathered soil is 0.14 (about
1 lime: 7 fly ash by weight).
* For the three studied stabilized soils, the elasticity modulus (Esecant) increased and the failure
axial strain (εf) decreased as a consequence of either the separate or the joined effects of lime
and fly ash contents. The Esecant increased and the failure axial strain (εf) decreased
dramatically with the addition of both lime and fly ash together, especially in the case of
tertiary clay. The mechanical behavior of the three studied soils was changed from ductile to
brittle. This development was relatively weak for the acidic weathered soil.
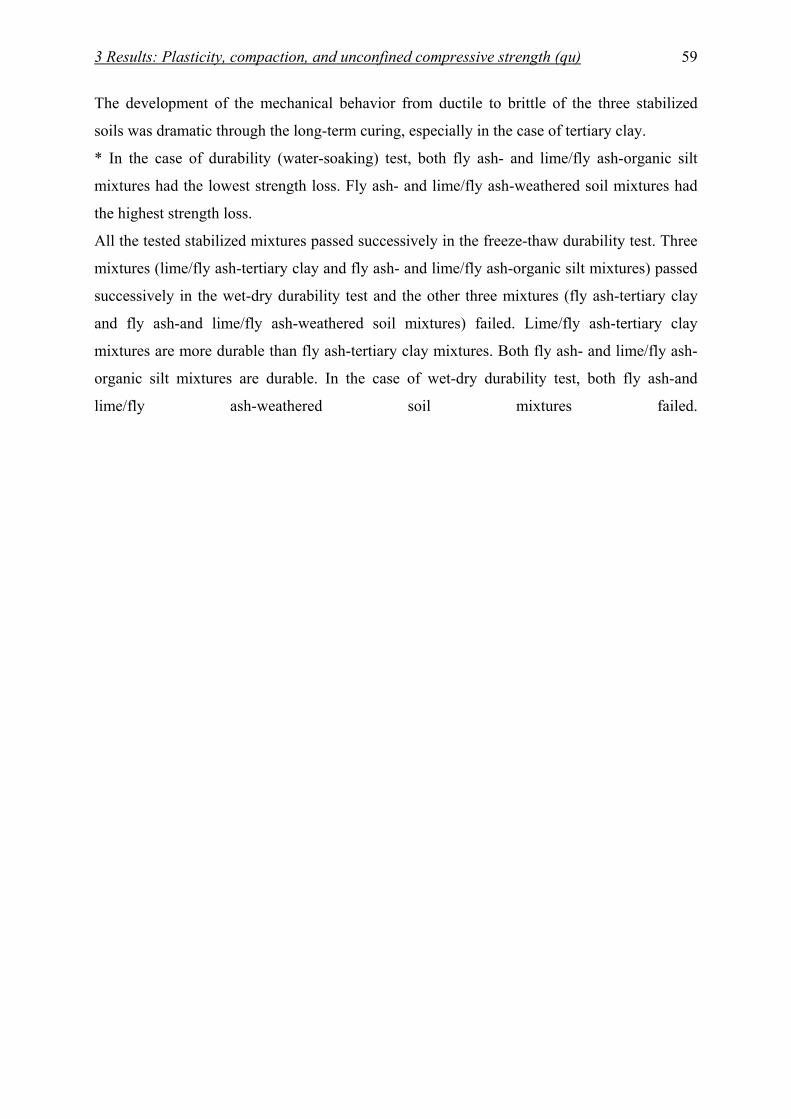
)qu(and unconfined compressive strength , compaction, Plasticity: Results3 59
The development of the mechanical behavior from ductile to brittle of the three stabilized
soils was dramatic through the long-term curing, especially in the case of tertiary clay.
* In the case of durability (water-soaking) test, both fly ash- and lime/fly ash-organic silt
mixtures had the lowest strength loss. Fly ash- and lime/fly ash-weathered soil mixtures had
the highest strength loss.
All the tested stabilized mixtures passed successively in the freeze-thaw durability test. Three
mixtures (lime/fly ash-tertiary clay and fly ash- and lime/fly ash-organic silt mixtures) passed
successively in the wet-dry durability test and the other three mixtures (fly ash-tertiary clay
and fly ash-and lime/fly ash-weathered soil mixtures) failed. Lime/fly ash-tertiary clay
mixtures are more durable than fly ash-tertiary clay mixtures. Both fly ash- and lime/fly ash-
organic silt mixtures are durable. In the case of wet-dry durability test, both fly ash-and
lime/fly ash-weathered soil mixtures failed.

)CBR(ing Ratio California Bear: Results4 60
4 Results: California Bearing Ratio (CBR) CBR-value is used as an index of soil strength and bearing capacity. This value is broadly
used and applied in design of the base and the sub-base material for pavement. Lime- and fly
ash–stabilized soils are often used for the construction of these pavement layers and also for
embankments. CBR-value is a familiar indicator test used to evaluate the strength of soils for
these applications (Nicholson et al., 1994). CBR-test was conducted to characterize the
strength and the bearing capacity of the three studied soils and their mixtures with lime, fly
ash, and lime/fly ash. The test procedures and the preparation of the specimens were achieved
according to the procedures in chapter 2.4.2 and 2.5, respectively.
4.1 CBR of untreated compacted soils
CBR-values of the three tested soils, compacted at optimum water content, are given in
Tables 2.8, 3.1, 3.2, and 3.3 (see chapter 2.3.4 and 3). All the specimens were prepared using
a standard proctor test. Untreated compacted soil specimens (without chemical additives) of
tertiary clay, organic silt, and weathered soil, compacted at optimum water content, had CBR-
values of 4.6, 3.2, and 5.4%, respectively. CBR-values of untreated compacted soils need to
be interpreted in the context of the general relationship between the CBR-values and the
consistency (quality) of the soils used in pavement applications (Bowles, 1992). CBR-values
ranging from 3 to 7% are considered as a poor to fair consistency. This means that the
untreated compacted-tertiary clay, -weathered soil, and -organic silt belong to poor to fair
consistency resulting from the compaction process at the optimum water content and without
chemical additives “lime & fly ash” (see chapter 2.4.2 and Table 3.4).
4.2 CBR of treated stabilized soils
CBR-values of soil-lime, soil-fly ash, and soil-lime/fly ash mixtures prepared at optimum
water content are given in Tables 3.1, 3.2, and 3.3 (see Appendixes 16, 17, & 18). CBR-value
was measured after 7 days curing for the three studied soils.
Soil-lime mixtures of the three tested soils were prepared at the optimum lime content,
2%, and 4% above the optimum lime content (compacted at optimum water content) and
cured for 7 days (see chapter 2.5.1). CBR-values are shown in Tables 3.1, 3.2, & 3.3 and in
Figures 4.1 a & 4.2.
Soil-fly ash mixtures were prepared at 8, 12, 16, 20, and 25% fly ash for both the tertiary
clay and the organic silt and at 8, 12, 16, 20, 25, and 35% fly ash for the weathered soil.
)CBR(ing Ratio California Bear: Results4 61
All the mixtures were compacted at optimum water content (two hours delay after the
mixing) and cured for 7 days (see chapter 2.5.2).
Soil-fly ash mixtures of tertiary clay, organic silt, and weathered soil were prepared at the
optimum fly ash content of 16, 20, and 35%, respectively (at optimum water content) and
cured for 7, 28, 56, and 180 days to estimate the influence of curing time on the CBR-value
and on the fly ash-stabilization process. The values of CBR are illustrated in Tables 3.1, 3.2,
& 3.3 and in Figures 4.1 b & 4.2.
Soil-lime/fly ash mixtures were prepared at the optimum lime/fly ash contents, after pH-
test, of (2.5%L/8%F), (2%L/12%F), and (3%L/20%F) for tertiary clay, organic silt, and
weathered soil, respectively. Other mixtures were prepared at the optimum fly ash content
with different lime percentages to evaluate the effect of the increase in the lime and the
lime/fly ash ratio on the lime/fly ash-stabilization process (see chapter 2.5.3). All the mixtures
were compacted at the optimum water content and cured for 7 days.
Soil-lime/fly ash mixtures of tertiary clay (2.5%L/16%F), organic silt (2%L/20%F), and
weathered soil (3%L/35%F) were prepared at the optimum fly ash contents with small
percentage of lime and at optimum water content (see chapter 2.5.3). The mixtures were cured
for 7, 28, 56, and 180 days to evaluate the effect of the long-term curing on the CBR-value
and on the lime/fly ash-stabilization process. CBR-values are illustrated in Tables 3.1, 3.2, &
3.3 and in Figures 4.1 c, 4.2, 4.3, & 4.4 (see Appendixes 16, 17, & 18).
4.2.1 General effect of lime-, fly ash- and lime/fly ash-stabilization process
The general effect of lime-, fly ash- and lime/fly ash-stabilization process on the three
studied soils is illustrated in Figure 4.1 a, b, and c, respectively. The addition of the optimum
lime content led to an increase in the CBR-values for the three tested soils. The lime-tertiary
clay mixtures have the highest CBR-values, whereas the lime-weathered soil mixtures have
the lowest values. The reactivity of the tertiary clay with lime is stronger than the reactivity of
both the weathered soil and the organic silt. The CBR-values of lime-tertiary clay mixtures
increased slightly with increasing lime content (2 and 4% above the optimum lime content).
The reactivity of both the organic silt and the weathered soil with lime is weak, according to
the reactivity test (see chapter 2.5.1). The lime-organic silt mixtures have CBR-values
relatively higher than the CBR-values of lime-weathered soil mixtures. CBR-values of both
lime stabilized-organic silt and -weathered soil increased with increasing lime content (2%
above the optimum lime content) and decreased slightly with continual increase in the lime

)CBR(ing Ratio California Bear: Results4 62
content (4% above the optimum lime content) in case of the weathered soil and were not
changed in case of the organic silt (see Fig. 4.1 a).
The ratio of the CBR-value of the lime-, fly ash-, and lime/fly ash-stabilized soil to that of
the untreated compacted soil is known as the CBR-gain factor. The CBR-gain factors (due to
the addition of the optimum lime content) of the tertiary clay, the organic silt, and the
weathered soil are 13.1, 5.25, and 3.17, respectively. The final consistency (quality) of the
mixtures is excellent, good, and fair, respectively (see Table 3.4 and Fig. 4.2).
The addition of fly ash contents resulted in an increase in the CBR-values for the three
studied soils. Fly ash-tertiary clay mixtures have the highest CBR-values and fly ash-
weathered soil mixtures have the lowest values, at the same fly ash contents.
The CBR-values of tertiary clay-fly ash mixtures increased with increasing the fly ash
content until 20%. Above 20% fly ash (for example 25%), the CBR-value decreased. Similar
behavior was obtained at measurement of the unconfined compressive strength (see chapter
3.4.1).
Fig. (4.1, a) California bearing ratio (CBR-value, laboratory) of untreated compacted- and treated stabilized-soils with lime
0
10
20
30
40
50
60
70
0 1 2 3 4 5 6 7 8 9 10
Lime content (%)
CB
R-v
alue
(%)
Tertiary clay 7 daysOrganic silt 7 days Weathered soil 7 days

)CBR(ing Ratio California Bear: Results4 63
Fig. (4.1, b) California bearing ratio (CBR-value, laboratory) of untreated compacted- and treated stabilized-
soils with fly ash
0
10
20
30
40
50
60
70
0 4 8 12 16 20 24 28 32 36 40Fly ash content (%)
CB
R-v
alue
(%)
Tertiary clay 7 days
Organic silt 7 days
Weathered soil 7 days
Fig. (4.1, c) California bearing ratio (CBR-value, laboratory) of untreated compacted- and treated stabilized-
soils with lime/fly ash
0L/0F
8L/35F6.5L/16F
4.5L/16F2.5L/16F
1.5L/16F
2.5L/8F
0L/0F
2L/12F2L/20F
3L/20F
5L/20F
5L/35F7L/35F
3L/35F
0L/0F
3L/20F
0
10
20
30
40
50
60
70
80
90
100
Lime/fly ash content (%)
CB
R-v
alue
(%)
Tertiary clay 7 days Organic silt 7 daysWeathered soil 7 days
The CBR-values of both fly ash-organic silt and -weathered soil mixtures are relatively
lower than the CBR-values of fly ash-tertiary clay mixtures, at the same fly ash contents. Fly
ash-organic silt mixtures have the CBR-values relatively higher than the CBR-values of fly
ash-weathered soil mixtures, at the same fly ash contents. CBR-values for both fly ash-
organic silt and -weathered soil mixtures increased with increasing the fly ash content.

)CBR(ing Ratio California Bear: Results4 64
CBR-gain factors of fly ash-organic silt mixtures are slightly higher than the CBR-gain
factors of fly ash-tertiary clay mixtures, at the same fly ash contents. CBR-gain factors of fly
ash-weathered soil mixtures are lower than the factors of both fly ash-organic silt and –
tertiary clay mixtures, at the same fly ash contents. CBR-gain factors (due to the addition of
the optimum fly ash content) of tertiary clay, organic silt, and weathered soil are 8.57, 14.31,
and 9.44, respectively (see Fig. 4.2).
CBR-gain factor of both the organic silt and the weathered soil is higher than the factor of
tertiary clay. The final consistency (quality) of optimum fly ash-tertiary clay, -organic silt,
and -weathered soil mixtures is good, good, and excellent, respectively (see Table 3.4).
The addition of lime and fly ash together led to a dramatic increase in the CBR-values for
the three studied soils compared to the addition of lime and fly ash separately. The CBR-
values of tertiary clay-lime/fly ash mixtures are higher than both weathered soil- and organic
silt-lime/fly ash mixtures. CBR-gain factors (due to the addition of the optimum lime/fly ash
content after pH-method) of tertiary clay, organic silt, and weathered soil are 10.17, 11.00,
and 8.24, respectively. CBR-gain factor (due to the addition of the optimum fly ash with small
percentage of lime) of tertiary clay (2.5%L/16%F), organic silt (2%L/20%F), and weathered
soil (3%L/35%F) is 18.96, 12.56, and 14.67, respectively (see Fig. 4.2). The final consistency
of tertiary clay, organic silt, and weathered soil–lime/fly ash mixtures is excellent, good, and
excellent, respectively (see Table 3.4). CBR-values increased with increasing lime/fly ash
ratio. The optimum lime/fly ash ratio of tertiary clay, organic silt, and weathered soil is 0.16,
0.15, and 0.14, respectively. Above the ratios of 0.16 and 0.15 for both the tertiary clay and
the organic silt, respectively (about 1 lime: 6 fly ash by weight) and above the ratio 0.14
(about 1 lime: 7 fly ash by weight) for the weathered soil, the CBR-values of the soils-
lime/fly ash mixtures decreased (see Fig. 4.3).
This means that the increment of lime percentage above 16, 15, and 14% of the fly ash
weight for the tertiary clay, the organic silt, and the weathered soil, respectively resulted in a
decrement of the CBR-values of the soil-lime/fly ash mixtures.
4.2.2 Effect of curing time
Soil-fly ash and soil-lime/fly ash mixtures, for the three different tested soils, were
prepared and cured for periods of 7, 28, 56, and 180 days to evaluate the effect of long-term
curing on the CBR-value of the treated stabilized soils. All the specimens were prepared at the
optimum water content.

)CBR(ing Ratio California Bear: Results4 65
Fig. (4.2) CBR-gain factors of untreated compacted- and treated stabilized-soils
0
2
4
6
8
10
12
14
16
18
20
T. clay O. silt W. soilMixtures
CB
R-g
ain
fact
or
Untreated compacted
Optimum lime content
Optimum fly ash content
Optimum L/F content
Lime/optimum fly ashcontent
Fig. (4.3) Variation of CBR-value with variable ratios of lime to fly ash
20
30
40
50
60
70
80
90
100
0 0.05 0.1 0.15 0.2 0.25 0.3 0.35 0.4 0.45Lime/fly ash-ratio
CBR
-val
ue (%
)
Tertiary clay 7 daysOrganic silt 7 daysWeathered soil 7 days
The effect of curing time on CBR-value of soil-fly ash and soil-lime/fly ash mixtures is
illustrated in Figure 4.4. The CBR-values of both soil-fly ash and soil-lime/fly ash mixtures
increased with curing time in case of the three tested soils.
CBR-values of tertiary clay- and weathered soil-lime/fly ash mixtures were strongly
affected by the long-term curing compared to tertiary clay- and weathered soil-optimum fly
ash mixtures. Organic silt-optimum fly ash mixtures were strongly affected by curing time
2.5%L/16%F
2%L/20%F
3%L/35%F

)CBR(ing Ratio California Bear: Results4 66
compared to organic silt-lime/fly ash mixtures. In general, the CBR-values of fly ash- and
lime/fly ash-stabilized weathered soil were slightly affected by the long-term curing in
comparison to CBR-values of both stabilized-tertiary clay and –organic silt.
CBR-values of tertiary clay-lime/fly ash mixture increased dramatically with the long-
term curing compared to weathered soil- and organic silt-lime/fly ash mixtures (see Fig. 4.4
and Tables 3.1, 3.2, & 3.3).
Fig. (4.4) Effect of curring time on the CBR-value of fly ash- and lime/fly ash-stabilized soils
020406080
100120140160180200220240260
7 28 49 70 91 112 133 154 175 196Curing time (days)
CB
R-v
alue
(%)
Tertiary clay 16% F
Weathered soil 35% F
Organic silt 20% F
Tertiary clay 2.5%L/16%F
Weathered soil 3%L/35%F
Organic silt 2%L/20%F
4.3 Conclusions
* In the case of lime-stabilization process, the addition of optimum lime content (according to
pH-method) resulted in an increment of the CBR-values of the three studied soils. Tertiary
clay has the highest CBR-values, whereas weathered soil has the lowest CBR-values. CBR-
value of lime-stabilized tertiary clay increased with an increase in the lime content continually
(2 and 4% above the optimum lime content). Another behavior of both the organic silt and the
weathered soil was obtained, in which case the CBR-values increased at 2% above the
optimum lime content. CBR-values, at 4% above the optimum, decreased slightly in the case
of weathered soil and were not changed in the case of organic silt. CBR-gain factors (due to
the addition of the optimum lime content) of tertiary clay, organic silt, and weathered soil are
13.1, 5.25, and 3.17, respectively. The final consistency (quality) of the mixtures is excellent,
good, and fair, respectively.
* In the case of fly ash-stabilization process, the addition of fly ash led to an increase in the
CBR-values for the three tested soils. CBR-values of both the organic silt and the weathered
)CBR(ing Ratio California Bear: Results4 67
soil increased with an increase in the fly ash content. CBR-values of tertiary clay increased
with the increase in fly ash content from 8 to 20%. Above 20% fly ash (for example 25%),
the CBR-values decreased. Similar behavior was observed at qu-measurement. The CBR-gain
factors of fly ash-organic silt mixtures are slightly higher than the CBR-gain factors of fly
ash-tertiary clay mixtures, at the same fly ash contents.
* In the case of lime/fly ash-stabilization process, the addition of lime and fly ash together
increased the CBR-values of the three tested soils strongly compared to the addition of lime
and fly ash separately. Lime/fly ash-tertiary clay mixtures have CBR-gain factors higher than
lime/fly ash-organic silt and –weathered soil mixtures. The optimum ratio of lime to fly ash is
0.16 in case of the tertiary clay and 0.15 in case of the organic silt (about 1 lime : 6 fly ash)
and is 0.14 (about 1 lime : 7 fly ash) in case of the weathered soil.
* CBR-values and CBR-gain factors of both the fly ash- and the lime/fly ash-mixtures, for the
three tested soils, were improved and increased through the long-term curing. The influence
of curing time was strong on the lime/fly ash-stabilization process compared to the fly ash-
stabilization process, especially in case of the tertiary clay where the increase of CBR-value
and CBR-gain factors was dramatic. The effect of curing time on the fly ash- and lime/fly
ash-stabilization process in the case of weathered soil was weaker than the effect in the case
of both tertiary clay and organic silt.

)tσ(Indirect tensile strength : Results5 68
5 Results: Indirect tensile strength (σt) Tensile strength is a very important geotechnical parameter to predict the cracking
behavior of pavements, earth dams, and earth structures using stabilized soils (Baghdadi et al.,
1995). Baghdadi et al. (1995) investigated the split tensile and the unconfined compressive
strength of the dune sand specimens treated with 50 and 100% cement kiln dust, (CKD by-
product) and cured for seven days at 10, 25, and 40°C temperature levels. They reported that
both the tensile and the compressive strengths increased with an increase in the curing
temperatures and the ratio of split tensile strength to unconfined compressive strength varied
from 0.035 for specimens cured at 10°C to 0.13 for specimens cured at 40°C. Thompson
(1966) reported similar results where the tensile strength to unconfined compressive strength
ratio was approximately 0.13 for lime stabilized soils. Consoli et al. (2001) studied both
unconfined compressive and tensile strengths for the stabilized soil (derived from weathered
sandstone) treated with carbide lime and fly ash. They reported that both tensile strength and
unconfined compressive strength increased through curing time (7, 28, 90, and 180 days) and
the ratio of tensile to compressive strength increased with long-term curing but with different
rates.
In the present study, split tensile strength test (Indirect tensile test) was conducted to
characterize the tensile strength and the cracking behavior of the stabilized soils treated with
lime, fly ash, and lime/fly ash. The test was carried out on cylindrical specimens (100 mm
height * 100 mm diameter). Indirect tensile test procedures and the preparation of the
specimens were performed according to the procedures in chapter 2.4.3 and 2.5, respectively.
5.1 Indirect tensile strength of treated stabilized soils
Tensile strength-values (σt-values) of soil-lime, soil-fly ash, and soil-lime/fly ash mixtures
prepared at optimum water content are given in Tables 5.1, 5.2, and 5.3, respectively (see
Appendixes 19, 20, & 21). Split tensile strength was measured after 7 days curing and after
conduction of the p-wave velocity (Vp) test for the three different studied soils.
Soil-lime mixtures of the three studied soils were prepared at the optimum lime content, 2,
and 4% above the optimum lime content. All the mixtures were compacted at optimum water
content and cured for 7 days (see chapter 2.5.1). The values of tensile strength are illustrated
in Tables 5.1, 5.2, & 5.3 and in Figure 5.1 a.
Soil-fly ash mixtures were prepared at 8, 12, 16, 20, and 25% fly ash for both the tertiary
clay and the organic silt and at 8, 12, 16, 20, 25, and 35% fly ash for the weathered soil.
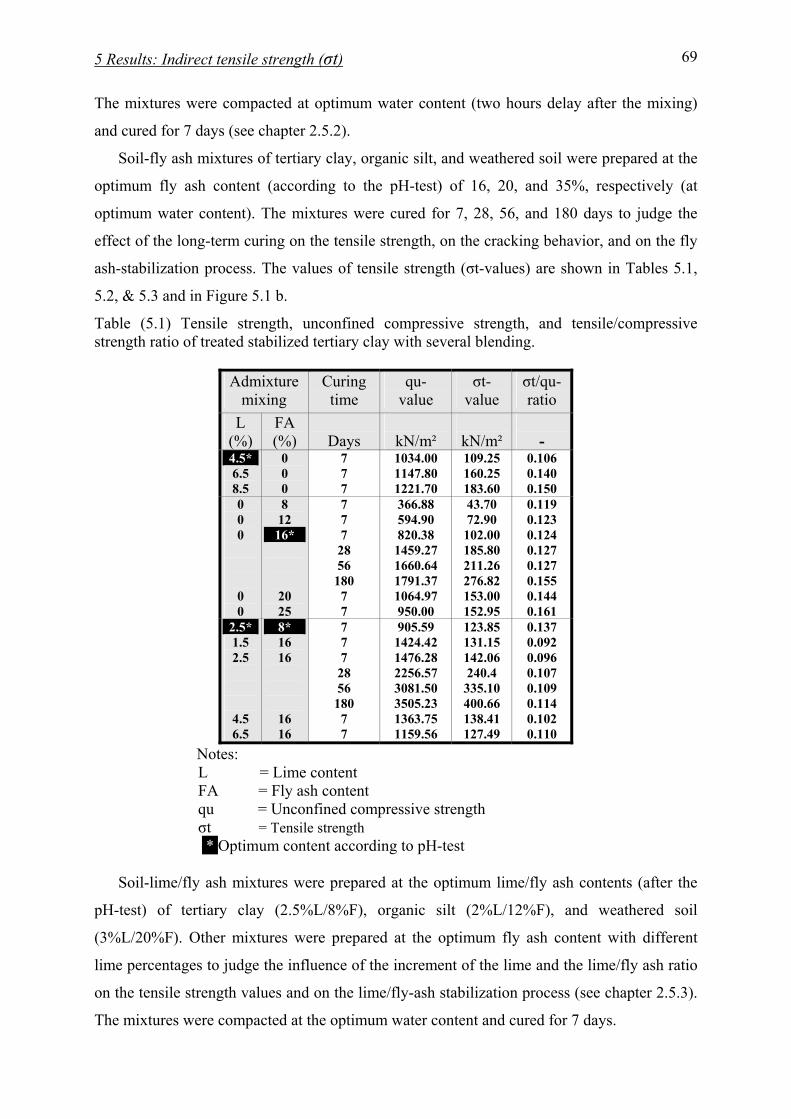
)tσ(Indirect tensile strength : Results5 69
The mixtures were compacted at optimum water content (two hours delay after the mixing)
and cured for 7 days (see chapter 2.5.2).
Soil-fly ash mixtures of tertiary clay, organic silt, and weathered soil were prepared at the
optimum fly ash content (according to the pH-test) of 16, 20, and 35%, respectively (at
optimum water content). The mixtures were cured for 7, 28, 56, and 180 days to judge the
effect of the long-term curing on the tensile strength, on the cracking behavior, and on the fly
ash-stabilization process. The values of tensile strength (σt-values) are shown in Tables 5.1,
5.2, & 5.3 and in Figure 5.1 b.
Table (5.1) Tensile strength, unconfined compressive strength, and tensile/compressive strength ratio of treated stabilized tertiary clay with several blending.
Admixture
mixing Curing
time qu-
value σt-
value σt/qu- ratio
L (%)
FA (%)
Days
kN/m²
kN/m²
-
4.5* 6.5 8.5
0 0 0
7 7 7
1034.00 1147.80 1221.70
109.25 160.25 183.60
0.106 0.140 0.150
0 0 0
0 0
8 12 16* 20 25
7 7 7
28 56 180 7 7
366.88 594.90 820.38
1459.27 1660.64 1791.37 1064.97 950.00
43.70 72.90 102.00 185.80 211.26 276.82 153.00 152.95
0.119 0.123 0.124 0.127 0.127 0.155 0.144 0.161
2.5* 1.5 2.5 4.5 6.5
8* 16 16 16 16
7 7 7
28 56 180 7 7
905.59 1424.42 1476.28 2256.57 3081.50 3505.23 1363.75 1159.56
123.85 131.15 142.06 240.4 335.10 400.66 138.41 127.49
0.137 0.092 0.096 0.107 0.109 0.114 0.102 0.110
Notes: L = Lime content FA = Fly ash content qu = Unconfined compressive strength σt = Tensile strength
test-Optimum content according to pH * Soil-lime/fly ash mixtures were prepared at the optimum lime/fly ash contents (after the
pH-test) of tertiary clay (2.5%L/8%F), organic silt (2%L/12%F), and weathered soil
(3%L/20%F). Other mixtures were prepared at the optimum fly ash content with different
lime percentages to judge the influence of the increment of the lime and the lime/fly ash ratio
on the tensile strength values and on the lime/fly-ash stabilization process (see chapter 2.5.3).
The mixtures were compacted at the optimum water content and cured for 7 days.

)tσ(Indirect tensile strength : Results5 70
Table (5.2) Tensile strength, unconfined compressive strength, and tensile/compressive strength ratio of treated stabilized organic silt with several blending.
Admixture mixing
Curing time
qu- value
σt- value
σt/qu- ratio
L (%)
FA (%)
Days
kN/m²
kN/m²
-
3* 5 7
0 0 0
7 7 7
439.49 634.40 628.03
87.40 109.30 101.95
0.199 0.172 0.162
0 0 0 0
0
8 12 16 20* 25
7 7 7 7
28 56 180 7
322.29 532.48 620.38 685.35
1331.26 1385.55 1738.98 964.33
37.90 58.30 72.85 76.49 153.00 167.55 254.97 109.27
0.118 0.110 0.117 0.112 0.115 0.121 0.147 0.113
2* 2
3 5
12* 20 20 20
7 7
28 56 180 7 7
729.65 866.43
1348.78 1648.44 2148.35 871.88 796.11
65.55 80.13 152.98 189.41 258.61 83.78 72.90
0.090 0.092 0.113 0.115 0.120 0.096 0.092
Table (5.3) Tensile strength, unconfined compressive strength, and tensile/compressive strength ratio of treated stabilized weathered soil with several blending.
Admixture mixing
Curing time
qu- value
σt- value
σt/qu- ratio
L (%)
FA (%)
Days
kN/m²
kN/m²
-
5* 7 9
0 0 0
7 7 7
309.55 329.90 298.09
47.35 50.95 40.05
0.153 0.154 0.134
0 0 0 0 0 0
8 12 16 20 25 35*
7 7 7 7 7 7
28 56 180
294.27 301.54 335.50 389.81 526.12 938.85
1151.07 1184.21 1412.79
36.40 40.04 50.95 69.20 72.90 110.75 138.41 152.98 182.12
0.124 0.133 0.152 0.178 0.138 0.118 0.120 0.129 0.129
3* 3
5 7 8
20* 35 35 35 35
7 7
28 56 180 7 7 7
713.39 1327.30 1619.81 1751.11 2297.16 1421.54 1416.49 1376.68
109.30 116.56 145.70 160.27 236.80 182.10 174.80 149.34
0.153 0.088 0.090 0.092 0.103 0.128 0.123 0.109
)tσ(Indirect tensile strength : Results5 71
Soil-lime/fly ash mixtures (prepared at the optimum fly ash content with small percent
of lime) of tertiary clay (2.5%L/16%F), organic silt (2%L/20%F), and weathered soil
(3%L/35%F) were prepared at the optimum water content and cured for 7, 28, 56, and 180
days to estimate the effect of long-term curing on the tensile strength, on the cracking
behavior, and on the lime/fly ash-stabilization process. The values of tensile strength are
illustrated in Tables 5.1, 5.2, & 5.3 and in Figures 5.1 c, 5.2, 5.3, & 5.4.
5.1.1 General effect of lime-, fly ash-, and lime/fly ash-stabilization process
The general influence of lime-, fly ash-, and lime/fly ash-stabilization on the three
different studied soils is illustrated in Figures 5.1 a, b, and c, respectively. The addition of the
optimum lime content resulted in an increment of the tensile strengths for the three tested
soils. Lime-tertiary clay mixtures have the highest tensile strength values and lime-weathered
soil mixtures have the lowest values. The reactivity of tertiary clay with lime is stronger than
the reactivity of both organic silt and weathered soil. In case of the tertiary clay, the σt-values
increased with an increase in the lime content (2 and 4% above the optimum lime content).
The reactivity of both the organic silt and the weathered soil with lime are weak, according to
the reactivity test (see chapter 2.5.1). Organic silt-lime mixtures have tensile strength values
relatively higher than the values of weathered soil-lime mixtures. The tensile strengths for
both the organic silt- and the weathered soil-lime mixtures increased with an increase in the
lime content (2% above the optimum lime content) and decreased with continual increase in
the lime content, 4% above the optimum lime content (see Fig. 5.1 a). The ratio of tensile
strength to unconfined compressive strength of lime stabilized-tertiary clay, -organic silt, and
-weathered soil (at the optimum lime content) is 0.106, 0.199, and 0.153, respectively.
The addition of fly ash contents to the three tested soils led to an increase in the tensile
strengths. Fly ash-tertiary clay mixtures have the highest tensile strength values and fly ash-
weathered soil mixtures have the lowest values, at the same fly ash contents. The tensile
strength values increased with increasing fly ash content from 8 to 20%. Above the 20% fly
ash, for example 25%, the tensile strength values decreased. Similar behavior was observed at
the measurement of unconfined compressive strength and California bearing ratio (see chapter
3.4.1 and 4.2.1).
Tensile strength values of both the fly ash-organic silt and the -weathered soil mixtures
are lower than the σt-values of fly ash-tertiary clay mixtures, at the same fly ash contents. Fly
ash-stabilized organic silt has tensile strength values relatively higher than fly ash-stabilized
weathered soil, at the same fly ash contents. The tensile strength values of both the organic

)tσ(Indirect tensile strength : Results5 72
silt and the weathered soil increased with increasing the fly ash content (see Fig. 5.1 b). The
ratio of tensile strength to unconfined compressive strength of fly ash stabilized-tertiary clay,
-organic silt, and -weathered soil (at the optimum fly ash content) is 0.124, 0.112, and 0.118,
respectively.
The addition of lime and fly ash together to the three tested soils led to a strong increase in
the tensile strength values compared to the addition of lime and fly ash separately. Tertiary
clay-optimum lime/fly ash mixtures have tensile strength values higher than the values of
both the weathered soil- and the organic silt-optimum lime/fly ash mixtures. The ratio of
tensile strength to unconfined compressive strength of optimum lime/fly ash stabilized-
tertiary clay, -organic silt, and -weathered soil is 0.137, 0.090, and 0.153, respectively.
The addition of optimum fly ash with different percentages of lime contributed to
increasing tensile strength values of the stabilized soils. Lime/fly ash-stabilized weathered soil
has tensile strength values higher than the tensile strength values of both the tertiary clay and
the organic silt at the optimum lime/fly ash ratio. Organic silt-lime/fly ash mixtures have the
lowest tensile strength values compared to the other two soils-lime/fly ash mixtures. With
increasing lime percentage, the tensile strength values have further increased until the ratio of
lime to fly ash equals to 0.16 in case of the tertiary clay, 0.15 in case of the organic silt
(about1 lime: 6 fly ash by weight) and 0.14 in case of the weathered soil (about 1lime: 7 fly
ash by weight). Above these ratios, the tensile strengths decreased (see Fig. 5.1 c & 5.2).
Similar behavior was noticed at both qu- and CBR-values (see chapter 3.4.1 and 4.2.1).
5.1.2 Effect of curing time
Soil-fly ash and soil-lime/fly ash mixtures for the three studied soils were prepared and
cured for the periods of 7, 28, 56, and 180 days to estimate how the long-term curing affects
the tensile strength and the cracking behavior of the stabilized soils. The tensile strength test
was performed on the specimens after carrying out of the Vp-velocity test. All the mixtures
were prepared at the optimum water content. The effect of curing time on the tensile strength
of soil-fly ash and soil-lime/fly ash mixtures is shown in Figure 5.4. The tensile strength
values of both soil-fly ash and soil-lime/fly ash mixtures, in case of the three tested soils,
increased with the long-term curing. The curing time has a stronger effect on the tensile
strength values of soil-lime/fly ash mixtures compared to soil-fly ash mixtures. The tensile
strength values of tertiary clay-optimum fly ash mixture were strongly affected by the lone-
term curing compared to the values of both the weathered soil- and the organic silt-optimum
fly ash mixtures.

)tσ(Indirect tensile strength : Results5 73
Fig. (5.1, a) Effect of lime content on tensile strength
0
20
40
60
80
100
120
140
160
180
200
2 3 4 5 6 7 8 9 10
Lime content (%)
Tens
ile s
treng
th (K
N/m
²)Tertiary clay 7 days
Organic silt 7 daysWeathered soil 7 days
Fig. (5.1, b) Effect of fly ash content on tensile strength
0
20
40
60
80
100
120
140
160
180
8 12 16 20 24 28 32 36 40Fly ash content (%)
Tens
ile s
treng
th (K
N/m
²)
Tertiary clay 7 days
Organic silt 7 days
Weathered soil 7 days

)tσ(Indirect tensile strength : Results5 74
Fig. (5.1, c) Effect of lime/fly ash content on tensile strength
6.5L/16F2.5L/16F 4.5L/16F1.5L/16F
2.5L/8F
5L/20F3L/20F2L/20F
2L/12F
8L/35F
7L/35F5L/35F
3L/20F
3L/35F
0
20
40
60
80
100
120
140
160
180
200
Lime/fly ash content (%)
Tens
ile s
treng
th (K
N/m
²)
Tertiary clay 7 days
Organic silt 7 days
Weathered soil 7 days
Fig. (5.2) Response of tensile strength to variable lime/fly ash-ratios
50
70
90
110
130
150
170
190
0.05 0.1 0.15 0.2 0.25 0.3 0.35 0.4 0.45Lime/fly ash-ratio
Tens
ile s
treng
th (K
N/m
²)
Tertiary clay 7 daysOrganic silt 7 daysWeathered soil 7 days

)tσ(Indirect tensile strength : Results5 75
The curing time has the lowest effect on the tensile strength values of weathered soil-
optimum fly ash mixtures. The tensile strength values of tertiary clay-lime/fly ash mixtures
were dramatically increased with curing time compared to both the weathered soil- and the
organic silt-lime/fly ash mixtures (see Fig. 5.4 and Tables 5.1, 5.2, & 5.3).
A B C
D E F
G H J
Fig. (5.3) Photos of different treated stabilized soils illustrate the tensile fractures after indirect tensile strength test.
A & B) Organic silt with 3% lime + 20% fly ash (7 days) before and after the test, respectively. C) Organic silt with 20% fly ash (7 days). D) Organic silt with 2% lime + 20% fly ash (180 days). E) Weathered soil with 3% lime + 35% fly ash (56 days). F) Weathered soil with 3% lime + 35% fly ash (180 days). G) Tertiary clay with 16% fly ash (56 days). H) Tertiary clay with 2.5% lime + 16% fly ash (7 days). J) Tertiary clay with 2.5%lime +16% fly ash (180 days).
)tσ(Indirect tensile strength : Results5 76
The relative relationship and mobilization between the tensile strength and compressive
strength could be discussed by plotting the tensile/compressive strength ratio (σt/qu-ratio)
versus curing time. Figure 5.5 shows the effect of curing time on σt/qu-ratio of both the fly
ash- and the lime/fly ash-stabilized soils. The average values of the ratio in case of the fly ash-
stabilized soils are higher than the average value in case of the lime/fly ash-stabilized soils.
The rate of increase of σt/qu-ratio of soil-fly ash mixtures from 7 to 28 days is smaller than
the rate of soil-lime/fly ash mixtures at the same time interval. Conversely, the rate of soil-fly
ash mixtures from 56 to 180 days is relatively larger than the rate of soil-lime/fly ash mixtures
at the same time interval, except for the weathered soil.
Fig. (5.4) Effect of curing time on tensile strength of fly ash- and lime/fly ash-stabilized soils
50
100
150
200
250
300
350
400
450
7 28 49 70 91 112 133 154 175 196
Curring time (days)
Tens
ile s
treng
th (K
N/m
²) Tertiary clay 16% F
Organic silt 20% F
Weathered soil 35% F
Tertiary clay 2.5%L/16%F
Organic silt 2%L/20%F
Weathered soil 3%L/35%F

)tσ(Indirect tensile strength : Results5 77
Fig. (5.5) Effect of curing time on tensile/compressive strength ratio of fly ash- and lime/fly ash-stabilized soils
0.080.0850.09
0.0950.1
0.1050.11
0.1150.12
0.1250.13
0.1350.14
0.1450.15
0.1550.16
7 28 49 70 91 112 133 154 175 196
Curring time (days)
Tens
ile/C
ompr
essi
ve s
treng
th ra
tio
Tertiary clay 16% F
Organic silt 20% F
Weathered soil 35% F
Tertiary clay 2.5%L/16%F
Organic silt 2%L/20%F
Weathered soil 3%L/35%F
5.2 Conclusions
* In the case of lime-stabilization process, the addition of the optimum lime content (after the
pH-method) led to an increase in the σt-values of the three tested soils. Tertiary clay has the
highest σt-values, whereas weathered soil has the lowest σt-values.
The tensile strength values of lime-stabilized tertiary clay increased with an increase in the
lime content continually (2 and 4% above the optimum lime content). Another behavior of
both lime stabilized-organic silt and -weathered soil was observed, where σt-values increased
at 2% above the optimum lime content, but at 4% above the optimum lime content, the tensile
strength values decreased slightly. Relatively, similar behavior was obtained at qu- and CBR-
values measurement.
Tensile/unconfined compressive strength ratio (σt/qu-ratio), due to the addition of the
optimum lime content, of tertiary clay, organic silt, and weathered soil is 0.106, 0.199, and
0.153, respectively.
* In the case of fly ash-stabilization process, the addition of fly ash resulted in an increase in
the σt-values for the three tested soils. The tensile strength values of both the organic silt and
the weathered soil increased with an increase in the fly ash content. The tensile strength
values of fly ash-stabilized tertiary clay increased with an increase in the fly ash content from
8 to 20%. Above the 20% fly ash (for example 25%), σt-values decreased slightly. The
tensile strength values of fly ash-organic silt mixtures are lower than the σt-values of fly ash-
)tσ(Indirect tensile strength : Results5 78
inorganic tertiary clay mixtures and higher than the σt-values of fly ash-weathered soil
mixtures, at the same fly ash contents. The σt/qu-ratio of optimum fly ash-tertiary clay, -
organic silt, and -weathered soil mixtures is 0.124, 0.112, and 0.118, respectively.
* In the case of lime/fly ash-stabilization process, the addition of lime and fly ash together
increased σt-values of the three tested soils strongly compared to the addition of lime and fly
ash separately. Optimum lime/fly ash-tertiary clay mixtures have σt-values higher than the
values of optimum lime/fly ash-organic silt and –weathered soil mixtures. The optimum ratio
of lime to fly ash is 0.16 in case of the tertiary clay and 0.15 in case of the organic silt (about
1lime: 6 fly ash) and 0.14 (about 1lime: 7 fly ash) in case of the weathered soil. At these
ratios, the maximum σt-values of lime/fly ash-soil mixtures were obtained. Similar behavior
was reported at measurement of both the qu- and the CBR-values.
* The tensile strength-values of both the fly ash- and the lime/fly ash-mixtures, for the three
tested soils, improved and increased by the long-term curing. The influence of curing time
was strong on the lime/fly ash-stabilization process compared to the influence on the fly ash-
stabilization process, especially with the tertiary clay. The effect of curing time on the σt-
values for the fly ash- and lime/fly ash-stabilized weathered soil was weaker than the effect on
σt-values of both fly ash and lime/fly ash stabilized-tertiary clay and -organic silt.
* The average values of the σt/qu-ratio in case of the fly ash-stabilized soils are higher than
the average value in case of the lime/fly ash-stabilized soils. In the case of fly ash-
stabilization, the organic silt has the lowest ratio-values and the tertiary clay has the highest
values. In the case of lime/fly ash-stabilization, the weathered soil has the lowest ratio-values
and the organic silt has the highest values.

)k(Hydraulic conductivity : Results6 79
6 Results: Hydraulic conductivity (K) One of the aims of this study is an investigation of the hydraulic conductivity for the fly
ash- and lime/fly ash-treated stabilized soils, especially with long-term curing. Previous
studies provide very limited data concerning the hydraulic conductivity (K-value) of the fly
ash and lime/fly ash-treated stabilized soils. Townsend & Kylm (1966), Brandl (1981),
Nablantoglu & Tuncer (2001), and Nablantoglue & Gucbilmez (2002) reported that the K-
value of the treated stabilized soils increased. Conversely, Terashi et al. (1980) and Locate et
al. (1996) noted a diminution of the hydraulic conductivity of the treated stabilized soils.
According to ASTM D 5239, “Standard practice for characterizing fly ash for use in soil
stabilization”, the use of self-cementing fly ash can improve the soil properties and reduce
the permeability (K-value).
Thus, the permeability of treated stabilized soils is a complex problem and needs in-depth
clarification, especially with the long-term curing.
6.1 Hydraulic conductivity of natural and untreated compacted soils
Hydraulic conductivity test according to the laboratory test of DIN 18 130-1 (see chapter
2.4.4) was conducted to characterize the permeability of both the natural and the untreated
compacted soils. The K-values of the three tested natural soils are illustrated in Table 2.7. The
K-values of natural tertiary clay, organic silt, and weathered soil are 1.9E-11, 5.5E-07, and
3.2E-11 m/sec, respectively. The permeability of tertiary clay, organic silt, and weathered soil
(according to DIN 18 130-1) was classified as very poor permeable, poor permeable, and very
poor permeable, respectively. The K-value of untreated compacted-tertiary clay, -organic silt,
and -weathered soil is 1.7E-11, 8.5E-11, and 2.8E-11, respectively. The permeability of
untreated compacted-tertiary clay, -organic silt, and -weathered soil was classified as very
poor permeable. The compaction process, without chemical additives, in case of the three
tested soils, led to an improvement of the geotechnical properties in the form of a reduction of
the permeability. The hydraulic conductivity of organic silt was strongly affected by the
compaction process (without chemical additives) compared to the permeability of both
tertiary clay and weathered soil.
6.2 Hydraulic conductivity of treated stabilized soils
Hydraulic conductivity of soil-fly ash and soil-lime/fly ash mixtures of tertiary clay,
organic silt, and weathered soil (prepared at optimum water content) are given in Tables 6.1,
6.2, and 6.3, respectively (see Appendixes 22, 23, & 24). Soil-fly ash mixtures were prepared

)k(Hydraulic conductivity : Results6 80
at the optimum fly ash contents of 16, 20, and 35% fly ash for tertiary clay, organic silt, and
weathered soil, respectively. All the mixtures were compacted at the optimum water content,
two hours delay after the mixing. The mixtures were cured for 7 days (at 25°C & 98%
humidity) to estimate the effect of fly ash addition on the K-value. Other mixtures were cured
for 28, 56, and 180 days to investigate the influence of the long term curing on the K-value.
Soil-lime/fly ash mixtures were prepared at (the optimum fly ash content with small
percentage of lime) (2.5%lime+16%fly ash), (2%lime+20%fly ash), and (3%lime+35%fly
ash) for tertiary clay, organic silt, and weathered soil, respectively. All the mixtures were
prepared at the optimum water content and cured for 7 days to evaluate the effect of lime/fly
ash addition on the K-value. Other mixtures were cured for 28, 56, and 180 days to study the
influence of the long-term curing on the K-value. The K-values of untreated compacted- and
treated stabilized- soils are showed in Tables 6.1, 6.2, & 6.3 and in Figures 6.1 a, b, & c.
Table (6.1) K-value and K-value gain factor of untreated compacted- and treated stabilized- tertiary clay.
Admixture
mixing Curing
time K-
value
K-value gain
factor L
(%)FA (%)
Days
m/sec
-
0 0 - 1.7E-11 1.00E+00 0
16*
7 28 56 180
1.1E-10 6.4E-09 4.1E-09 1.6E-09
6.47E+00 2.72E+02 2.41E+02 9.46E+01
2.5
16
7 28 56 180
1.5E-10 2.6E-09 5.5E-10 5.2E-10
8.82E+02 1.53E+02 3.24E+01 3.06E+01
Notes: L = Lime content FA = Fly ash content
K-value = Hydraulic conductivity K-value gain factor = K-value of treated stabilized soil/ K-value of untreated compacted soil
test-Optimum content according to pH *

)k(Hydraulic conductivity : Results6 81
Table (6.2) K-value and K-value gain factor of untreated compacted- and treated stabilized- organic silt.
Admixture mixing
Curing time
K- value
K-value gain
factor L
(%)FA (%)
Days
m/sec
-
0 0 - 8.5E-11 1.00E+00 0
20*
7 28 56 180
2.4E-09 5.7E-09 3.8E-09 1.3E-09
2.82E+016.71E+014.47E+011.53E+01
2
20
7 28 56 180
5.1E-08 1.8E-07 4.3E-08 1.8E-08
6.00E+02 7.12E+02 5.06E+02 2.10E+02
Table (6.3) K-value and K-value gain factor of untreated compacted- and treated stabilized- weathered soil.
Admixture mixing
Curing time
K- value
K-value gain
factor L
(%)FA (%)
Days
m/sec
-
0 0 - 2.8E-11 1.00E+000
35*
7 28 56 180
2.2E-07 1.0E-07 3.7E-08 2.0E-08
2.60E+03 1.59E+03 1.30E+03 7.14E+02
3
35
7 28 56 180
1.8E-09 4.1E-08 4.1E-09 2.6E-09
6.40E+011.50E+031.50E+029.29E+01
6.2.1 General effect of fly ash- and lime/fly ash-stabilization process
The general influence of fly ash- and lime/fly ash-stabilization process on the hydraulic
conductivity (K-value) of tertiary clay, organic silt, and weathered soil is shown in Figures
6.1 a, b, and c, respectively. The addition of fly ash increased the K-value of the three tested
soil compared to the untreated compacted soils. The K-value gain factor (after 7 days curing)
of tertiary clay, organic silt, and weathered soil is 6.47E+00, 2.82E+01, and 2.60E+03,
respectively (see Fig. 6.2 a, b, & c). Tertiary clay-fly ash mixture has the lowest K-value gain
factor and weathered soil-fly ash mixture has the highest K-value gain factor.
)k(Hydraulic conductivity : Results6 82
The permeability of fly ash stabilized-tertiary clay, -organic silt, and -weathered soil was
classified (according to DIN 18 130-1) as very poor, very poor, and poor permeable,
respectively. Addition of lime and fly ash together has shown an increase in the K-value for
the three tested soils compared to the untreated compacted soils. The K-value gain factor
(after 7 days curing) of tertiary clay, organic silt, and weathered soil is 8.827E+02, 6.00E+02,
and 6.40E+01, respectively. Weathered soil-lime/fly ash mixture has the lowest K-value gain
factor and tertiary clay-lime/fly ash mixture has the highest K-value gain factor. The
permeability of lime/fly ash stabilized-tertiary clay, -organic silt, and -weathered soil was
classified (according to DIN 18 130-1) as very poor, poor, and very poor permeable
respectively.
6.2.2 Effect of curing time
The K-value and the K-value gain factor of soil-fly ash and soil-lime/fly ash mixtures for
the three tested soils increased strongly from 7 days to 28 days curing time, except for
weathered soil-fly ash mixtures. With an increase in the curing time (56 and 180 days), the K-
values and the K-value gain factors of the three tested stabilized soils decreased (see Tables
6.1, 6.2, & 6.3, Fig. 6.1 a, b, & c, and Fig. 6.2 a, b, & c in Appendixes 25, 26, & 27,
respectively).
Fig. (6.1, a) Effect of curing time on the hydraulic conductivity (K-value) of fly ash- and lime/fly ash-stabilized tertiary clay
2,0E-11
5,0E-09
1,0E-08
1,5E-08
0 14 28 42 56 70 84 98 112 126 140 154 168 182
Curing time (days)
K-v
alue
(m/s
ec)
16% Fly ash2.5%L/16%FUntreated compacted
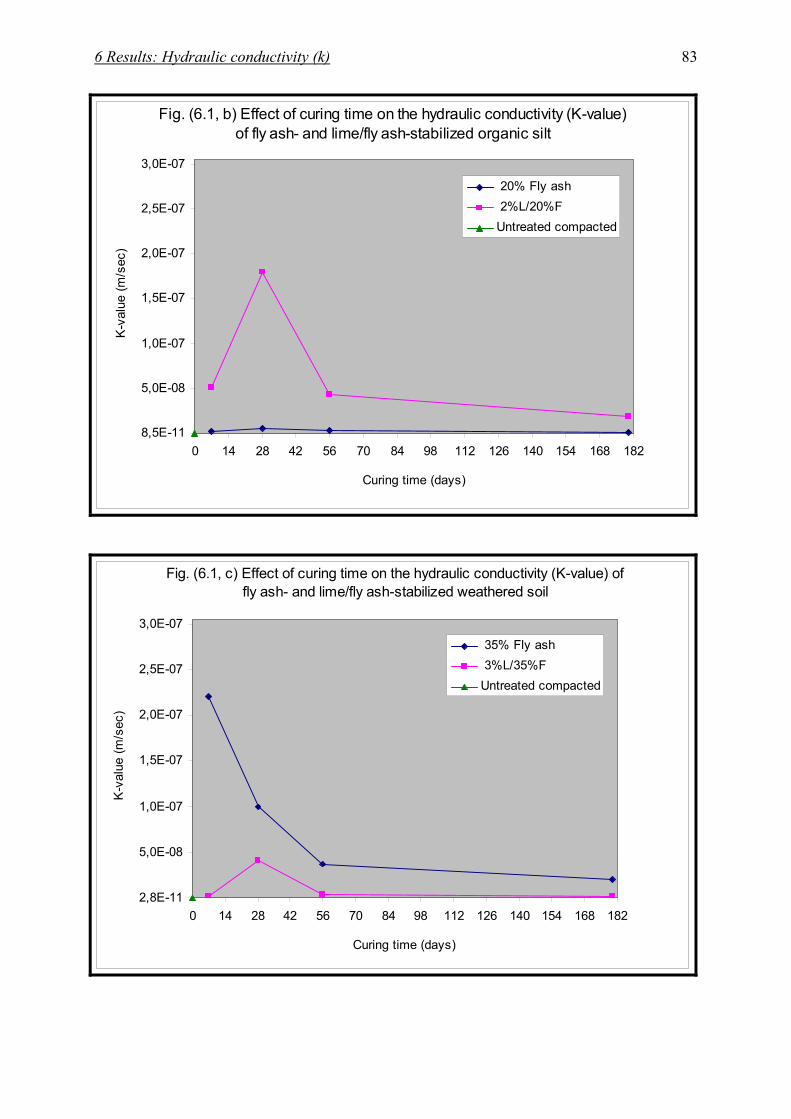
)k(Hydraulic conductivity : Results6 83
Fig. (6.1, b) Effect of curing time on the hydraulic conductivity (K-value) of fly ash- and lime/fly ash-stabilized organic silt
8,5E-11
5,0E-08
1,0E-07
1,5E-07
2,0E-07
2,5E-07
3,0E-07
0 14 28 42 56 70 84 98 112 126 140 154 168 182
Curing time (days)
K-v
alue
(m/s
ec)
20% Fly ash 2%L/20%FUntreated compacted
Fig. (6.1, c) Effect of curing time on the hydraulic conductivity (K-value) of fly ash- and lime/fly ash-stabilized weathered soil
2,8E-11
5,0E-08
1,0E-07
1,5E-07
2,0E-07
2,5E-07
3,0E-07
0 14 28 42 56 70 84 98 112 126 140 154 168 182
Curing time (days)
K-v
alue
(m/s
ec)
35% Fly ash 3%L/35%FUntreated compacted
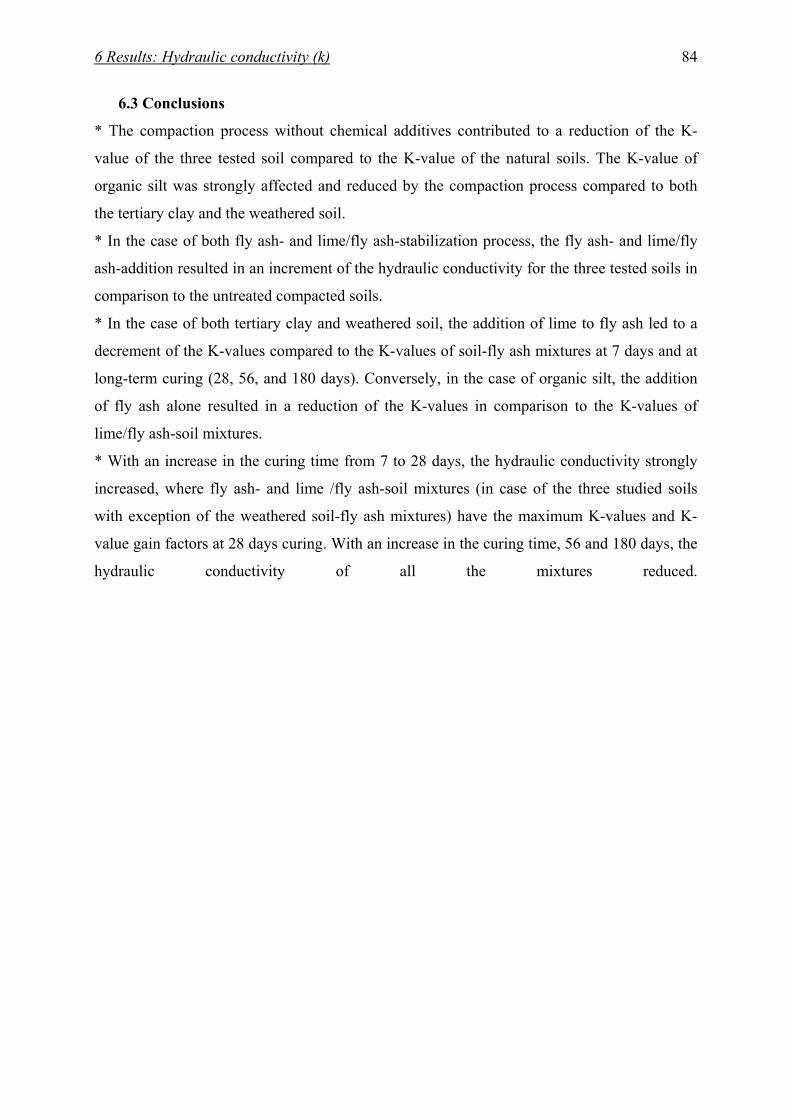
)k(Hydraulic conductivity : Results6 84
6.3 Conclusions
* The compaction process without chemical additives contributed to a reduction of the K-
value of the three tested soil compared to the K-value of the natural soils. The K-value of
organic silt was strongly affected and reduced by the compaction process compared to both
the tertiary clay and the weathered soil.
* In the case of both fly ash- and lime/fly ash-stabilization process, the fly ash- and lime/fly
ash-addition resulted in an increment of the hydraulic conductivity for the three tested soils in
comparison to the untreated compacted soils.
* In the case of both tertiary clay and weathered soil, the addition of lime to fly ash led to a
decrement of the K-values compared to the K-values of soil-fly ash mixtures at 7 days and at
long-term curing (28, 56, and 180 days). Conversely, in the case of organic silt, the addition
of fly ash alone resulted in a reduction of the K-values in comparison to the K-values of
lime/fly ash-soil mixtures.
* With an increase in the curing time from 7 to 28 days, the hydraulic conductivity strongly
increased, where fly ash- and lime /fly ash-soil mixtures (in case of the three studied soils
with exception of the weathered soil-fly ash mixtures) have the maximum K-values and K-
value gain factors at 28 days curing. With an increase in the curing time, 56 and 180 days, the
hydraulic conductivity of all the mixtures reduced.

)Vp(waves -Velocity of ultrasonic p: Results7 85
7 Results: Velocity of ultrasonic p-waves (Vp) Chemical stabilization is used to improve the engineering properties and behavior of soils
and similar materials, such as fly ash. Stabilization applications generally involve laboratory
determination of the type and the required amount of stabilizing agent and verification of the
quality of the resulting stabilized mixture on a field scale (Yesiller et al., 2001). There are two
types of methods to evaluate these materials. The first type is destructive test methods, such
as unconfined compression strength-, CBR-tests, etc, which are commonly used to determine
the geotechnical properties and the mechanical behavior of these materials. The second type is
non-destructive test methods, such as ultrasonic testing (in the laboratory). This method
(ultrasonic testing) has not been used extensively to date for chemical stabilization
applications (ASTM, 1992) & (AASHTO, 1997). Non-destructive test methods, such as
ultrasonic testing, can provide a fast and simple alternative approach for analyzing stabilized
mixtures (Yesiller et al., 2001). On one hand, steel and concrete are commonly evaluated
using ultrasonic testing in civil engineering applications, where established procedures and
standards are available for ultrasonic evaluation of these materials (Mclntire, 1991). On the
other hand, use of the ultrasonic testing to evaluate the stabilized soils and the similar
materials is relatively limited. Ultrasonic velocity tests were conducted to evaluate the
mixtures with lime, fly ash and lime/fly ash and to determine the variation and the correlation
of the velocity with the type of stabilizing agent, unconfined compression strength, elasticity
modulus, California bearing ratio, and tensile strength, also to make a correlation between the
variation of the velocity and the variation of both qu- and Esecant-values with the curing time.
The test procedures and the preparation of the specimens were achieved according to the
procedures in chapter 2.4.5 and 2.5, respectively.
7.1 Vp of natural and untreated compacted soils
P-wave velocities (Vp-values) of the three natural and untreated compacted soils (at
optimum water content) are given in Table 2.7 and Appendixes 28, 29, & 30. Ultrasonic Vp-
velocities were measured for untreated compacted specimens of tertiary clay, organic silt, and
weathered soil (before the performance of unconfined compressive strength tests). All the
compacted specimens were prepared using a standard proctor test. Vp-value of natural tertiary
clay, organic silt, and weathered soil is 643, 424, and 700 m/sec, respectively. Vp-values of
untreated compacted soil specimens (without chemical additives) of tertiary clay, organic silt
and weathered soil (compacted at optimum water content) are 667, 465, and 721 m/sec,
respectively (see chapter 2, Table 2.7, and Appendixes 28, 29, & 30).

)Vp(waves -Velocity of ultrasonic p: Results7 86
7.2 Vp of treated stabilized soils
P-wave velocities (Vp-values) of soil-lime, soil-fly ash, and soil-lime/fly ash mixtures (for
the three tested soils) prepared at optimum water content are given in Tables 7.1, 7.2, and 7.3.
The Vp-values of specimens for the three tested soils were measured (after 7 days curing)
before the performance of both the unconfined compressive and the tensile strength tests.
Soil-lime mixtures of the three tested soils were prepared at the optimum lime content, 2%
and 4% above the optimum lime content (compacted at optimum water content) and cured for
7 days (see chapter 2.5.1). For each mixture, average velocity of the specimens was measured.
The values of Vp are illustrated in Tables 7.1, 7.2, & 7.3 and Figures 7.1 a & 7.2.
Soil-fly ash mixtures were prepared at 8, 12, 16, 20, and 25% fly ash for both the tertiary
clay and the organic silt and at 8, 12, 16, 20, 25, and 35% fly ash for the weathered soil. All
the mixtures were compacted at optimum water content (two hours delay after the mixing)
and cured for 7 days (see chapter 2.5.2).
Table (7.1) P-wave velocity (Vps) and Vps/Vpu ratio (Vp-gain factor) of treated stabilized tertiary clay with several blending.
Admixture mixing
Curing
time
Vps
Vps/Vpu Ratio
(Vp-gain factor)
L (%)
FA (%)
Days
m/sec
-
4.5* 6.5 8.5
0 0 0
7 7 7
1418 1569 1600
2.13 2.35 2.40
0 0 0
0 0
8 12
16*
20 25
7 7 7
28 56
180 7 7
1039 1215 1309 1513 1536 1600 1537 1485
1.56 1.82 1.96 2.27 2.30 2.39 2.30 2.23
2.5* 1.5 2.5
4.5 6.5
8* 16 16
16 16
7 7 7
28 56
180 7 7
1314 1491 1496 1655 1786 1875 1435 1371
1.97 2.23 2.24 2.48 2.68 2.81 2.15 2.10
Notes: Vps = P-wave velocity of stabilized soil (m/sec) Vpu = P-waves velocity of untreated compacted soil (m/sec) Vps /Vpu = Velocity gain factor (Vp-gain factor) * Optimum content according to pH-test

)Vp(waves -Velocity of ultrasonic p: Results7 87
Table (7.2) P-wave velocity (Vps) and Vps/Vpu ratio (Vp-gain factor) of treated stabilized organic silt with several blending.
Admixture
mixing
Curing
time
Vps
Vps/Vpu Ratio
(Vp-gain factor)
L (%)
FA (%)
Days
m/sec
-
3* 5 7
0 0 0
7 7 7
852 961 917
1.83 2.10 1.97
0 0 0 0
0
8 12 16
20*
25
7 7 7 7
28 56
180 7
781 876 953 1011 1228 1297 1420 1098
1.68 1.88 2.05 2.18 2.64 2.79 3.10 2.36
2* 2
3 5
12* 20
20 20
7 7
28 56
180 7 7
929 991 1178 1342 1434 1013 949
2.00 2.13 2.53 2.89 3.10 2.18 2.04
Table (7.3) P-wave velocity (Vps) and Vps/Vpu ratio (Vp-gain factor) of treated stabilized weathered soil with several blending.
Admixture
mixing
Curing
time
Vps
Vps/Vpu Ratio
(Vp-gain factor)
L (%)
FA (%)
Days
m/sec
-
5* 7 9
0 0 0
7 7 7
882 1034 1000
1.22 1.43 1.39
0 0 0 0 0 0
8 12 16 20 25
35*
7 7 7 7 7 7
28 56
180
979 1018 1020 1021 1147 1236 1367 1371 1439
1.36 1.41 1.41 1.42 1.59 1.71 1.89 1.90 2.00
3* 3
5 7 8
20* 35
35 35 35
7 7
28 56
180 7 7 7
1297 1368 1402 1453 1622 1392 1382 1370
1.80 1.90 1.94 2.01 2.25 1.93 1.92 1.90

)Vp(waves -Velocity of ultrasonic p: Results7 88
Soil-fly ash mixtures of tertiary clay, organic silt, and weathered soil were prepared at the
optimum fly ash content of 16, 20, and 35%, respectively (at optimum water content) and
cured for 28, 56, and 180 days to judge the variation of Vp-value with curing time. The values
of Vp, for the three different tested soils, are illustrated in Tables 7.1, 7.2, & 7.3, and in
Figures 7.1 b, 7.2, & 7.4.
Soil-lime/fly ash mixtures were prepared at the optimum lime/fly ash contents, according
to pH- test, of (2.5%L/8%F), (2%L/12%F), and (3%L/20%F) for tertiary clay, organic silt,
and weathered soil, respectively. Other mixtures were prepared at the optimum fly ash content
with different lime contents to evaluate the influence of the increase in the lime and the
lime/fly ash ratio on the Vp-value of the stabilized soils and on the lime/fly ash-stabilization
process (see chapter 2.5.3). All the mixtures were compacted at the optimum water content
and cured for 7 days.
Other soil-lime/fly ash mixtures of tertiary clay, organic silt, and weathered soil were
prepared at the optimum fly ash content with small percent of lime (at optimum water
content) and cured for 7, 28, 56, and 180 days to estimate the effect of long-term curing on
the Vp-value and on the lime/fly ash-stabilization process. The values of Vp are shown in
Tables 7.1, 7.2, & 7.3 and in Figures 7.1 c, 7.2, 7.3, & 7.4.
7.2.1 General effect of lime-, fly ash- and lime/fly ash-stabilization process
The general effect of lime-, fly ash- and lime/fly ash-stabilization process on the Vp-
values of the three tested soils is illustrated in Figures 7.1 a, b, and c, respectively. Addition of
optimum lime content resulted in an increase in the Vp-values and -gain factors for the three
tested soils. Lime-tertiary clay mixtures have the highest Vp-gain factors and lime-weathered
soil mixtures have the lowest Vp-gain factors. The reactivity of tertiary clay with lime is
strong and the Vp-gain factor increased with an increase in lime content (2 and 4% above the
optimum lime content). The reactivity of both the organic silt and the weathered soil with
lime is weak. Although Vp-values of lime-weathered soil mixtures are higher than the values
of lime-organic silt mixtures, the lime-organic silt mixtures have higher Vp-gain factors
compared to the factors of lime-weathered soil mixtures, since the Vpu-value of weathered
soil is higher than the Vpu-value of organic silt. Vp-values and -gain factors of both the
organic silt and the weathered soil increased with an increase in the lime content (2% above
the optimum lime content) and decreased with the continual increase in the lime content (4%
above the optimum).

)Vp(waves -Velocity of ultrasonic p: Results7 89
Similar behavior was observed during the measurement of unconfined compressive
strength-, CBR-, and tensile strength-values (see Fig. 7.1 a).
The ratio of Vp-value of lime-, fly ash-, and lime/fly ash-stabilized soil (Vps) to that of
untreated compacted soil (Vpu) is known as the Vp-gain factor (see Fig. 7.2). Vps/Vpu-ratio
(Vp-gain factor), due to the addition of optimum lime content, of tertiary clay, organic silt,
and weathered soil is 2.13, 1.83, and 1.22%, respectively.
The addition of fly ash content contributed to an increase in the Vps-values for the three
tested soils. Fly ash-tertiary clay mixtures have the highest Vps-values and fly ash-organic silt
mixtures have the lowest values, at the same fly ash contents. Vps-values of organic silt- and
weathered soil-mixtures increased with increase in the fly ash content.
Fig. (7.1, a) P-wave velocity (Vp-value) of untreated compacted- and treated stabilized- soils with lime
0
200
400
600
800
1000
1200
1400
1600
1800
0 1 2 3 4 5 6 7 8 9 10Lime content (%)
Vp-
valu
e (m
/sec
)
Tertiary clay 7 daysWeathered soil 7 days Organic silt 7 days
The Vps-values of tertiary clay increased with increasing the fly ash content until 20% fly
ash. Above 20% (i.e. 25%), the Vps-value slightly decreased. Relatively, similar behavior was
obtained at the unconfined compressive strength-, the CBR-, and the tensile strength-
measurements. Although, Vps-values of both fly ash-tertiary clay and –weathered soil
mixtures are higher than the Vps-values of fly ash-organic silt mixtures, the gain factors of fly
ash-organic silt mixtures are the highest factors. Because the organic silt has low Vpu-value
(465 m/sec) compared to both the tertiary clay and the weathered soil which have a high Vpu-
value (equal to 667 and 721 m/sec, respectively).

)Vp(waves -Velocity of ultrasonic p: Results7 90
Fig. (7.1, b) P-wave velocity (Vp-value) of untreated compacted- and treated stabilized- soils with fly ash
200
400
600
800
1000
1200
1400
1600
1800
0 4 8 12 16 20 24 28 32 36 40Fly ash content (%)
Vp-
valu
e (m
/sec
)
Tertiary clay 7 daysOrganic silt 7 daysWeathered soil 7 days
Fig. (7.1, c) P-wave velocity (Vp-value) of untreated compacted- and treated stabilized- soils with lime/fly ash
6.5L/16F
0L/0F
2.5L/8F
1.5L/16F 4.5L/16F2.5L/16F
2L/12F
0F/0L
2L/20F
3L/20F
5L/20F
8L/35F
0L/0F
3L/20F3L/35F 5L/35F 7L/35F
0
200
400
600
800
1000
1200
1400
1600
Lime/fly ash content (%)
Vp-
valu
e (m
/sec
)
Tertiary clay 7 daysOrganic silt 7 daysWeatherd soil 7 days

)Vp(waves -Velocity of ultrasonic p: Results7 91
Fly ash-tertiary clay mixtures have Vp-gain factors relatively higher than that of fly ash-
weathered soil mixtures, at the same fly ash contents. The Vp-gain factor (due to the addition
of the optimum fly ash content) of organic silt, tertiary clay, and weathered soil is 2.18, 1.96,
and 1.71, respectively (see Fig. 7.2).
The addition of lime/fly ash to the three tested soils resulted in an increment of Vp-values
and Vp-gain factors. Lime/fly ash-stabilized tertiary clay has the Vp-values and the Vp-gain
factors higher than both lime/fly ash stabilized-weathered soil and -organic silt. The reactivity
of the tertiary clay with lime/fly ash is relatively stronger than the reactivity of the weathered
soil and the organic silt. Lime/fly ash-stabilized weathered soil has the lowest Vp-gain
factors. Although, the Vp-values of lime/fly ash-organic silt mixtures are lower than the Vp-
values of lime/fly ash-weathered soil mixtures, the organic silt has higher Vp-gain factors
since Vpu of the organic silt is lower than Vpu of the weathered soil. The Vp-gain factor (due
to the addition of the optimum lime/fly ash content) of tertiary clay, organic silt and the
weathered soil is 1.97, 2.00, and 1.80, respectively. The Vp-gain factor (due to the addition of
the optimum fly ash with small percentage of lime) of tertiary clay (2.5%L/16%F), organic
silt (2%L/20%F), and weathered soil (3%L/35%F) is 2.24, 2.13, and 1.90, respectively (see
Fig. 7.2).
Fig. (7.2) Vp-gain factors of untreated compacted- and treated stabilized-soils
0.5
0.7
0.9
1.1
1.3
1.5
1.7
1.9
2.1
2.3
2.5
T.clay O.silt W.soilMixtures
Vp-g
ain
fact
or
Optimum limecontent
Optimum fly ashcontent
Optimumlime/fly ashcontentLime/optimumfly ash content
Untreated,compacted
2.5%L/ 16%F
2%L/ 20%F
3%L/35%F
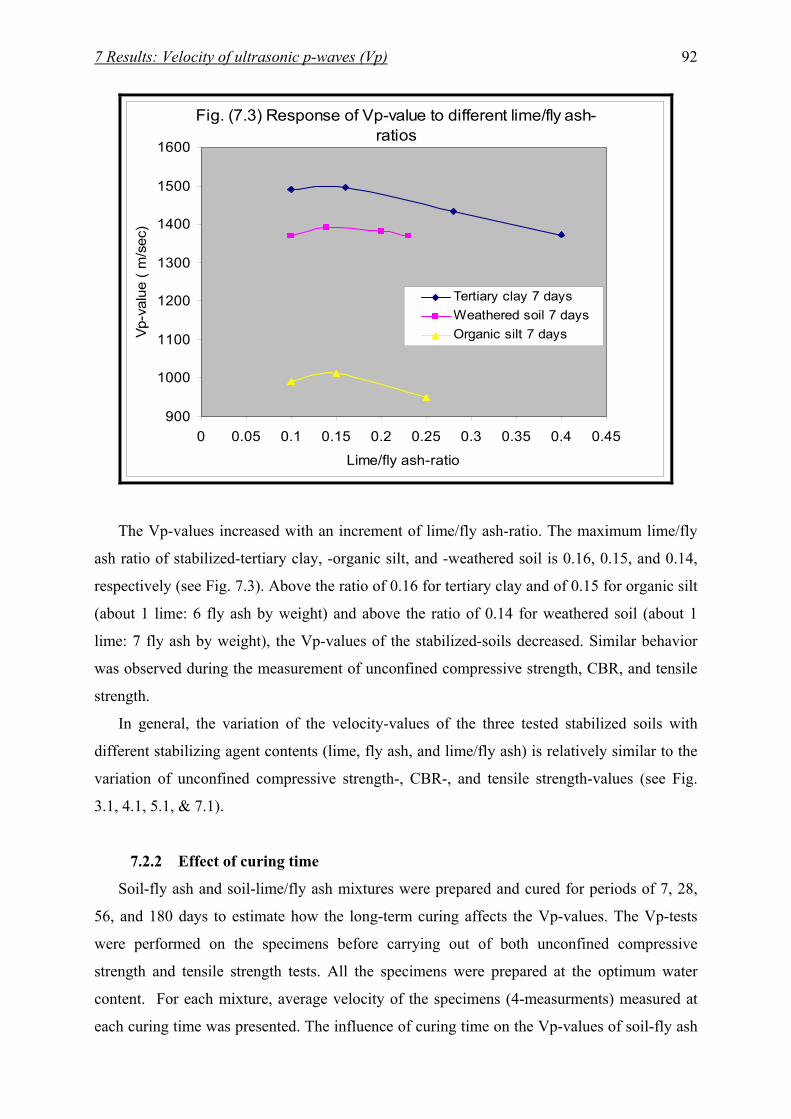
)Vp(waves -Velocity of ultrasonic p: Results7 92
Fig. (7.3) Response of Vp-value to different lime/fly ash-ratios
900
1000
1100
1200
1300
1400
1500
1600
0 0.05 0.1 0.15 0.2 0.25 0.3 0.35 0.4 0.45
Lime/fly ash-ratio
Vp-v
alue
( m
/sec
)
Tertiary clay 7 daysWeathered soil 7 daysOrganic silt 7 days
The Vp-values increased with an increment of lime/fly ash-ratio. The maximum lime/fly
ash ratio of stabilized-tertiary clay, -organic silt, and -weathered soil is 0.16, 0.15, and 0.14,
respectively (see Fig. 7.3). Above the ratio of 0.16 for tertiary clay and of 0.15 for organic silt
(about 1 lime: 6 fly ash by weight) and above the ratio of 0.14 for weathered soil (about 1
lime: 7 fly ash by weight), the Vp-values of the stabilized-soils decreased. Similar behavior
was observed during the measurement of unconfined compressive strength, CBR, and tensile
strength.
In general, the variation of the velocity-values of the three tested stabilized soils with
different stabilizing agent contents (lime, fly ash, and lime/fly ash) is relatively similar to the
variation of unconfined compressive strength-, CBR-, and tensile strength-values (see Fig.
3.1, 4.1, 5.1, & 7.1).
7.2.2 Effect of curing time
Soil-fly ash and soil-lime/fly ash mixtures were prepared and cured for periods of 7, 28,
56, and 180 days to estimate how the long-term curing affects the Vp-values. The Vp-tests
were performed on the specimens before carrying out of both unconfined compressive
strength and tensile strength tests. All the specimens were prepared at the optimum water
content. For each mixture, average velocity of the specimens (4-measurments) measured at
each curing time was presented. The influence of curing time on the Vp-values of soil-fly ash

)Vp(waves -Velocity of ultrasonic p: Results7 93
and soil-lime/fly ash mixtures is shown in Figure 7.4. Vp-values of both the soil-fly ash and
the soil-lime/fly ash mixtures, in case of the three different tested soils, increased with the
long-term curing. The curing time has a stronger effect on the Vp-values of soil-lime/fly ash
mixtures compared to soil-fly ash mixtures. The rate of increase in the Vp-values for soil-
lime/fly ash mixtures is higher than the rate of the Vp-values for soil-fly ash mixtures. In the
case of fly ash-stabilization process, the Vp-values of organic silt-optimum fly ash mixtures
were strongly affected by the curing time compared to Vp-values of both the tertiary clay- and
the weathered soil-optimum fly ash mixtures. The long-term curing has the weakest effect on
Vp-values of fly ash-stabilized weathered soil.
In the case of the lime/fly ash-stabilization process, Vp-values of tertiary clay-
lime/optimum fly ash mixtures and organic silt-lime/optimum fly ash mixtures were strongly
influenced by the curing time compared to Vp-values of weathered soil-lime/optimum fly ash
mixtures (see Fig. 7.4 and Tables 7.1, 7.2, & 7.3).
Figures 7.5 a, b, & c and 7.6 a, b, & c illustrate the sensitivity of the Vp-measurement to
unconfined compressive strength and elasticity modulus (Esecant) measurements. Figures 7.5 a,
b, and c show the variation of Vp- and unconfined compressive strength-values with curing
time for the soil-fly ash and -lime/fly ash mixtures. Figures 7.6 a, b, and c show the variation
of Vp- and the modulus (Esecant) values with curing time for the soil-fly ash and -lime/fly ash
mixtures of the three different soils. The correlation provides that the variation of Vp-values
with curing time is similar to the variation of both the unconfined compressive strength- and
the modulus (Esecant)-values. The correlation also confirms that the Vp-measurements are
sensitive to changes in unconfined compressive strength- and modulus (Esecant)-values with
long-term curing. Yesiller et al. (2001) obtained relatively similar correlation between Vp and
Esecant for a high plasticity clay stabilized with lime, cement, and fly ash and similar
correlation was observed between Vp and both the qu and the Esecant for class F fly ash
stabilized with lime and cement.

)Vp(waves -Velocity of ultrasonic p: Results7 94
Fig. (7.4) Effect of curing time on the p-wave velocity (Vp-value) of fly ash- and lime/fly ash-stabilized soils
900
1000
1100
1200
1300
1400
1500
1600
1700
1800
1900
2000
7 28 49 70 91 112 133 154 175 196Curing time (days)
Vp-
valu
e (m
/sec
)
Tertiary clay 16% F
Organic silt 20% F
Weathered soil 35% F
Tertiary clay 2.5%L/16%F
Organic silt 2%L/20%F
Weathered soil 3%L/35%F
Fig. (7.5, a) P-wave velocity (Vp-value) and unconfined compressive strength (qu-value) versus curing time for fly
ash- and lime/fly ash-stabilized tertiary clay
500
1000
1500
2000
2500
3000
3500
4000
7 28 49 70 91 112 133 154 175 196
Curing time (days)
qu-v
alue
(KN
/m²)
1200
1300
1400
1500
1600
1700
1800
1900
2000
Vp-
valu
e (m
/sec
)
16% flyash,Strength2.5%L/16%F, Strength
16% flyash,Velocity2.5%L/16%F, Velocity

)Vp(waves -Velocity of ultrasonic p: Results7 95
Fig. (7.5, b) P-wave velocity (Vp-value) and unconfined compressive strength (qu-value) versus curing time for fly ash-
and lime/fly ash-stabilized organic silt
500
700
900
1100
1300
1500
1700
1900
2100
2300
7 28 49 70 91 112 133 154 175 196Curing time (days)
qu-v
alue
(KN
/m²)
900
1000
1100
1200
1300
1400
1500
Vp-
valu
e (m
/sec
)
20% fly ash,Strength
2%L/20%F,Strength
20% fly ash,Velocity
2%L/20%F,Velocity
Fig. (7.5, c) P-wave velocity (Vp-value) and unconfined compressive strength (qu-value) versus curing time for fly
ash- and lime/fly ash-stabilized weathered soil
700
900
1100
1300
1500
1700
1900
2100
2300
2500
7 28 49 70 91 112 133 154 175 196
Curing time (days)
qu-v
alue
(KN
/m²)
1200
1250
1300
1350
1400
1450
1500
1550
1600
1650
Vp-v
alue
(m/s
ec)
35% fly ash,Strength
3%L/35%F,Strength
35% fly ash,Velocity
3%L/35%F,Velocity
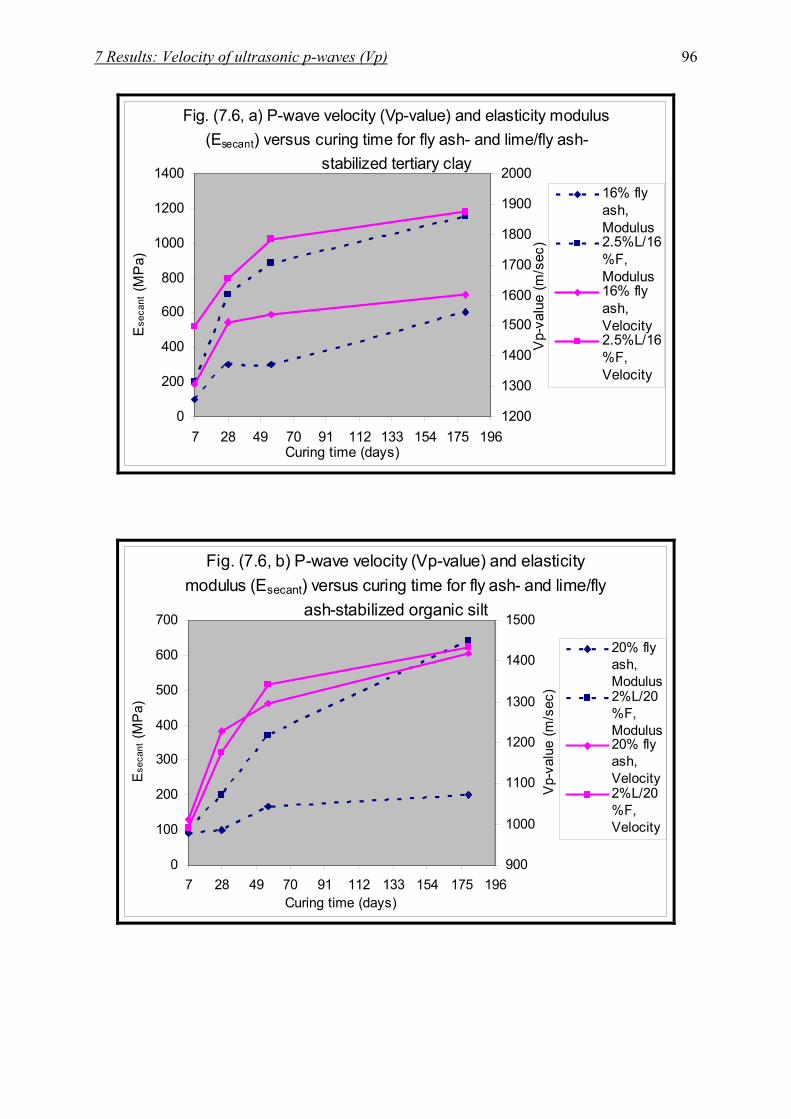
)Vp(waves -Velocity of ultrasonic p: Results7 96
Fig. (7.6, a) P-wave velocity (Vp-value) and elasticity modulus (Esecant) versus curing time for fly ash- and lime/fly ash-
stabilized tertiary clay
0
200
400
600
800
1000
1200
1400
7 28 49 70 91 112 133 154 175 196Curing time (days)
Ese
cant
(MP
a)
1200
1300
1400
1500
1600
1700
1800
1900
2000
Vp-
valu
e (m
/sec
)
16% flyash,Modulus2.5%L/16%F,Modulus16% flyash,Velocity2.5%L/16%F,Velocity
Fig. (7.6, b) P-wave velocity (Vp-value) and elasticity modulus (Esecant) versus curing time for fly ash- and lime/fly
ash-stabilized organic silt
0
100
200
300
400
500
600
700
7 28 49 70 91 112 133 154 175 196Curing time (days)
Ese
cant
(MP
a)
900
1000
1100
1200
1300
1400
1500
Vp-
valu
e (m
/sec
)
20% flyash,Modulus2%L/20%F,Modulus20% flyash,Velocity2%L/20%F,Velocity

)Vp(waves -Velocity of ultrasonic p: Results7 97
Fig. (7.6, c) P-wave velocity (Vp-value) and modulus (Esecant) versus curing time for fly ash- and lime/fly ash-
stabilized weathered soil
0
100
200
300
400
500
600
700
800
7 28 49 70 91 112 133 154 175 196Curing time (days)
Ese
cant
(MP
a)
1200
1250
1300
1350
1400
1450
1500
1550
1600
1650
Vp-
valu
e (m
/sec
)
35% fly ash,Modulus
3%L/35%F,Modulus
35% fly ash,Velocity
3%L/35%F,Velocity
7.3 Conclusions
* Vp-values increased slightly with an increment of the dry density of the untreated
compacted soils whereas the amount of voids filled with air and water decreased by the
compaction process. In the case of lime-, fly ash-, and lime/fly ash-stabilized soils, the Vp-
values increased strongly compared to untreated compacted soils.
* In the case of lime-stabilization process, the addition of optimum lime content (according to
pH-method) led to an increase in the Vp-values of the three tested soils. Optimum lime-
tertiary clay mixtures have the highest Vp-values and Vp-gain factors. Conversely, optimum
lime-weathered soil mixtures have the lowest Vp-values and -gain factors. The Vp-value of
lime-stabilized tertiary clay increased with an increase in lime content continually (2 and 4%
above the optimum lime content). Another behavior of both the organic silt and the weathered
soil was observed, where the Vp-values increased at 2% above the optimum lime content and
decreased slightly at 4% above the optimum. The Vp-gain factors (due to the addition of the
optimum lime content) of tertiary clay, organic silt, and weathered soil are 2.13, 1.83, and
1.22, respectively.
* In the case of fly ash-stabilization process, the addition of fly ash contents contributed to an
increase in the Vp-values and the Vp-gain factors for the three tested soils. The Vp–values
and the Vp-gain factors of both the organic silt and the weathered soil increased with an

)Vp(waves -Velocity of ultrasonic p: Results7 98
increment of the fly ash content continuously. The Vp-values of tertiary clay increased with
an increment of fly ash content from 8 to 20%. Above 20% fly ash (i.e. 25%), the Vp-values
decreased. The Vp-gain factors of fly ash-organic silt mixtures are slightly higher than the
Vp-gain factors of fly ash-tertiary clay mixtures, at the same fly ash contents. The Vp-gain
factors of fly ash-weathered soil mixtures have the lowest values compared to both fly ash-
organic silt and –tertiary clay mixtures. Similar behavior was obtained with the CBR-
measurement.
* In the case of lime/fly ash-stabilization process, addition of lime and fly ash together
increased the Vp-values of the three tested soils strongly compared to addition of lime and fly
ash separately. Lime/fly ash-tertiary clay mixtures have Vp-gain factors higher than lime/fly
ash-organic silt and –weathered soil mixtures. The optimum ratio of lime to fly ash is about 1
lime: 6 fly ash (0.16 in case of the tertiary clay and 0.15 in case of the organic silt) and about
1 lime: 7 fly ash (0.14 in case of the weathered soil). Similar results were obtained at qu-,
CBR-, and σt-measurement.
The Vp-values and the Vp-gain factors of both the fly ash- and the lime/fly ash-stabilized
soils (for the three tested soils) increased with the long-term curing. The Vp-values of the
lime/fly ash-stabilized soils were strongly affected by the long-term curing compared to the
values of fly ash-stabilized soils, especially lime/fly ash stabilized-tertiary clay and –organic
silt. The curing time has the weakest influence on Vp-values of fly ash- and lime/fly ash-
stabilized weathered soil in comparison to the influence on Vp-value of both fly ash- and
lime/fly ash-stabilized tertiary clay and organic silt. Similar behavior was observed at qu-,
CBR-, and σt-measurement.
* The correlation between qu-, CBR-, and σt-measurement (on one hand) and Vp-
measurement (on the other hand) for the three tested stabilized soils shows that the variation
of Vp-values of the three studied soils, due to the addition of lime, fly ash, and lime/fly ash,
(cured at 7 days) is relatively similar to the variation of qu-, CBR-, and σt-values (see Fig.
3.1, 4.1, 5.1, & 7.1).
* The correlation between Vp-, qu-, and Esecant -measurement of the three tested lime-, fly ash-
, and lime/fly ash-stabilized soils with long-term curing proves that the variation of Vp-
values with curing time is similar to the variation of both unconfined compressive strength
(qu) and modulus (Esecant) values with curing time. The correlation also points to the fact that
the Vp-measurement is sensitive to changes in unconfined compressive strength (qu) and
modulus (Esecant) values with curing time.

analysis-and Calorimetry, -XRD, -SEM: Results8 99
8 Results: SEM-, XRD-, and Calorimetry-analysis 8.1 SEM-analysis (Microstructural analysis)
The changes of microstructural and microstructural development of soils due to lime-, fly
ash-, and lime/fly ash-addition play significant role in the geotechnical properties and the
mechanical behavior of these stabilized soils. The changes of the microstructural of the three
tested soils due to lime-, fly ash-, and lime/fly ash-addition were investigated using JEOL-
JSM-6300 scanning electron microscope operated at 20KV. Undisturbed cubical specimens
(10 mm * 10 mm) of both the natural and the stabilized soils were prepared and dried in the
oven at 40°C and subsequently subjected to vacuum. The tested specimens were glued on
aluminum holders for scanning. The fractured surface of the specimens was coated with gold
instead of carbon to get images with a good quality.
8.1.1 Microstructural analysis of natural soils
Figure 8.1 (a) shows the SEM-micrograph of natural untreated tertiary clay which
indicates the sheet-like structure and flaky arrangement of the clay particles. It is a closed
fabric. This confirms that the hydraulic conductivity is very poor permeable (K-value is 1.9E-
11 m/sec). Figure 8.2 (a) illustrates the SEM-micrograph of natural untreated organic silt. The
micrograph shows an occurrence of detrital grains of silt and fine sand fractions and little
amount of clay as a matrix between the detrital grains. The specimen has silt-fine sand like
structure and characterized by open fabric system and occurrence of relatively large voids
distributed in the specimen. This proves that the K-value of natural organic silt (5.5E-07
m/sec) is higher than the K-value of both the natural tertiary clay and the weathered soil.
Figure 8.3 (a) illustrates the micrograph of natural untreated weathered soil which shows
flaky arrangements of clay particles (Kaolinite) as matrix between the detrital fine grains (the
concentration and the distribution of the clay particles are not regular, some parts contain
more clay particles and less detrital grains and others contain more detrital grains and less
clay particles). The occurrence of clay particles as matrix leads to a reduction of the K-value
(3.2E-11 m/sec) compared to K-value of organic silt.
8.1.2 Micostructural analysis of treated stabilized soils
Treated stabilized tertiary clay:
Figure 8.1 (b) illustrates a micrograph of tertiary clay soil treated and stabilized with 4.5%
lime (optimum lime content) and cured for 7 days. The micrograph shows crumbs of floccules
with a porous nature and cementitous compounds (calcium aluminum hydrate and calcium

analysis-and Calorimetry, -XRD, -SEM: Results8 100
silicate hydrate) coating the relics of the clay particles and the flocs. The edges of the relics of
the clay particles were attacked by lime and their boundaries have a ragged-form.
Additionally, the reaction of lime with clay led to the formation of aggregates of various sizes
and this is responsible for the increase in porosity of the soil system. Similar microfabric was
observed by (Eades and Grim 1960, Croft 1964, Narasimha Rao and Rajasekaran 1992,
Rajasekaran et al. 1995, and Rajasekaran and Narasimha Rao 1998). Figure 8.1 (c) illustrates
a micrograph of tertiary clay treated and stabilized with 16% fly ash and cured for 28 days.
The micrograph shows aggregated arrangements due to flocculation and the formation of
hydration reaction products coating and cementing the soil- and the fly ash-particles together.
This microfabric is silt-fine sand like structure and highly porous (open fabric). Figure 8.1 (d)
shows the same specimen at a high magnification. The micrograph illustrates the flocculated
arrangements and the hydration reaction products coated the relics of both soil- and fly ash-
particles. It is highly porous fabric.
The pore spaces are large (> 1µm) and some individual diameters of pores is about 3 µm. This
confirms the increase in the K-value at 28 days curing, where K-value is equal to 6.4E-09
m/sec. Figure 8.1 (e) shows a micrograph of tertiary clay treated and stabilized with 16% fly
ash and cured for 180 days. The micrograph illustrates the formation of more new
cementitous compounds after long-term curing (spiny crystals) as a result of the pozzolanic
reaction coating the aggregates and the fly ash particles and filling the pore spaces (voids)
between the flocs. These spiny crystals led to the development of network of reinforcement
and to an increase in the strength in the long-term curing. The new cementitous compounds,
in the long-term curing, were grown within the pore spaces resulting in a reduction of the
radius of the pore spaces, where the pore spaces after 180 days curing are relatively smaller
than the pore spaces of the same mixture after 28 days curing. This confirms the reduction of
the hydraulic conductivity at the long-term curing (K-value = 1.6E-09). Figure 8.1 (f) shows a
micrograph of tertiary clay stabilized with 2.5% lime and 16% fly ash together and cured for
28 days. The micrograph illustrates silt-fine sand like structure (open fabric) due to the
flocculated arrangements. The hydration reaction compounds coated both the relics of clay
and fly ash particles. The microstructure characterized by relatively high porous system,
where the pore spaces are relatively large. This shows the relatively high permeability-value
(K-value = 2.6E-09 m/sec) of the mixture at 28 days curing. Figure 8.1 (g) illustrates the
microstructural development due to the long-term curing (180 days) of tertiary clay stabilized
with 2.5% lime and 16% fly ash together. The micrograph shows a new formation of mineral-

analysis-and Calorimetry, -XRD, -SEM: Results8 101
(a) Natural tertiary clay (b) 4.5% lime, 7 days curing
(c) 16% fly ash, 28 days curing (d) 16% fly ash, 28 days curing
(e) 16% fly ash, 180 days curing (f) 2.5% lime+16% fly ash, 28 days curing
(g) 2.5% lime+16% fly ash, 180 days curing
Fig. (8.1) Scanning electron micrographs illustrate the microstructural changes of tertiary
clay due to lime-, fly ash-, and lime/fly ash-stabilization process.

analysis-and Calorimetry, -XRD, -SEM: Results8 102
crystal (as a product of pozzolanic reaction at long-term curing) within the pore spaces. This
leads to an increase in the strength gain and a reduction of the radius of the pore spaces and
subsequently reducing the K-value. K-value (5.2E-10) at 180 days curing is smaller than the
value of the same mixture at 28 days curing. No evidence of ettringite has been found in the
tested specimens of lime-, fly ash-, and lime/fly ash-stabilized tertiary clay.
Treated stabilized organic silt:
Figure 8.2 (b) illustrates SEM-micrograph of organic silt stabilized with 20% fly ash and
cured for 28 days. The micrograph shows cementitous compounds (due to pozzolanic
reaction) coated and joined both the fly ash- and the soil-particles (as network). The
microstructure is characterized by flocculated arrangements and has silt-fine sand like
structure (porous system). This proves the relatively high value of the hydraulic conductivity
at 28 days curing (K-value = 5.7E-09). Figure 8.2 (c) shows a micrograph of the same mixture
cured for long-term (180 days). The micrograph illustrates a massive formation of
cementitous compounds and new mineral crystals (as a result of the pozzolanic reaction)
coating the surface of both the fly ash- and the soil-particles and filled the pore spaces. This
contributed to an increase in the strength strongly and a reduction of the hydraulic
conductivity relatively in comparison to the K-value of the same mixture for 28 days curing.
Figure 8.2 (d) illustrates SEM-micrograph of organic silt stabilized with 2% lime and 20% fly
ash together and cured at 28 days. The microstructure shows both the fibrous and the gel
hydration reaction products. The hydration reaction products coated both the fly ash- and the
soil-particles and filled the voids partially between the particles. The microstructure is highly
porous due to the flocculation and the increase in the diameter of the flocs by production of
the cementitous compounds surrounded these flocs. This proves an increase in the hydraulic
conductivity where it has the maximum value (1.8E-07 m/sec) at 28 days curing. Figure 8.2
(e) shows the same specimen at high magnification.
Figure 8.2 (f) illustrates SEM-micrograph of the above mentioned mixture cured at 180
days. The micrograph shows new cementitous compounds (as a result of the pozzolanic
reaction after long-term curing). The cementitous compounds coated the surface of the soil
particles and filled the voids partly. This led to joining the soil particles strongly, reducing the
diameter of the voids, and decreasing the K-value (1.8E-08 m/sec) compared to the K-value
of the same mixtures after 28 days curing. The pore spaces of lime/fly ash-stabilized organic
silt are relatively larger than the pore spaces of fly ash-stabilized organic silt after 180 days

analysis-and Calorimetry, -XRD, -SEM: Results8 103
curing. This confirms that the K-value of lime/fly ash-stabilized organic silt after 180 days is
relatively higher than the K-value of fly ash-stabilized organic silt at the same curing time.
(a) Natural organic silt (b) 20% fly ash, 28 days curing
(c) 20% fly ash, 180 days curing (d) 2% lime+20% fly ash, 28 days curing
(e) 2% lime+20% fly ash, 28 days curing (f) 2% lime+20% fly ash, 180 days curing
Fig. (8.2) Scanning electron micrographs illustrate the microstructural changes of organic
silt due to fly ash- and lime/fly ash-stabilization process.
Treated stabilized weathered soil:
Figure 8.3 (b) illustrates a micrograph of weathered soil stabilized with 35% fly ash and
cured for 28 days. The micrograph shows rod-like crystals “ettringite” (as hydration reaction
product) growing on the relics of clay particles. The microstructure is highly porous where
pore spaces are relatively large. This confirms the high value of the hydraulic conductivity
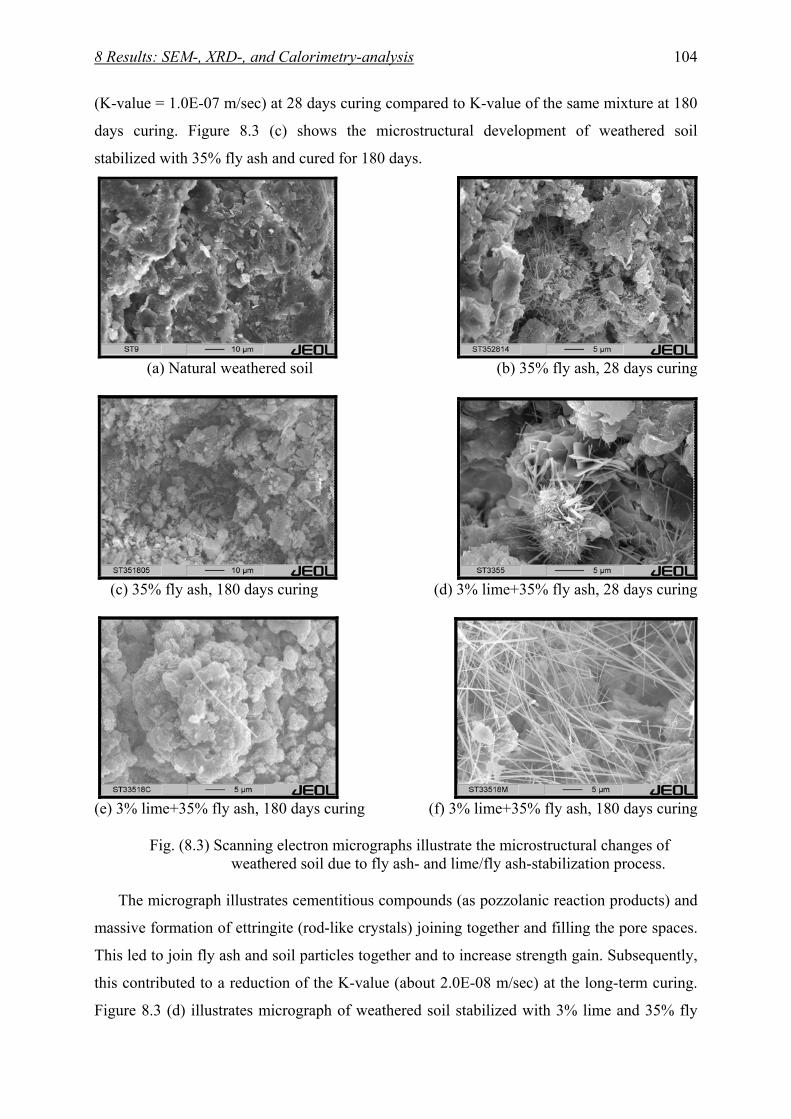
analysis-and Calorimetry, -XRD, -SEM: Results8 104
(K-value = 1.0E-07 m/sec) at 28 days curing compared to K-value of the same mixture at 180
days curing. Figure 8.3 (c) shows the microstructural development of weathered soil
stabilized with 35% fly ash and cured for 180 days.
(a) Natural weathered soil (b) 35% fly ash, 28 days curing
(c) 35% fly ash, 180 days curing (d) 3% lime+35% fly ash, 28 days curing
(e) 3% lime+35% fly ash, 180 days curing (f) 3% lime+35% fly ash, 180 days curing
Fig. (8.3) Scanning electron micrographs illustrate the microstructural changes of
weathered soil due to fly ash- and lime/fly ash-stabilization process.
The micrograph illustrates cementitious compounds (as pozzolanic reaction products) and
massive formation of ettringite (rod-like crystals) joining together and filling the pore spaces.
This led to join fly ash and soil particles together and to increase strength gain. Subsequently,
this contributed to a reduction of the K-value (about 2.0E-08 m/sec) at the long-term curing.
Figure 8.3 (d) illustrates micrograph of weathered soil stabilized with 3% lime and 35% fly
analysis-and Calorimetry, -XRD, -SEM: Results8 105
ash together and cured for 28 days. The micrograph shows the growth of ettringite crystals at
the surface of clay-relics and fly ash particles nucleated with ettringite crystals. The
micrograph also illustrates cementitous compounds coating the flocs. The microstructure
seems highly porous where the pore spaces are relatively large compared to the pore spaces of
the same mixtures after 180 days curing. This confirms an increase in the hydraulic
conductivity at the maximum value (K-value = 4.1E-08 m/sec) after 28 days curing. Figure
8.3 (e and f) shows the microstructural development of weathered soil stabilized with 3% lime
and 35% fly ash together after 180 days curing. Micrograph 8.3 (e) illustrates flouclated
arrangement (due to the flocculation) with pore spaces relatively smaller than the pore spaces
of the same mixture at 28 days curing. The reduction of pore spaces diameter resulted from
the formation of a new cementitous compounds (new formation of mineral crystals as a result
of pozzolanic reaction at long-term curing) surrounded and within the pore spaces (voids)
between fly ash- and soil-particles. This led to an increase in the strength gain and a reduction
of the hydraulic conductivity (K-value = 2.6E-09 m/sec). Figure 8.3 (f) shows massive
formation of long rods of ettringite crystals after 180 days curing. The amount and the length
of ettringite crystals are large in comparison to the fly ash-weathered soil mixture after 180
days curing. This shows that the reaction of lime and fly ash together with the soil is stronger
than the reaction of fly ash alone and the addition of lime to sulfate-bearing soil leads to an
increase in the ettringite-formation.
8.2 XRD-analysis (X-rays powder diffraction analysis)
The mineralogical analysis of the treated stabilized soil is very important to determine the
changes in the mineralogical phases due to pozzolanic reactions. These reactions depend on
the chemical and the mineralogical composition of each soil and additive. In the present
study, XRD-analysis was conducted on the three tested natural soils. The results showed that
the weathered soil contains gypsum (hydrated calcium sulfate) (see Table 2.6 and Appendix
3).
The presence of sulfate (due to the presence of naturally-occurring gypsum crystals) can
cause problems when soil is stabilized with any calcium-based additive (e.g. lime, Portland
cement, fly ash etc). Sulfate in the soil reacts with calcium and alumina from clay (in the
presence of water) to form the minerals ettringite and/or thaumasite. The formation of
ettringite and/or thaumasite after the compaction process can lead to significant pavement
heaving and loss of strength (National Lime Association, 2004).

analysis-and Calorimetry, -XRD, -SEM: Results8 106
Sulfate leads to the alteration of soil-lime, soil-fly ash, and soil-lime/fly ash reaction. In the
absence of sulfate, the reactions between calcium (in the lime or in the fly ash) and soil, in the
presence of water, produce calcium silicate hydrate of varying calcium to silica ratios. In the
presence of sulfate, the reactions are modified and ettringite (hydrated calcium aluminum
sulfate hydroxide) and/or thaumasite (hydrated calcium silicon carbonate sulfate hydroxide)
are formed (Braga Reis, 1981). Hunter (1988) described the sequence of the reaction as
follows:
6Ca + 2AL (OH)-4 + (OH)- + 3(SO4)2- + 26H2O Ca6 [(AL (OH)6 )]2 . (SO4)3 . 26H2O
“ettringite”
Problems of sulfate-presence and ettringite-formation according to previous studies:
Hunter (1988) and Mitchell (1986) observed that lime-treated sulfate-bearing clays
swelled and disintegrated after a few years when used for road construction. Abdi and Wild
(1993, part I) observed unrestrained expansion and swelling pressure for gypsum containing
lime-stabilized clays. This resulted in the possible swelling mechanisms associated with
ettringite formation. Wild et al. (1993, part II) reported that the period of volume instability
and swelling coincides with the period of gypsum consumption and ettringite formation.
However, swelling is not caused by growth of crystalline ettringite but is the result of water
adsorption. Sridharan et al. (1995) showed that the presence of sulfate led to an increase in the
compressibility of lime-treated black cotton soil after curing for long periods. Sivapullaiah, et
al. (2000) studied the behavior of lime-treated montmorillonite black soil in the presence of
different sulfate contents after long-term curing (>365 days). They reported that the presence
of sulfate in soils considerably reduces the shear strength of lime-treated black cotton soil for
the long time. The reduction in shear strength reflects a reduction in the effective cohesion
intercept. This resulted in the prevention of cementation of particles by sulfate and the
formation of ettringite.
In the present study, SEM-analysis conducted on the three tested stabilized soils
illustrated that both fly ash- and lime/fly ash-stabilized weathered soil (after 28 and 180 days
curing) contain needle or rod like crystals. These crystals are like ettringite crystals. X-ray
powder diffraction analysis were conducted on fly ash- and lime/fly ash-stabilized weathered
soil (after 28 days curing) to confirm the occurrence of ettringite crystals (see Appendixes 4
& 5). The analysis showed the occurrence of ettringite crystals confirming the SEM-analysis.
After 28 days moist curing no gypsum was observed in both the fly ash and the lime/fly ash-
stabilized weathered soil specimens. The only new crystalline phase was ettringite where
gypsum was consumed to form ettringite crystals.

analysis-and Calorimetry, -XRD, -SEM: Results8 107
In the case of both fly ash- and lime/fly ash-stabilized weathered soil cured for 28 and 180
days (moist-curing without water soaking), the presence of sulfate led to the formation of
ettringite and the reduction of the strength gain development especially with long-term curing
(see chapter 3.4.2). No critical expansion of stabilized weathered soil after 28 and 180 days
moist-curing was observed. The expansion of fly ash- and lime/fly ash-stabilized weathered
soil (due to ettringite-formation) was less than 1% (without water-soaking).
8.3 Calorimetry-analysis
The heat of the hydration reaction is an important factor to characterize cements, mortars
and other materials in building industries (Poellmann et al., 1991). The hydration reaction of
cement, lime (CaO), and mortar etc (without mixing with soil) is relatively fast and spans
hours, so that the use of the calorimeter is significant. Conversely, the hydration or
pozzolanic reaction of the mixtures of soil (clay or silt) with chemical additives [cement, lime
CaO or Ca (OH)2, fly ash, and lime/fly ash together etc.] is slow and spans days, months, and
sometime more than one year. The pozzolanic reactions between lime and lime/fly ash
stabilizers and soils generally occur slower than reactions between soils and other stabilizing
agents such as cement (Yesiller et al., 2001). In the present study, during carrying out of
consistency tests of different mixtures of the tested soils with lime, fly ash, and lime/fly ash, it
was observed that the mixtures of organic silt with optimum lime content and with lime/fly
ash contents (after the mixing with water and curing for 1 day) lost their flow-ability and set
quickly after 1 day curing. However, this was not observed for the mixtures of both tertiary
clay and weathered soil with optimum lime content and lime/fly ash contents. This behavior
of optimum lime- and lime/fly ash-organic silt mixtures was unexpected. In order to interpret
this behavior and to evaluate the heat of the hydration-reactions of the soil-chemical additive
mixtures, heat-flow calorimetry was conducted on the mixtures of the three tested soils with
optimum lime contents and lime/fly ash contents. Heat-flow calorimeter (developed by
Poellmann et al., 1991) was used. The calorimeter runs either in an isothermal mode or in a
slow scanning mode over a temperature range up to 110°C. When exothermic or endothermic
reactions take place, the temperature difference between the measuring system and the
surrounding occurs. Therefore, a heat current flows as long as isothermal conditions are
installed again and the reaction heat (∆Q) can be calculated by the integral of temperature
differences (∆T) as a function of time (t) (Poellmann et al., 1991).
∆Q = t1∫t2 k (T) ∆T (t) dt Where k (T) = Calibration factor (constant)

analysis-and Calorimetry, -XRD, -SEM: Results8 108
Figure 8.4 illustrates the calorimeter with its 4-cells and peripheral tools. The calorimeter
contains 4-cells in alluminum block with 4-symmetric drills (quadruplet). The tested
specimens (lime- and lime/fly ash-soil mixtures) are put in three measuring-cells (in copper-
pots with covers) “M”. The fourth cell used as reference “R”. The reference-cell is used to
compensate the difference between the surrounding temperature and the measuring-cells. The
water is poured on the mixtures [water (W)/solid (S) =1] by injection using a syringe through
a pore of the copper-pot cover. The measured-data (temperature differences) can be caught on
digital-voltmeter (PREMA 6110) and saved on the personal computer. The data can be
represented and evaluated using graphical and statistical-software.
Fig. (8.4) Calorimeter with 4-cells and its peripheral tools (modified after Poellmann et al., 1991).
The calorimeter analysis illustrated that no hydration-reactions were recorded for the
mixtures of optimum lime- and lime/fly ash-teritary clay and -weathered soil until 3 days.
However, there are fast hydration reactions of optimum lime- and lime/fly ash-organic silt
mixtures (see Fig. 8.5). The mean peak height of the optimum lime-organic silt mixture was at
3.5 hours and the mean peak heights of two lime/fly ash-organic silt mixtures were at 7.5
hours. The entire heat flow of 3% lime-, 2% lime/20% fly ash-, and 3% lime/20% fly ash-
organic silt mixtures is 59.28, 99.02, and 85.85 J/g, respectively. These fast-hydration
reactions prove the loss of flow-ability and the quik-set of the optimum lime- and lime/fly
ash-organic silt mixtures after mixing with water and curing for 1 day. Natural organic silt
contains a high value of CaO-content (18.7%) compared to low values of CaO-content of both
natural tertiary clay (2.41%) and weathered soil (1.34%). The high value of CaO-content of
natural organic silt led to an acceleration of the hydration reaction of the chemical additives.
Additionally, the prescence of calcite mineral (see Appendix 2) in the natural orgaic silt also
contributed to an acceleration of the hydration reaction. Shi et al. (2004) reported that the
crushed limestone dust (waste material) can be used to produce self-consolidation concrete

analysis-and Calorimetry, -XRD, -SEM: Results8 109
(SCC) with properties similar to those of SCC containning coal fly ash. SCC mixtures
containing limestone dust loses its flow-ability and sets faster than the mixtures containing fly
ash. This is due to an acceleration of the hydration of portland cement by the limestone
powder.
Fig.(8.5) Calorimetric curves of the three studied soils mixed with optimum lime and lime/fly ash contents (W/S = 1).
8.4 Conclusions
Scanning electron microscope studies indicated that the microstructures of the tested soils
was changed due to lime-, fly ash- and lime/fly ash-stabilization process and developed
through the long-term curing. The stabilization process led to the formation of a silt-fine sand
like structure (open fabric) characterized by a highly porous system. Additionally, SEM-
micrograph of fly ash- and lime/fly ash-stabilized weathered soil showed rod-like crystals
(ettringite).
SEM-micrographs of natural and treated stabilized soils indicated that the formation of
new cementitous compounds and mineral crystals as a pozzolanic reaction product through
the long-term curing contributing to increasing the strength gain. These cementitous
compounds join the soil particles together and increase the strength gain. XRD-analysis
confirmed that the presence of sulfate in the weathered soil led to ettringite-formation. After

analysis-and Calorimetry, -XRD, -SEM: Results8 110
28 days moist-curing of both the fly ash- and the lime/fly ash-stabilized weathered soil, the
only new crystalline phase was ettringite where gypsum was consumed to form the ettringite
crystals. There is no critical volume-changes (expansion) of both fly ash- and lime/fly ash
stabilized weathered soil (moist-curing at 28 and 180 days) due to ettringite-formation (the
increase of volume < 1%). The calorimetry-analysis illustrated that the high value of CaO-
content and the presence of calcite mineral in the natural organic silt led to an acceleration of
the hydration reaction of the optimum lime- and lime/fly ash-organic silt mixtures. The
maximum value of the heat of the hydration reaction (main peak height) for optimum lime
(3%)-organic silt mixture spanned 3.5 hours and the entire heat flow was 59.28 J/g. The
maximum value of the heat of the hydration reaction (main peak height) for both 3%
lime/20% fly ash- and 2% lime/20% fly ash-organic silt mixtures spanned 7.5 hours and the
entire heat flow was 99.02 and 85.85 J/g, respectively.

and suggestions for the future, final conclusions, Discussions9 111
9 Discussions, final conclusions, and suggestions for the future
The present study is a geotechnical laboratory program to estimate how the use of fly ash
(a by-product from a local electric power plant at Lippendorf, south of Leipzig city, Saxony,
Germany), hydrated lime, and lime/fly ash could improve the geotechnical properties
[including consistency limits, compaction properties, unconfined compressive strength (qu),
elasticity modulus (Esecant), durability, California bearing ratio (CBR), indirect tensile strength
(σt), and the hydraulic conductivity (K-value)] of three different soft fine-grained soils
[tertiary clay, organic silt, and weathered soil] collected from Halle-city region, Saxony-
Anhalt, Germany. One of the main aims of the study is to use the ultrasonic p-wave velocity
testing as a non-destructive method to evaluate the improvement of the geotechnical
properties of the stabilized soils and to correlate the p-wave velocity of the stabilized soils
with the other geotechnical parameters (qu-, Esecant-, CBR-, and σt-value). In addition to this,
the study is an attempt to estimate the effect of lime-, fly ash-, and lime/fly ash-stabilization
process on the microstructures and on the mineralogical composition of the three studied soils
using SEM- and XRD-analysis, respectively. Furthermore, this study is designed to evaluate
the heat flow of the soil-chemical additive mixtures using calorimetry-analysis. The results of
the present study illustrated the following findings:
9.1 Plasticity and compaction
* The addition of lime, fly ash, and lime/fly ash to the three tested soils led to a reduction of
the plasticity index. This reduction occurs by decreasing the thickness of the double layer of
the clay particles, as a result of cation exchange reaction, which causes an increase in the
attraction force leading to flocculation of the particles (Nalbantoglu & Gucbilmez, 2001).
Unlike the pozzolanic reaction, flocculation tends to modify the soil without producing new
secondary minerals (Marks & Haliburton, 1972). The addition of fly ash and lime/fly ash
increased the percent of sand particles fraction and decreased the percent of fines
(Nalbantoglue, 2001). This increase of coarse grain size resulted in a reduction of the
plasticity index and the swell potential, especially in the case of tertiary clay, which contains
relatively large amount of clay particles (< 2µm = 47%) including kaolinite, montmorillonite
(expansive clay mineral with high surface area, it reacts with the chemical additives strongly
compared to the reaction of kaolinite), and halloysite.
* The addition of lime, fly ash, and lime/fly ash to the studied soils contributed to an increase
in the optimum moisture content and a decrease in the maximum dry density. The moisture-

and suggestions for the future, final conclusions, Discussions9 112
density curves of the stabilized soils have a typical flattened form. This typical flattening of
the compaction curves makes it easier to achieve the required density over a wider range of
possible moisture contents. This change in the shape and characteristics of the peak of the
compaction curves can allow for significant savings in time, effort, and energy (Nicholson et
al., 1994).
9.2 Strength, bearing capacity, and ultrasonic p-wave velocity
* The qu-, Esecant-, CBR-, and Vp-values increased slightly with increment of the dry density
of the untreated compacted soils (due to the compaction process without chemical additives)
whereas the amount of voids filled with air and water decreased. In the case of stabilized
soils, the values increased strongly (compared to untreated compacted soils) due to the
addition of the chemical stabilizing agents (lime, fly ash, and lime/fly ash) whereas the
formed cementitious compounds (as a result of the chemical reactions between the silica and
the alumina and the additives) reduced the volume of the void spaces and joined the soil
particles.
9.2.1 Lime-stabilization
* In the case of lime stabilization process, the optimum lime content (according to pH-
method) of tertiary clay, organic silt, and weathered soil is 4.5, 3, and 5%, respectively.
Tertiary clay is strongly reactive with lime. Unconfined compressive strength, California
bearing ratio, indirect tensile strength, and p-wave velocity of the lime-stabilized tertiary clay
increased continuously with the increase in lime content, because it contains a high amount of
the clay particles (< 2µm = 47%) including kaolinite, montmorillonite, and halloysite where
montmorillonite reacts strongly and fast with additional lime. Both the organic silt and the
weathered soil react weakly with lime where they contain relatively small amount of the clay
particles including only kaolinite (in weathered soil) and halloysite (in organic silt) which
react slowly with the additional lime in comparison to montmorillonite in tertiary clay.
Weathered soil and organic silt have failed in the reactivity test. The qu-, CBR-, σt-, and Vp-
values increased at the optimum lime content and 2% above the optimum compared to the
values of untreated compacted specimens, but the continual increase in lime (4% above the
optimum lime content) resulted in the decrease in the values. This may be due to the fact that
both the organic silt and the weathered soil contain low amount of clay particles.
Additionally, the weathered soil is a problematic acidic soil where its pH-value < 7 (= 2.65).
and suggestions for the future, final conclusions, Discussions9 113
9.2.2 Fly ash-stabilization
* In the case of fly ash stabilization process, the optimum fly ash content (according to pH-
method) of tertiary clay, organic silt, and weathered soil is 16, 20, and 35%, respectively. The
qu-, CBR-, σt-, and Vp-values increased with increasing fly ash content in case of both the
organic silt and the weathered soil. In case of the tertiary clay, the values increased with
increasing fly ash content (from 8 to 20%) and decreased with a continual increase in fly ash
content (above 20%). The reactivity of both the organic silt and the weathered soil with fly
ash is relatively weaker than the reactivity of tertiary clay, at the same fly ash contents. CBR-
and Vp-gain factors of fly ash-organic silt mixtures are higher than the gain factors of fly ash-
tertiary clay mixtures, at the same fly ash contents. This is on the one hand due to the lower
CBR- and Vp-value of the untreated compacted organic silt compared to the values of tertiary
clay, on the other hand due to the finding that a part of fly ash particles filled the large void
spaces in the organic silt. The hydration reaction (in these void spaces) was not inhibited by
the organic matter (Hebit & Farrel, 2003). The CBR- and the Vp-gain factors of fly ash-
weathered soil mixtures have the lowest values compared to both fly ash-organic silt and –
tertiary clay mixtures.
9.2.3 Lime/fly ash-stabilization
* In the case of lime/fly ash-stabilization process, the optimum lime/fly ash content
(according to pH-method) of tertiary clay, organic silt, and weathered soil is (2.5%L+8%F),
(2%L+12%F), and (3%L+20%F), respectively. The addition of lime and fly ash together
increased the qu-, CBR-, σt-, and Vp-values of the three studied soils strongly compared to
lime and fly ash separately. Lime/fly ash-tertiary clay mixtures have qu-, CBR-, σt-, and Vp-
values higher than the values of both lime/fly ash-organic silt and –weathered soil mixtures.
When lime is mixed with fly ash, it has been suggested that for “a given ratio of lime to fly
ash, the compressive strength of lime-fly ash mixture will increase with an increase in the
amount of lime and fly ash used” (Chu et al., 1955). There has been some discussion that
there may be an upper limit at which no further strength gain should be expected. In the
present study, the strength gain increased for all the three tested soils with increase of both the
lime and the fly ash contents, but this increase has upper limit at the optimum lime/fly ash
ratio. Virendra & Narendra (1997) reported that the use of fly ash from Obra thermal power
station led to an increase in the unconfined compressive strength- and the California bearing
ratio-values of an alluvial soil stabilized with 15% of lime and fly ash in proportion of 1 : 3 by

and suggestions for the future, final conclusions, Discussions9 114
weight (about 0.33 lime of the fly ash weight), less or more than this ratio (for example 1 lime
: 4 fly ash = “0.25” or 1 lime: 2 fly ash = “0.5”), the unconfined compressive strength and the
California bearing ratio decreased. In the present study, the qu-, CBR-, σt-, and the Vp-values
increased with increasing lime/fly ash ratio and the maximum values of these parameters are
at the optimum lime/fly ash-ratio, and above the optimum lime/fly ash-ratio, the values
decreased. The optimum lime/fly ash-ratio of tertiary clay and organic silt is 0.16 and 0.15,
respectively (about 1 lime: 6 fly ash by weight) and the ratio of weathered soil is 0.14 (about
1 lime: 7 fly ash by weight). This means that the ratios, in the present study, are relatively
small, as Lippendorf fly ash (off-specification type, self-cementing, and close to class C fly
ash) contains a very high CaO-content = 38.3% compared to the other types of fly ashes such
as Obra fly ash (non-self-cementing and close to class F fly ash) which contains a very low
CaO-content = 2.2%.
* In case of the three studied stabilized soils, elasticity modulus (Esecant) increased and failure
axial strain (εf) decreased as a consequence of either the separate or the joined effects of lime
and fly ash contents. The Esecant increased and the failure axial strain decreased dramatically
with the addition of both the lime and the fly ash together, especially in the case of tertiary
clay. The mechanical behavior of the three studied soils was developed from ductile to brittle.
This development was relatively weak in case of the acidic weathered soil. The development
of the mechanical behavior from ductile to brittle of the three stabilized soils was strong
through the long-term curing except the stabilized weathered soil. The qu-, Esecant-, the failure
axial strain (εf)-, CBR-, σt-, and Vp-value of both fly ash-and lime/fly ash-mixtures, for the
three studied soils, were improved through the long-term curing (180 days). The influence of
curing time was strong on the lime/fly ash-stabilization process compared to the effect on the
fly ash-stabilization process, especially tertiary clay where the improvement of lime/fly ash
tertiary clay mixtures with long-term curing was dramatic. This is due to the occurrence of
enough pozzolanic material “clay- and fly ash-particles as a source of silica and alumina” in
the mixture to react with lime in both the short- and the long-term chemical reactions and to
increase in the amount of cemintitious compounds with long-term curing. The effect of long-
term curing on fly ash- and lime/fly ash-stabilized weathered soil was weaker than the effect
on both the fly ash- and the lime/fly ash stabilized-tertiary clay and -organic silt.
* The mechanical behavior of the stabilized soils depends on different factors such as the
granular packing and the amount of cementitious compounds. Consoli et al. (2001) suggested
that tensile strength is a function of the amount of cementitious compounds formed, which
increases with curing time. The unconfined compressive strength is a function of both the

and suggestions for the future, final conclusions, Discussions9 115
granular packing and the amount of cementitious compounds where the latter increases with
curing time and the former being constant.
* The average values of the σt/qu-ratio in case of the fly ash-stabilized soils are higher than
the average value in case of the lime/fly ash-stabilized soils. This resulted from the higher qu-
values of lime/fly ash-stabilized soils compared to that of fly ash-stabilized soils (at 7 days
and at long-term curing). On the other hand, the difference between σt-values of fly ash- and
lime/fly ash-stabilized soils (at 7 days and at the long-term curing) is relatively small. This
indicates that the addition of lime to fly ash leads to an improvement and an increase in the
qu-value stronger than the σt-value.
* The correlation between qu-, CBR-, and σt-measurement (on one hand) and Vp-
measurement (on the other hand) for the three tested stabilized soils shows that the variation
of Vp-values of the three studied soils (due to the addition of lime, fly ash, and lime/fly ash
and curing for 7 days) is relatively similar to the variation of qu-, CBR-, and σt-values (see
Fig. 3.1, 4.1, 5.1, & 7.1).
* The correlation between Vp-, qu-, and Esecant-measurement of the three tested lime-, fly ash-,
and lime/fly ash-stabilized soils with long-term curing provides that the variation of Vp-
values with curing time is similar to the variation of both the unconfined compressive strength
(qu)- and the elasticity modulus (Esecant)-values. The correlation also points to the fact that the
Vp-measurement is sensitive to changes in unconfined compressive strength (qu) and
elasticity modulus (Esecant) with curing time.
* The ultrasonic testing method is a practical, simple, and fast method to evaluate lime-, fly
ash-, and lime/fly ash-stabilized soil characteristics and the soil stabilization process. It can be
applied in stabilization applications (as a non-destructive method) to estimate the uniformity
of the lime-, fly ash-, and lime/fly ash-stabilized soils on the field scale. This method requires
many investigations in the future to develop guidelines for different soils stabilized with
different chemical additives.
9.3 Hydraulic conductivity
* The compaction process without chemical additives contributed to a reduction of the K-
value of the three tested soils compared to the K-value of the natural soils. The K-value of
organic silt was strongly affected by the compaction process compared to both tertiary clay
and weathered soil. This is due to an improvement of the granular packing after the
compaction process of the organic silt which leads to better improvement compared to the
improvement of both tertiary clay and weathered soil. This is due to the fact that natural

and suggestions for the future, final conclusions, Discussions9 116
organic silt has better uniformity compared to both tertiary clay and weathered soil. The K-
value of tertiary clay was slightly influenced and reduced by the compaction.
* In the case of both fly ash- and lime/fly ash-stabilization process, the fly ash- and lime/fly
ash-addition resulted in an increment of the hydraulic conductivity for the three tested soils in
comparison to the untreated compacted soils.
* In the case of both tertiary clay and weathered soil, the addition of lime to fly ash led to a
decrement of the K-values compared to the K-values of soil-fly ash mixtures at 7 days and at
long-term curing (28, 56, and 180 days). In case of the organic silt, the addition of fly ash
alone resulted in a reduction of the K-values in comparison to the K-values of lime/fly ash-
soil mixtures. This may partly be as a result of a better improvement of the grain size
distribution (improvement of uniformity) after mixing of organic silt with the silt-fine sand
fraction fly ash alone and subsequently, better improvement of the granular packing after the
compaction process compared to the improvement of both the inorganic tertiary clay and the
weathered soil. Moreover, this is partly due to (as the early mention) a filling of the relatively
large void spaces in the organic silt with the fly ash particles where the hydration reaction was
not inhibited (in these void spaces) by organic matter (Hebit & Farrel, 2003).
* With an increase in curing time from 7 to 28 days, the hydraulic conductivity strongly
increased, where fly ash- and lime/fly ash-soil mixtures (except for the weathered soil-fly ash
mixtures) have the maximum K-values and K-value gain factors at 28 days curing.
* The increment of the hydraulic conductivity with fly ash- and lime/fly ash-addition is
explained by the development of new cementitious compounds due to pozzolanic reaction and
this leads to the formation of a new soil structure with highly open fabric arrangement
(Narasimha & Rajasekarm, 1996). The pozzolanic reaction causes an alteration in the mineral
structure of the treated stabilized soils and results in a more stable silt-sand like structure. This
structure produces a soil with a more open fabric which leads to an increase in the hydraulic
conductivity values (Nalbantoglu & Gucbilmez, 2002).
* In the present study, the maximum increase of K-value was at 28 days in case of both the fly
ash and the lime/fly ash stabilized soils (except, the K-values of fly ash-stabilized weathered
soil after 7 days were higher than the K-values after 28 days). This increase in the hydraulic
conductivity resulted from both the flocculation (after the cation exchange “short-term”
reaction, this leads to an aggregation and increase of the particles diameter) and the
pozzolanic reaction (formation of cementitious compounds and new secondary minerals). The
new cementitious compounds grow (until 28 days curing) around the particles and the
aggregates resulting in additional increase in the soil particles diameter and generation of a

and suggestions for the future, final conclusions, Discussions9 117
stabilized soil with silt-fine sand like structure (open fabric). This contributes to an increase in
the hydraulic conductivity. With an increase in the curing time, 56 and 180 days, the
hydraulic conductivity reduced. This is due to the formation of additional new cementitious
compounds within the existing pore spaces (pore spaces of the silt-fine sand like structure) of
the stabilized soil as a matrix and this is responsible for the reduction of the hydraulic
conductivity by reducing the effective pore radius with the long-term curing.
* From the above, it is clear that, the influence of lime, fly ash, and lime/fly ash on the
geotechnical properties is unique for each soil and the chemical additive. The three tested
soils are relatively inhomogenous and have relatively different microstructural properties due
to the difference of physico-chemical nature of their components. Additionally, the chemical
reactions between the soil particles and the chemical additives varied depending on the
chemical and mineralogical composition of each soil and additive.
9.4 Effect of soil type and organic matter on the stabilization process:
Inorganic tertiary clay has the strongest reactivity with the chemical additives and its
geotechnical properties were strongly improved compared to that of both the organic silt and
the weathered soil. This is because of the fact that, it contains the highest amount of clay
particles < 2µm = 47% (kaolinite, montmorillonite, and halloysite), the highest percent fines
(= 91%), the lowest organic content (= 3%), the highest specific surface area (28.53 m²/g),
and a pH-value > 7 (= 7.65) compared to the organic silt and the weathered soil. In addition,
this results from different mineralogical composition where tertiary clay contains
montmorillonite which reacts strongly with the chemical additives (lime, fly ash, and lime/fly
ash) in comparison to kaolinite and halloysite in the weathered soil and the organic silt,
respectively, which react slowly and weakly with the chemical additives (Kézdi, 1979). The
organic silt has weaker reactivity with lime and fly ash and smaller improvement of its
geotechnical properties compared to that of inorganic tertiary clay and has relatively stronger
reactivity with lime and fly ash compared to that of the acidic weathered soil. This is believed
to be caused by the inhibition of the hydration reaction by organic matter in the soil, where
organic silt contains organic content of 6.4%. Moreover, it contains relatively smaller specific
surface area (13.56 m²/g), the smallest amount of clay particles < 2µm = 6% (halloysite)
compared to a larger amount of clay particles < 2µm = 47% in the case of inorganic tertiary
clay. The weathered soil has the weakest reactivity with lime and fly ash and its geotechnical
properties were slightly improved, because it contains small amount of clay particles < 2µm =
7% (kaolinite), relatively small percent fines (= 85%), the smallest specific surface area (8.45

and suggestions for the future, final conclusions, Discussions9 118
m²/g), and its pH-value is < 7 (= 2.65). It is a problematic acidic soil. This acidic environment
of the weathered soil prevents the complete dissolution of silica and alumina from the clay-
and fly ash-particles resulting in the formation of a small amount of soluble silica and alumina
which react with calcium (lime) to form the cementitous compounds. Additionally, the
weathered soil contains natural gypsum crystals (as a source of sulfate). The presence of
sulfate led to the formation of ettringite crystals (after the compaction) which resulted in the
destruction of the compacted soil structure and subsequently, a reduction of the strength gain
development, especially with the long-term curing.
9.5 Durability
* In the case of durability (water-soaking) test, both the fly ash- and the lime/fly ash-organic
silt mixtures have the lowest strength loss (strength loss due to water-soaking process = qu-
soaked/ qu-unsoaked * 100). The fly ash- and lime/fly ash-weathered soil mixtures had the
highest strength loss. Theoretically, the vacuum saturated soaked samples should have less
strength in comparison to the strength of plain soaked samples. In the present study, some
plain soaked samples (lime/fly ash-tertiary clay, -weathered soil, and –organic silt mixtures)
have strength-values lower than the strength-values of the vacuum soaked samples, for the
same mixtures. This may be due to the fact that the trapping of air bubbles in the plain soaked
samples results in an excess internal damage during the unconfined compressive testing. All
the tested stabilized mixtures passed successively in the freeze-thaw durability test. Three
mixtures (lime/fly ash-tertiary clay and fly ash- and lime/fly ash-organic silt mixtures) passed
successively in the wet-dry durability test and the other three mixtures (fly ash-tertiary clay
and fly ash- and lime/fly ash-weathered soil mixtures) failed. Lime/fly ash-tertiary clay
mixtures are more durable than fly ash-tertiary clay mixtures. Both the fly ash- and the
lime/fly ash-organic silt mixtures are durable. In case of the wet-dry durability test, both the
fly ash-and the lime/fly ash-weathered soil mixtures failed due to the formation of ettringite
crystals, after the compaction process, which leads to destruction of the compacted soil
structure and the binding between the soil particles resulting in a reduction of the strength
gain.

and suggestions for the future, final conclusions, Discussions9 119
9.6 SEM-, XRD-, and Calorimetry-analysis
* Scanning electron microscope studies indicated that the microstructures of the tested soils
changed due to lime-, fly ash- and lime/fly ash-stabilization process and developed with the
long-term curing. The stabilization process resulted in the formation of a silt-fine sand like
structure (open fabric) characterized by a highly porous system. Additionally, the SEM-
micrograph of fly ash- and lime/fly ash-stabilized weathered soil showed rod-like crystals
(ettringite). The SEM-micrographs of natural and treated stabilized soils indicated the
formation of new cementitous compounds and mineral crystals as a pozzolanic reaction
product through the long-term curing contributed to increase the strength gain. These
cementitous compounds join the soil particles together and increase the strength gain. The
XRD-analysis confirmed that the presence of sulfate in the weathered soil led to ettringite-
formation. After 28 days moist-curing of both fly ash- and lime/fly ash-stabilized weathered
soil, the only new crystalline phase was ettringite where gypsum was consumed to form the
ettringite crystals. There is no critical volume-changes (expansion) of both the fly ash- and the
lime/fly ash stabilized weathered soil (moist-curing at 28 and 180 days) due to ettringite-
formation (the increase of the volume < 1%). The calorimetry-analysis illustrated that the high
value of CaO-content and the presence of calcite mineral in the natural organic silt
contributed to an acceleration of the hydration reaction of the optimum lime- and lime/fly ash-
organic silt mixtures. The maximum value of the heat of the hydration reaction (main peak
height) for optimum lime (3%)-organic silt mixture spanned 3.5 hours and the entire heat flow
was 59.28 J/g. The maximum value of the heat of the hydration reaction (main peak height)
for both 3% lime/20% fly ash- and 2% lime/20% fly ash-organic silt mixtures spanned 7.5
hours and the entire heat flow was 99.02 and 85.85 J/g, respectively.
* Finally, Lippendorf fly ash can be utilized to treat and stabilize the soft fine grained soils
(especially, tertiary clay and organic silt) as economical (cheaper) alternative to Portland
cement and other (expansive) chemical stabilizers. The use of fly ash for stabilization
applications is an environmental solution of the problems associated with its disposal process.
9.7 Emphasis
1- The use of hydrated lime alone is very suitable to stabilize the clayey soil which has a high
amount of clay particles and high plasticity index.
2- The use of self-cementing (close to class C) fly ash alone is suitable to stabilize the fine
grained soils which contain low amount of clay particles and high amount of silt particles
such as organic silt.

and suggestions for the future, final conclusions, Discussions9 120
3- The use of self-cementing or non-self cementing fly ash (close to class F) with lime is
valuable to stabilize the fine grained soils, whether they contain low or high amount of clay
particles, where the additional fly ash (pozzolanic material) is a source of the silica and the
alumina which react with lime. In this case, the soil type has relatively less importance,
whereas the reaction is between the fly ash and the lime.
4- In case of the clayey soil, the addition of fly ash content above 20% does not result in a
further improvement of the geotechnical properties.
5- Sulfate content of fly ash must be not more than 10%, when fly ashes (having sulfate
contents of 5 to 10 percent) have lower rate of initial hydration and the compaction delay has
less influence on the compressive strengths. If fly ash contains sulfate content above 10%,
high initial strengths have been observed, however, durability may be dramatically reduced.
Furthermore, during initial hydration, there is a possibility to form ettringite crystals leading
to expansion (Ferguson, 1993). Other investigators (i.e. Thomas & White, 2003) reported that
sulfate content of fly ash must be not more than 5%.
6- Sulfate (Gypsum) bearing soil (such as weathered soil), treated with lime, requires to
special technical methods in situ. National Lime Association (2004) reported that these
technical methods in situ include “two applications of lime, the first before the first mixing
and the second after the mellowing period. The moisture content of the soil is raised to 5%
over the optimum during a multi-day mellowing period to soluble as many as sulfates as
possible and to force ettringite to form before compaction. Once formed, ettringte is relatively
stable and is unlikely to cause further problems. After the mellowing period, additional lime is
added to the soil and construction proceeds normally”.
7- The acidic soil (pH-value < 7) is a problematic soil and needs a relatively more amount of
lime and fly ash to treat.
9.8 Suggestions for the future:
* The use of fly ash for chemical soil-stabilization in Germany requires many investigations
in the future including classification and identification of the different fly ash-types which
derive from different sources of coal. Furthermore, various studies would be required to
evaluate the use of fly ash to treat and stabilize different soil-types and to establish German
guidelines and standard specifications for the fly ash- and lime/fly ash-stabilization process.
* The use of ultrasonic p-wave velocity method is a simple and practical (non-destructive)
tool to evaluate the stabilized soils using lime, fly ash, and lime/fly ash and would need many
studies to establish a guideline and standard specification.

References 121
sReference
AASHTO (1997): Standard Specification for Transportation Materials and Methods of Sampling and Testing, part II tests. American Association of State Highway and Transportation Officials, Washington, DC.
AASHTO (2000): Standard Guide for Transportation Materials and Methods of Sampling and Testing, part 2- tests. American Association of State Highway and Transportation Officials, 20 th edition, Washington, DC., pp. 1015-1029.
Abdi M.R. & Wild S. (1993): Sulphate expansion of lime-stabilized Kaolinite: Part I. Physical Characteristics. Clay Minerals, Vol. 28, pp. 555-567.
Acosta H.A. (2002): Stabilization of soft subgrade soils using fly ash. M.Sc. Thesis, University of Wisconsin-Madison.
American Coal Ash Association, ACAA, Inc. (1995): Fly Ash Facts for Highway Engineers, Office of Technology Applications, Washington, DC.
Ampera B. & Aydogmus T. (2005): Recent experiences with cement and lime-stabilization of local typical poor cohesive soil. Geotechnik-Kolloquium Freiberg, March 11, 2005, Heft 2005-2, pp. 121-144.
Anon (1985): Lime Stabilization Construction Manual. Eighth Edition. National Lime Association, Arlington, Va.
Anon (1990): Lime Stabilization Manual. British Aggregate Construction Materials Industry, London.
Arman A. & Munfakh G.A. (1972): Lime Stabilization of Organic Soils. Transportation Research Board, Washington, DC., No. 381, pp. 37-45.
ASTM (1992): Standards on Soil Stabilization with Admixtures. American Society of Testing Material, West Conshohocken, Pa.
ASTM C593 (2001): Standard specification for fly ash and other pozzolans for use with lime. Annual Book of ASTM Standards, Vol. 04.01, ASTM, Philadelphia, Pa.
ASTM C618 (1998): Standard specification for coal fly ash and raw or calcined natural pozzolan for use as a mineral admixture in concrete. ASTM, West Conshohocken, Pa.
ASTM D559 (1989): Standard test methods for wetting and drying compacted soil-cement mixtures. Annual Book of ASTM Standards, Vol. 04.08, ASTM.
ASTM D560 (1989): Standard test methods for freezing and thawing compacted soil-cement mixtures. Annual Book of ASTM Standards, Vol. 04.08, ASTM.
ASTM D5239 (2001): Standard practice for characterizing fly ash for use in soil stabilization. Annual Book of ASTM Standards, Vol. 04.08, ASTM, Philadelphia, Pa.

References 122
Baghdadi Z.A., Fatani M.N., & Sabban N.A. (1995): Soil modification by cement kiln dust. Journal of Materials in Civil Engineering, Vol. 7, No. 4, pp. 218-222.
Bogdan B., Kenneth M., & Mysore N. (2002): Identification and stabilization methods for problematic silt soils. North-central section (36 th) and South-eastern section (51 st), GSA Joint Annual Meeting (April 3-5, 2002), Geologic Hazards (Posters).
Beeghly J.H. (2003): Recent Experiences with Lime-Fly Ash Stabilization of Pavement Sub-grade Soils, Base, and Recycled Asphalt. Proceedings of International Ash Utilization Symposium, 2003, Lexington, Ky., 0-967 4971-5-9, pp. 435-452.
Bell F.G. (1996): Lime stabilization of clay minerals and soils. Engineering Geology, Vol. 42, No. 4, pp. 223-237.
Bellaloui A., Tagnit-Hamou A., & Ballivy G. (2002): Physicochemical behavior of cement kiln dust and fly ash mixtures. Canadian Geotechnical Journal, Vol. 39, No. 4, pp. 960-970.
Braga Reis M.O. (1981): Formation of expansive calcium sulphate aluminate, the action of sulphate ion on weathered granites in a calcium hydroxide saturated medium. Cement and Concrete Research, 11, pp. 451-547.
Brandl H. (1981): Alteration of soil parameters by stabilization with lime. Proceedings of the 10 th International Conference on Soil Mechanics and Foundation Engineering, Stockholm, Sweden, pp. 587-594.
Bowles J. (1992): Engineering properties of soil and their measurements. McGraw-Hill Boston, 4 th edition.
Burkart B., Gross G.C., & Kern J.P. (1999): The role of gypsum in production of sulfate-induced deformation of lime-stabilized soils. Environmental & Engineering Geoscience, Vol. 5, No. 2, pp. 173-187.
Carig R.F. (1997): Soil Mechanics. London & New York (E & FN Spon), 6 ed., 485p.
Choquette M., Berube M.A., & Locat J. (1987): Mineralogical and microtextural changes associated with lime stabilization of marine clays from Eastern Canada, Applied Clay Science, Vol. 2, pp. 215-232.
Chu S.C. & Kao H.S. (1993): A study of engineering properties of a clay modified by fly ash and slag. Fly Ash for Soil Improvement-Geotechnical Special Publication, Vol. 36, pp. 89-99.
Chu T.Y., Davidson D.T., Goecker W.L., & Moh Z.C. (1955): Soil stabilization with lime-fly ash mixture, preliminary studies with silty and clayey soils. Highway Research Board, Bulletin 108, pp. 102-111.
Cockrell C.F. & Leonard J.W. (1970): Characterization and utilization studies of limestone modified fly ash. Coal Research Bureau, Vol. 60.
ÇokÇa E. (2001): Use of class C fly ashes for the stabilization of an expansive soil. Journal of Geotechnical and Geoenvironmental Engineering, Vol. 127, No. 7, pp. 568-573.

References 123
Consoli N.C., Prietto P.D.M., Carraro J.A.H., & Heineck K.S. (2001): Behavior of compacted soil-fly ash-crabide lime mixtures. Journal of Geotechnical and Geoenvironmental Engineering, Vol. 127, No. 9, pp. 774-782.
Collins R.J. & Ciesielki S.K. (1992): Highway construction use of wastes and by-products. Utilization of Waste Materials in Civil Engineering Construction, published by ASCE, New York, N.Y., pp. 140-152.
Collins R.J. & Ciesielski S.K. (1994): Recycling and use of waste materials and by-products in highway construction. National Cooperative Highway Research Program Synthesis of Highway Practice 199, Transportation Research Board, Washington, DC.
Croft J.B. (1964): The processes involved in the lime stabilization of clay soils. Proc. Aust. Road Research Board, 2, part 2, pp. 1169-1203.
Das B. (1993): Principles of soil Dynamics. PWS-Kent Publishing Company, Boston.
Das B. (1994): Principles of Geotechnical Engineering. PWS-Kent Publishing Company, Boston, 3 rd ed.
Diamond S., White J.L., & Dolch W.L. (1964): Transportation of clay minerals by calcium hydroxide attack. Clays, Clay Minerals, Vol. 12, pp. 359-379.
DIN 10 60 (1995): Baukalk-Definitionen, Anforderungen, Ueberwachung. DIN 10 60 (1), Bundesverband der Deutschen Ziegelindustrie e.V.
DIN-Taschenbuch 113, Erkundung und Untersuchung des Baugrunds (1998): Bestimmung der Wassergehalt durch Ofentrockung. DIN 18 121-1, Deutsches Institute fuer Normung e.V., Wiesbaden, S. 253-256.
DIN-Taschenbuch 113, Erkundung und Untersuchung des Baugrunds (1998): Zustandgrenetzen (Konsistenzgrenzen), Bestimmung der Fliss- und Ausrollgrenze. DIN 18 122-1, Deutsches Institute fuer Normung e.V., Wiesbaden, S. 264-270.
DIN-Taschenbuch 113, Erkundung des Baugrunds (1998): Bestimmung der Korngroessenverteilung. DIN 18 123-1, DIN e.V., Wiesbaden, S. 273-284.
DIN-Taschenbuch 113, Erkundung des Baugrunds (1998): Bestimmung der Korndichte Kapillarpyknometer-Weithalspyknometer. DIN 18 124, DIN e.V., Wiesbaden, S. 285-290.
DIN-Taschenbuch 113, Erkundung des Baugrunds (1998): Proctorversuch. DIN 18 127, DIN e.V., Wiesbaden, S. 313-328.
DIN-Taschenbuch 113, Erkundung des Baugrunds (1998): Bestimmung des Gluehverlusts. DIN 18 128, DIN e.V., Wiesbaden, S. 329-331.
DIN-Taschenbuch 113, Erkundung des Baugrunds (1998): Bestimmung des Wasserdurchlaessigkeitsbeiwerts-teil 1 : Laborversuch. DIN 18 130-1, DIN e.V., S. 336-355.
DIN-Taschenbuch 113, Erkundung des Baugrunds (1998): Einaxialer Druckversuch. DIN 18 136, DIN e.V., Wiesbaden, S. 372-375.
References 124
DIN-Taschenbuch 113, Erkundung des Baugrunds (1998): Bodenklassifikation fuer bautechnische Zwecke. DIN 18 196, DIN e.V., Wiesbaden, S. 409-412.
Eades J.L. & Grim R.E. (1960): Reaction of hydrated lime with pure clay minerals in soil stabilization. Highway Research Record, Highway Research Board, Bulletin 262, pp. 51-63.
Eades J.L. & Grim R.E. (1966): A quick test to determine lime requierments for lime stabilization. Highway Research Record, Highway Research Board, National Research Council, Washington, DC., Bulletin 139, pp. 61-72.
Edil T., Benson C., Shafique S., Tanyu B., Kim W., & Şenol A. (2002): Field evaluation of construction alternatives for roadway over soft subgrade. INTERIM REPORT, Geotechnical Engineering Report, 02-04. Madison, Wisconsin.
Egyptian Code (1995): Egyptian Code for Soil Mechanics and Fundation-design. Part 5, Founfation on the problematic soil, Third Edition, 109p.
Einsele G. & Lempp C. (1981): Ursache und Einfluss der Entfestigung veraenderlich-fester Gesteine auf die Tragfaehigkeit des Erdplanums. Forschung Strassenbau und Strassenverkehrstechnik, Herausgegeben vom Bundesminister fuer Verkehr, Abteilung Stassenbau, Bonn-Bad Godesberg, Heft 330, S. 1-101.
Encarta Worldatlas (1998): Encarta Worldatlas published by Microsoft Corporation.
Fecker E. & Reik G. (1996): Baugeologie. 2. durchgesehene Auflage, Ferdinand Enke Verlag Stuttgart, 429s.
Ferguson G. (1993): Use of self-cementing fly ash as a soil stabilizing agent. Geotechnical Special Publication, No. 36, ASCE, New York, N.Y., pp. 1-15.
FGSV: TPBF-StB, teil B 7.1 (1988): CBR-Versuch, Technische Pruefvorschriften.
FGSV: TPBF-StB, teil B 11.1 (1986): Eignungspruefungen bei Bodenverfestigungen mit Zement, Technische Pruefvorschriften.
FGSV: TPBF-StB, teil B 11.5 (1991): Eignungspruefungen bei Bodenverbesserungen und Bodenverfestigungen mit Feinkalk und Kalkhydrat, Technische Pruefvorschriften.
FGSV (1997): Merkblatt fuer Bodenverfestigungen und Bodenverbesserungen mit Bindemitteln, Forschungsgesellschaft fuer Strassen- und Verkehrswesen e.V. Koeln.
Fleureau J.M., Verbrugge J.C., Huergo P.J., Correia A.G., & Kheirbek-Saoud S.K. (2002): Aspects of the behaviour of compacted clayey soils on drying and wetting paths. Canadian Geotechnical Journal/ Rev. Can. Geotech., Vol. 39, N0. 6, pp. 1341-1357.
Free-Hewish R.J., Ghataora G.S., & Niazi Y. (1999): Stabilization of desert sand with cement kiln dust plus chemical additives in desert road construction. Proceedings of the Institution of Civil Engineers-Transport, Vol. 135, No. 1, pp. 29-36.

References 125
Geologisches Landesamt (1993): Geologische Uebersichtskarte von Sachen-Anhalt, Geologisches Landesamt Sachen-Anhalt, 1: 400 000, ISBN 3-929951-00-2, 1. Auflage, Halle/Saale.
Geologische Landesamt (1999): Uebersichtskarte Baugrund, 1: 25 000, Blatt 4337 Groebzig, Geologisches Landesamt Sachen-Anhalt, ISBN 3-929951-21-5, 2. Auflage, Halle/Saale.
Geosystems Engineering Inc., Ferguson G., & Lavorson S.M. (1999): Soil and pavements base stabilization with self-cementing coal fly ash. Published by ACAA, Virginia.
Gesellschaft fuer Grundbau und Umwelttechnik, GGU-Software (1996): Laboratory analysis, http:www.ggu-software.com, distribution by Civilserve GmbH.
Gesellschaft fuer Grundbau und Umwelttechnik, GGU-Software (2002): Geotechnical computation, http:www.ggu-software.com, distribution by Civilserve GmbH.
Gromko (1974): Review on expansive soil. Journ. ASCE, Geotechnical Div., Vol. 100, GT6, pp. 667-687.
Hampton M.B. & Edil T.B. (1998): Strength gain of organic ground with cement-type binders. Geotechnical Special Publication, No. 81, Soil Improvement for Big Digs, edited Maher, A., and Yang, D., S.
Handy R.L. (1994): Feasibility of drilled lime stabilization for the Oxbow, ND Landslide. U.S. Army Crops of Engineers, st. Paul District.
Hardt G. (1985): Basisabdichtungen aus Ton, Veroeffentlichungen des Grundbauinstitutes der Landesgewerbeanstalt Bayern. Heft 44, S. 47-68.
Heilek M. (2002): Verfestigung von Boeden mit Bindemitteln, Systematische Auswertung regionaler Erfahrungen. Diplomarbeit Bauhaus-Universitaet Weimar, Professur Grundbau, unpublished.
Hughes P. & Glendinning S. (2004): Deep dry mix ground improvement of a soft peaty clay using blast furnace slag and red gypsum. Quarterly Journal of Engineering Geology and Hydrogeology, 37, pp. 205-216.
Hunter D. (1988): Lime-induced heave in sulphate bearing clay soils. ASCE, Journal of Geotechnical Engineering, Vol. 114, No. 2, pp. 150-167.
Indraratna B., Balasubramaniam A.S., & Khan M.K. (1995): Effect of fly ash with lime and cement on the behavior of soft clay. Quarterly Journal of Engineering Geology, Vol. 28, part 2, pp. 131-142.
Ismail A.I.M. (2004): Engineering and petrological characteristics of clayey silt soils to be used as road base and their improvement by lime and cement. Doctoral work Thesis, Mathematisch-Naturwissenschaftliche Fakultaet der Technischen Universitaet Clausthal.
ISRM (1978): Suggested methods for determining tensile strength of rock materials. International Society for Rock Mechanics, Commission on Standardization of Laboratory and Field Tests, Vol. 15, pp. 99-103.
References 126
Kézdi Á. (1979): Stabilized earth roads. Amsterdam, Oxford, New York (Elsevier), 327p.
Lamb J.H. (1985): Type C fly ash and clay stabilization. Developments in New and Existing Materials, published by ASCE, edited by Haston, J.S., pp. 20-25.
Lav A.H. & Lav M.A. (2000): Microstructural development of stabilized fly ash as pavement base material. Journal of Materials in Civil Engineering, Vol. 12, No. 2, pp. 157-163.
Lee S. & Fishman K. (1992): Improved resilient modulus realized with waste product mixtures, Geotechnical Special Publication, No. 30, Grouting, Soil improvement and Geosynthetics, Vol. 2, edited by Borden, R. and Holtz, R., published by ASCE, New York.
Lin C. & Zhang X. (1992): Use of cement kiln dust, fly ash, and recycling technique in low-volume road rehabilitation. Transportation Research Record, No. 1345, pp. 19-27.
Little D.N. (1987): Fundamentals of the stabilization of soil with lime. National Lime Association, Bulletin 332, Arlington, Virginia.
Lo S.R. & Wardani S.P.R. (2002): Strength and dilatancy of a silt stabilized by a cement and fly ash mixture. Canadian Geotechnical Journal/ Rev. Can. Geotech., Vol. 39, No. 1, pp. 77-89.
Locate J., Tremblay H., & Leroueil S. (1996): Mechanical and hydraulic behaviour clay treated with lime. Canadian Geotechnical Journal, Vol. 33, pp. 654-669.
Maidl B. (1988): Handbuch des Tunnel- und Stollenbaus, Bd. II: Grunglagen und Ausfuehrung. 364s., 216 Bild., 41 Tab., Anhang, Essen (Glueckauf).
Mandal J.N & Divshikar D.G. (1995): Soil Testing in Civil Engineering, Civil Engineering Department, Indian Institute of Technology, Powai, Bombay-400076, India. AA. Balkerma, P.O. Box 1675, 3000 BR, Rotterdam, Netherlands. 249p.
Marks B.D. & Haliburton, T.A. (1972): Acceleration of lime-clay reactions with salt, Journal of Soil Mechanics and Foundatons Division, ASCE, 98, No. SM4, P. 327.
Material and Tests Division, Geotechnical Section (2002): Design procedures for soil modification or stabilization, Material and Tests Division, Geotechnical Section, Indiana.
McDowell C. (1959): Stabilization of soils with lime, lime/fly ash and other lime reactive materials. Highway Research Board, Bulletin 231, Washington, DC, pp. 60-66.
Mclntire P. (1991): Non-destructive Testing Handbook, Vol. 7, Ultrasonic Testing. American Society of Non-destructive Testing, Columbus, Ohio.
Meyers J.F., Pichumani R., Kapples B.S., & US Department of Transportation (1976): Fly ash as a Construction Material for Highways. Report No. FHWA-IP-76-16, Washigton, DC.
Mitchell J.K. (1986): Practical problems from surprising soil behavior, Journal of Geotechnical Engineering Division, ASCE, Vol. 112, No. 3, P. 259.

References 127
Mitchell J.K. (1986): Delayed failure of lime-stabilized pavement bases. Journal of Geotechnical Engineering Division, ASCE, Vol. 112, pp. 274-279.
Mitchell J.K., (1993): Fundamentals of soil behavior, Second Edition, University of California, Berkeley. John Wiley & Sons, Inc. 437p.
Muntohar A.S. & Hantoro G. (2000): Influence of Rice Husk Ash and Lime on engineering properties of a clayey sub-grade. ejge paper 2000-094, http://www.ejge.com/2000/Ppr0019/Ppr0019.htm.
Nalbantoglu Z., (2001): Use of a self-cementing fly ash as a soil stabilization agent. Iranian Journal of Science and Technology, Vol. 25 (B4), pp. 691-698.
Nalbantoglu Z. & Gucbilmez E. (2001): Improvement of calcareous expansive soils in semi-arid environments. Journal of Arid and Environments, Vol. 47, No. 4, pp. 453-463.
Nalbantoglu Z. & Gucbilmez E. (2002): Utilization of an industrial waste in calcareous expansive clay stabilization. Geotechnical Testing Journal, Vol. 25, No. 1, pp. 78-84.
Nablantoglu Z. & Tuncer E. (2001): Compressibility and hydraulic conductivity of a chemically treated expansive clay. Canadian Geotechnical Journal/ Rev. Can. Geotech. Vol. 38, No. 1, pp. 154-160.
Nagaraj T.S. & Miura N. (2001): Soft clay behaviour, Analysis and Assessment. AA. Balkema/ Rotterdam/ Brook Field. 315p.
Narasimha Rao S. and Rajasekaran G. (1992): Behaviour of lime piles in a soft marine clay, International Conference on Deep Foundations. Practice incorporating pile Talk, 92, Nov. 4-6, Singapora, pp. 185-192.
Narasimha Rao S. & Rajasekaran G. (1996): Reaction products formed in lime-stabilized marine clays. Journal of Geotechnical Engineering, ASCE, Vol. 122, No. 5, pp. 329-336.
National Lime Association (2004): Lime-treated Soil Construction Manual, Lime Stabilization & Lime Modification. National Lime Association, Bulletin 326, pp. 1-41.
Nicholson P. & Kashyap V. (1993): Fly ash stabilization of tropical Hawaiian soils, Geotechnical Special Publication, No. 36, ASCE, New Work, N.Y., pp. 15-29.
Nicholson P., Kashyap V., & Fuji C. (1994): Lime and fly ash admixture improvement of tropical Hawaiian soils. Transportation Research Record, Washington, DC, No. 1440, pp. 71-78.
Ormsby W.C. & Kinter E.B. (1973): Effects of dolomitic and calcitic limes on strength development in mixtures with two clay minerals. Public Roads, 37, pp. 149-160.
Parson R.L. & Milburn J.P. (2003): Engineering behavior of stabilized soils, Transportation research record, Journal of the Transportation Research Board, Washington, DC- 0361-1981, pp. 20-29.
References 128
Poellmann H., Kuzel H.J., & Meyer H.W. (1991): The usage of heat-flow calorimetry in cement chemistry- Construction and application of a low coast high-sensitive calorimeter, Proc. XIIIth Int. Con. On Cement Micr. Tampa, (edited by J. Bayles, G. R. Gouda & A. Nisperos), pp. 254-272.
Prakash K. & Sridharan A. (1989): Lime stabilization and curing effects on the index and compaction characteristics of a montmorillonitic soil. Journal of Southeast Asian Geotechnical Society, Vol. 20, No. 1, pp. 39-47.
Qubain B.S., Seksinsky E.J., & Li J.C. (2000): Incorporating subgrade lime stabilization into pavement design. Geomaterials, Transportation Research Record, (1721), pp. 3-8.
Rajasekaran G., Murali K., & Srinivasarghavan R. (1997): Fabric and mineralogical studies on lime treated marine clays. Ocean Engineering, Vol. 24, No. 3, pp. 227-234.
Rajsekaran G. & Narasimha Rao S. (1998): Particle size analysis of lime-treated marine clays. Geotechnical Testing Journal, Vol. 21, No. 2, pp. 109-119.
Ramiah B.K. & Chickanagappa L.S. (1990): Handbook of Soil Mechanics and Foundation Engineering. Second Edition, AA. Balkemal/ Rotterdam, 576p.
Rao A.S., Phanikumar B.R., & Sharma R.S. (2004): Prediction of swelling characteristics of remoulded and compacted expansive soils using free swell index, Quarterly Journal of Enginering Geology and Hydrology, 37, pp. 217-226.
Rogers C.D.F. & Glendinning S. (2000): Lime requirement for stabilization. Geomaterials, Transportation Research Record, (1721), pp. 9-18.
Sahu B.K. (2001): Improvement in California bearing ratio of various soils in Botswana by fly ash. Proceedings of the 2001 International Ash Utilization Symposium, October 22, 2001, Lexington, Ky., 0-9674971-4-0, pp. 22-24.
Hebit S. & Farrel E.R. (2003): Some experiences on the stabilization of Irish peats. Canadian Geotechnical Journals, Vol. 40, pp. 107-120.
Şenol A., Bin-shafique, Edil T.B., & Benson C.H. (2002): Use of class C fly ash for stabilization of soft subgrade. Fifth International Congress on Advances in Civil Engineering, 25-27 September 2002, Istanbul Technical University, Istanbul, Turkey.
Shi C., Wu Y., & Riefler C. (2004): The use of crushed limestone dust in production of self-consolidating concrete and the materials for sustainable development, American Concrete Institute, Committee Concrete with Recycled Materials 2.print, 2004. ACI International SP. 219, 0-87031-142-5, pp. 115-129.
Shirazi H., (1999): Field and laboratory evaluation of the use of lime and fly ash to replace soil cement as a base course. Seventh international conference on low-volume Roads, Vol. 1, Transportation Research Record, (1652), pp. 270-275.
Sivapullaiah P.V., Sridharan A., & Ramesh H.N. (2000): Strength behaviour of lime-treated soils in the presence of sulphate. Canadian Geotechnical Journal/ Rev. Can. Geotech. Vol. 37, No. 6, pp. 1358-1367.

References 129
Sloane R.L. (1965): Early reaction determination in two hydroxide-kaolinite systems by electron microscopy and diffraction. Proceedings, 13 th National Conference on Clays and Clay Minerals, New York, Pergamon press, pp. 331-339.
Sridharan A., Sivapullaiah P.V., & Ramesh H.N. (1995): Consolidation behaviour of lime treated sulphate soils. Proceedings of the International Symposium on Comprssion and Consolidation of clayey soils, Hiroshima, Japan, Vol. 1, pp. 183-188.
Tensar Technical Note, TTN (1998): Chemical and mechanical stabilization of subgrades and flexible pavement sections. TTN, BR 10, July 1998.
Terashi M., Tanak H., Niidome Z., & Sakanoi H. (1980): Permeability of treated soils. Proceedings of the 15 th Japan Conference on Soil Mechanics and Foundation Engineering, pp. 773-776.
Thomas Z.G. & White D.J. (2003): Engineering properties of self-cementing fly ash subgrade mixtures. Proceedings of the International Ash Utilization Symposium, Lexington, pp. 346-378.
Thompson M.R. (1966): The split-tensile strength of lime-stabilized soil. Record No. 92, Highway Research Board, Washington, DC.
Townsend D.C. & Kylm T.W. (1966): Durability of lime-stabilized soils. Highway Research Board, Bulletin No. 139, pp. 25-41.
TRB (1987): Lime stabilization: Reaction, Properties, Design, and Construction. State of the Art Report 5, Transportation Research Board, National Research Council, Washington, DC.
Tremblay H., Duchesne J., Locate J., & Leroueil S. (2002): Influence of the nature of organic compounds on fine soil stabilization with cement. Canadian Geotechnical Journal/ Rev. Can. Geoch. Vol. 39, No. 3, pp. 535-546.
Tremblay H, Leroueil S., & Locate J. (2002): Mechanical improvement and vertical yield stress prediction of clayey soils from eastern. Canadian Geotechnical Journal/ Rev. Can. Geoch. Vol. 38, No. 3, pp. 567-579.
Tuncer J.P. (1997): Evaluation of western caol fly ashes for stabilization of low-volume roads. Testing Soil Mixed with Waste or Recycled Materials, ASTM, STP 1275, American Society of Testing and Materials, pp. 157-171.
U.S. Army, U.S. Navy, & U.S. Air Force (2005): Soil stabilization for pavements, University press of the pacific, Honolulu, Hawaii.
Virendra S. & Narendra K. (1997): Use of fly ash in base and subbase of roads. Proceedings of the International Conference on Soil Waste Technology and Management, Vol. 1.
Vosteen B. (1998): Geschichte des Strassen- und Verkehrswesens- Die Behandlung von Boeden mit Bindemitteln in der Bundesrepublik Deutschland, Ein Rueckblick-teil 1 (6), S. 304-311.

References 130
Vosteen B. (1999): Geschichte des Strassen- und Verkehrswesens- Die Behandlung von Boeden mit Bindemitteln in der Bundesrepublik Deutschland, Ein Rueckblick-Teil 2 (4), S. 197-202.
Wang L., Roy A., Seals R.K., & Metcalf J.B. (2003): Stabilization of sulfate-containing soil by cementitious mixtures mechanical properties. Transportation research record, Journal of the Transportation Research Board, Washigton, DC., 0361-1981, pp. 12-19.
Weber A. (2001): Verformungs- und Festigkeitseigenschaften von verbessertem Loesslehm. Diplomarbeit, Bauhaus-Universitaet Weimar, Professur Grundbau, unpublished.
Wild S., Abdi M.R., & Lengward G. (1993): Sulfate expansion of lime-stabilized kaolinite. 2. Reaction-Products and expansion. Clay Minerals, Vol. 28, No. 4, pp. 569-583.
William Powrie (1997): Soil mechanics: Concepts and Applications, published by E & FNSpon, an imprint of Chapman & Hall, 2-6 Boundary Row, London SE1 & HN, UK, ISBN 0419 197206, 420p.
Witt K.J. (2002): Zement-Kalk-Stabilizierung von Boeden. Geotechnik Seminar Weimar, Schriftenreihe Geotechnik, Heft 5, S. 1-12, Bauhaus-Universitaet Weimar.
Yesiller N., Hanson J.L., Rener A.T., & Usmen M.A. (2001): Ultrasonic Testing for evaluation of stabilized mixtures. Geomaterials, Transportation Research Record, (1757), pp. 32-39.
Yoder E.J. & Witczak M.W. (1975): Principles of pavement Design. John Wiley & Sons, New Work.
Yusuf F.A.M.S., Little D.N., & Sarkar S.L. (2001): Evaluation of structural contribution of lime stabilization of subgrade soils in Mississippi. Geomaterials, Transportation Research Record, (1757), pp. 22-31.
Zhang J.R. & Cao X. (2002): Stabilization of expansive soil by lime and fly ash. Journal of Wuhan University of Technology, Materials Science Edition, Vol. 17, No. 4, pp. 73-77.

131
Appendixes (from No. 1 to No. 30
Appendix (1a) X-ray powder diffractogram of Lippendorf fly ash.
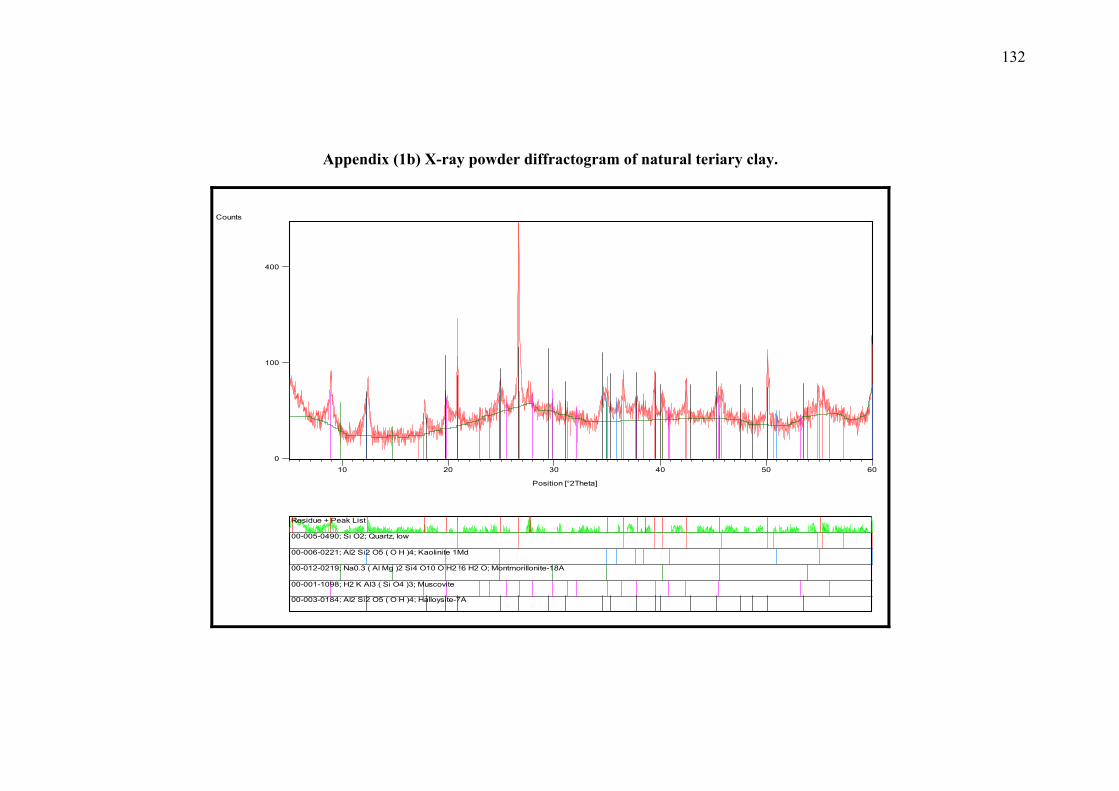
132
Appendix (1b) X-ray powder diffractogram of natural teriary clay.
Position [°2Theta]
10 20 30 40 50 60
Counts
0
100
400
Residue + Peak List
00-005-0490; Si O2; Quartz, low
00-006-0221; Al2 Si2 O5 ( O H )4; Kaolinite 1Md
00-012-0219; Na0.3 ( Al Mg )2 Si4 O10 O H2 !6 H2 O; Montmorillonite-18A
00-001-1098; H2 K Al3 ( Si O4 )3; Muscovite
00-003-0184; Al2 Si2 O5 ( O H )4; Halloysite-7A

133
Appendix (2) X-ray powder diffractogram of natural organic silt
Position [°2Theta]
10 20 30 40 50 60
Counts
0
100
400
natural organic silt
Residue + Peak List
01-072-1937; Ca C O3; Calcite
01-083-0539; Si O2; Quartz
00-002-0467; K Al2 ( Si3 Al ) O10 ( O H , F )2; Muscovite
00-003-0184; Al2 Si2 O5 ( O H )4; Halloysite-7A

134
Appendix (3) X-ray powder diffractogram of natural weathered soil
Position [°2Theta]
10 20 30 40 50 60 70
Counts
0
100
400
900
Natural weathered soil
Residue + Peak List
01-089-8936; Si O2; Quartz $GA
00-007-0032; K Al2 Si3 Al O10 ( O H )2; Muscovite 2M1, syn
00-006-0221; Al2 Si2 O5 ( O H )4; Kaolinite 1Md
00-033-0311; Ca S O4 !2 H2 O; Gypsum, syn
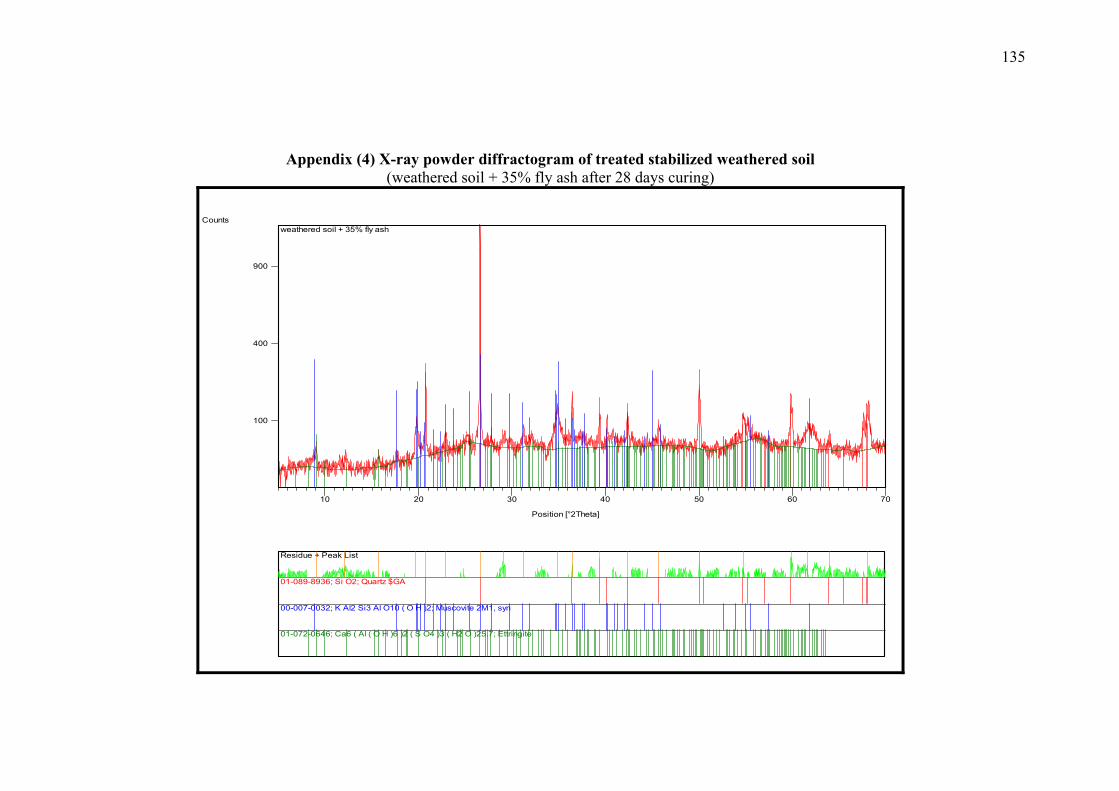
135
Appendix (4) X-ray powder diffractogram of treated stabilized weathered soil
(weathered soil + 35% fly ash after 28 days curing)
Position [°2Theta]
10 20 30 40 50 60 70
Counts
100
400
900
weathered soil + 35% fly ash
Residue + Peak List
01-089-8936; Si O2; Quartz $GA
00-007-0032; K Al2 Si3 Al O10 ( O H )2; Muscovite 2M1, syn
01-072-0646; Ca6 ( Al ( O H )6 )2 ( S O4 )3 ( H2 O )25.7; Ettringite
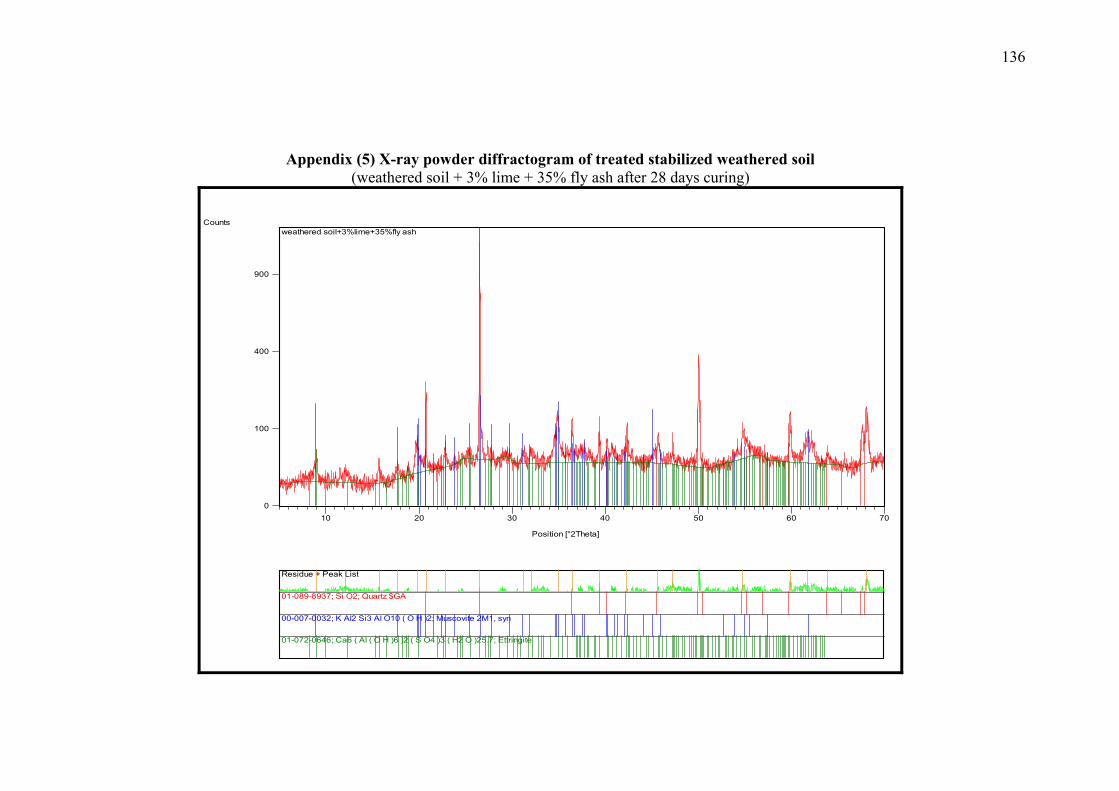
136
Appendix (5) X-ray powder diffractogram of treated stabilized weathered soil (weathered soil + 3% lime + 35% fly ash after 28 days curing)
Position [°2Theta]
10 20 30 40 50 60 70
Counts
0
100
400
900
weathered soil+3%lime+35%fly ash
Residue + Peak List
01-089-8937; Si O2; Quartz $GA
00-007-0032; K Al2 Si3 Al O10 ( O H )2; Muscovite 2M1, syn
01-072-0646; Ca6 ( Al ( O H )6 )2 ( S O4 )3 ( H2 O )25.7; Ettringite
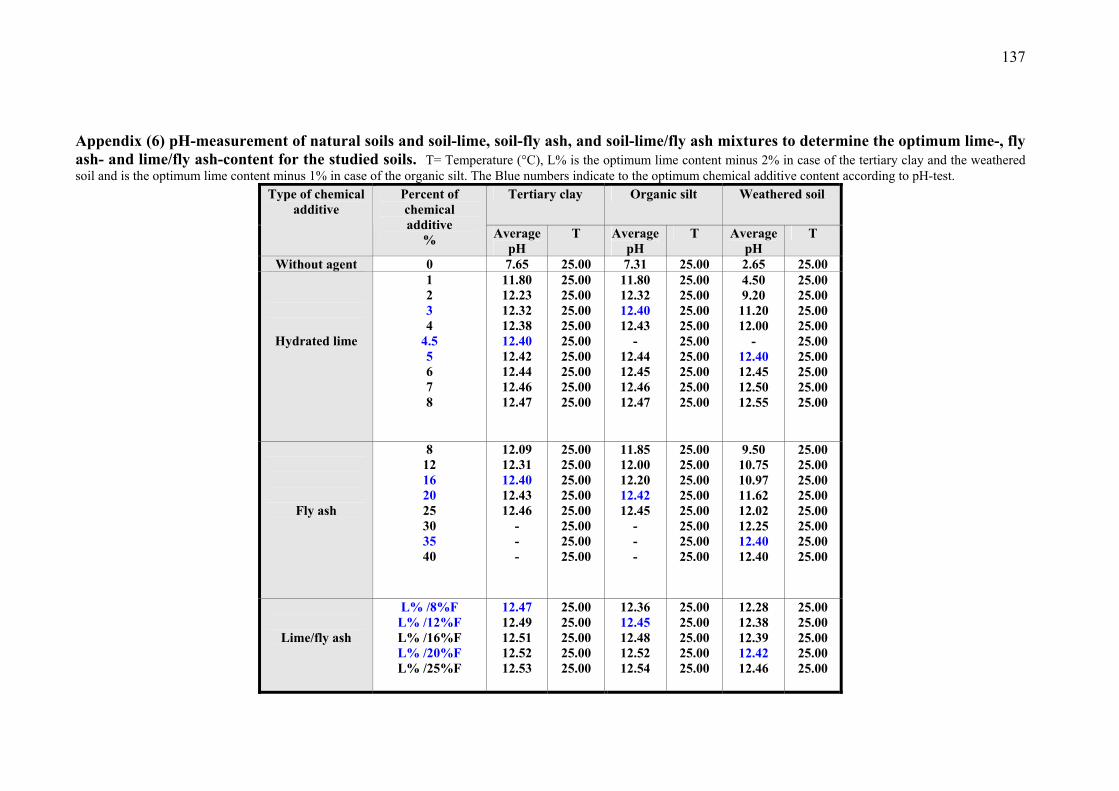
137
Appendix (6) pH-measurement of natural soils and soil-lime, soil-fly ash, and soil-lime/fly ash mixtures to determine the optimum lime-, fly ash- and lime/fly ash-content for the studied soils. T= Temperature (°C), L% is the optimum lime content minus 2% in case of the tertiary clay and the weathered soil and is the optimum lime content minus 1% in case of the organic silt. The Blue numbers indicate to the optimum chemical additive content according to pH-test.
Tertiary clay Organic silt Weathered soil Type of chemical additive
Percent of chemical additive
% Average pH
T Average pH
T Average pH
T
Without agent 0 7.65 25.00 7.31 25.00 2.65 25.00
Hydrated lime
1 2 3 4
4.5 5 6 7 8
11.80 12.23 12.32 12.38 12.40 12.42 12.44 12.46 12.47
25.00 25.00 25.00 25.00 25.00 25.00 25.00 25.00 25.00
11.80 12.32 12.40 12.43
- 12.44 12.45 12.46 12.47
25.00 25.00 25.00 25.00 25.00 25.00 25.00 25.00 25.00
4.50 9.20
11.20 12.00
- 12.40 12.45 12.50 12.55
25.00 25.00 25.00 25.00 25.00 25.00 25.00 25.00 25.00
Fly ash
8 12 16 20 25 30 35 40
12.09 12.31 12.40 12.43 12.46
- - -
25.00 25.00 25.00 25.00 25.00 25.00 25.00 25.00
11.85 12.00 12.20 12.42 12.45
- - -
25.00 25.00 25.00 25.00 25.00 25.00 25.00 25.00
9.50 10.75 10.97 11.62 12.02 12.25 12.40 12.40
25.00 25.00 25.00 25.00 25.00 25.00 25.00 25.00
Lime/fly ash
L% /8%F L% /12%F L% /16%F L% /20%F L% /25%F
12.47 12.49 12.51 12.52 12.53
25.00 25.00 25.00 25.00 25.00
12.36 12.45 12.48 12.52 12.54
25.00 25.00 25.00 25.00 25.00
12.28 12.38 12.39 12.42 12.46
25.00 25.00 25.00 25.00 25.00
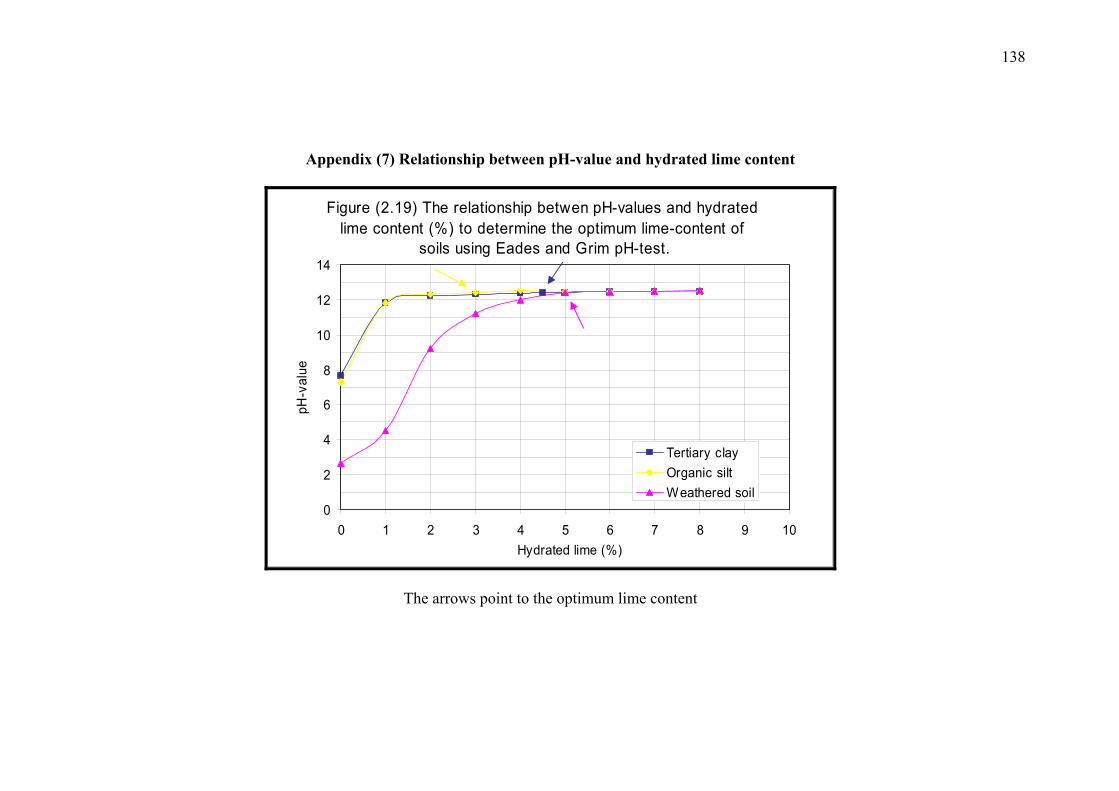
138
Appendix (7) Relationship between pH-value and hydrated lime content
Figure (2.19) The relationship betwen pH-values and hydrated lime content (%) to determine the optimum lime-content of
soils using Eades and Grim pH-test.
0
2
4
6
8
10
12
14
0 1 2 3 4 5 6 7 8 9 10Hydrated lime (%)
pH-v
alue
Tertiary clayOrganic siltWeathered soil
The arrows point to the optimum lime content

139
Appendix (8) Relationship between pH-value and fly ash content
Figrure (2.20) The relationship between pH-values and fly ash content (%) to determine the optimum fly ash
content of soils.
0
2
4
6
8
10
12
14
0 4 8 12 16 20 24 28 32 36 40 44
Fly ash (%)
pH-v
alue
Tertiary clayOrganic siltWeathered soil
The arrows point to the optimum fly ash content for each soil

140
Appendix (9) Relationship between pH-value and hydrated lime/fly ash content
Fig. (2.21) The relationship between pH-values and lime/fly ash content (%) to determine the optimum lime/fly ash-
content of soils.
0L/0F
2.5L/8F 2.5L/12F 2.5L/16F 2.5L/20F 2.5L/25F
0L/0F
2L/8F 2L/12F 2L/16F 2L/20F 2L/25F
3L/25F3L/8F 3L/12F 3L/16F 3L/20F
0L/0F
0
2
4
6
8
10
12
14
Lime/fly ash content (%)
pH-v
alue
Tertiary clayOrganic siltWeathered soil
The arrows point to the optimum lime/fly ash content for each soil

141
Appendix (10) Geotechnical properties of untreated compacted- and treated stabilized-tertiary clay with several blending.
Admixture mixing
Atterberg limits
Plas-ticityindex
Gs
Compaction
Curing time
CBR- value
qu- value
Tensile strength
σt-
Vp-value
L (%)
FA (%)
LL (%)
PL (%)
PI (%)
g/cm³
MDD g/cm³
OMC (%)
Days
(%)
kN/m²
kN/m²
m/sec
0 0 61.47 28.57 32.90 2.650 1.445 23.77 - 4.6 131.21 - 667 4.5* 6.5 8.5
0 0 0
65.32 62.95 66.70
48.61 46.13 46.10
16.7116.8220.6
2.573 2.534 2.456
1.366 1.349 1.328
29.40 31.12 32.53
7 7 7
60 61.8 62.3
1034.00 1147.80 1221.70
109.25 160.25 183.60
1418 1569 1600
0 0 0
0 0
8 12 16* 20 25
76.37 73.97 70.75
69.27 65.88
46.80 48.96 52.34
51.64 50.20
29.5725.0118.41
17.6215.68
2.614 2.607 2.606
2.588 2.594
1.369 1.364 1.361
1.353 1.344
30.85 31.17 31.26
31.53 31.61
7 7 7
28 56 180 7 7
21.9 36.6 39.4 73.8 77.0 94.9 61.1 51.6
366.88 594.90 820.38
1459.27 1660.64 1791.37 1064.97 950.00
43.70 72.90 102.00 185.80 211.26 276.82 153.00 152.95
1039 1215 1309 1513 1536 1600 1537 1485
2.5* 1.5 2.5 4.5 6.5
8* 16 16 16 16
71.52 70.40 70.34
70.20 54.30
48.51 48.90 51.96
51.70 35.20
23.0121.5018.38
18.5019.10
2.605 2.615 2.582
2.579 2.613
1.328 1.333 1.327
1.310 1.323
30.39 30.50 30.53
30.81 32.57
7 7 7
28 56 180 7 7
46.8 59.7 87.2 109
168.3 234.2 81.8 79.5
905.59 1424.42 1476.28 2256.57 3081.50 3505.23 1363.75 1159.56
123.85 131.15 142.06 240.4 335.10 400.66 138.41 127.49
1314 1491 1496 1655 1786 1875 1435 1371
L = Lime content (%) FA = Fly ash content (%) MDD = Maximum dry density (in Proctor test) OMC = Optimum moisture content (in Proctor test) LL = Liquid limt PL = Plastic limit Gs = Specific gravity CBR = California bearing ratio qu = Unconfined compression strength Vp = P-wave velocity
test-Optimum content according to pH *
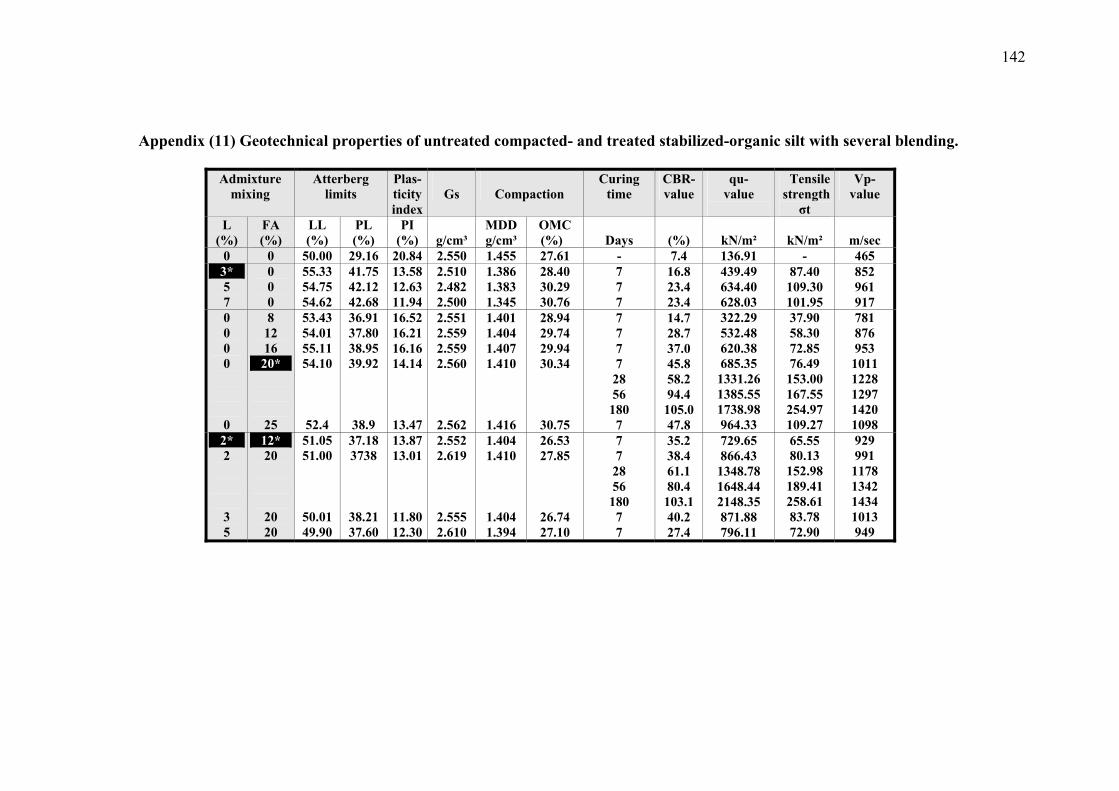
142
Appendix (11) Geotechnical properties of untreated compacted- and treated stabilized-organic silt with several blending.
Admixture mixing
Atterberg limits
Plas-ticityindex
Gs
Compaction
Curing time
CBR- value
qu- value
Tensile strength
σt
Vp-value
L (%)
FA (%)
LL (%)
PL (%)
PI (%)
g/cm³
MDD g/cm³
OMC (%)
Days
(%)
kN/m²
kN/m²
m/sec
0 0 50.00 29.16 20.84 2.550 1.455 27.61 - 7.4 136.91 - 465 3* 5 7
0 0 0
55.33 54.75 54.62
41.75 42.12 42.68
13.5812.6311.94
2.510 2.482 2.500
1.386 1.383 1.345
28.40 30.29 30.76
7 7 7
16.8 23.4 23.4
439.49 634.40 628.03
87.40 109.30 101.95
852 961 917
0 0 0 0
0
8 12 16 20* 25
53.43 54.01 55.11 54.10
52.4
36.91 37.80 38.95 39.92
38.9
16.5216.2116.1614.14
13.47
2.551 2.559 2.559 2.560
2.562
1.401 1.404 1.407 1.410
1.416
28.94 29.74 29.94 30.34
30.75
7 7 7 7
28 56 180 7
14.7 28.7 37.0 45.8 58.2 94.4 105.0 47.8
322.29 532.48 620.38 685.35
1331.26 1385.55 1738.98 964.33
37.90 58.30 72.85 76.49 153.00 167.55 254.97 109.27
781 876 953 1011 1228 1297 1420 1098
2* 2
3 5
12* 20 20 20
51.05 51.00
50.01 49.90
37.18 3738
38.21 37.60
13.8713.01
11.8012.30
2.552 2.619
2.555 2.610
1.404 1.410
1.404 1.394
26.53 27.85
26.74 27.10
7 7
28 56 180 7 7
35.2 38.4 61.1 80.4 103.1 40.2 27.4
729.65 866.43
1348.78 1648.44 2148.35 871.88 796.11
65.55 80.13 152.98 189.41 258.61 83.78 72.90
929 991 1178 1342 1434 1013 949
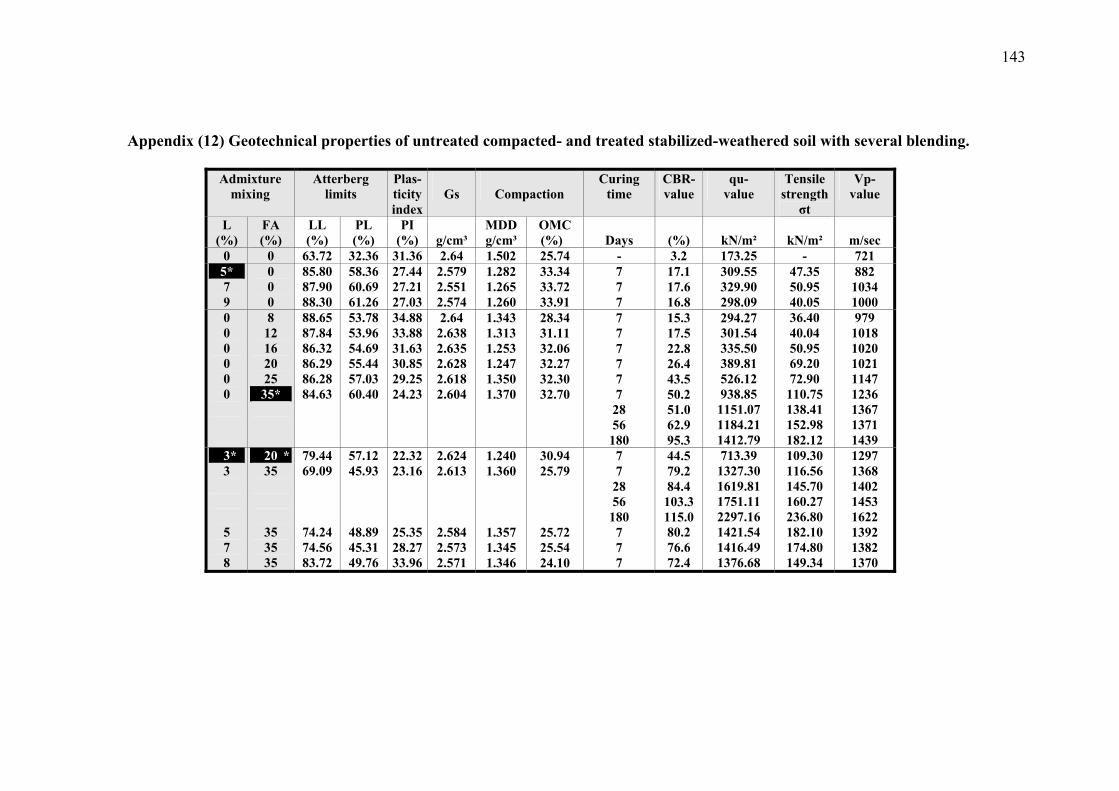
143
Appendix (12) Geotechnical properties of untreated compacted- and treated stabilized-weathered soil with several blending.
Admixture mixing
Atterberg limits
Plas-ticityindex
Gs
Compaction
Curing time
CBR- value
qu- value
Tensile strength
σt
Vp-value
L (%)
FA (%)
LL (%)
PL (%)
PI (%)
g/cm³
MDD g/cm³
OMC (%)
Days
(%)
kN/m²
kN/m²
m/sec
0 0 63.72 32.36 31.36 2.64 1.502 25.74 - 3.2 173.25 - 721 5* 7 9
0 0 0
85.80 87.90 88.30
58.36 60.69 61.26
27.4427.2127.03
2.579 2.551 2.574
1.282 1.265 1.260
33.34 33.72 33.91
7 7 7
17.1 17.6 16.8
309.55 329.90 298.09
47.35 50.95 40.05
882 1034 1000
0 0 0 0 0 0
8 12 16 20 25 35*
88.65 87.84 86.32 86.29 86.2884.63
53.78 53.96 54.69 55.44 57.03 60.40
34.8833.8831.6330.8529.2524.23
2.64 2.638 2.635 2.628 2.618 2.604
1.343 1.313 1.253 1.247 1.350 1.370
28.34 31.11 32.06 32.27 32.30 32.70
7 7 7 7 7 7
28 56 180
15.3 17.5 22.8 26.4 43.5 50.2 51.0 62.9 95.3
294.27 301.54 335.50 389.81 526.12 938.85
1151.07 1184.21 1412.79
36.40 40.04 50.95 69.20 72.90 110.75 138.41 152.98 182.12
979 1018 1020 1021 1147 1236 1367 1371 1439
3* 3
5 7 8
* 20 35 35 35 35
79.44 69.09
74.24 74.56 83.72
57.12 45.93
48.89 45.31 49.76
22.3223.16
25.3528.2733.96
2.624 2.613
2.584 2.573 2.571
1.240 1.360
1.357 1.345 1.346
30.94 25.79
25.72 25.54 24.10
7 7
28 56 180 7 7 7
44.5 79.2 84.4 103.3 115.0 80.2 76.6 72.4
713.39 1327.30 1619.81 1751.11 2297.16 1421.54 1416.49 1376.68
109.30 116.56 145.70 160.27 236.80 182.10 174.80 149.34
1297 1368 1402 1453 1622 1392 1382 1370

144
Appendix (13) Calculation of elasticity modulus (ESecant) of untreated compacted- and treated stabilized-soils for different admixtures
and curing times Soil type Mixtures Δσ/Δε ESecant (MPa)
Tertiary clay
Untreated compacted 4.5% lime 7 days 16% fly ash 7 days 16% fly ash 28 days 16% fly ash 56 days 16% fly ash 180 days 2.5%lime/8% fly ash 7 2.5%L/16% fly ash 7 2.5%L/16% fly ash 28 2.5%L/16% fly ash 56 2.5%L/16%fly ash 180
40.704-7.643/0.01042-0.00342 639.49-31.847/0.00758-0.00358 385.99-112.102/0.00192-0.00042 659.47-112.56/0.00358-0.00342 977.991-402.797/0.00559-0.00358 1274.21-365.84/0.00517-0.00367 657.422-222.967/0.00758-0.00433 842.68-399.21/0.00667-0.00508 2043.59-1193.91/0.01025-0.00917 1734.957-632.007/0.00417-0.00292 2041.568-1555.754/0.00442-0.00400
4.70 100.50 100.80 300.40 300.00 600.10 100.30 200.80 700.90 882.30
1156.70
Organic silt
Untreated compacted 3% lime 7 days 20% fly ash 7 days 20% fly ash 28 days 20% fly ash 56 days 20% fly ash 180 days 2% L/12% fly ash 7 2% L/20% fly ash 7 2% L/20% fly ash 28 2% L/20% fly ash 56 2% L/20% fly ash 180
39.548-8.479/0.01533-0.00175 133.758-20.382/0.00333-0.00067 389.809-54.777/0.00925-0.00533 1217.922-393.928/0.01058-0.00533 1046.466-662.411/0.00408-0.00183 1563.6-289.609/0.00667-0.00167 282.037-69.236/0.00342-0.00142 542.250-216.639/0.00583-0.00283 1009.422-510.142/0.00650-0.004 1223.943-669.011/0.00600-0.00450 1508.086-1026.55/0.0045-0.00375
2.30 42.60 90.00 100.60 168.90 200.60 100.10 100.90 200.00 369.96 642.01
Weathered soil
Untreated compacted 5% lime 7 days 35% fly ash 7 days 35% fly ash 28 days 35% fly ash 56 days 35% fly ash 180 days 3% L/20% fly ash 7 3% L/35% fly ash 7 3% L/35% fly ash 28 3% L/35% fly ash 56 3% L/35% fly ash 180
59.873-25.478/0.01375-0.00867 192.357-38.217/0.00942-0.00467 626.752-62.420/0.00617-0.00108 979.222-416.546/0.00967-0.006 675.07-260.608/0.00767-0.00342 675.079-459.879/0.00967-0.008 203.688-411.884/0.00275-0.00058 1223.847-917.989/0.00908-0.00783 828.896-411.884/0.00683-0.005 1286.556-711.755/0.01067-0.00875 1509.289-1034.149/0.00342-0.00275
6.80 33.00 100.10 100.30 97.50 100.50 72.00 200.30 200.50 299.40 709.16

145
Appendix (14) calculation of the loss of weight for the stabilized soils after 12 cycles freezing/thawing–durability test (ASTM D560).
sSample
wet weight after
7 days
W
%
B gm
C 1
gm
C 2
C 3
C 4
C 5
C 6
C 7
C 8
C 9
C 10
C 11
C 12
qu-
KN/m²
W %
F.D.W
gm.
Loss of
weight %
Re- sult
Clay 16FClay 2.5L/16FSilt 20FSilt 2L/20Fw. soil 35F
w. soil 3L/35F
1735.9 1710.2
1710.4 1667.9
1660.2
1637.1
31.2 30.5
30.3 26.8
32.7
25.8
1323.1 1310.5
1312.7 1315.4
1251.1
1301.4
1735.2 1708.4
1703.3 1655.5
1626.6
1636.4
1724.8 1707.2
1703.0 1645.2
1614.9
1634.7
1711.5 1706.5
1699.2 1631.3
1612.3
1633.2
1721.1 1704.4
1693.2 1623.7
1611.7
1632.6
1722.4 1704.7
1681.3 1616.5
1610.9
1627.6
1710.9 1703.6
1676.0 1587.6
1608.8
1626.1
1702.3 1701.9
1672.6 1575.3
1604.7
1623.9
1695.7 1701.1
1664.5 1570.4
1602.8
1623.6
1692.7 1700.2
1663.5 1565.4
1602.5
1621.2
1690.3 1700.5
1660.1 1558.1
1601.6
1615.7
1680.5 1699.9
1598.3 1552.5
1600.1
1612.3
1677.7 1699.8
1690.7 1546.7
1598.4
1609.7
891.72 1044.6
1082.8 957.96
1031.8
1464.9
28.20 32.32
30.26 23.79
28.87
26.75
1308.7 1284.7
1297.9 1249.5
1240.3
1269.9
1.10 1.97
1.13 5.00
1.00
2.40
P p
P P
P P
C = Cycle, P = Pass, F = Fail B = Original calculated oven-dry weight A= Original calculated oven-dry weight minus final corrected oven-dry weight. W= Water content, F.D.W = Final corrected oven-dry weight. Loss of weight, % = (A/B) * 100
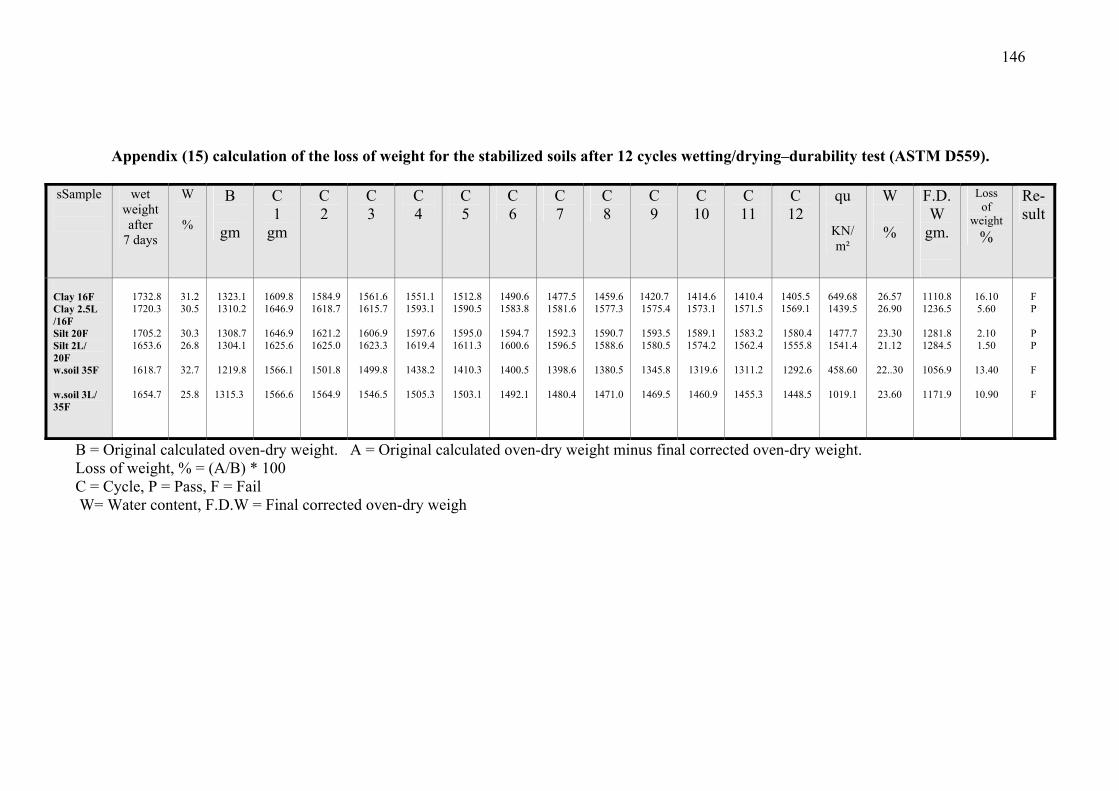
146
Appendix (15) calculation of the loss of weight for the stabilized soils after 12 cycles wetting/drying–durability test (ASTM D559).
sSample
wet weight after
7 days
W %
B gm
C 1
gm
C 2
C 3
C 4
C 5
C 6
C 7
C 8
C 9
C 10
C 11
C 12
qu
KN/m²
W %
F.D.W
gm.
Loss of
weight %
Re- sult
Clay 16FClay 2.5L/16FSilt 20FSilt 2L/20Fw.soil 35F
w.soil 3L/ 35F
1732.8 1720.3
1705.2 1653.6
1618.7
1654.7
31.2 30.5
30.3 26.8
32.7
25.8
1323.1 1310.2
1308.7 1304.1
1219.8
1315.3
1609.8 1646.9
1646.9 1625.6
1566.1
1566.6
1584.9 1618.7
1621.2 1625.0
1501.8
1564.9
1561.6 1615.7
1606.9 1623.3
1499.8
1546.5
1551.1 1593.1
1597.6 1619.4
1438.2
1505.3
1512.8 1590.5
1595.0 1611.3
1410.3
1503.1
1490.6 1583.8
1594.7 1600.6
1400.5
1492.1
1477.5 1581.6
1592.3 1596.5
1398.6
1480.4
1459.6 1577.3
1590.7 1588.6
1380.5
1471.0
1420.7 1575.4
1593.5 1580.5
1345.8
1469.5
1414.6 1573.1
1589.1 1574.2
1319.6
1460.9
1410.4 1571.5
1583.2 1562.4
1311.2
1455.3
1405.5 1569.1
1580.4 1555.8
1292.6
1448.5
649.68 1439.5
1477.7 1541.4
458.60
1019.1
26.57 26.90
23.30 21.12
22..30
23.60
1110.8 1236.5
1281.8 1284.5
1056.9
1171.9
16.10 5.60
2.10 1.50
13.40
10.90
F P
P P
F F
B = Original calculated oven-dry weight. A = Original calculated oven-dry weight minus final corrected oven-dry weight. Loss of weight, % = (A/B) * 100 C = Cycle, P = Pass, F = Fail W= Water content, F.D.W = Final corrected oven-dry weigh

147
Appendix (16, a) CBR-curves of tertiary clay
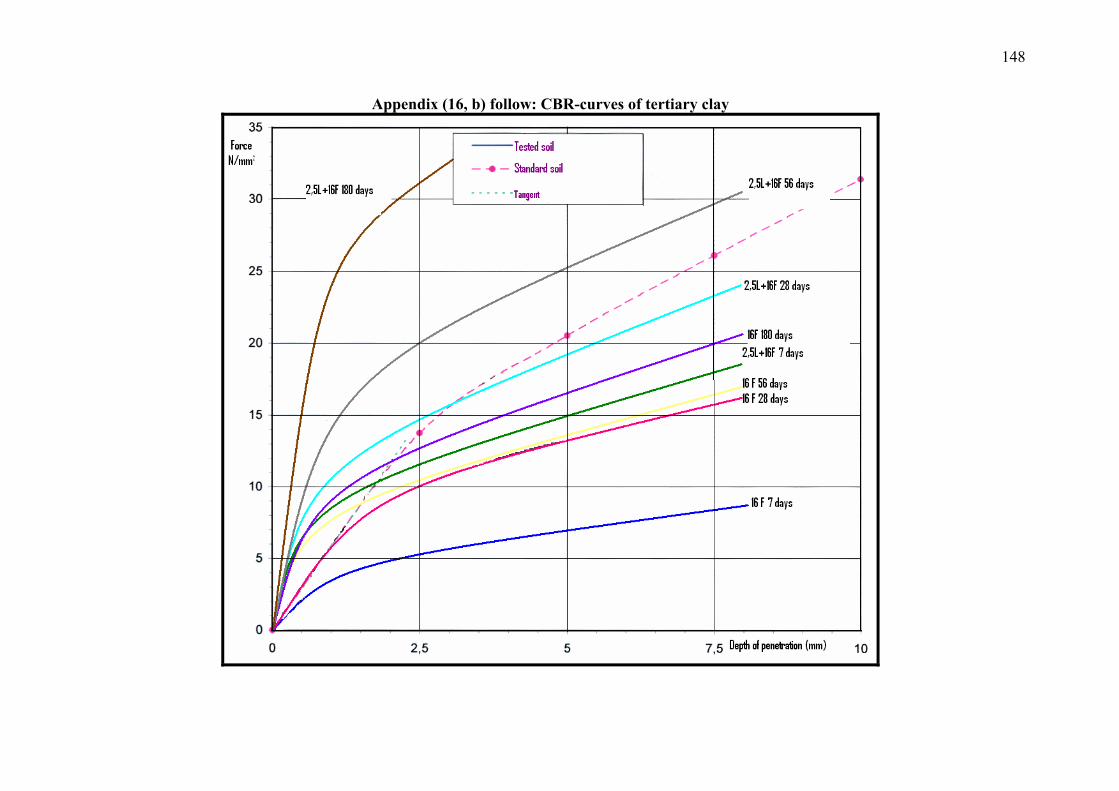
148
Appendix (16, b) follow: CBR-curves of tertiary clay

149
Appendix (17, a) CBR-curves of organic silt
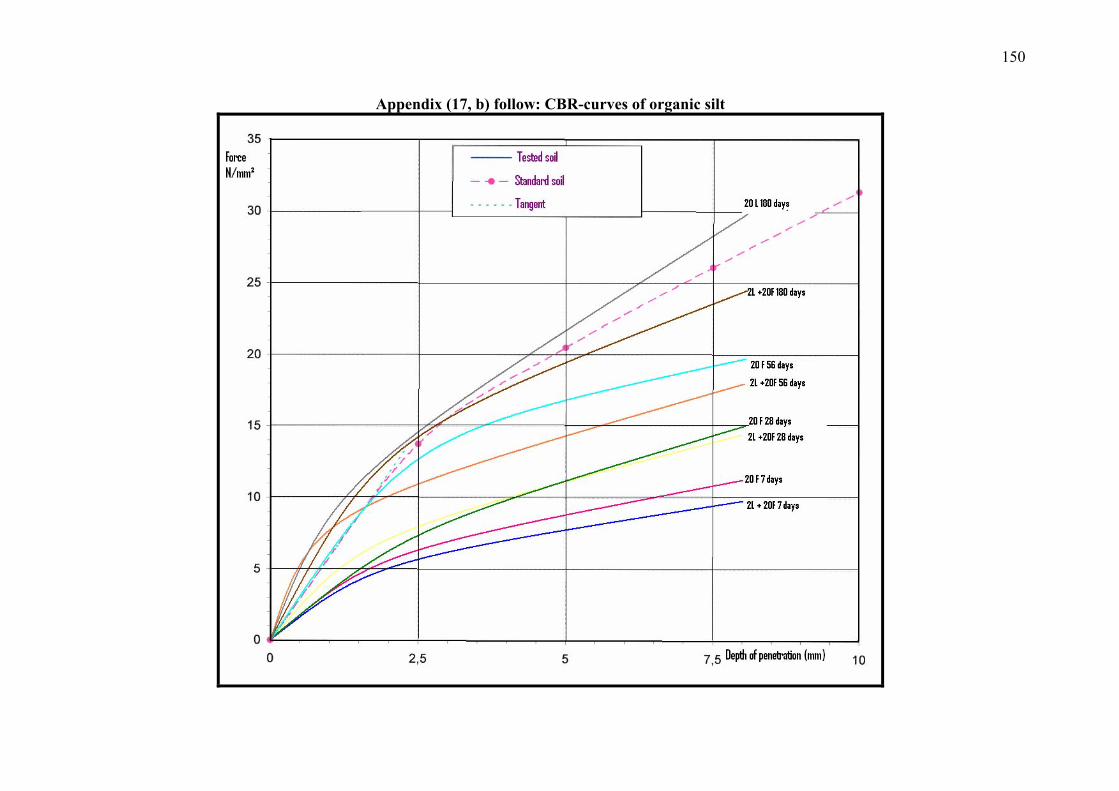
150
Appendix (17, b) follow: CBR-curves of organic silt

151
Appendix (18, a) CBR-curves of weathered soil
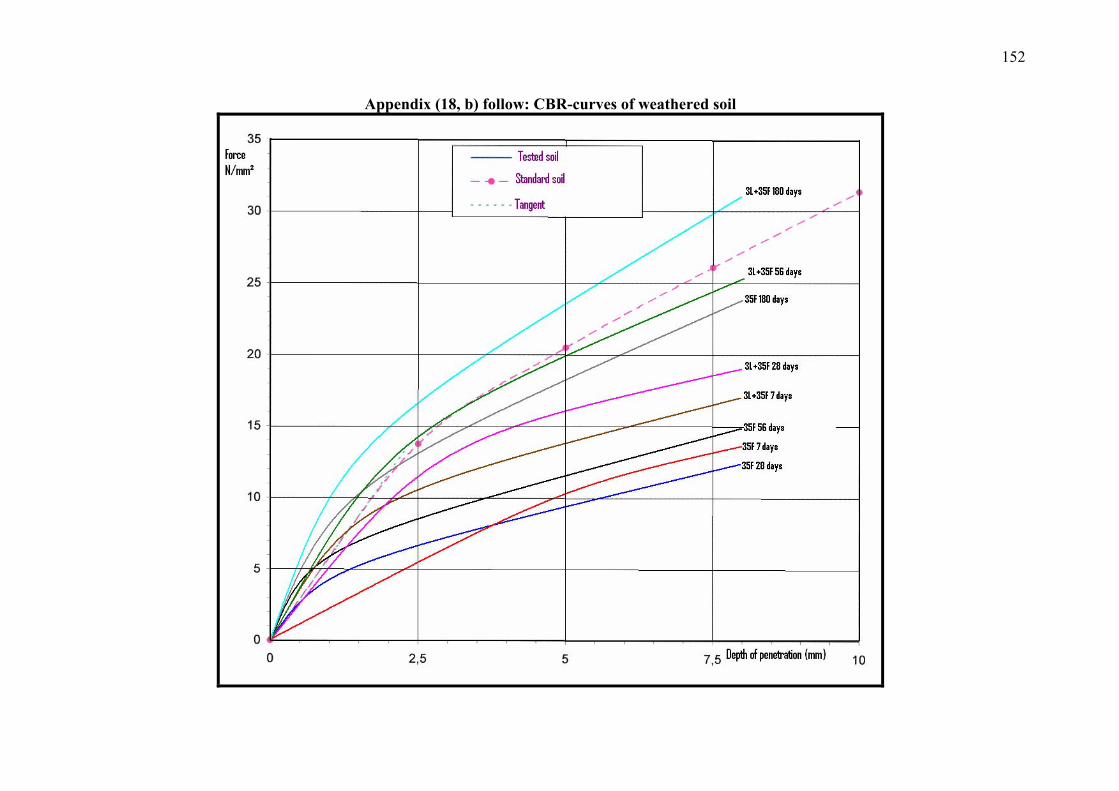
152
Appendix (18, b) follow: CBR-curves of weathered soil

153
Appendix (19) Calculation of tensile strength of tertiary clay
Admixture mixing
Curing time
L
D
P
σt = 2P/π.D.L
= 0.636P/D.L
σt
L (%)
FA (%)
Days (mm) (mm) (N) (MPa) (KN/m²)
4.5* 6.5 8.5
0 0 0
7 7 7
100 100 100
100 100 100
1717.8 2519.6 2886.8
0.10925 0.16025 0.18360
109.25 160.25 183.60
0 0 0
0 0
8 12 16* 20 25
7 7 7
28 56
180 7 7
100 100 100 100 100 100 100 100
100 100 100 100 100 100 100 100
687.1 1146.2 1603.8 2921.4 3321.7 4352.5 2405.7 2404.9
0.4370 0.7290
0.10200 0.18580 0.21126 0.27682 0.15300 0.15295
43.70 72.90 102.00 185.80 211.26 276.82 153.00 152.95
2.5* 1.5 2.5 4.5 6.5
8* 16 16 16 16
7 7 7
28 56
180 7 7
100 100 100 100 100 100 100 100
100 100 100 100 100 100 100 100
1947.3 2061.1 2233.6 3779.9 5268.9 6299.7 2176.3 2000.6
0.12385 0.13115 0.14206 0.2404
0.33510 0.40066 0.13841 0.12749
123.85 131.15 142.06 240.4 335.10 400.66 138.41 127.49
L = Thickness of the tested specimen (mm) D = Diameter of the tested specimen (mm) P = Load at failure (N) σt = Tensile strength (MPa)

154
Appendix (20) Calculation of tensile strength of organic silt
Admixture mixing
Curing time
L
D
P
σt = 2P/π.D.L
= 0.636P/D.L
σt
L (%)
FA (%)
Days (mm) (mm) (N) (MPa) (KN/m²)
3* 5 7
0 0 0
7 7 7
100 100 100
100 100 100
1374.2 1718.6 1603.0
0.08740 0.10930 0.10195
87.40 109.30 101.95
0 0 0 0
0
8 12 16 20* 25
7 7 7 7
28 56
180 7
100 100 100 100 100 100 100 100
100 100 100 100 100 100 100 100
595.9 916.7 1145.4 1202.7 2405.7 2634.4 4009.0 1718.1
0.03790 0.05830 0.07285 0.07649 0.15300 0.16755 0.25497 0.10927
37.90 58.30 72.85 76.49 153.00 167.55 254.97 109.27
2* 2
3 5
* 12 20 20 20
7 7
28 56
180 7 7
100 100 100 100 100 100 100
100 100 100 100 100 100 100
1030.7 1259.9 2405.3 2978.1 4066.2 1317.3 1146.2
0.06555 0.08013 0.15298 0.18941 0.25861 0.08378 0.07290
65.55 80.13 152.98 189.41 258.61 83.78 72.90
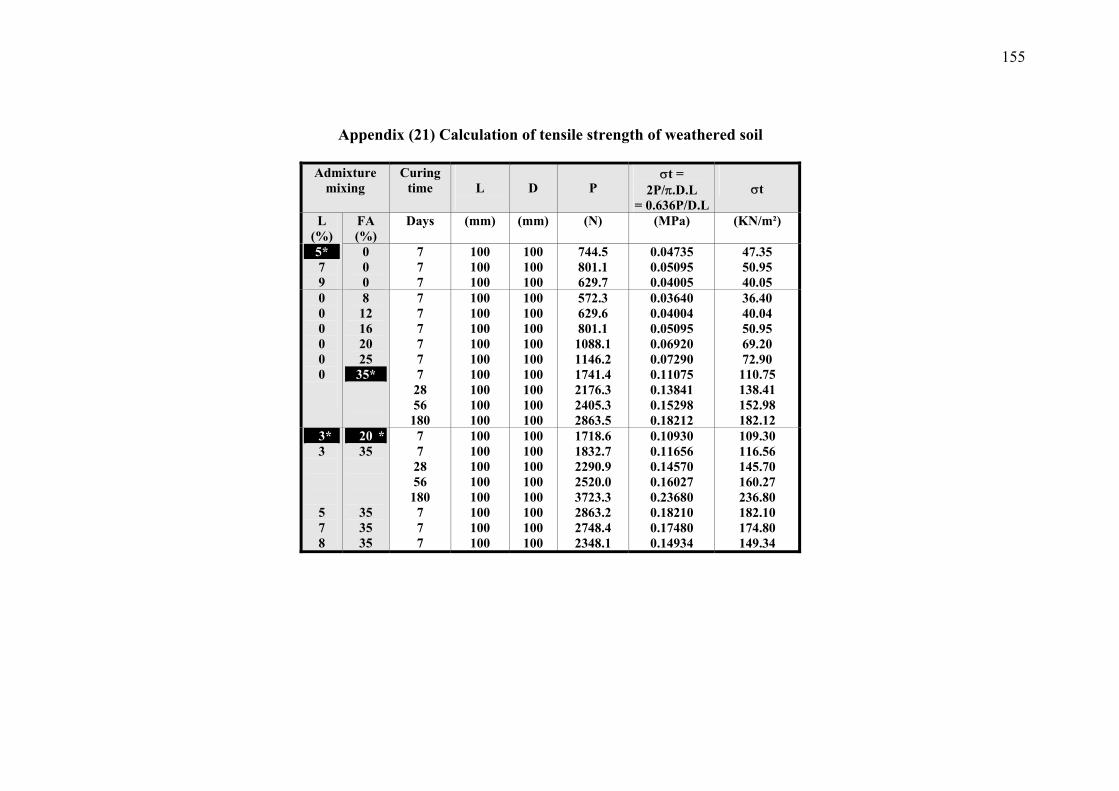
155
Appendix (21) Calculation of tensile strength of weathered soil
Admixture mixing
Curing time
L
D
P
σt = 2P/π.D.L
= 0.636P/D.L
σt
L (%)
FA (%)
Days (mm) (mm) (N) (MPa) (KN/m²)
5* 7 9
0 0 0
7 7 7
100 100 100
100 100 100
744.5 801.1 629.7
0.04735 0.05095 0.04005
47.35 50.95 40.05
0 0 0 0 0 0
8 12 16 20 25 35*
7 7 7 7 7 7
28 56
180
100 100 100 100 100 100 100 100 100
100 100 100 100 100 100 100 100 100
572.3 629.6 801.1 1088.1 1146.2 1741.4 2176.3 2405.3 2863.5
0.03640 0.04004 0.05095 0.06920 0.07290 0.11075 0.13841 0.15298 0.18212
36.40 40.04 50.95 69.20 72.90 110.75 138.41 152.98 182.12
3* 3
5 7 8
* 20 35 35 35 35
7 7
28 56
180 7 7 7
100 100 100 100 100 100 100 100
100 100 100 100 100 100 100 100
1718.6 1832.7 2290.9 2520.0 3723.3 2863.2 2748.4 2348.1
0.10930 0.11656 0.14570 0.16027 0.23680 0.18210 0.17480 0.14934
109.30 116.56 145.70 160.27 236.80 182.10 174.80 149.34

156
Appendix (22, a) K-value curves of tertiary clay.

157
Appendix (22, b) follow: K-value curves of tertiary clay.

158
Appendix (23, a) K-value curves of organic silt.

159
Appendix (23, b) follow: K-value curves of organic silt.
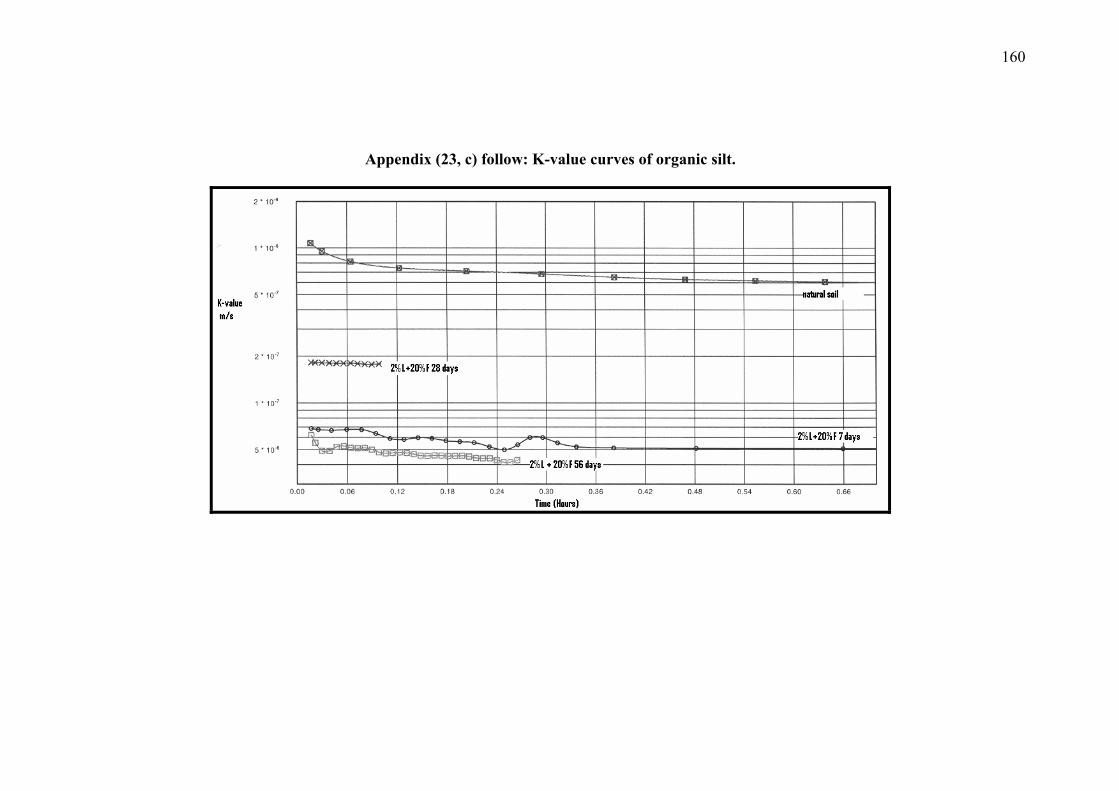
160
Appendix (23, c) follow: K-value curves of organic silt.

161
Appendix (24, a) K-value curves of weathered soil

162
Appendix (24, b) follow: K-value curves of weathered soil.
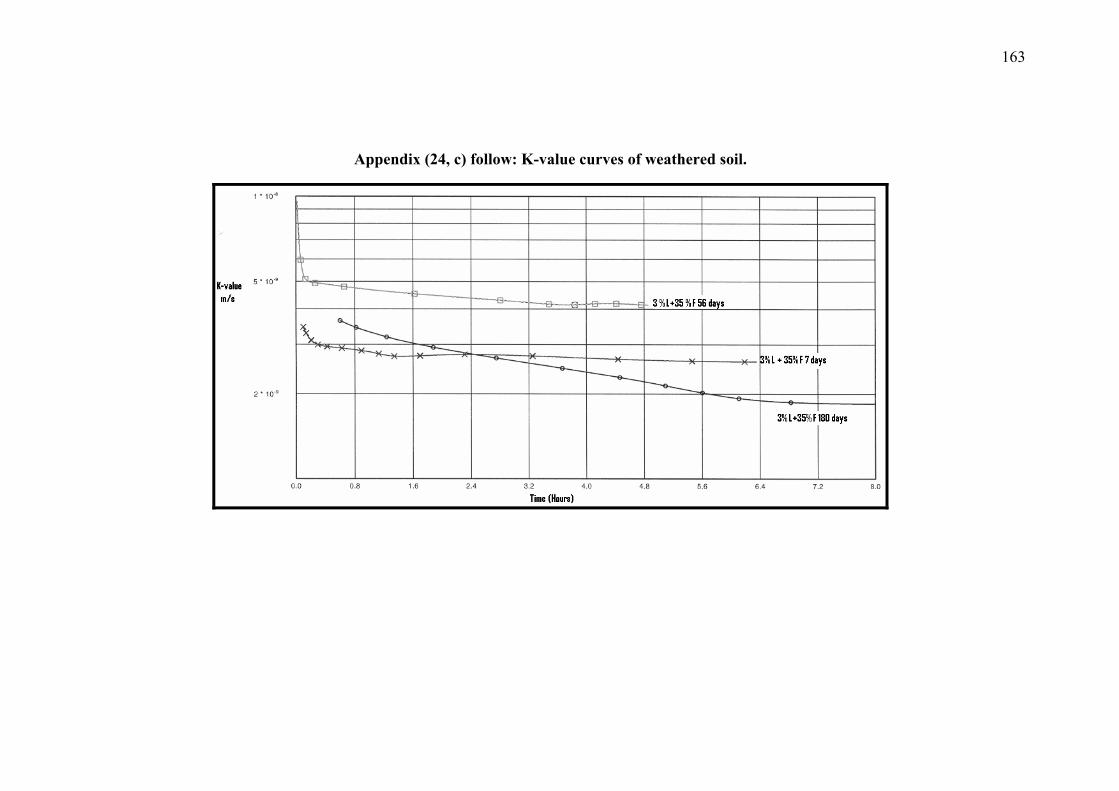
163
Appendix (24, c) follow: K-value curves of weathered soil.

164
Appendix (25) K-value gain factors of stabilized tertiary clay.
Fig. (6.2, a) K-value gain factor of fly ash- and lime/fly ash-stabilized tertiary clay
0.00E+00
5.00E+01
1.00E+02
1.50E+02
2.00E+02
2.50E+02
3.00E+02
Mixtures
K-v
alue
gai
n fa
ctor
Untreated compacted(1)16% fly ash 7 days16% fly ash 28 days16% fly ash 56 days16% fly ash 180 days2.5%L/16%F 7 days2.5%L/16%F 28 days2.5%L/16%F 56 days2.5%L/16%F 180 days
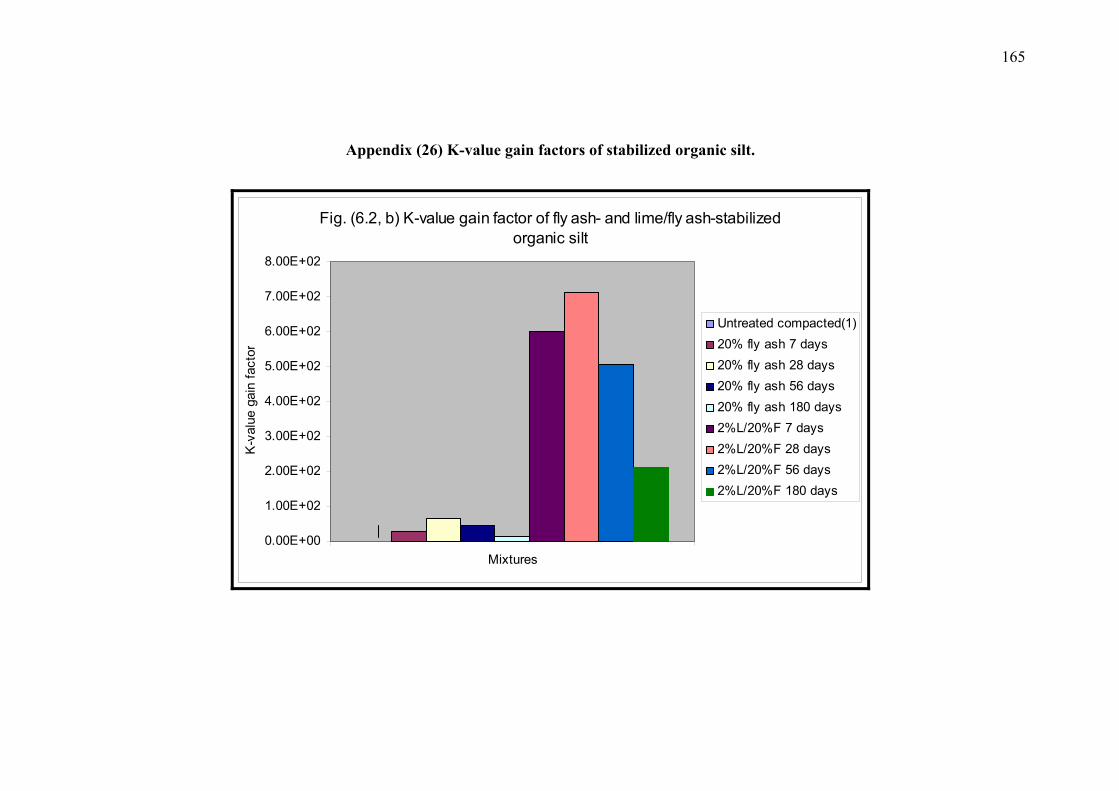
165
Appendix (26) K-value gain factors of stabilized organic silt.
Fig. (6.2, b) K-value gain factor of fly ash- and lime/fly ash-stabilized organic silt
0.00E+00
1.00E+02
2.00E+02
3.00E+02
4.00E+02
5.00E+02
6.00E+02
7.00E+02
8.00E+02
Mixtures
K-v
alue
gai
n fa
ctor
Untreated compacted(1)20% fly ash 7 days20% fly ash 28 days20% fly ash 56 days20% fly ash 180 days2%L/20%F 7 days2%L/20%F 28 days2%L/20%F 56 days2%L/20%F 180 days

166
Appendix (27) K-value gain factors of stabilized weathered soil.
Fig. (6.2, c) K-value gain factor of fly ash- and lime/fly ash-stabilized weathered soil
0.00E+00
5.00E+02
1.00E+03
1.50E+03
2.00E+03
2.50E+03
3.00E+03
Mixtures
K-v
alue
gai
n fa
ctor
Untreated compacted(1)35% fly ash 7 days35% fly ash 28 days35% fly ash 56 days35% fly ash 180 days3%L/35%F 7 days3%L/35%F 28 days3%L/35%F 56 days3%L/35%F 180 days

167
Appendix (28) Calculation of Vp-value for tertiary clay
Admixture mixing
Curing time
X
Average of ta
Vp-value
L (%)
FA (%)
Days (m) (μs) (m/sec)
0 0
0 0
Natural soil Untreated
compacted
0.12 0.12
186.6 179.9
643 667
4.5* 6.5 8.5
0 0 0
7 7 7
0.12 0.12 0.12
84.6 76.5 75.0
1418 1568 1600
0 0 0
0 0
8 12 16* 20 25
7 7 7
28 56
180 7 7
0.12 0.12 0.12 0.12 0.12 0.12 0.12 0.12
115.5 98.8 91.4 79.3 78.1 77.2 78.1 80.8
1039 1215 1309 1513 1536 1600 1537 1485
2.5* 1.5 2.5 4.5 6.5
8* 16 16 16 16
7 7 7
28 56
180 7 7
0.12 0.12 0.12 0.12 0.12 0.12 0.12 0.12
91.3 80.5 80.2 72.5 67.2 64.0 83.6 87.5
1314 1491 1496 1655 1786 1875 1435 1371
X = Height (thickness) of the specimen (m) ta = Average (4-Measurments) of arrival (travel)-time (μs)
Vp = Velocity of ultrasonic p-wave (m/sec)
168
Appendix (29) Calculation of Vp-value for organic silt
Admixture mixing
Curing time
X
Average of ta
Vp-value
L (%)
FA (%)
Days (m) (μs) (m/sec)
0 0
0 0
Natural soil Untreated
compacted
0.12 0.12
283.0 258.2
424 465
3* 5 7
0 0 0
7 7 7
0.12 0.12 0.12
140.8 124.9 130.8
852 961 917
0 0 0 0
0
8 12 16 20* 25
7 7 7 7
28 56
180 7
0.12 0.12 0.12 0.12 0.12 0.12 0.12 0.12
153.6 137.0 125.9 118.7 97.7 92.5 84.5
109.3
781 876 953 1011 1228 1297 1420 1098
2* 2
3 5
12* 20 20 20
7 7
28 56
180 7 7
0.12 0.12 0.12 0.12 0.12 0.12 0.12
129.2 121.1 101.9 89.4 83.7
118.5 126.5
929 991 1178 1342 1434 1013 949
169
Appendix (30) Calculation of Vp-value for weathered soil
Admixture mixing
Curing time
X
Average of ta
Vp-value
L
(%) FA (%)
Days (m) (μs) (m/sec)
0 0
0 0
Natural soil Untreated
compacted
0.12 0.12
171.4 166.4
700 721
5* 7 9
0 0 0
7 7 7
0.12 0.12 0.12
136.0 116.0 120.0
882 1034 1000
0 0 0 0 0 0
8 12 16 20 25 35*
7 7 7 7 7 7
28 56
180
0.12 0.12 0.12 0.12 0.12 0.12 0.12 0.12 0.12
122.6 117.9 117.6 117.4 104.6 97.1 87.8 87.5 83.4
979 1018 1020 1021 1147 1236 1367 1371 1439
3* 3
5 7 8
20* 35 35 35 35
7 7
28 56
180 7 7 7
0.12 0.12 0.12 0.12 0.12 0.12 0.12 0.12
92.5 87.7 85.6 82.6 74.0 86.2 86.8 87.6
1297 1368 1402 1453 1622 1392 1382 1370

170
Curriculum vitae December 12, 1969 1987 1991 1992- 1996 1994 1996 1997 1997- 2001 2001 2001- 6.2002 6.2002- 2003 2003- Present Marital status Halle (Saale), 8.02.2006
Born at Qena city, Egypt. General Secondary Education (Science Section) Certificate from Abu Bakr Al-sedik Secondary School, Qena city, Egypt, (very good) Degree of Science-Bachelor in Geology (very good) from Qena Faculty of Science, Assiut University, Egypt. Work as Demonstrator at Geology Department, South Valley University, Egypt. Postgraduate Courses for the Master Degree in Geology (Distinct), Qena, Egypt. Compacted Courses for Preparation of the University-Teacher, at Qena Educational Faculty, South Valley University, Egypt. Master Degree in Geology, Qena, Egypt. Work as Assistance Lecture in Geology Department, at Qena Faculty of Science, South Valley University, Egypt. Egyptian scholarship (4-5 years) for obtaining doctor degree in Engineering Geology, at Martin Luther University Halle-Wittenberg, Germany. Developing Study “Aufbau Studium” 1.5 years including Success in the Study-Stages of the German Diploma in the field of Engineering Geology/Geotechnology (Courses in Engineering Geology I & II, Soil and Rock Mechanics, Applications about the methods of geotechnical calculations, the Courses include “Lectures/Exercises/Practises in the field and in the Laboratory/GGU-software-programs”, two compacted Courses in the Finite Elements Analysis “Lectures/Exercises/Software-programs”, and finally, Seminar with project in Engineering Geology and Geotechnology). Training in the Laboratory of the Soil Mechanics on the modern generations of the computerized-instruments. Pursuing doctor degree in Engineering Geology, Institute of Geology, Martin Luther University Halle-Wittenberg, Germany. Single. Hesham Ahmed Hussin Ismaiel

171
Announcement
Herewith, I affirm that, I have written this dissertation independently. This one was not taken from strange sources directly or indirectly. I have characterized the thoughts as such. This dissertation was not submitted at any other university. I have never applied for a doctorate before.
Halle (Saale), 8.02.2006 Hesham Ahmed Hussin Ismaiel