trƯỜng ĐẠi hỌc kinh tẾ tp.hcm trung tÂm dỮ liỆu - phÂn...
TRANSCRIPT

TRƯỜNG ĐẠI HỌC KINH TẾ TP.HCM
TRUNG TÂM DỮ LIỆU - PHÂN TÍCH KINH TẾ
BÁO CÁO DỮ LIỆU PHỤC VỤ NGHIÊN CỨU
CHỦ ĐỀ: CÁC NGUỒN DỮ LIỆU VÀ NGHIÊN CỨU VỀ THỂ CHẾ
TP.HCM, 8/2016
1
MỤC LỤC
1. CÁC NGUỒN DỮ LIỆU VỀ THỂ CHẾ .................................................................................... 2
1.1 Chỉ số quản trị toàn cầu (Worldwide Governance Indicators - WGI) .................................. 2
1.1.1 Giới thiệu ....................................................................................................................... 2
1.1.2 Phương pháp tính toán chỉ số WGI ................................................................................ 3
1.1.3 Danh sách các chỉ tiêu (indicators) chi tiết .................................................................... 4
1.1.4 Cách truy cập ............................................................................................................... 13
1.2 Chỉ số cảm nhận tham nhũng (Corruption Perceptions Index - CPI) ................................. 15
1.2.1 Giới thiệu ..................................................................................................................... 15
1.2.2 Phương pháp tính toán chỉ số CPI ............................................................................... 15
1.2.3 Cách truy cập ............................................................................................................... 16
1.3 Chỉ số Hiệu quả Quản trị và Hành chính công cấp tỉnh ở Việt Nam (PAPI) ..................... 17
1.3.1 Giới thiệu ..................................................................................................................... 17
1.3.2 Phương pháp tính toán chỉ số PAPI ............................................................................. 18
1.3.3 Cách truy cập ............................................................................................................... 18
2. NGHIÊN CỨU SỬ DỤNG DỮ LIỆU THỂ CHẾ .................................................................... 19
2.1 Nghiên cứu sử dụng dữ liệu Worldwide Governance Indicators và Corruption Perceptions
Index ......................................................................................................................................... 19
2.2 Nghiên cứu sử dụng dữ liệu từ PAPI .................................................................................. 23
Tài liệu tham khảo ........................................................................................................................ 24
2
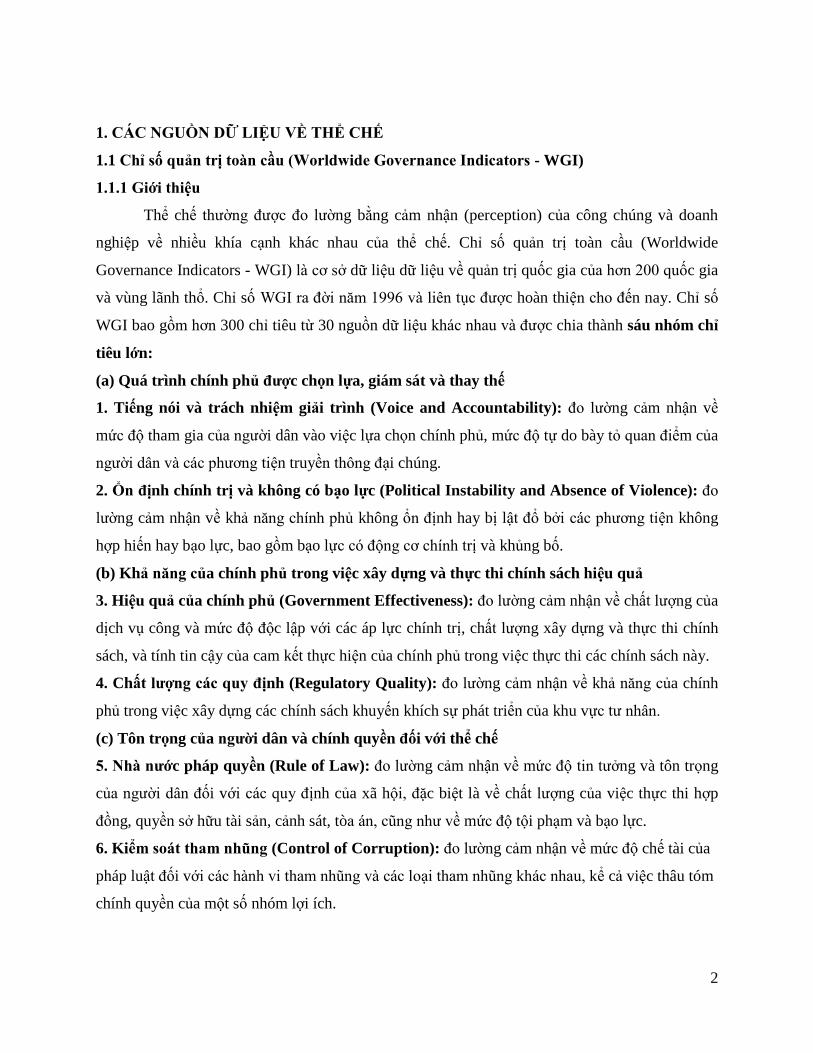
1. CÁC NGUỒN DỮ LIỆU VỀ THỂ CHẾ
1.1 Chỉ số quản trị toàn cầu (Worldwide Governance Indicators - WGI)
1.1.1 Giới thiệu
Thể chế thường được đo lường bằng cảm nhận (perception) của công chúng và doanh
nghiệp về nhiều khía cạnh khác nhau của thể chế. Chỉ số quản trị toàn cầu (Worldwide
Governance Indicators - WGI) là cơ sở dữ liệu dữ liệu về quản trị quốc gia của hơn 200 quốc gia
và vùng lãnh thổ. Chỉ số WGI ra đời năm 1996 và liên tục được hoàn thiện cho đến nay. Chỉ số
WGI bao gồm hơn 300 chỉ tiêu từ 30 nguồn dữ liệu khác nhau và được chia thành sáu nhóm chỉ
tiêu lớn:
(a) Quá trình chính phủ được chọn lựa, giám sát và thay thế
1. Tiếng nói và trách nhiệm giải trình (Voice and Accountability): đo lường cảm nhận về
mức độ tham gia của người dân vào việc lựa chọn chính phủ, mức độ tự do bày tỏ quan điểm của
người dân và các phương tiện truyền thông đại chúng.
2. Ổn định chính trị và không có bạo lực (Political Instability and Absence of Violence): đo
lường cảm nhận về khả năng chính phủ không ổn định hay bị lật đổ bởi các phương tiện không
hợp hiến hay bạo lực, bao gồm bạo lực có động cơ chính trị và khủng bố.
(b) Khả năng của chính phủ trong việc xây dựng và thực thi chính sách hiệu quả
3. Hiệu quả của chính phủ (Government Effectiveness): đo lường cảm nhận về chất lượng của
dịch vụ công và mức độ độc lập với các áp lực chính trị, chất lượng xây dựng và thực thi chính
sách, và tính tin cậy của cam kết thực hiện của chính phủ trong việc thực thi các chính sách này.
4. Chất lượng các quy định (Regulatory Quality): đo lường cảm nhận về khả năng của chính
phủ trong việc xây dựng các chính sách khuyến khích sự phát triển của khu vực tư nhân.
(c) Tôn trọng của người dân và chính quyền đối với thể chế
5. Nhà nước pháp quyền (Rule of Law): đo lường cảm nhận về mức độ tin tưởng và tôn trọng
của người dân đối với các quy định của xã hội, đặc biệt là về chất lượng của việc thực thi hợp
đồng, quyền sở hữu tài sản, cảnh sát, tòa án, cũng như về mức độ tội phạm và bạo lực.
6. Kiểm soát tham nhũng (Control of Corruption): đo lường cảm nhận về mức độ chế tài của
pháp luật đối với các hành vi tham nhũng và các loại tham nhũng khác nhau, kể cả việc thâu tóm
chính quyền của một số nhóm lợi ích.

3
1.1.2 Phương pháp tính toán chỉ số WGI
Dữ liệu từ hơn 300 chỉ tiêu của 30 nguồn khác nhau được tính toán thành sáu chỉ số chỉ
số quản trị cho sáu nhóm chỉ tiêu. Nhìn chung, việc tính toán sáu chỉ số lớn này được tiến hành
theo các bước sau1:
Bước 1: Sắp xếp dữ liệu từ từng nguồn khác nhau cho sáu nhóm chỉ tiêu lớn
Câu hỏi từ từng nguồn được chọn lọc và sắp xếp cho từng nhóm chỉ tiêu lớn. Ví dụ, một
câu hỏi khảo sát doanh nghiệp về môi trường quản lý sẽ được xếp vào nhóm chỉ tiêu Chất lượng
các quy định (Regulatory Quality), hay một đo lường về tự do báo chí sẽ được xếp vào nhóm chỉ
tiêu Tiếng nói và trách nhiệm giải trình (Voice and Accountability).
Bước 2: Điều chỉnh thang đo sơ bộ của từng nguồn dữ liệu thành 0 đến 1
Câu hỏi từ từng nguồn được điều chỉnh thang đo có giá trị từ 0 đến 1, với giá trị cao hơn
là kết quả tốt hơn. Ví dụ, nếu một câu hỏi yêu cầu câu trả lời có thang từ 1 (thấp nhất) đến 4 (cao
nhất), thì điểm số là 2 sẽ được điều chỉnh thang đo thành (2-min)/(max-min) = (2-1)/(4-1) = 0,33.
Mặc dù các dữ liệu được điều chỉnh thang đo sẽ dao động từ 0 đến 1 nhưng dữ liệu từ các nguồn
khác nhau có thể không so sánh được với nhau. Ví dụ, một nguồn thì sử dụng thang 0-10 nhưng
trong thực tế hầu hết các trả lời đều trong khoảng 6-10, trong khi một nguồn khác cũng sử dụng
thang 0-10 nhưng câu trả lời phân bố trong cả khoảng này. Do vậy, cách điều chỉnh thang đo
max-min này không sửa chữa được sự không thể so sánh (non-comparability) giữa các nguồn.
Phương pháp UCM được trình bày ở dưới sẽ giúp giải quyết vấn đề này.
Bước 3: Sử dụng phương pháp Unobserved Components Model (UCM) để tính toán trung
bình có trọng số của từng chỉ tiêu ở từng nguồn
Phương pháp UCM được sử dụng để biến dữ liệu được điều chỉnh thang đo từ 0 đến 1 có
thể so sánh giữa các nguồn khác nhau, và rồi tính toán trung bình có trọng số2 của dữ liệu từ từng
nguồn cho từng quốc gia. Sáu chỉ số tổng hợp cho sáu nhóm chỉ tiêu về quản trị được tính toán
bằng phương pháp UCM có đơn vị theo phân phối chuẩn (standard normal distribution), với
trung bình = 0, độ lệch chuẩn = 1, và có giá trị dao động trong khoảng từ -2. đến 2. với giá trị
càng cao thì quản trị càng tốt.
Sử dụng chỉ số quản trị để so sánh ch o giữa các quốc gia
1 Phương pháp tính toán WGI trong Kaufmann và cộng sự (2010) và website:
http://info.worldbank.org/governance/wgi/index.aspx#home 2 Trọng số này có thể tìm thấy tại http://info.worldbank.org/governance/wgi/pdf/WGI_Weights.xlsx.
4
áu chỉ số về quản trị cho sáu nhóm chỉ tiêu được báo cáo theo hai cách (i) dưới dạng
đơn vị phân phối chuẩn, dao động từ -2. đến 2. , và (ii) dưới dạng xếp hạng phân vị (percentile
rank), dao động từ 0 đến 100, với giá trị cao hơn tương ứng với kết quả tốt hơn; ví dụ, xếp hạng
phân vị Hiệu quả của chính phủ của Việt Nam năm 2014 là 52.4 nghĩa là có 52.4% tổng số quốc
gia trong mẫu quan sát có điểm (xếp hạng) thấp hơn Việt Nam về chỉ số này.
Điểm quan trọng của WGI là tất cả điểm số đều dược đi kèm bởi sai số chuẩn (standard
errors). Sai số chuẩn phản ánh thực tế là khó đo lường chính xác quản trị với bất kỳ loại dữ liệu
nào. Trong dữ liệu trình bày dưới dạng biểu đồ, những sai số chuẩn này được chuyển thành 90%
khoảng tin cậy hay “sai số biên” (margins of error). Điều này cho biết dao động có khả năng về
mặt thống kê dựa theo nguồn dữ liệu sẵn có cho một quốc gia.
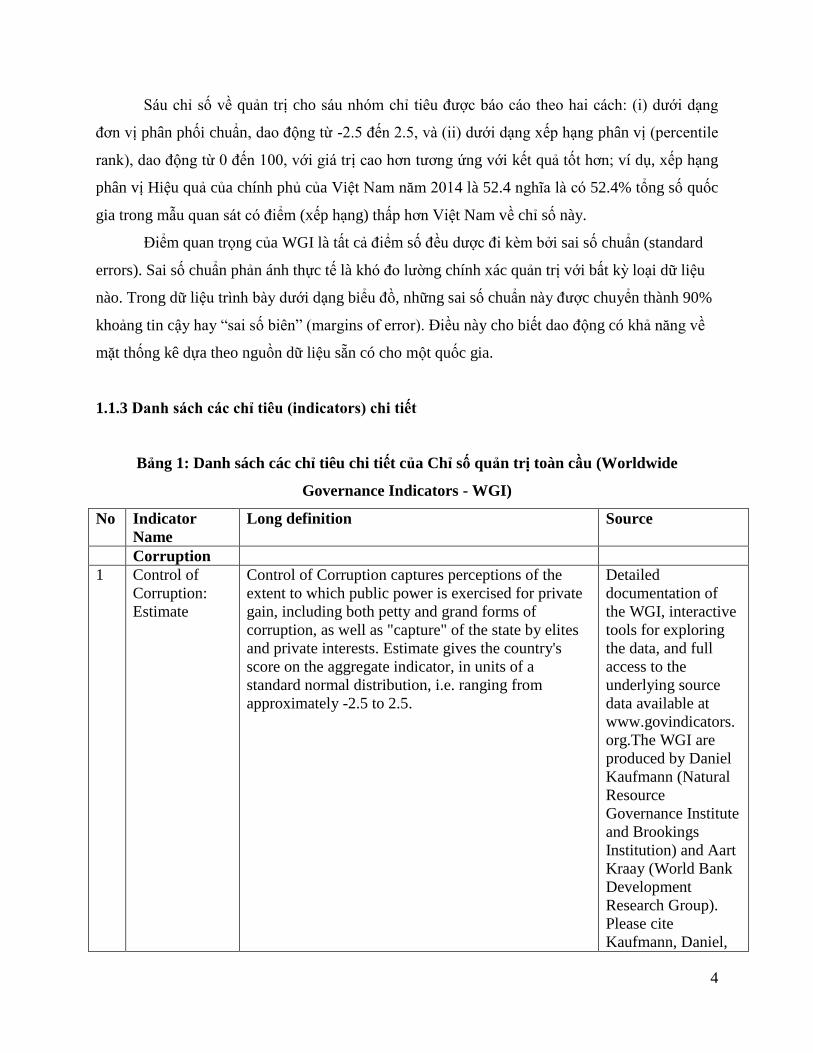
1.1.3 Danh sách các chỉ tiêu (indicators) chi tiết
Bảng 1: Danh sách các chỉ tiêu chi tiết của Chỉ số quản trị toàn cầu (Worldwide
Governance Indicators - WGI)
No Indicator
Name
Long definition Source
Corruption
1 Control of
Corruption:
Estimate
Control of Corruption captures perceptions of the
extent to which public power is exercised for private
gain, including both petty and grand forms of
corruption, as well as "capture" of the state by elites
and private interests. Estimate gives the country's
score on the aggregate indicator, in units of a
standard normal distribution, i.e. ranging from
approximately -2.5 to 2.5.
Detailed
documentation of
the WGI, interactive
tools for exploring
the data, and full
access to the
underlying source
data available at
www.govindicators.
org.The WGI are
produced by Daniel
Kaufmann (Natural
Resource
Governance Institute
and Brookings
Institution) and Aart
Kraay (World Bank
Development
Research Group).
Please cite
Kaufmann, Daniel,
5
Aart Kraay and
Massimo Mastruzzi
(2010). "The
Worldwide
Governance
Indicators:
Methodology and
Analytical Issues".
World Bank Policy
Research Working
Paper No. 5430
(http://papers.ssrn.co
m/sol3/papers.cfm?a
bstract_id=1682130)
. The WGI do not
reflect the official
views of the Natural
Resource
Governance
Institute, the
Brookings
Institution, the
World Bank, its
Executive Directors,
or the countries they
represent.
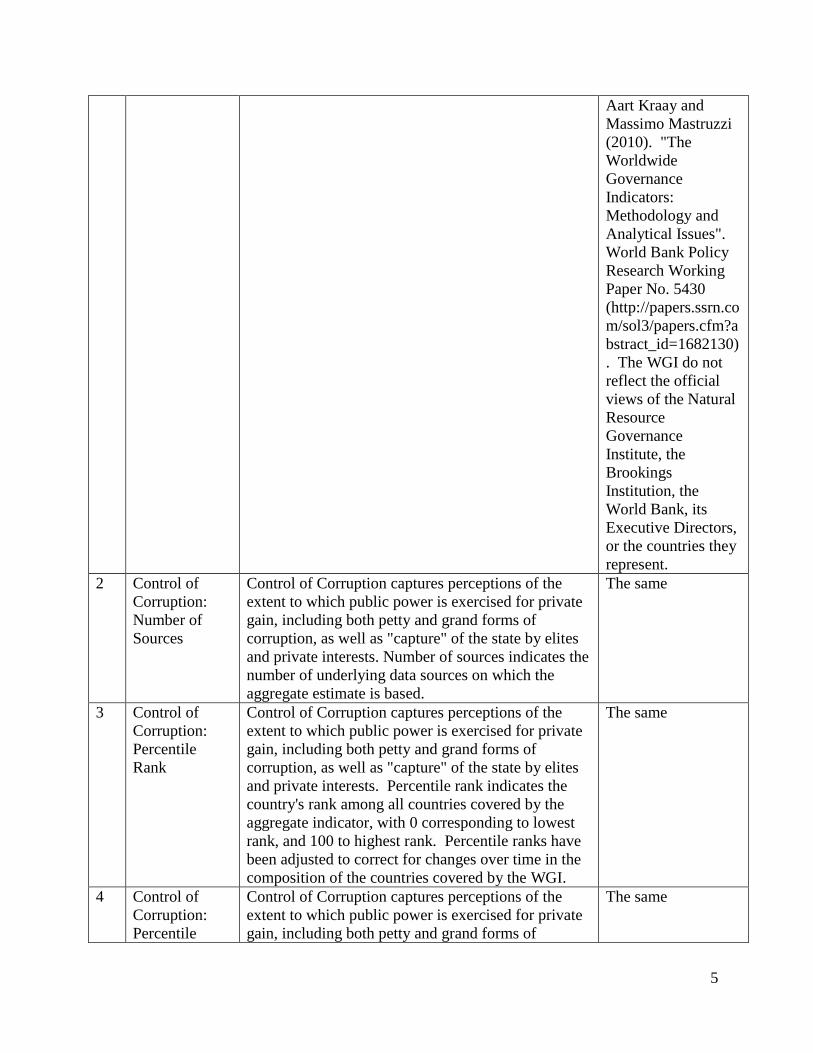
2 Control of
Corruption:
Number of
Sources
Control of Corruption captures perceptions of the
extent to which public power is exercised for private
gain, including both petty and grand forms of
corruption, as well as "capture" of the state by elites
and private interests. Number of sources indicates the
number of underlying data sources on which the
aggregate estimate is based.
The same
3 Control of
Corruption:
Percentile
Rank
Control of Corruption captures perceptions of the
extent to which public power is exercised for private
gain, including both petty and grand forms of
corruption, as well as "capture" of the state by elites
and private interests. Percentile rank indicates the
country's rank among all countries covered by the
aggregate indicator, with 0 corresponding to lowest
rank, and 100 to highest rank. Percentile ranks have
been adjusted to correct for changes over time in the
composition of the countries covered by the WGI.
The same
4 Control of
Corruption:
Percentile
Control of Corruption captures perceptions of the
extent to which public power is exercised for private
gain, including both petty and grand forms of
The same

6
Rank, Lower
Bound of 90%
Confidence
Interval
corruption, as well as "capture" of the state by elites
and private interests. Percentile rank indicates the
country's rank among all countries covered by the
aggregate indicator, with 0 corresponding to lowest
rank, and 100 to highest rank. Percentile ranks have
been adjusted to correct for changes over time in the
composition of the countries covered by the WGI.
Percentile Rank Lower refers to lower bound of 90
percent confidence interval for governance,
expressed in percentile rank terms.
5 Control of
Corruption:
Percentile
Rank, Upper
Bound of 90%
Confidence
Interval
Control of Corruption captures perceptions of the
extent to which public power is exercised for private
gain, including both petty and grand forms of
corruption, as well as "capture" of the state by elites
and private interests. Percentile rank indicates the
country's rank among all countries covered by the
aggregate indicator, with 0 corresponding to lowest
rank, and 100 to highest rank. Percentile ranks have
been adjusted to correct for changes over time in the
composition of the countries covered by the WGI.
Percentile Rank Upper refers to upper bound of 90
percent confidence interval for governance,
expressed in percentile rank terms.
The same
6 Control of
Corruption:
Standard Error
Control of Corruption captures perceptions of the
extent to which public power is exercised for private
gain, including both petty and grand forms of
corruption, as well as "capture" of the state by elites
and private interests. Standard error indicates the
precision of the estimate of governance. Larger
values of the standard error indicate less precise
estimates. A 90 percent confidence interval for the
governance estimate is given by the estimate +/- 1.64
times the standard error.
The same
Government
Effectiveness
1 Government
Effectiveness:
Estimate
Government Effectiveness captures perceptions of
the quality of public services, the quality of the civil
service and the degree of its independence from
political pressures, the quality of policy formulation
and implementation, and the credibility of the
government's commitment to such policies. Estimate
gives the country's score on the aggregate indicator,
in units of a standard normal distribution, i.e. ranging
from approximately -2.5 to 2.5.
The same
2 Government
Effectiveness:
Government Effectiveness captures perceptions of
the quality of public services, the quality of the civil
The same

7
Number of
Sources
service and the degree of its independence from
political pressures, the quality of policy formulation
and implementation, and the credibility of the
government's commitment to such policies. Number
of sources indicates the number of underlying data
sources on which the aggregate estimate is based.
3 Government
Effectiveness:
Percentile
Rank
Government Effectiveness captures perceptions of
the quality of public services, the quality of the civil
service and the degree of its independence from
political pressures, the quality of policy formulation
and implementation, and the credibility of the
government's commitment to such policies.
Percentile rank indicates the country's rank among all
countries covered by the aggregate indicator, with 0
corresponding to lowest rank, and 100 to highest
rank. Percentile ranks have been adjusted to correct
for changes over time in the composition of the
countries covered by the WGI.
The same
4 Government
Effectiveness:
Percentile
Rank, Lower
Bound of 90%
Confidence
Interval
Government Effectiveness captures perceptions of
the quality of public services, the quality of the civil
service and the degree of its independence from
political pressures, the quality of policy formulation
and implementation, and the credibility of the
government's commitment to such policies.
Percentile rank indicates the country's rank among all
countries covered by the aggregate indicator, with 0
corresponding to lowest rank, and 100 to highest
rank. Percentile ranks have been adjusted to correct
for changes over time in the composition of the
countries covered by the WGI. Percentile Rank
Lower refers to lower bound of 90 percent
confidence interval for governance, expressed in
percentile rank terms.
The same
5 Government
Effectiveness:
Percentile
Rank, Upper
Bound of 90%
Confidence
Interval
Government Effectiveness captures perceptions of
the quality of public services, the quality of the civil
service and the degree of its independence from
political pressures, the quality of policy formulation
and implementation, and the credibility of the
government's commitment to such policies.
Percentile rank indicates the country's rank among all
countries covered by the aggregate indicator, with 0
corresponding to lowest rank, and 100 to highest
rank. Percentile ranks have been adjusted to correct
for changes over time in the composition of the
countries covered by the WGI. Percentile Rank
Upper refers to upper bound of 90 percent confidence
The same

8
interval for governance, expressed in percentile rank
terms.
6 Government
Effectiveness:
Standard Error
Government Effectiveness captures perceptions of
the quality of public services, the quality of the civil
service and the degree of its independence from
political pressures, the quality of policy formulation
and implementation, and the credibility of the
government's commitment to such policies. Standard
error indicates the precision of the estimate of
governance. Larger values of the standard error
indicate less precise estimates. A 90 percent
confidence interval for the governance estimate is
given by the estimate +/- 1.64 times the standard
error.
The same
Political
Stability and
Absence of
Violence/Terr
orism
1 Political
Stability and
Absence of
Violence/Terro
rism: Estimate
Political Stability and Absence of Violence/Terrorism
measures perceptions of the likelihood of political
instability and/or politically-motivated violence,
including terrorism. Estimate gives the country's
score on the aggregate indicator, in units of a
standard normal distribution, i.e. ranging from
approximately -2.5 to 2.5.
The same
2 Political
Stability and
Absence of
Violence/Terro
rism: Number
of Sources
Political Stability and Absence of Violence/Terrorism
measures perceptions of the likelihood of political
instability and/or politically-motivated violence,
including terrorism. Number of sources indicates the
number of underlying data sources on which the
aggregate estimate is based.
The same
3 Political
Stability and
Absence of
Violence/Terro
rism:
Percentile
Rank
Political Stability and Absence of Violence/Terrorism
measures perceptions of the likelihood of political
instability and/or politically-motivated violence,
including terrorism. Percentile rank indicates the
country's rank among all countries covered by the
aggregate indicator, with 0 corresponding to lowest
rank, and 100 to highest rank. Percentile ranks have
been adjusted to correct for changes over time in the
composition of the countries covered by the WGI.
The same
4 Political
Stability and
Absence of
Violence/Terro
rism:
Political Stability and Absence of Violence/Terrorism
measures perceptions of the likelihood of political
instability and/or politically-motivated violence,
including terrorism. Percentile rank indicates the
country's rank among all countries covered by the
The same

9
Percentile
Rank, Lower
Bound of 90%
Confidence
Interval
aggregate indicator, with 0 corresponding to lowest
rank, and 100 to highest rank. Percentile ranks have
been adjusted to correct for changes over time in the
composition of the countries covered by the WGI.
Percentile Rank Lower refers to lower bound of 90
percent confidence interval for governance,
expressed in percentile rank terms.
5 Political
Stability and
Absence of
Violence/Terro
rism:
Percentile
Rank, Upper
Bound of 90%
Confidence
Interval
Political Stability and Absence of Violence/Terrorism
measures perceptions of the likelihood of political
instability and/or politically-motivated violence,
including terrorism. Percentile rank indicates the
country's rank among all countries covered by the
aggregate indicator, with 0 corresponding to lowest
rank, and 100 to highest rank. Percentile ranks have
been adjusted to correct for changes over time in the
composition of the countries covered by the WGI.
Percentile Rank Upper refers to upper bound of 90
percent confidence interval for governance,
expressed in percentile rank terms.
The same
6 Political
Stability and
Absence of
Violence/Terro
rism: Standard
Error
Political Stability and Absence of Violence/Terrorism
measures perceptions of the likelihood of political
instability and/or politically-motivated violence,
including terrorism. Standard error indicates the
precision of the estimate of governance. Larger
values of the standard error indicate less precise
estimates. A 90 percent confidence interval for the
governance estimate is given by the estimate +/- 1.64
times the standard error.
The same
Regulatory
Quality
1 Regulatory
Quality:
Estimate
Regulatory Quality captures perceptions of the ability
of the government to formulate and implement sound
policies and regulations that permit and promote
private sector development. Estimate gives the
country's score on the aggregate indicator, in units of
a standard normal distribution, i.e. ranging from
approximately -2.5 to 2.5.
The same
2 Regulatory
Quality:
Number of
Sources
Regulatory Quality captures perceptions of the ability
of the government to formulate and implement sound
policies and regulations that permit and promote
private sector development. umber of sources
indicates the number of underlying data sources on
which the aggregate estimate is based.
The same
3 Regulatory
Quality:
Percentile
Regulatory Quality captures perceptions of the ability
of the government to formulate and implement sound
policies and regulations that permit and promote
The same
10
Rank private sector development. Percentile rank indicates
the country's rank among all countries covered by the
aggregate indicator, with 0 corresponding to lowest
rank, and 100 to highest rank. Percentile ranks have
been adjusted to correct for changes over time in the
composition of the countries covered by the WGI.
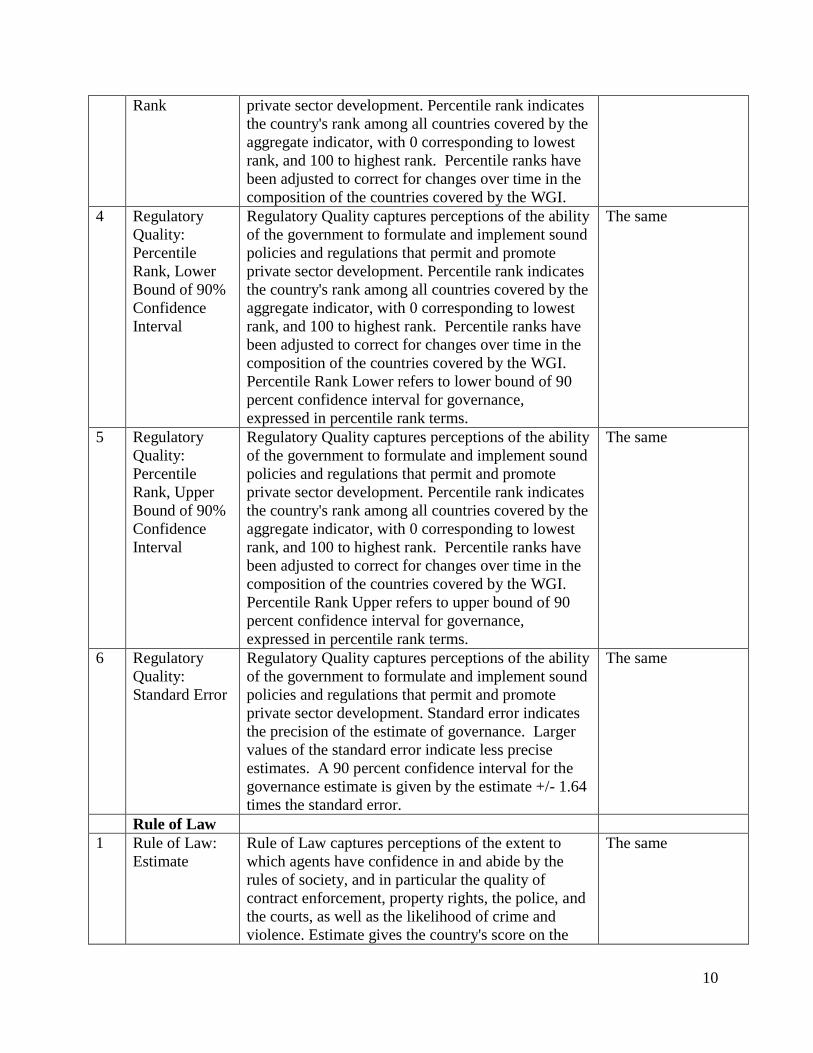
4 Regulatory
Quality:
Percentile
Rank, Lower
Bound of 90%
Confidence
Interval
Regulatory Quality captures perceptions of the ability
of the government to formulate and implement sound
policies and regulations that permit and promote
private sector development. Percentile rank indicates
the country's rank among all countries covered by the
aggregate indicator, with 0 corresponding to lowest
rank, and 100 to highest rank. Percentile ranks have
been adjusted to correct for changes over time in the
composition of the countries covered by the WGI.
Percentile Rank Lower refers to lower bound of 90
percent confidence interval for governance,
expressed in percentile rank terms.
The same
5 Regulatory
Quality:
Percentile
Rank, Upper
Bound of 90%
Confidence
Interval
Regulatory Quality captures perceptions of the ability
of the government to formulate and implement sound
policies and regulations that permit and promote
private sector development. Percentile rank indicates
the country's rank among all countries covered by the
aggregate indicator, with 0 corresponding to lowest
rank, and 100 to highest rank. Percentile ranks have
been adjusted to correct for changes over time in the
composition of the countries covered by the WGI.
Percentile Rank Upper refers to upper bound of 90
percent confidence interval for governance,
expressed in percentile rank terms.
The same
6 Regulatory
Quality:
Standard Error
Regulatory Quality captures perceptions of the ability
of the government to formulate and implement sound
policies and regulations that permit and promote
private sector development. Standard error indicates
the precision of the estimate of governance. Larger
values of the standard error indicate less precise
estimates. A 90 percent confidence interval for the
governance estimate is given by the estimate +/- 1.64
times the standard error.
The same
Rule of Law
1 Rule of Law:
Estimate
Rule of Law captures perceptions of the extent to
which agents have confidence in and abide by the
rules of society, and in particular the quality of
contract enforcement, property rights, the police, and
the courts, as well as the likelihood of crime and
violence. Estimate gives the country's score on the
The same

11
aggregate indicator, in units of a standard normal
distribution, i.e. ranging from approximately -2.5 to
2.5.
2 Rule of Law:
Number of
Sources
Rule of Law captures perceptions of the extent to
which agents have confidence in and abide by the
rules of society, and in particular the quality of
contract enforcement, property rights, the police, and
the courts, as well as the likelihood of crime and
violence. Number of sources indicates the number of
underlying data sources on which the aggregate
estimate is based.
The same
3 Rule of Law:
Percentile
Rank
Rule of Law captures perceptions of the extent to
which agents have confidence in and abide by the
rules of society, and in particular the quality of
contract enforcement, property rights, the police, and
the courts, as well as the likelihood of crime and
violence. Percentile rank indicates the country's rank
among all countries covered by the aggregate
indicator, with 0 corresponding to lowest rank, and
100 to highest rank. Percentile ranks have been
adjusted to correct for changes over time in the
composition of the countries covered by the WGI.
The same
4 Rule of Law:
Percentile
Rank, Lower
Bound of 90%
Confidence
Interval
Rule of Law captures perceptions of the extent to
which agents have confidence in and abide by the
rules of society, and in particular the quality of
contract enforcement, property rights, the police, and
the courts, as well as the likelihood of crime and
violence. Percentile rank indicates the country's rank
among all countries covered by the aggregate
indicator, with 0 corresponding to lowest rank, and
100 to highest rank. Percentile ranks have been
adjusted to correct for changes over time in the
composition of the countries covered by the WGI.
Percentile Rank Lower refers to lower bound of 90
percent confidence interval for governance,
expressed in percentile rank terms.
The same
5 Rule of Law:
Percentile
Rank, Upper
Bound of 90%
Confidence
Interval
Rule of Law captures perceptions of the extent to
which agents have confidence in and abide by the
rules of society, and in particular the quality of
contract enforcement, property rights, the police, and
the courts, as well as the likelihood of crime and
violence. Percentile rank indicates the country's rank
among all countries covered by the aggregate
indicator, with 0 corresponding to lowest rank, and
100 to highest rank. Percentile ranks have been
adjusted to correct for changes over time in the
The same

12
composition of the countries covered by the WGI.
Percentile Rank Upper refers to upper bound of 90
percent confidence interval for governance,
expressed in percentile rank terms.
6 Rule of Law:
Standard Error
Rule of Law captures perceptions of the extent to
which agents have confidence in and abide by the
rules of society, and in particular the quality of
contract enforcement, property rights, the police, and
the courts, as well as the likelihood of crime and
violence. Standard error indicates the precision of the
estimate of governance. Larger values of the
standard error indicate less precise estimates. A 90
percent confidence interval for the governance
estimate is given by the estimate +/- 1.64 times the
standard error.
The same
Voice and
Accountabilit
y
1 Voice and
Accountability:
Estimate
Voice and Accountability captures perceptions of the
extent to which a country's citizens are able to
participate in selecting their government, as well as
freedom of expression, freedom of association, and a
free media. Estimate gives the country's score on the
aggregate indicator, in units of a standard normal
distribution, i.e. ranging from approximately -2.5 to
2.5.
The same
2 Voice and
Accountability:
Number of
Sources
Voice and Accountability captures perceptions of the
extent to which a country's citizens are able to
participate in selecting their government, as well as
freedom of expression, freedom of association, and a
free media. Number of sources indicates the number
of underlying data sources on which the aggregate
estimate is based.
The same
3 Voice and
Accountability:
Percentile
Rank
Voice and Accountability captures perceptions of the
extent to which a country's citizens are able to
participate in selecting their government, as well as
freedom of expression, freedom of association, and a
free media. Percentile rank indicates the country's
rank among all countries covered by the aggregate
indicator, with 0 corresponding to lowest rank, and
100 to highest rank. Percentile ranks have been
adjusted to correct for changes over time in the
composition of the countries covered by the WGI.
The same
4 Voice and
Accountability:
Percentile
Voice and Accountability captures perceptions of the
extent to which a country's citizens are able to
participate in selecting their government, as well as
The same
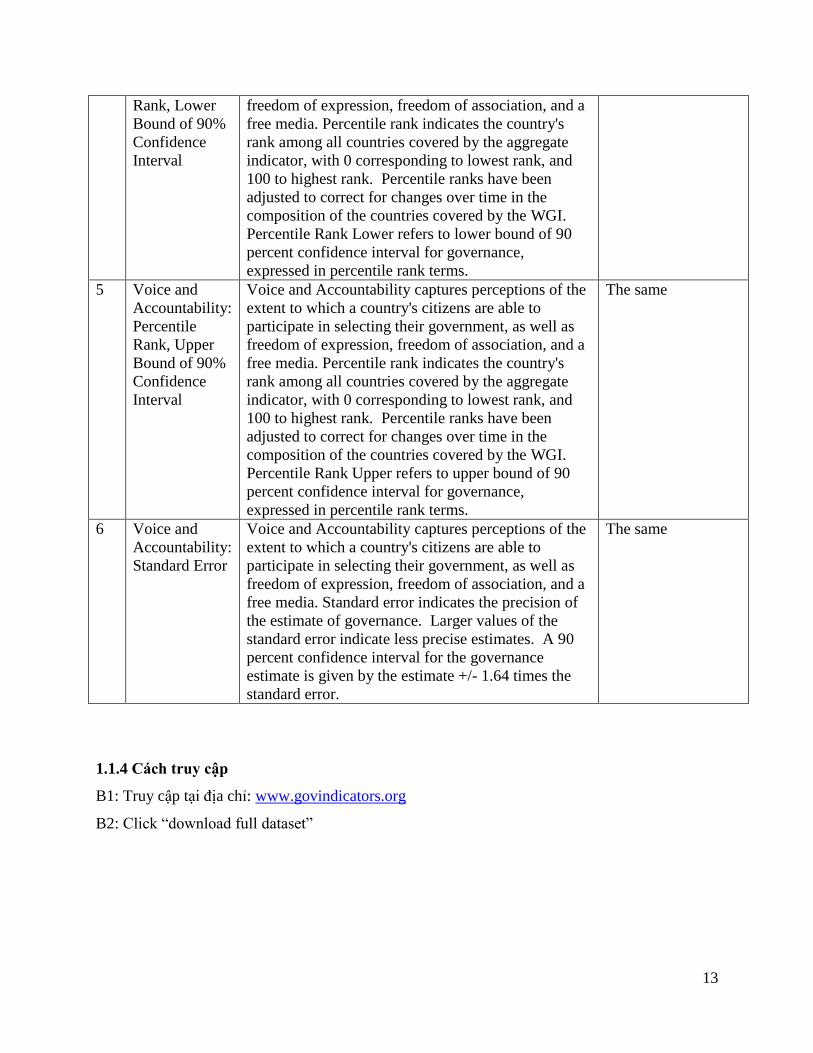
13
Rank, Lower
Bound of 90%
Confidence
Interval
freedom of expression, freedom of association, and a
free media. Percentile rank indicates the country's
rank among all countries covered by the aggregate
indicator, with 0 corresponding to lowest rank, and
100 to highest rank. Percentile ranks have been
adjusted to correct for changes over time in the
composition of the countries covered by the WGI.
Percentile Rank Lower refers to lower bound of 90
percent confidence interval for governance,
expressed in percentile rank terms.
5 Voice and
Accountability:
Percentile
Rank, Upper
Bound of 90%
Confidence
Interval
Voice and Accountability captures perceptions of the
extent to which a country's citizens are able to
participate in selecting their government, as well as
freedom of expression, freedom of association, and a
free media. Percentile rank indicates the country's
rank among all countries covered by the aggregate
indicator, with 0 corresponding to lowest rank, and
100 to highest rank. Percentile ranks have been
adjusted to correct for changes over time in the
composition of the countries covered by the WGI.
Percentile Rank Upper refers to upper bound of 90
percent confidence interval for governance,
expressed in percentile rank terms.
The same
6 Voice and
Accountability:
Standard Error
Voice and Accountability captures perceptions of the
extent to which a country's citizens are able to
participate in selecting their government, as well as
freedom of expression, freedom of association, and a
free media. Standard error indicates the precision of
the estimate of governance. Larger values of the
standard error indicate less precise estimates. A 90
percent confidence interval for the governance
estimate is given by the estimate +/- 1.64 times the
standard error.
The same
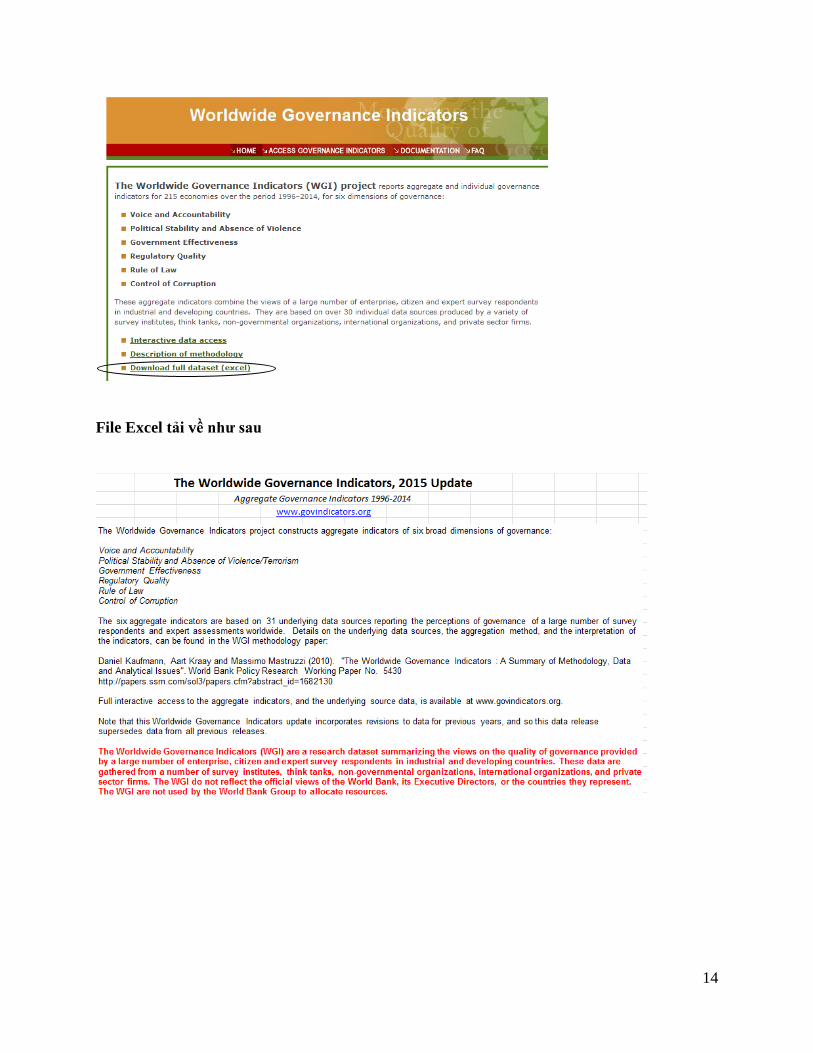
1.1.4 Cách truy cập
B1: Truy cập tại địa chỉ: www.govindicators.org
B2: Click “download full dataset”
14
File Excel tải về như sau

15
1.2 Chỉ số cảm nhận tham nhũng (Corruption Perceptions Index - CPI)
1.2.1 Giới thiệu
Chỉ số cảm nhận tham nhũng (Corruption Perceptions Index - CPI) của tổ chức
International Transparancy ra đời năm 199 như là một chỉ số tổng hợp dùng để đo lường cảm
nhận về tham nhũng ở khu vực công ở nhiều quốc gia khác nhau trên thế giới. Đây là một trong
các chỉ số về tham nhũng được sử dụng rộng rãi trên thế giới.
1.2.2 Phương pháp tính toán chỉ số CPI
Chỉ số cảm nhận tham nhũng được xây dựng dựa trên nhiều nguồn dữ liệu của nhiều tổ
chức có uy tín. Phương pháp tính CPI dựa trên bốn bước: Lựa chọn nguồn dữ liệu, Chuẩn hóa dữ
liệu, Tính toán chỉ số CPI, Báo cáo kết quả.
Bước 1: Lựa chọn nguồn dữ liệu
Chỉ số CPI được tính toán dựa trên nhiều nguồn dữ liệu về tham nhũng khác nhau. Mỗi
nguồn dữ liệu phải đáp ứng các tiêu chí sau để được sử dụng trong tính toán CPI:
Đo lường cảm nhận về tham nhũng ở khu vực công
Dựa trên phương pháp đáng tin cậy, cho điểm và xếp hạng nhiều quốc gia
Được tiến hành bởi những những tổ chức uy tín và lập lại thường xuyên
Thang đo trong dữ liệu phải đủ rộng để cho thấy sự khác nhau giữa các quốc gia
Dựa trên các tiêu chí này, có 13 nguồn dữ liệu được sử dụng để tính toán chỉ số CPI: (1)
African Development Bank Governance Ratings, (2) Bertelsmann Foundation Sustainable
Governance Indicators, (3) Bertelsmann Foundation Transformation Index, (4) Economist
Intelligence Unit Country Risk Ratings, (5) Freedom House Nations in Transit, (6) Global
Insight Country Risk Ratings, (7) IMD World Competitiveness Yearbook, (8) Political and
Economic Risk Consultancy Asian Intelligence, (9) Political Risk Services International Country
Risk Guide, (10) Transparency International Bribe Payers Survey, (11) World Bank - Country
Policy and Institutional Assessment, (12) World Economic Forum Executive Opinion Survey
(EOS), (13) World Justice Project Rule of Law Index.
Bước 2: Chuẩn hóa dữ liệu
Dữ liệu được chuẩn hóa theo thang từ 1-100 với 0 = cảm nhận tham nhũng thấp nhất và
100 = cảm nhận tham nhũng cao nhất. Quá trình chuẩn hóa về điểm z (z-scores) được tiến hành
bằng cách trừ dữ liệu thô cho giá trị trung bình và chia cho độ lệch chuẩn. Để điểm z này có thể
16
so sánh được giữa các bộ dữ liệu, giá trị trung bình chung là khoảng 45 và độ lệch chuẩn chung
là khoảng 20 để toàn bộ dữ liệu phù hợp với thang đo CPI 0-100.
Bước 3: Tính toán chỉ số CPI
Đối với một nền kinh tế trong tính toán CPI, tối thiểu phải có ba nguồn dữ liệu khác
nhau. CPI của quốc gia được tính toán như là trung bình đơn giản của tất cả điểm số chuẩn hóa
cho quốc gia đó. Tất cả các điểm này được làm tròn.
Bước 4: Báo cáo kết quả
Chỉ số CPI được đi kèm bởi sai số chuẩn (standard error) và khoảng tin cậy (confidence
interval), dùng để nắm bắt sự dao động trong điểm số từ nhiều nguồn khác nhau dùng trong tính
toán CPI của quốc gia đó.
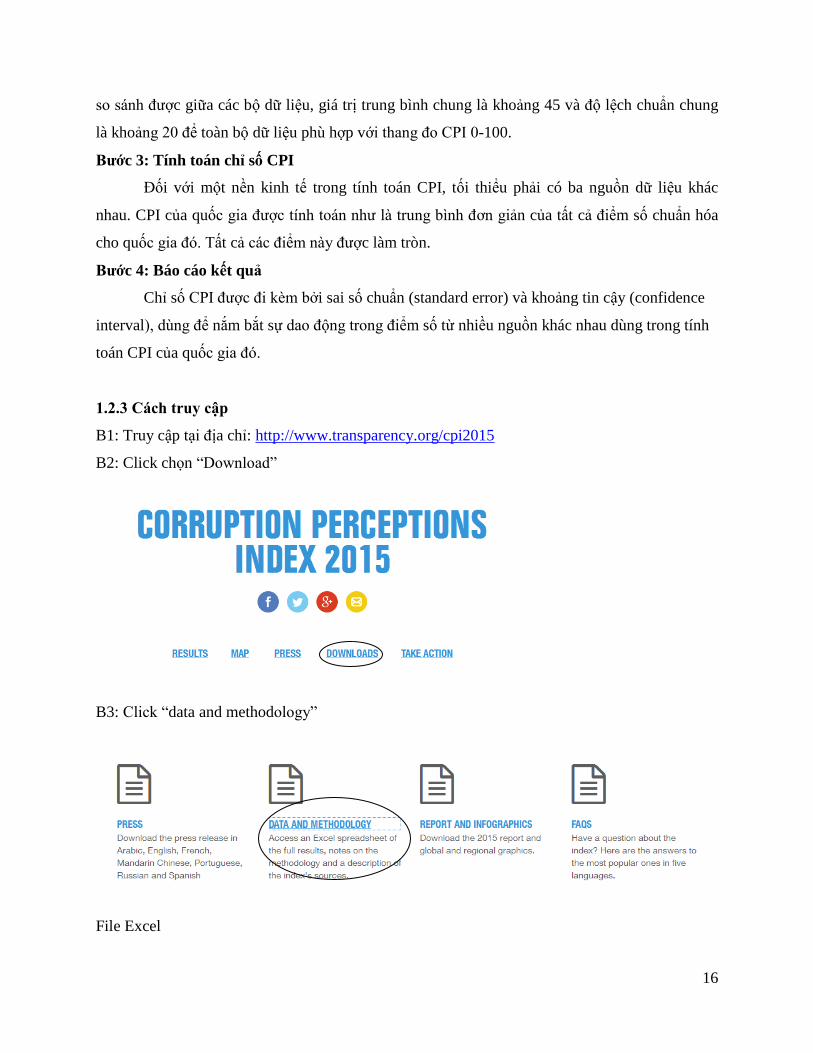
1.2.3 Cách truy cập
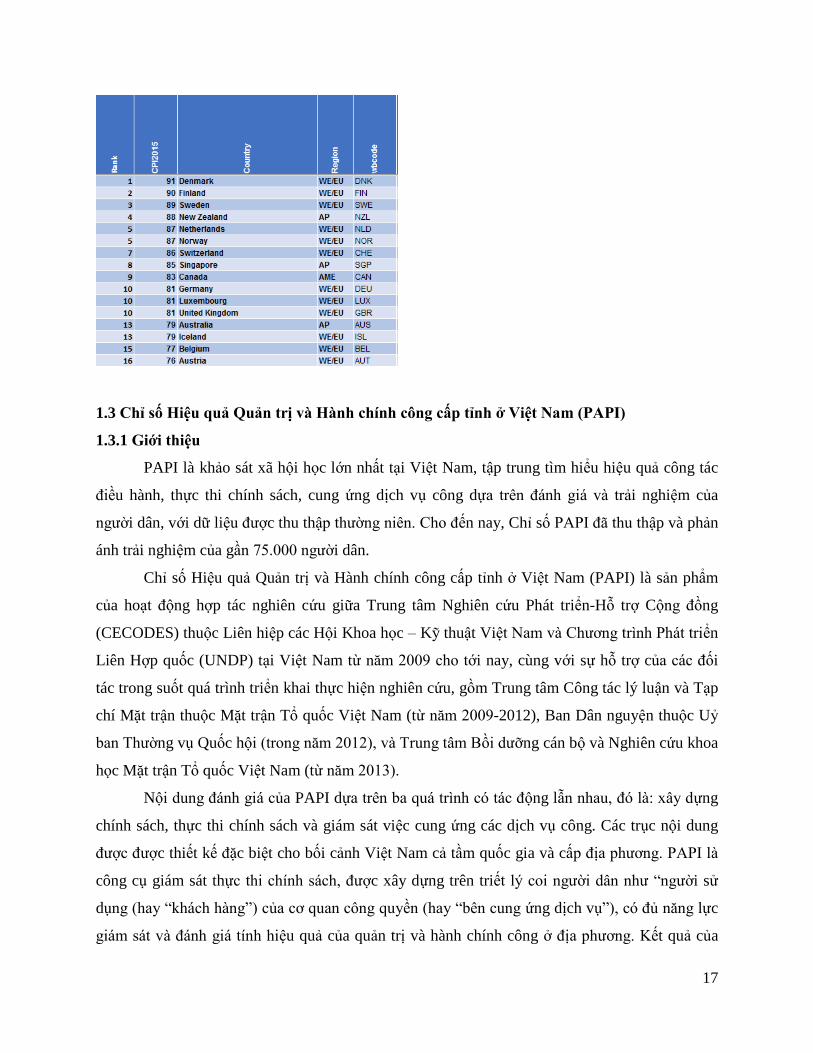
B1: Truy cập tại địa chỉ: http://www.transparency.org/cpi2015
B2: Click chọn “Download”
B3: Click “data and methodology”
File Excel
17
1.3 Chỉ số Hiệu quả Quản trị và Hành chính công cấp tỉnh ở Việt Nam (PAPI)
1.3.1 Giới thiệu
PAPI là khảo sát xã hội học lớn nhất tại Việt Nam, tập trung tìm hiểu hiệu quả công tác
điều hành, thực thi chính sách, cung ứng dịch vụ công dựa trên đánh giá và trải nghiệm của
người dân, với dữ liệu được thu thập thường niên. Cho đến nay, Chỉ số PAPI đã thu thập và phản
ánh trải nghiệm của gần 7 .000 người dân.
Chỉ số Hiệu quả Quản trị và Hành chính công cấp tỉnh ở Việt Nam (PAPI) là sản phẩm
của hoạt động hợp tác nghiên cứu giữa Trung tâm Nghiên cứu Phát triển-Hỗ trợ Cộng đồng
(CECODES) thuộc Liên hiệp các Hội Khoa học – Kỹ thuật Việt Nam và Chương trình Phát triển
Liên Hợp quốc (UNDP) tại Việt Nam từ năm 2009 cho tới nay, cùng với sự hỗ trợ của các đối
tác trong suốt quá trình triển khai thực hiện nghiên cứu, gồm Trung tâm Công tác lý luận và Tạp
chí Mặt trận thuộc Mặt trận Tổ quốc Việt Nam (từ năm 2009-2012), Ban Dân nguyện thuộc Uỷ
ban Thường vụ Quốc hội (trong năm 2012), và Trung tâm Bồi dưỡng cán bộ và Nghiên cứu khoa
học Mặt trận Tổ quốc Việt Nam (từ năm 2013).
Nội dung đánh giá của PAPI dựa trên ba quá trình có tác động lẫn nhau, đó là xây dựng
chính sách, thực thi chính sách và giám sát việc cung ứng các dịch vụ công. Các trục nội dung
được được thiết kế đặc biệt cho bối cảnh Việt Nam cả tầm quốc gia và cấp địa phương. PAPI là
công cụ giám sát thực thi chính sách, được xây dựng trên triết lý coi người dân như “người sử
dụng (hay “khách hàng”) của cơ quan công quyền (hay “bên cung ứng dịch vụ”), có đủ năng lực
giám sát và đánh giá tính hiệu quả của quản trị và hành chính công ở địa phương. Kết quả của
18
các chu trình nghiên cứu PAPI là những bộ dữ liệu đánh giá khách quan về chất lượng quản trị
quốc gia dựa trên trải nghiệm của người dân đầu tiên ở Việt Nam và được chia sẻ rộng rãi. Dựa
trên kiến thức và trải nghiệm của „khách hàng‟ đối với các „sản phẩm‟ của toàn bộ quá trình „sản
xuất‟ của bộ máy nhà nước, PAPI cung cấp hệ thống chỉ báo khách quan góp phần đánh giá hiệu
quả quản trị và hành chính công cấp tỉnh, tạo động lực để lãnh đạo các cấp tại địa phương ngày
càng nâng cao hiệu quả quản lý của mình. PAPI nhận được sự hỗ trợ hiệu quả về chuyên môn và
kỹ thuật của Ban Tư vấn quốc gia dự án PAPI và Nhóm chuyên gia quốc tế về đo lường quản trị
nhà nước.
1.3.2 Phương pháp tính toán chỉ số PAPI
Chỉ số Hiệu quả quản trị và hành chính công cấp tỉnh (PAPI) bao gồm 6 chỉ số lĩnh vực
nội dung, 22 chỉ số nội dung thành phần và 92 chỉ tiêu thành phần về hiệu quả quản trị và hành
chính công của toàn bộ 63 tỉnh/thành phố. Chỉ số PAPI được cấu thành từ việc tính toán, tổng
hợp từ 5.796 biến số cấu thành chỉ tiêu, nhóm thành 1.368 biến số cấu thành chỉ số thành phần và
378 biến số cấu thành sáu lĩnh vực nội dung.
6 chỉ số nội dung:
1. Tham gia của người dân ở cấp cơ sở
2. Công khai, minh bạch
3. Trách nhiệm giải trình với người dân
4. Kiểm soát tham nhũng trong khu vực công
5. Thủ tục hành chính công
6. Cung ứng dịch vụ công
Mỗi chỉ số có giá trị 1 (thấp nhất) - 10 (cao nhất)
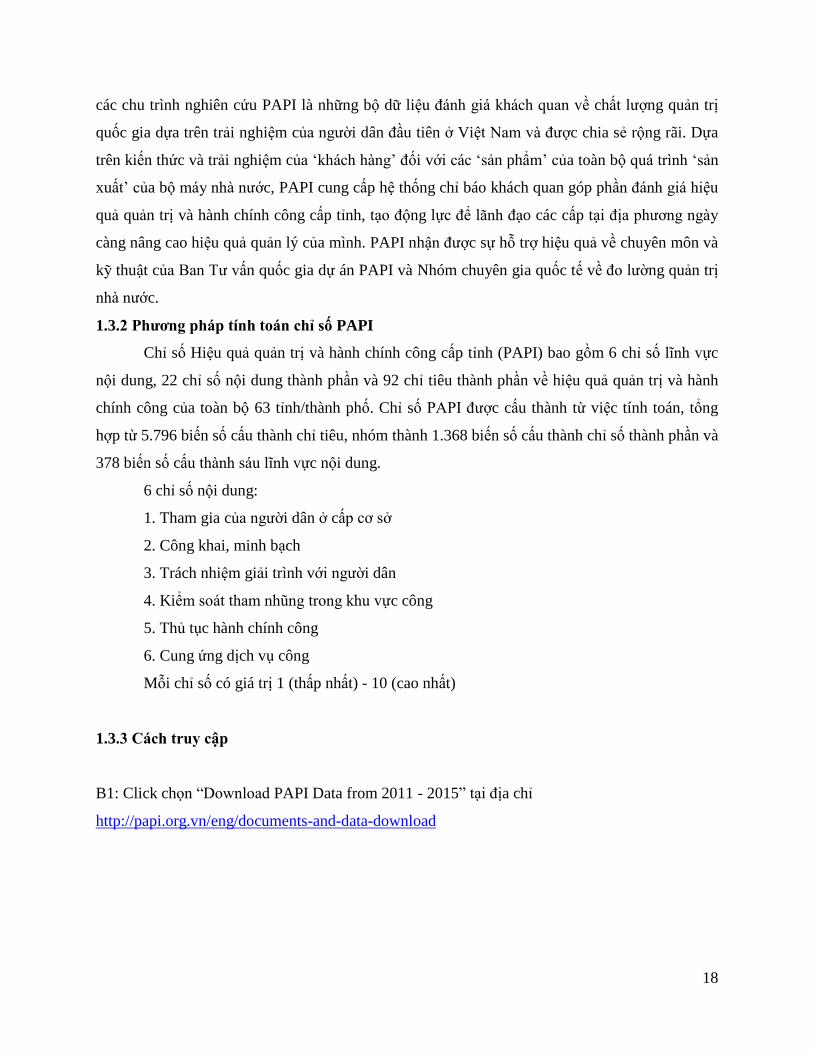
1.3.3 Cách truy cập
B1: Click chọn “Download PAPI Data from 2011 - 2015” tại địa chỉ
http://papi.org.vn/eng/documents-and-data-download
19
File Excel
2. NGHIÊN CỨU SỬ DỤNG DỮ LIỆU THỂ CHẾ
2.1 Nghiên cứu sử dụng dữ liệu Worldwide Governance Indicators và Corruption
Perceptions Index

20
No Study Research
objectives and
scope
Data (key
institution
variables)
Methods Results
1 Rodríguez-Pose,
A., & Di Cataldo,
M. (2014). Quality
of government and
innovative
performance in the
regions of Europe.
Journal of
Economic
Geography
- Examine how
institutions shape
innovative capacity,
by focusing on how
regional government
quality affects
innovative
performance in the
regions of Europe in
1997-2009.
- Control of
corruption
- Rule of law
- Government
effectiveness
- Government
accountability
- Quality of
government
(elaborated by
the University
of Gothenburg
adopting the
World Bank
Governance
Indicators)
- Fixed-
effects
regressions
- GMM
- Ineffective and
corrupt governments
represent a
fundamental barrier
for the innovative
capacity of the EU.
21
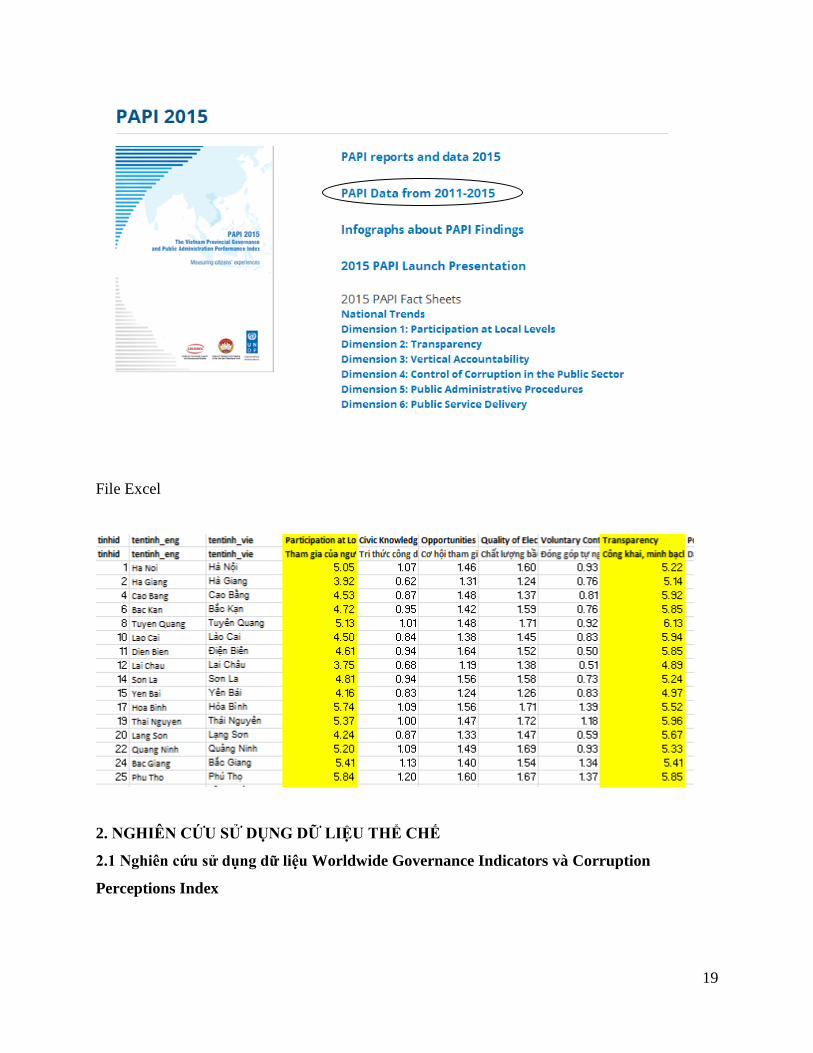
2 Hessami, Z.
(2014). Political
corruption, public
procurement, and
budget
composition:
Theory and
evidence from
OECD countries.
European Journal
of Political
Economy, 34, 372-
389
- Examine the
relation between
political corruption
and public spending
in 29 OECD
countries for the
period 1996–2009.
- Corruption
Perceptions
Index (CPI)
- Dependent
variable (one of
ten expenditure
types as a share
of total public
expenditures:
Social
protection,
Health,
Education,
Defense,
General public
services, Public
order & safety,
Economic
affairs, Housing
& community
amenities,
Environmental
protection,
Recreation,
culture and
religion)
- Fixed-
effects
regressions
- When countries'
corruption indicators
increase, the shares
of rent-creating
public spending
(health and
environmental
protection) in
government budgets
also increase.
* The theoretical
model predicts that
corruption distorts
budgetary allocation
in favor of sectors
with non-competitive
industries: Health
equipment involves
high-technology.
Especially, when
such medical
equipment is new on
the market there are
very few competitors
that supply public
hospitals with these
innovative products.
For this reason, they
are produced in
monopolistic or
oligopolistic markets
(Robone and Zanardi,
2006).
With regard to
expenditures on
waste (water)
management, there is
mounting evidence
for corruption in
particular related to
the multi-million
dollar construction of
waste plants.

22
3 D‟agostino, G.,
Dunne, J. P., &
Pieroni, L. (2016).
Government
Spending,
Corruption and
Economic Growth.
World
Development, 84,
190-205.
- Investigate the
impacts of
corruption on
relationship between
government
spending and
economic growth in
106 countries over
the period 1996–
2010.
- Control of
Corruption
- Corruption
Perceptions
Index (CPI)
- Regulatory
Quality
- Political
Stability
- GMM - Government
investment spending
enhances economic
growth, while large
military burden,
current government
spending and high
levels of corruption
have negative effects
on economic growth.
- Corruption makes
the negative effect of
military burden on
the growth rate
stronger, suggesting
that combating
corruption is likely to
both directly increase
aggregate economic
performance, but also
have an indirect
effect of reducing the
negative impact of
military burden.
4 Estrin, S., Meyer,
K. E., Nielsen, B.
B., & Nielsen, S.
(2016). Home
country institutions
and the
internationalization
of state owned
enterprises: A
cross-country
analysis. Journal
of World Business,
51(2), 294-307.
- Examine how
home country
institutions affect the
comparative
internationalization
levels of listed SOEs
and privately owned
enterprises (POEs)
based on a matched
sample of 153
majority state owned
and 153 wholly
privately owned
listed firms from 40
different countries
- Rule of law
- Tobit
model
- Home country
institutions enable
effective control, the
internationalization
strategies of listed
SOEs and POEs.
5 Iwasaki, I., &
Suzuki, T. (2012).
The determinants
of corruption in
transition
economies.
Economics Letters,
114(1), 54-60.
- Examine the
determinants of
corruption in 32
transition economies
in the regions of
Central and Eastern
Europe, the former
Soviet Union, and
Asia from 1998
through 2006.
- Control of
Corruption
- Rule of law
- Political
democratization
- Panel
regression
- The progress of
structural reform, rule
of law, and
democratization had
a crucial impact on
the extent of
corruption control.
23
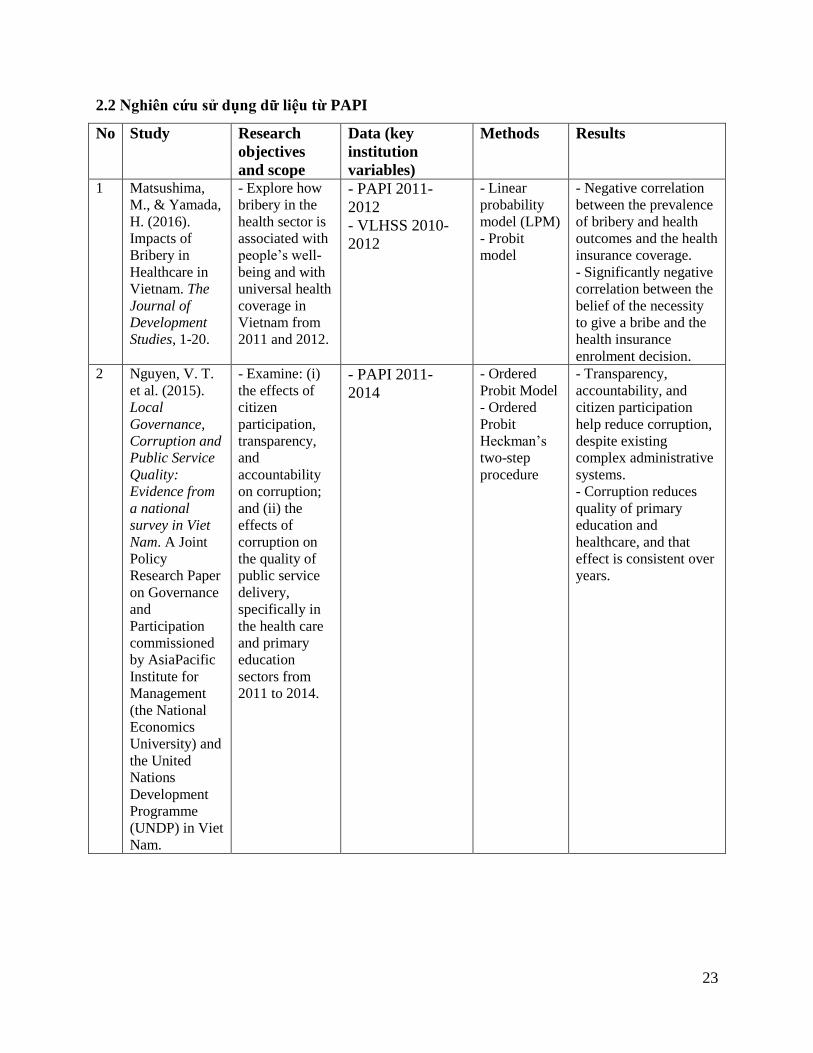
2.2 Nghiên cứu sử dụng dữ liệu từ PAPI
No Study Research
objectives
and scope
Data (key
institution
variables)
Methods Results
1 Matsushima,
M., & Yamada,
H. (2016).
Impacts of
Bribery in
Healthcare in
Vietnam. The
Journal of
Development
Studies, 1-20.
- Explore how
bribery in the
health sector is
associated with
people‟s well-
being and with
universal health
coverage in
Vietnam from
2011 and 2012.
- PAPI 2011-
2012
- VLHSS 2010-
2012
- Linear
probability
model (LPM)
- Probit
model
- Negative correlation
between the prevalence
of bribery and health
outcomes and the health
insurance coverage.
- Significantly negative
correlation between the
belief of the necessity
to give a bribe and the
health insurance
enrolment decision.
2 Nguyen, V. T.
et al. (2015).
Local
Governance,
Corruption and
Public Service
Quality:
Evidence from
a national
survey in Viet
Nam. A Joint
Policy
Research Paper
on Governance
and
Participation
commissioned
by AsiaPacific
Institute for
Management
(the National
Economics
University) and
the United
Nations
Development
Programme
(UNDP) in Viet
Nam.
- Examine: (i)
the effects of
citizen
participation,
transparency,
and
accountability
on corruption;
and (ii) the
effects of
corruption on
the quality of
public service
delivery,
specifically in
the health care
and primary
education
sectors from
2011 to 2014.
- PAPI 2011-
2014
- Ordered
Probit Model
- Ordered
Probit
Heckman‟s
two-step
procedure
- Transparency,
accountability, and
citizen participation
help reduce corruption,
despite existing
complex administrative
systems.
- Corruption reduces
quality of primary
education and
healthcare, and that
effect is consistent over
years.

24
Tài liệu tham khảo
Rodríguez-Pose, A., & Di Cataldo, M. (2014). Quality of government and innovative
performance in the regions of Europe. Journal of Economic Geography
Hessami, Z. (2014). Political corruption, public procurement, and budget composition: Theory
and evidence from OECD countries. European Journal of Political Economy, 34, 372-
389
D‟agostino, G., Dunne, J. P., & Pieroni, L. (2016). Government pending, Corruption and
Economic Growth. World Development, 84, 190-205.
Estrin, S., Meyer, K. E., Nielsen, B. B., & Nielsen, S. (2016). Home country institutions and the
internationalization of state owned enterprises: A cross-country analysis. Journal of
World Business, 51(2), 294-307.
Iwasaki, I., & Suzuki, T. (2012). The determinants of corruption in transition economies.
Economics Letters, 114(1), 54-60.
Matsushima, M., & Yamada, H. (2016). Impacts of Bribery in Healthcare in Vietnam. The
Journal of Development Studies, 1-20.
Nguyen, V. T. et al. (2015). Local Governance, Corruption and Public Service Quality:
Evidence from a national survey in Viet Nam. A Joint Policy Research Paper on
Governance and Participation commissioned by AsiaPacific Institute for Management
(the National Economics University) and the United Nations Development Programme
(UNDP) in Viet Nam.