universal quenching probe system: flexible, specific, and ... · primer (forward primer) consists...
TRANSCRIPT

Universal Quenching Probe System: Flexible,Specific, and Cost-Effective Real-Time PolymeraseChain Reaction Method
Hidenori Tani,†,‡ Ryo Miyata,‡ Kouhei Ichikawa,§ Soji Morishita,†,‡ Shinya Kurata,§
Kazunori Nakamura,§ Satoshi Tsuneda,† Yuji Sekiguchi,‡ and Naohiro Noda*,‡,†
Department of Life Science and Medical Bio-Science, Waseda University, 2-2 Wakamatsu-cho, Shinjuku-ku,Tokyo 162-8480, Japan, Institute for Biological Resources and Functions, National Institute of Advanced IndustrialScience and Technology (AIST), 1-1-1 Higashi, Tsukuba, Ibaraki 305-8566, Japan, and J-Bio 21 Corporation, 1-9-8Higashikanda, Chiyoda-ku, Tokyo 101-0031, Japan
We have developed a flexible, specific, and cost-effectivereal-time polymerase chain reaction (PCR) method. Inthis technique, a quenching probe (QProbe) and a non-fluorescent 3′-tailed probe are used. The QProbe is asingly labeled oligonucleotide bearing a fluorescent dyethat is quenched via electron transfer between the dye anda guanine base at a particular position. The nonfluorescent3′-tailed probe consists of two parts: one is the target-specific sequence on the 5′ side, and the other is comple-mentary to the QProbe on the 3′ side. When the QProbe/nonfluorescent 3′-tailed probe complex hybridizes withthe target in PCR, the fluorescence of the dye is quenched.Fluorescence quenching efficiency is proportional to theamount of the target. We called this method the universalQProbe system. This method substantially reduces thecost of real-time PCR setup because the same QProbe canbe used for different target sequences. Moreover, thismethod allows accurate quantification even in the pres-ence of nonspecific PCR products because the use ofnonfluorescent 3′-tailed probe significantly increases speci-ficity. Our results demonstrate that this method canaccurately and reproducibly quantify specific nucleic acidsequences in crude samples, comparable with conven-tional TaqMan chemistry. Furthermore, this method isalso applicable to single-nucleotide polymorphism (SNP)genotyping.
Nucleic acids (DNA and RNA) are among the most funda-mental molecules in all life forms. Specific nucleic acid sequencequantification is essential in biological and biomedical studies,such as those of medical diagnostics, gene expression analysis,genotyping of individuals, detection of infectious diseases, andexamination of genetically modified organisms.1-4 Many analyticalmethods for specific nucleic acid sequence quantification havealready been developed. In particular, real-time polymerase chainreaction (PCR)5-11 has been most widely used because of its
rapidity, high sensitivity, high reproducibility, and low risk ofcarryover contamination.
Real-time PCR is a method that combines the amplification ofthe gene of interest (target) and the detection of amplifiedproducts at each reaction cycle. The cycle at which the amountof amplified products attains a certain preset value is inverselyrelated to the starting quantity of the target. The accumulation ofthe amplified products is monitored in real time using DNA-binding fluorophores such as SYBR Green I,6 or sequence-specificfluorescent probes such as TaqMan probes,7 molecular beacons,8
and quenching probe (QProbe).9-11
A DNA-binding fluorophore is incorporated into double-stranded DNA, causing fluorescence to increase. An increase inthe amount of amplified products during PCR leads to an increasein fluorescence intensity. DNA-binding fluorophores can be usedin conjunction with any primers for any target without an extraprobe design step, which is complicated. However, if nonspecificPCR products such as the primer-dimer complexes are present,the fluorophores will bind to these products and generatefluorescent signals. Therefore, methods using DNA-binding fluo-rophores are less specific than probe-based detection methods.
Sequence-specific fluorescent probes only bind to the amplifiedproducts containing sequences that are complementary to theprobe. The use of sequence-specific fluorescent probes signifi-cantly increases specificity and allows quantification even in thepresence of nonspecific PCR products; however, more than onesequence-specific fluorescent probe is required to be designed,synthesized, and tested for each target sequence of interest ingeneral, which is expensive and troublesome in practical use.
Recently, simple and cost-effective methods using a universal-tailed primer have been developed.12-14 The universal-tailed
* To whom correspondence should be addressed. Phone: +81 29 861 6026.Fax: +81 29 861 6400. E-mail: [email protected].
† Waseda University.‡ National Institute of Advanced Industrial Science and Technology.§ J-Bio 21 Corporation.
(1) Mackay, I. M.; Arden, K. E.; Nitsche, A. Nucleic Acids Res. 2002, 30, 1292–1305.
(2) Ding, C. M.; Cantor, C. R. J. Biochem. Mol. Biol. 2004, 37, 1–10.(3) Sharkey, F. H.; Banat, I. M.; Marchant, R. Appl. Environ. Microbiol. 2004,
70, 3795–3806.(4) Deepak, S. A.; Kottapalli, K. R.; Rakwal, R.; Oros, G.; Rangappa, K. S.;
Iwahashi, H.; Masuo, Y.; Agrawal, G. K. Curr. Genomics 2007, 8, 234–251.
(5) Higuchi, R.; Fockler, C.; Dollinger, G.; Watson, R. Bio/Technology 1993,11, 1026–1030.
(6) Morrison, T. B.; Weis, J. J.; Wittwer, C. T. BioTechniques 1998, 24, 954–962.
Anal. Chem. XXXX, xxx, 000–000
10.1021/ac900414u CCC: $40.75 XXXX American Chemical Society AAnalytical Chemistry, Vol. xxx, No. xx, Month XX, XXXX
Dow
nloa
ded
by 1
96.2
05.7
6.20
4 on
Jul
y 9,
200
9Pu
blis
hed
on J
une
16, 2
009
on h
ttp://
pubs
.acs
.org
| do
i: 10
.102
1/ac
9004
14u

primer (forward primer) consists of two parts: one is the 5′-universal tail that specifically hybridizes with fluorescent probessuch as a TaqMan probe12 and molecular beacon,13 and the otherpart specifically hybridizes with the target sequence. Duringamplification, the fluorescent probe that hybridizes with theuniversal-tailed primer is degraded or displaced by the extensionof the reverse primer, and the fluorescent signal corresponds tothe amount of the target. The different target sequences can bedetected by employing the same fluorescent probes; thus, thesemethods reduce the cost of real-time PCR setup. However, themethods still have the problem of detecting nonspecific PCRproducts because the primer-dimer complex generates fluores-cent signals in these methods.
Here, we have developed a novel real-time PCR method toovercome these limitations. In this technique, a QProbe9-11 anda nonfluorescent 3′-tailed probe are used (Figure 1A). The QProbeis a singly labeled oligonucleotide bearing a fluorescent dye thatis quenched via electron transfer between the dye and a guaninebase at a particular position. The nonfluorescent 3′-tailed probeconsists of two parts: one is the target-specific sequence on the
5′ side, and the other is complementary to the QProbe on the 3′side. In this method, the same QProbe can be used for differenttarget sequences, and the use of nonfluorescent 3′-tailed probeensures high specificity for detecting the target amplicon. More-over, the evaluation of the performance of the designed probe israpid and cost-effective because the quenching efficiency of theQProbe/nonfluorescent 3′-tailed probe complex can be measuredusing a complementary oligonucleotide without performing real-time PCR. In other methods using fluorescent probes exceptQProbe, several examinations of real-time PCR are usuallyrequired for the evaluation of the performance of the designedprobes, and this step is time-consuming. Therefore, this methodsignificantly reduces the time and cost of real-time PCR setup andallows the accurate quantification even in the presence ofnonspecific PCR products. We called this method the universalQProbe system. In addition, we also demonstrate the applicabilityof the method to single-nucleotide polymorphism (SNP) geno-typing using melting curve analysis (Figure 1B). This techniquewill provide academic and industrial researchers with the op-portunity to use flexible, specific, and cost-effective genetic testsin broad applications.
EXPERIMENTAL SECTIONOligonucleotides. The sequences of the primers, probes, and
complementary oligonucleotides used in this study are listed inTables 1 and 2. All melting temperatures (Tm’s) of the primersand probes were predicted using Genetyx-win version 5.1(Genetyx Corporation) except for the QProbe. The Tm of theQProbe was predicted using the Exiqon Tm prediction tool(http://lna-tm.com). The primers and complementary oligo-nucleotides were purchased from Hokkaido System Science
(7) Lee, L. G.; Connell, C. R.; Bloch, W. Nucleic Acids Res. 1993, 21, 3761–3766.
(8) Tyagi, S.; Kramer, F. R. Nat. Biotechnol. 1996, 14, 303–308.(9) Kurata, S.; Kanagawa, T.; Yamada, K.; Torimura, M.; Yokomaku, T.;
Kamagata, Y.; Kurane, R. Nucleic Acids Res. 2001, 29, e34.(10) Crockett, A. O.; Wittwer, C. T. Anal. Biochem. 2001, 290, 89–97.(11) Okunuki, S.; Nakamura, K.; Kawaharasaki, M.; Tanaka, H.; Uchiyama, H.;
Noda, N. Microbes Environ. 2007, 22, 106–115.(12) Zhang, Y. L.; Zhang, D. B.; Li, W. Q.; Chen, J. Q.; Peng, Y. F.; Cao, W.
Nucleic Acids Res. 2003, 31, e123.(13) Li, X. M.; Huang, Y.; Guan, Y.; Zhao, M. P.; Li, Y. Z. Anal. Chem. 2006,
78, 7886–7890.(14) Yang, L. T.; Liang, W. Q.; Jiang, L. X.; Li, W. Q.; Cao, W.; Wilson, Z. A.;
Zhang, D. B. BMC Mol. Biol. 2008, 9, 54.
Figure 1. (A) Schematic representation of the universal QProbe system for real-time PCR. The QProbe is an all-locked nucleic acid (LNA) 13mer oligonucleotide. The nonfluorescent 3′-tailed probe is designed to possess a C base at the 3′-end in the target-specific part. The targetshould possess a G base complementary to the C base at the 3′-end in the target-specific part of the nonfluorescent 3′-tailed probe to quenchfluorescence. When the QProbe/nonfluorescent 3′-tailed probe complex hybridizes with the amplified target at the annealing temperature, thefluorescence of the dye is quenched by the guanine base in the target. The presence of other guanine bases at the 5′ side in the target alsoslightly quenches fluorescence.9 This is preferable, but not necessary. The fluorescence quenching efficiency is proportional to the amount ofthe target DNA. Then, the QProbe/nonfluorescent 3′-tailed probe complex is not degraded during the extension step because the DNA polymeraseused in this method has no 5′-to-3′ exonuclease activity. (B) Schematic representation of universal QProbe system for SNP genotyping.Homozygotes that are complementary to the probe dissociate at a relatively high temperature, homozygotes that are mismatched with theprobe dissociate at a relatively low temperature, and heterozygotes dissociate between the two transitions.
B Analytical Chemistry, Vol. xxx, No. xx, Month XX, XXXX
Dow
nloa
ded
by 1
96.2
05.7
6.20
4 on
Jul
y 9,
200
9Pu
blis
hed
on J
une
16, 2
009
on h
ttp://
pubs
.acs
.org
| do
i: 10
.102
1/ac
9004
14u

Co., Ltd., Tsukuba Oligo Service Co., Ltd., and Nihon GeneResearch Laboratories Inc. The nonfluorescent 3′-tailed probeswere purchased from Tsukuba Oligo Service Co., Ltd. Theprimers, complementary oligonucleotides, and nonfluorescent3′-tailed probes were purified by gel filtration. The TaqManprobe was purchased from Tsukuba Oligo Service Co., Ltd.The QProbe was purchased from J-Bio 21 Corporation. TheQProbe was labeled at the 3′ end with BODIPY FL via anaminohexyl phosphate linker having a seven-carbon spacer.The TaqMan probe and QProbe were purified by high-performance liquid chromatography (HPLC).
DNA Templates. First-strand cDNAs were synthesized from�-actin mRNA, human (Nippon Gene) and albumin mRNA, human(Nippon Gene) by RT using the SuperScript III first-strandsynthesis system for RT-PCR (Invitrogen) with Oligo(dT)20 asdescribed by the manufacturer. DNA fragments were amplifiedfrom the cDNAs (for the �-actin and albumin genes) or humangenomic DNA (Novagen; for the �-globin gene) by PCR usingeach gene-specific primer set for the DNA template (asdescribed in Table 1). The lengths of the amplified products forthe �-actin, albumin, and �-globin genes were 260, 100, and 272bp, respectively, which are longer than regions that are amplifiedby gene-specific primers for real-time PCR. Then, the PCRproducts were purified using Microcon YM-30 (Millipore) or aQIAquick PCR purification kit (Qiagen). The fragment length and
(15) Wang, X. W.; Seed, B. Nucleic Acids Res. 2003, 31, e154.(16) Saiki, R. K.; Gelfand, D. H.; Stoffel, S.; Scharf, S. J.; Higuchi, R.; Horn, G. T.;
Mullis, K. B.; Erlich, H. A. Science 1998, 239, 487–491.
Table 1. Primers, Probes, and Complementary Oligonucleotides Used for Real-Time PCRa
target orientation sequence (5′ to 3′)predictedTm (°C) ref
�-actin forward primer CATGTACGTTGCTATCCAGGC 62.5 15 (PrimerBank ID:4501885a1)
reverse primer CTCCTTAATGTCACGCACGAT 61.9 15 (PrimerBank ID:4501885a1)
f. primer for DNA template CCAGCCATGTACGTTGCTATC 62.5 this workr. primer for DNA template AGCTTCTCCTTAATGTCACG 58.9 this worknonfluorescent 3′-tailed probe CTGACTGACTACCTCATGAAGATCCTCACttgggggaggggg 66.7b this workcomplementary oligonucleotide GCTCGGTGAGGATCTTCATGAGGTAGTCAGTCAGGTCCC this work
albumin forward primer TTTATGCCCCGGAACTCCTTT 63.8 15 (PrimerBank ID:4502027a1)
reverse primer ACAGGCAGGCAGCTTTATCAG 64.5 15 (PrimerBank ID:4502027a1)
f. primer for DNA template TTACTTTTATGCCCCGGAACT 61.2 this workr. primer for DNA template TGGCAACAGGCAGGCAG 65.0 this worknonfluorescent 3′-tailed probe CTTGGCAACATTCTGTAAAAGCAGCTTTATACttgggggaggggg 66.2b this workcomplementary oligonucleotide AAAAGGTATAAAGCTGCTTTTACAGAATGTTGCCAAGCTGCT this work
�-globin forward primer GGTTGGCCAATCTACTCCCAGG 66.5 16reverse primer TGGTCTCCTTAAACCTGTCTTG 61.3 16f. primer for DNA template CCTAGGGTTGGCCAATCTACTCCCAGG 71.0 this workr. primer for DNA template TCTATTGGTCTCCTTAAACCTGTCTTG 63.5 this worknonfluorescent 3′-tailed probe GGTGTCTGTTTGAGGTTGCTAGTGAACttgggggaggggg 66.8b this workcomplementary oligonucleotide ACTGTGTTCACTAGCAACCTCAAACAGACACCATGGT this workTaqMan probe (FAM)-GGTGTCTGTTTGAGGTTGCTAGTGAAC-(TAMRA) 66.8 this work
QProbe QProbe CCCCCTCCCCCAA-(BODIPY FL) 102 this work
a The lowercase sequences are complementary to the QProbe. The italicized sequence is locked nucleic acid (LNA). b The temperatures indicatethat the predicted Tm’s of the target-specific sequence (uppercase) are on the 5′ side.
Table 2. Primers and Probes Used for SNP Genotypinga
target orientation sequence (5′ to 3′) predicted Tm (°C) ref
ADRB2 forward primer CATGTACGTTGCTATCCAGGC 62.5 this work(dbSNP ID; rs1042713) reverse primer CTCCTTAATGTCACGCACGAT 61.9 this work
f. primer for DNA template CGCTGAATGAGGCTTCC 59.5 this workr. primer for DNA template CAGCACATTGCCAAACAC 59.2 this worknonfluorescent 3′-tailed probe CTTCCATTGGGTGCCAGCttgggggaggggg 63.0b this work
ADRB3 forward primer AGCTCTCTTGCCCCATG 60.9 this work(dbSNP ID; rs4994) reverse primer GCCAGCGAAGTCACGAA 61.7 this work
f. primer for DNA template TGGCCTCACGAGAACAG 60.5 this workr. primer for DNA template GAGTCCCATCACCAGGTC 60.7 this worknonfluorescent 3′-tailed probe CCATCGCCCGGACTCCGAGACTCttgggggaggggg 71.8b this work
UCP1 forward primer AGTGGTGGCTAATGAGAGAA 60.0 this work(dbSNP ID; rs1800592) reverse primer AAGGAGTGGCAGCAAGT 60.7 this work
f. primer for DNA template TTCTTCTGTCATTTGCACATTTATCT 60.8 this workr. primer for DNA template AACTGACCCTTTATGACGTAG 58.6 this worknonfluorescent 3′-tailed probe CACTCGATCAAACTGTGGTCttgggggaggggg 59.9b this work
QProbe QProbe CCCCCTCCCCCAA-(BODIPY FL) 102 this work
a The underlined sequences correspond to SNP site. The lowercase sequences are complementary to the QProbe. The italicized sequence islocked nucleic acid (LNA). b The temperatures indicate that the predicted Tm’s of the target-specific sequence (uppercase) are on the 5′ side.
CAnalytical Chemistry, Vol. xxx, No. xx, Month XX, XXXX
Dow
nloa
ded
by 1
96.2
05.7
6.20
4 on
Jul
y 9,
200
9Pu
blis
hed
on J
une
16, 2
009
on h
ttp://
pubs
.acs
.org
| do
i: 10
.102
1/ac
9004
14u

concentration of the purified products were determined using anAgilent 2100 bioanalyzer (Agilent Technologies). The productswere used as references for real-time PCR.
Genomic DNA was extracted from human oral swab samplesof volunteers using a preserved solution of a DNA test samplefor oral swab (J-Bio 21 Corporation). SNP types were determinedusing the QP system (J-Bio 21 Corporation).10,17,18 DNA fragmentswere amplified from genomic DNA (for the ADRB2, ADRB3, andUCP1 genes) by PCR using each gene-specific primer for the DNAtemplate (as described in Table 2). The lengths of the amplifiedproducts for the ADRB2, ADRB3, and UCP1 genes were 266, 255,and 277 bp, respectively, which are longer than regions that areamplified by gene-specific primers for SNP genotyping. Then, thePCR products were purified using Montage PCR centrifugal filterdevices (Millipore). The fragment length and concentration of thepurified products were determined using an Agilent 2100 bioana-lyzer (Agilent Technologies). The products were used as refer-ences for SNP genotyping.
Measurement of the Fluorescence Quenching Efficiencyof the QProbe/Nonfluorescent 3′-Tailed Probe Complex. Thereaction mixture (20 µL) contained 1× titanium buffer (Clontech),200 µM each of dATP, dCTP, and dGTP, 600 µM dUTP (RocheDiagnostics), 0.25 mg/mL BSA, 0.3 (for the �-actin gene) or 1.0µM (for the albumin and �-globin genes) forward primer, 1.0 (forthe �-actin gene) or 0.3 µM (for the albumin and �-globin genes)reverse primer, 0.05 µM QProbe, 0.1 µM nonfluorescent 3′-tailedprobe, 1× titanium Taq (Clontech), 0.2 unit of uracil-DNAglycosylase (heat-labile; Roche Diagnostics), and 0.4 µM comple-mentary oligonucleotide. For preparation of negative controls, thecomplementary oligonucleotide was eliminated from the mixture.The reaction mixture was heated to 95 °C for 15 s, cooled to 37°C, kept at 37 °C for 60 s, and then slowly heated back to 95 °Cat a ramp rate of 0.1 °C/s with continuous fluorescence acquisitionusing a LightCycler 1.5 (Roche Diagnostics). To normalizefluorescence fluctuations from tube to tube, the fluorescenceintensity at 95 °C of the reaction mixture without complementaryoligonucleotide (F1,95) is divided by that with the complementaryoligonucleotide (F2,95), and F1,95/F2,95 was multiplied by thefluorescence intensity at each temperature with the comple-mentary oligonucleotide (F2). Normalized F2 is expressed asF2,normalized. Fluorescence quenching efficiency at each temper-ature was calculated using eq 1:
fluorescence quenching efficiency (%) )[(F1 - F2,normalized)/F1] × 100 (1)
where F1 is the fluorescence intensity at each temperature ofthe reaction mixture without the complementary oligonucleotide.
Real-Time PCR of the Universal QProbe System. Real-timePCR was carried out using a LightCycler 1.5 (Roche Diagnostics).The reaction mixture (20 µL) contained 101-108 copies of theDNA templates as references or 0.2-200 ng of the humangenomic DNA, 1× titanium buffer (Clontech), 200 µM each of
dATP, dCTP, and dGTP, 600 µM dUTP (Roche Diagnostics),0.25 mg/mL BSA, 0.3 (for the �-actin gene) or 1.0 µM (for thealbumin and �-globin genes) forward primer, 1.0 (for the �-actingene) or 0.3 µM (for the albumin and �-globin genes) reverseprimer, 0.05 µM QProbe, 0.1 µM nonfluorescent 3′-tailed probe,1× titanium Taq (Clontech), and 0.2 unit of uracil-DNAglycosylase (heat-labile; Roche Diagnostics). The lengths of theamplified products for the �-actin, albumin, and �-globin geneswere 250, 90, and 262 bp, respectively. To produce the single-stranded DNAs that possess the probe binding site, one of theprimers was added to the reaction mixture at 3- or 4-fold theamount of the other primer. Titanium Taq is an N-terminaldeletion mutant of thermostable recombinant Taq DNA poly-merase that lacks 5′-to-3′ exonuclease activity. Uracil-DNAglycosylase was added to the reaction mixture to prevent thecarryover contamination of the amplified products. The gly-cosidase reaction was performed during the preparation of thereaction mixture at room temperature before PCR. The PCRconditions were as follows: initial denaturation at 95 °C for 2min, 50 cycles of denaturation at 95 °C for 30 s, annealing at55 (for the �-actin and albumin genes) or 62 °C (for the �-globingene) for 30 s, and extension at 72 °C for 30 s, and a finalextension at 72 °C for 2 min. Fluorescence intensity wasmeasured at the end of denaturation and annealing steps ineach cycle, and fluorescence quenching efficiency at each cyclewas calculated in accordance with a previous report.19 The cycleat which the fluorescence quenching efficiency plot crossesthe threshold is defined as Ct (cycle of threshold), and thestandard curve was constructed from the mean Ct values oftriplicate determinations. The amplified products were elec-trophoresed in a 2% agarose gel.
Real-Time PCR of the TaqMan Chemistry. The TaqManassay was carried out using an ABI PRISM 7900 HT (AppliedBiosystems). The reaction mixture (50 µL) contained 1× TaqManuniversal master mix (Applied Biosystems), 0.1 µM TaqManProbe, 0.3 µM forward primer, and 0.3 µM reverse primer. ThePCR conditions were as follows: 50 °C for 2 min, 95 °C for 10min, and 50 cycles of 95 °C for 15 s and 60 °C for 1 min. Resultswere analyzed using ABI PRISM 7900 HT Sequence DetectionSystem software 2.1 (Applied Biosystems).
SNP Genotyping. PCR and melting curve analyses werecarried out using a LightCycler 480 (Roche Diagnostics). Thereaction mixture (20 µL) contained 104 copies of the DNAtemplates as references, 1× LC480 genotyping master (RocheDiagnostics), 0.25 mg/mL BSA, 0.5 (for the ADRB2 and UCP1genes) or 0.15 µM (for the ADRB3 gene) forward primer, 0.15(for the ADRB2 and UCP1 genes) or 0.5 µM (for the ADRB3gene) reverse primer, 0.15 µM QProbe, 0.5 µM nonfluorescent3′-tailed probe, and 0.1 unit of uracil-DNA glycosylase (heat-labile; Roche Diagnostics). The lengths of the amplifiedproducts for the ADRB2, ADRB3, and UCP1 genes were 150,215, and 203 bp, respectively. The polymerase in the LC480genotyping master is an N-terminal deletion mutant of ther-mostable recombinant Taq DNA polymerase that lacks 5′-to-3′exonuclease activity and is chemically modified. The PCRconditions were as follows: initial denaturation at 95 °C for 5
(17) Matsumoto, N.; Kakihara, F.; Kimura, S.; Kurebayashi, Y.; Hirai, M.; Yohda,M.; Hasegawa, S. Anal. Biochem. 2007, 370, 121–123.
(18) Tanaka, R.; Kuroda, J.; William, S. C.; Ashihara, E.; Ishikawa, T.; Taki, T.;Kobayashi, Y.; Kamitsuji, Y.; Kawata, E.; Takeuchi, M.; Murotani, Y.; Yokota,A.; Hirai, M.; Majima, S.; Taniwaki, M.; Maekawa, T.; Kimura, S. Leuk. Res.2008, 32, 1462–1467.
(19) Tani, H.; Noda, N.; Yamada, K.; Kurata, S.; Tsuneda, S.; Hirata, A.;Kanagawa, T. J. Agric. Food Chem. 2005, 53, 2535–2540.
D Analytical Chemistry, Vol. xxx, No. xx, Month XX, XXXX
Dow
nloa
ded
by 1
96.2
05.7
6.20
4 on
Jul
y 9,
200
9Pu
blis
hed
on J
une
16, 2
009
on h
ttp://
pubs
.acs
.org
| do
i: 10
.102
1/ac
9004
14u

min, 50 cycles of denaturation at 95 °C for 10 s, annealing at62 °C for 20 s, and extension at 72 °C for 10 s, and a finalextension at 72 °C for 5 min. After the PCR, the reactionmixture was heated to 95 °C for 15 s, cooled to 37 °C, kept at37 °C for 60 s, and then slowly heated back to 95 °C at a ramprate 0.1 °C/s with continuous fluorescence acquisition. Tm wascalculated from peaks generated by plotting the negativederivative of fluorescence intensity over temperature versustemperature.
RESULTS AND DISCUSSIONMeasurement of the Fluorescence Quenching Efficiency
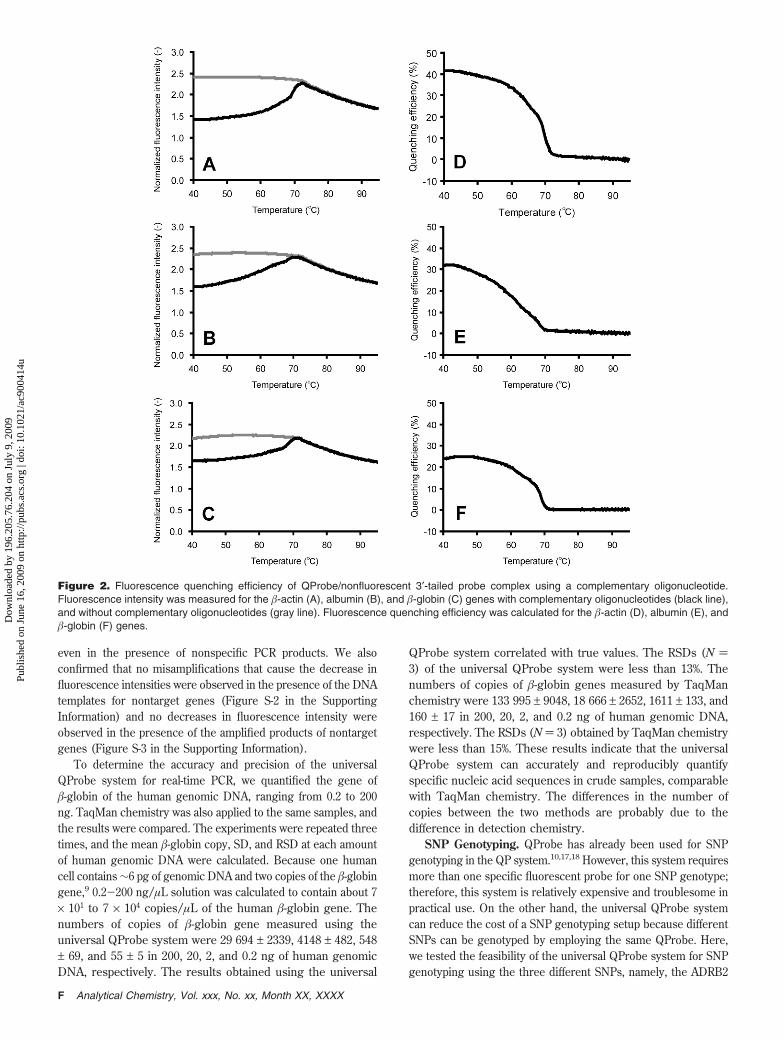
of the QProbe/Nonfluorescent 3′-Tailed Probe Complex. Wemeasured the fluorescence quenching efficiency of the QProbe/nonfluorescent 3′-tailed probe complex using a complementaryoligonucleotide without performing real-time PCR. As modeltargets, we chose three genes: the �-actin, albumin, and �-globingenes. The QProbe was designed to not contain guanine basesto prevent self-quenching due to secondary structure formation.The nonfluorescent 3′-tailed probes were designed specifically forthe �-actin, albumin, and �-globin genes (Table 1). The Tm of thetarget-specific portion of the nonfluorescent 3′-tailed probe wasapproximately 5-10 °C higher than that of the primer. The3′-tail sequence of the probe was designed to be as short aspossible to minimize hybridization of the 3′-tail with otherlocations in the genome. The predicted Tm of the designed 3′-tail sequence is 57.9 °C. Moreover, we examined the similaritybetween the designed 3′-tail sequence and any known genomicsequences on the DDBJ BLAST search program (http://www.ddbj.nig.ac.jp/search/top-e.html). No hits were found.Furthermore, to stabilize the QProbe/nonfluorescent 3′-tailedprobe complex, we used the locked nucleic acid (LNA) in theQProbe sequence (Figure 1A). LNA is a DNA analogue in whichthe furanose ring in the sugar-phosphate backbone is chemicallylocked. LNA obeys the Watson-Crick pairing rules but has anincreased specificity and a high affinity to its complementary DNAsequence.20,21 The theoretical Tm of the designed QProbe thatis all-LNA oligonucleotides was calculated to be 102 °C usingthe Exiqon Tm prediction tool, which is available online (http://lna-tm.com). Because the theoretical Tm of the QProbe wasover 100 °C, we considered that the QProbe/nonfluorescent3′-tailed probe complex was prevented from dissociation duringthe PCR cycle. As shown in Figure 2, the fluorescence quenchingefficiencies of the QProbe/nonfluorescent 3′-tailed probe complexfor the �-actin, albumin, and �-globin genes were 37.4%, 24.1%,and 17.9%, respectively, at the annealing temperature in the PCRcycle. The differences in fluorescence quenching efficiency amongthe three genes are probably due to the difference in the target-specific sequence of the nonfluorescent 3′-tailed probes and/orthe other guanine bases at the 5′ side in the target that quenchesthe fluorescence.
Real-Time PCR. We tested the feasibility of the universalQProbe system for real-time PCR using the three different genesas model targets as described above. The DNA templates wereprepared from commercially produced mRNA or human genomic
DNA as described in Experimental Section and diluted to serial10-fold solutions, ranging from 101 to 108 copies. Then, the DNAmixtures were amplified by PCR with real-time monitoring offluorescence intensity. To make the universal QProbe systemreliable, two points were considered to be particularly impor-tant. First, the asymmetric PCR should be used to minimizethe hook effect.22 The hook effect is the phenomenon of adecrease in fluorescence intensity (or fluorescence quenchingefficiency) observed in later cycles in symmetric PCR, becausethe amplified strands reanneal before the probes can bind togenerate (or quench) fluorescence. This may confuse theresults. Second, the DNA polymerase that has no 5′-to-3′exonuclease activity should be used to prevent the degradationof QProbe/nonfluorescent 3′-tailed probe. Figure 3 showsamplification plots and standard curves for the �-actin, albumin,and �-globin genes obtained using the universal QProbe system.The maximum fluorescence quenching efficiencies of the ampli-fication plots for the �-actin, albumin, and �-globin genes were38.5%, 32.2%, and 21.5%, respectively. These results are slightlylower than those obtained using a complementary oligonucleotideas the DNA template (without performing real-time PCR) asdescribed above, probably owing to the difference in the lengthof the target DNA. The calculated R2 values of the standardcurves for the �-actin, albumin, and �-globin genes were 0.9993,0.9997, and 0.9989, respectively. Thus, the standard curves inthe universal QProbe system were linear, and the dynamicrange was at least 7 orders of magnitude ranging from 101 and108 target copy numbers. Then, the reproducibility of theuniversal QProbe system was evaluated using the Ct valuesfor constructing the standard curves. The relative standarddeviations (RSDs) (N ) 3) of the �-actin, albumin, and �-globingenes were all less than 2.7% in a test range of 101-108 copies.To compare the results of our method with those of a traditionalquantitative method, we also performed the real-time PCR ofTaqMan chemistry for constructing the standard curves forthe �-globin gene. The results show that the calculated R2 valueof the standard curve was 0.9976 in the test range of 101-108
copies, and the y-intercept was 43.5 (data not shown). Thisy-intercept obtained by TaqMan chemistry was slightly lowerthan that obtained using the universal QProbe system (44.2),as shown in Figure 3F. The RSDs (N ) 3) obtained by TaqManchemistry were all less than 2.2% in the test range of 101-108
copies. The RSDs obtained by TaqMan chemistry were slightlylower than those obtained using the universal QProbe system.These results indicate that the universal QProbe system has aslightly lower sensitivity and reproducibility for constructingstandard curves than the conventional TaqMan chemistry.However, we considered that the universal QProbe system hasacceptable sensitivity and reproducibility in practical use.Moreover, when the amplified products were electrophoresedusing a 2% agarose gel, some bands of less than 100 bp,considered to be the primer-dimer complex, were observedin all samples including the no-template controls for the threegenes (Figure S-1 in the Supporting Information). However, nodecreases in fluorescence intensity were observed from theamplification plots of the no-template controls (Figure 3). Theseresults strongly suggest that this method allows quantification(20) Singh, S. K.; Nielsen, P.; Koshkin, A. A.; Wengel, J. Chem. Commun. 1998,
4, 455–456.(21) Vester, B.; Wengel, J. Biochemistry 2004, 43, 13233–13241. (22) Barratt, K.; Mackay, J. F. J. Clin. Microbiol. 2002, 40, 1571–1572.
EAnalytical Chemistry, Vol. xxx, No. xx, Month XX, XXXX
Dow
nloa
ded
by 1
96.2
05.7
6.20
4 on
Jul
y 9,
200
9Pu
blis
hed
on J
une
16, 2
009
on h
ttp://
pubs
.acs
.org
| do
i: 10
.102
1/ac
9004
14u
even in the presence of nonspecific PCR products. We alsoconfirmed that no misamplifications that cause the decrease influorescence intensities were observed in the presence of the DNAtemplates for nontarget genes (Figure S-2 in the SupportingInformation) and no decreases in fluorescence intensity wereobserved in the presence of the amplified products of nontargetgenes (Figure S-3 in the Supporting Information).
To determine the accuracy and precision of the universalQProbe system for real-time PCR, we quantified the gene of�-globin of the human genomic DNA, ranging from 0.2 to 200ng. TaqMan chemistry was also applied to the same samples, andthe results were compared. The experiments were repeated threetimes, and the mean �-globin copy, SD, and RSD at each amountof human genomic DNA were calculated. Because one humancell contains ∼6 pg of genomic DNA and two copies of the �-globingene,9 0.2-200 ng/µL solution was calculated to contain about 7× 101 to 7 × 10⁴ copies/µL of the human �-globin gene. Thenumbers of copies of �-globin gene measured using theuniversal QProbe system were 29 694 ± 2339, 4148 ± 482, 548± 69, and 55 ± 5 in 200, 20, 2, and 0.2 ng of human genomicDNA, respectively. The results obtained using the universal
QProbe system correlated with true values. The RSDs (N )3) of the universal QProbe system were less than 13%. Thenumbers of copies of �-globin genes measured by TaqManchemistry were 133 995 ± 9048, 18 666 ± 2652, 1611 ± 133, and160 ± 17 in 200, 20, 2, and 0.2 ng of human genomic DNA,respectively. The RSDs (N ) 3) obtained by TaqMan chemistrywere less than 15%. These results indicate that the universalQProbe system can accurately and reproducibly quantifyspecific nucleic acid sequences in crude samples, comparablewith TaqMan chemistry. The differences in the number ofcopies between the two methods are probably due to thedifference in detection chemistry.
SNP Genotyping. QProbe has already been used for SNPgenotyping in the QP system.10,17,18 However, this system requiresmore than one specific fluorescent probe for one SNP genotype;therefore, this system is relatively expensive and troublesome inpractical use. On the other hand, the universal QProbe systemcan reduce the cost of a SNP genotyping setup because differentSNPs can be genotyped by employing the same QProbe. Here,we tested the feasibility of the universal QProbe system for SNPgenotyping using the three different SNPs, namely, the ADRB2
Figure 2. Fluorescence quenching efficiency of QProbe/nonfluorescent 3′-tailed probe complex using a complementary oligonucleotide.Fluorescence intensity was measured for the �-actin (A), albumin (B), and �-globin (C) genes with complementary oligonucleotides (black line),and without complementary oligonucleotides (gray line). Fluorescence quenching efficiency was calculated for the �-actin (D), albumin (E), and�-globin (F) genes.
F Analytical Chemistry, Vol. xxx, No. xx, Month XX, XXXX
Dow
nloa
ded
by 1
96.2
05.7
6.20
4 on
Jul
y 9,
200
9Pu
blis
hed
on J
une
16, 2
009
on h
ttp://
pubs
.acs
.org
| do
i: 10
.102
1/ac
9004
14u

gene (A/G), ADRB3 gene (C/T), and UCP1 gene (A/G) as modeltargets. The nonfluorescent 3′-tailed probes were designed specif-ically for the ADRB2, ADRB3, and UCP1 genes (Table 2). TheDNA templates were prepared from genomic DNA as describedin Experimental Section and diluted to 104 copies of each allele.Then, the DNA mixtures were amplified by PCR, and fluores-cence intensity was monitored continuously during the increasein temperature to determine the melting temperature at whichthe QProbe/nonfluorescent 3′-tailed probe complex dissociatesfrom the amplified products. The position of the melting peakprovides Tm, which indicates the genotypes. Figure 4 showsthe melting peaks for the ADRB2, ADRB3, and UCP1 genesobtained using the universal QProbe system. The results showthat homozygous and heterozygous SNP genotypes were dis-criminated by the differences in the position of the melting peaksin the three SNP genotypings; i.e., the Tm of the homozygousmutant type is higher (61.6 °C) than that of the homozygouswild type (53.0 °C) for the ADRB2 gene, the Tm of the mutant
type is higher (70.2 °C) than that of the wild type (63.9 °C) forthe ADRB3 gene, and the Tm of the mutant type is higher (60.2°C) than that of the wild type (52.5 °C) for the UCP1 gene.Heterozygous types exhibited the presence of both the twomelting peaks (peaks at Tm of homozygous wild and mutanttypes). These results indicate that the three genotypes can beclearly distinguished from one another by melting curveanalysis. Therefore, the universal QProbe system is applicableto SNP genotyping.
Advantages of the Universal QProbe System. In this study,we have developed a flexible, specific, and cost-effective real-timePCR method, called the universal QProbe system. The threedifferent genes (�-actin, albumin, and �-globin genes) have beenquantified with the universal QProbe system using the sameQProbe. This method can accurately and reproducibly quantifyspecific nucleic acid sequences in crude samples, comparable withconventional TaqMan chemistry. This method is comparable in
Figure 3. Real-time PCR. Amplification plots for �-actin (A), albumin (B), and �-globin (C) genes with serial dilutions (10-fold) of each DNAtemplate per dilution: (1) 101, (2) 102, (3) 103, (4) 104, (5) 105, (6) 106, (7) 107, (8) 108, (N) no-template control. These graphs show representativetraces for all the dilutions and no-template control in triplicate determinations. The gray lines represent the threshold lines. Standard curves for�-actin (D), albumin (E), and �-globin (F) genes. The error bars represent the standard deviation. Standard error bars that are not visible arewithin the symbols.
GAnalytical Chemistry, Vol. xxx, No. xx, Month XX, XXXX
Dow
nloa
ded
by 1
96.2
05.7
6.20
4 on
Jul
y 9,
200
9Pu
blis
hed
on J
une
16, 2
009
on h
ttp://
pubs
.acs
.org
| do
i: 10
.102
1/ac
9004
14u

quality to other published methods.14,23 This method was alsoshown to be applicable to SNP genotyping, in which we haveestablished the genotyping system for three different SNPs(ADRB2, ADRB3, and UCP1) using the same QProbe. The presentmethod has several major advantages as follows:(i) In this method, the same QProbe can be used for any
targets. Thus, this method significantly reduces the costof real-time PCR setup in comparison with other se-quence-specific fluorescent PCR techniques.7-10 More-over, the evaluation of fluorescence quenching efficiencyof the designed probe is rapid and cost-effective becausethis can be carried out without performing the real-timePCR.
(ii) Unlike the universal-tailed primer techniques,12-14 theuniversal QProbe system uses the nonfluorescent 3′-tailed probe that is specific for target sequences. Thus,this new the method allows the accurate quantificationeven in the presence of nonspecific PCR products.
(iii) This method can significantly reduce the cost of a SNPgenotyping setup because the different SNPs can begenotyped by employing the same QProbe. All steps ofthe preparation and measurement can easily be per-formed in a single vessel, and then genotypes arediscriminated by melting curve analysis. Thus, thismethod is suitable for automation.
(iv) In principle, this method can be applied not only to PCRsystems but also to other amplification systems suchas loop-mediated isothermal amplification (LAMP),24
rolling-circle amplification (RCA),25 nucleic acid sequence-based amplification (NASBA),26 and helicase-dependentamplification (HDA).27 These systems can amplifynucleic acids under isothermal conditions, therebyallowing the use of simple and cost-effective reactionequipment.
There may be some difficulties with regard to the design ofthe sequence-specific probes in this method because the nonfluo-rescent 3′-tailed probe should possess a C base at the 3′-end inthe target-specific part and the target should possess a G basecomplementary position. However, G bases are ubiquitous in thetarget; therefore, this limitation can be negligible.
This novel concept can be applied to other quantitative systemssuch as alternately binding probe competitive PCR (ABC-PCR),which we previously reported.28,29 This method combines the useof competitive PCR and a sequence-specific fluorescent probe thatbinds to either the gene of interest or the internal standard. Unlikethe real-time PCR techniques including the universal QProbesystem, ABC-PCR enables a reliable quantification of DNA inbiological samples that contain high concentrations of PCR-inhibiting compounds and can quantify specific nucleic acidsequences by end point fluorescence measurement using a simplefluorometer. By combining the present universal system withABC-PCR, we believe that it may lead to the widespread use ofquantitative genetic tests in many fields.
ACKNOWLEDGMENTWe thank the J-Bio 21 Corporation staff members Ms. Mayu
Ohkubo, Mr. Akiyoshi Hanawa, and Mr. Hidekazu Sogo fortechnical assistance in SNP genotyping, helpful discussions, andtechnical advice. The authors declare that they have no conflictof interest.
SUPPORTING INFORMATION AVAILABLEAdditional information as noted in text. This material is
available free of charge via the Internet at http://pubs.acs.org.
Received for review February 24, 2009. Accepted May 27,2009.
AC900414U
(23) Nazarenko, I.; Lowe, B.; Darfler, M.; Ikonomi, P.; Schuster, D.; Rashtchian,A. Nucleic Acids Res. 2002, 30, e37.
(24) Notomi, T.; Okayama, H.; Masubuchi, H.; Yonekawa, T.; Watanabe, K.;Amino, N.; Hase, T. Nucleic Acids Res. 2000, 28, e63.
(25) Lizardi, P. M.; Huang, X. H.; Zhu, Z. R.; Bray-Ward, P.; Thomas, D. C.;Ward, D. C. Nat. Genet. 1998, 19, 225–232.
(26) Compton, J. Nature 1991, 350, 91–92.(27) Vincent, M.; Xu, Y.; Kong, H. M. EMBO Rep. 2004, 5, 795–800.(28) Tani, H.; Kanagawa, T.; Kurata, S.; Teramura, T.; Nakamura, K.; Tsuneda,
S.; Noda, N. Anal. Chem. 2007, 79, 974–979.(29) Noda, N.; Tani, H.; Morita, N.; Kurata, S.; Nakamura, K.; Kanagawa, T.;
Tsuneda, S.; Sekiguchi, Y. Anal. Chim. Acta 2008, 608, 211–216.
Figure 4. SNP genotyping using melting curve analysis. Meltingpeaks of the ADRB2 (A), ADRB3 (B), and UCP1 (C) genes with thehomozygous wild type, which has a mismatched nucleotide to theprobe (red line), homozygous mutant type, which is complementaryto the probe (blue line), heterozygous (gray line), and no-templatecontrol (black line) are shown. All the graphs show representativetraces for all the genotypes and no-template control in triplicates.
H Analytical Chemistry, Vol. xxx, No. xx, Month XX, XXXX
Dow
nloa
ded
by 1
96.2
05.7
6.20
4 on
Jul
y 9,
200
9Pu
blis
hed
on J
une
16, 2
009
on h
ttp://
pubs
.acs
.org
| do
i: 10
.102
1/ac
9004
14u