universiti putra malaysia assessing the …psasir.upm.edu.my/id/eprint/8818/1/fep_1997_2_a.pdf ·...
TRANSCRIPT
UNIVERSITI PUTRA MALAYSIA
ASSESSING THE COMPETITIVENESS OF THE MALAYSIAN PALM OIL INDUSTRY
DEVAGI A/P SUBRAMANIAM
FEP 1997 2
ASSESSING TIlE COMPETITIVENESS OF TIlE MALAYSIAN PALM OIL INDUSTRY
By
DEV AGI AlP SUBRAMANIAM
DisscrtaDon SubmiUcd in Fn1fiDmcnt of 1hc RcquhemcDts for the Dcgaw ofMastcr Science in 1hc Faculty of
EoonnaJM:a aad MaNganent, Univcrsiti Putra Malaysia.
Scptcmbcr,I997
DEDICATION
To my beloved husband, Mr. R Sivalingam and to all my brothers and sisters.
ACKNOWLEDGEMENTS
Firstly, the author like to express her deepest and sincere gratitude and
appreciation to the chairman of the supervisory committee, Professor Dr. Mohd.
Ghazali Mohayidin for his willingness to give excellent guidance. Despite his busy
schedule he was always ready to see me. My deepest appreciation also goes to
Associate Professor Dr. Md. Zabid B. Abd. Rashid and En. Ahmad Zainuddin who
were the members of the supervisory committee, and who provided invaluable
assistance towards the progress and finishing up of this thesis. I would also like to
thank Prof. Dr. Fatimah Mohd Arshad and Prof. Dr. Chew Teck Ann for their
willingness to help me in my work.
My sincere thanks also goes to the palm oil millers and refiners for their
willingness to provide me with data and information on their performance. I also
appreciate the assistance from the officers and staffs of PORLA and PORIM who
helped me in getting some of the information for this study. I am also indebted to
the Faculty of Economics and Management for their support and assistance.
It is my pleasure to acknowledge the support and understanding given by my
beloved mother, Madam Letchumy, sisters, brothers and friends throughout the period
of my study. Finally, to my beloved husband, Mr. R.Sivalingam, who gave constant
inspiration and care during the period of this thesis and attaining this degree.
Lastly, I thank God, for giving me the strength, patience and courage to face
all the obstacles in life.
III
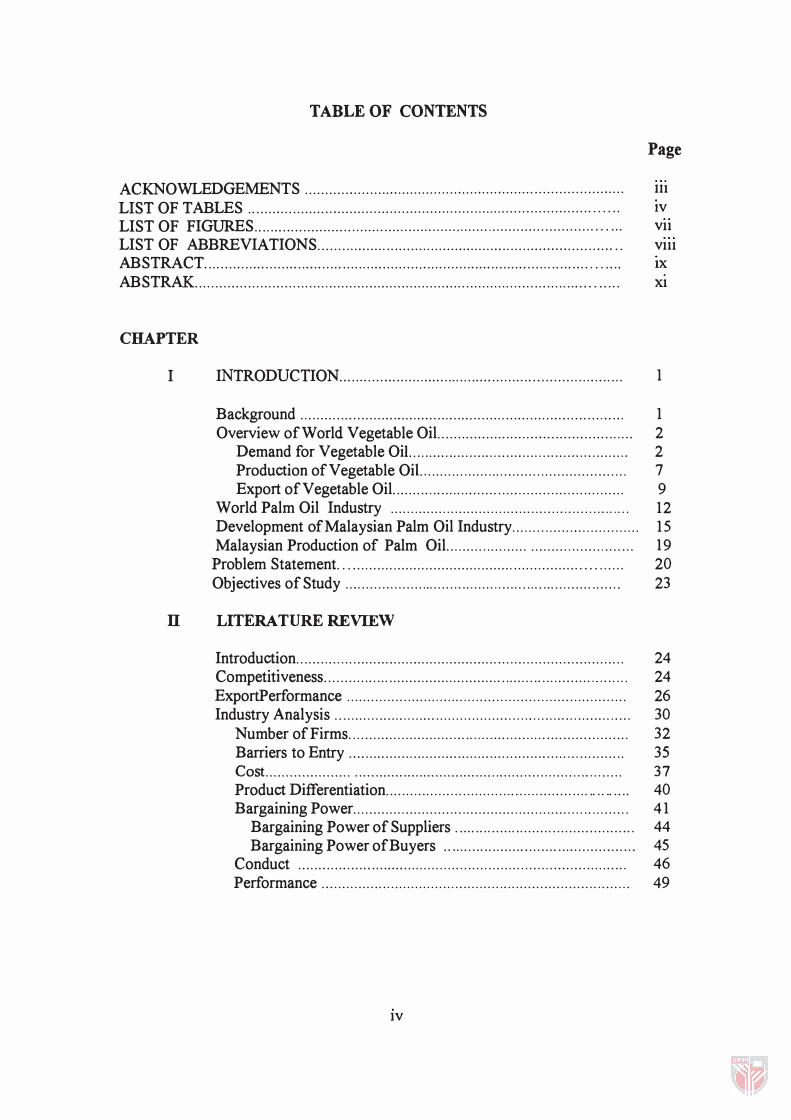
TABLE OF CONTENTS
Page
ACKNOWLEDGEMENTS ......................................................... ...................... 11l
LIST OF TABLES ... ........ ........ ............................... ... ................ ...................... IV LIST OF FIGURES.... .... .... ............ ........ ...... ...... .............. ........ ...... ............. . . ... Vll LIST OF ABBREVIATIONS................................................... ...... .......... ...... .. Vlll ABSTRACT.................................. ............................................................. ... .... IX ABSTRAK................................................................................................... ..... Xl
CHAPTER
I INTRODUCTION ..................................................................... . 1
Background ............................................................................. ... 1 Overview of World Vegetable Oil................................................ 2
Demand for Vegetable OiL.................................................... 2 Production of Vegetable OiL................................................. 7 Export of Vegetable Oil......................................................... 9
World Palm Oil Industry ........................................... ............ .... 12 Development of Malaysian Palm Oil Industry............................... 1 5 Malaysian Production of Palm Oil.................... .......... ........ . . ..... 19
Problem Statement.. . . . . . . . . . . . . . . . . . .. . . . . . . . . . . . . . . . . . . . . . . . . . . . . . . . . . . . . . . . . . . . . . . . . 20 Objectives of Study ........ ....................... . ..... . . . . ............. .. . ...... .. .. . 23
IT LITERATURE REVIEW
Introduction................................................................................. 24 CompetitIveness . . . . .. . . . . . . .... . . . . . . . . . . . . . . . . . .. . . . . . . . . . ... . . . .... . . . . . . . . . . . . " . . . . . . . 24 ExportPerformance ............... ........ ...... ........................................ 26 Industry Analysis .................................................................... ..... 30
Number of Firms............................. .. . . . . . . . . . . .. . . . . . . . . .. . . . . . . . . . . . . . . . . 32 Barriers to Entry .................................................................... 35 Cost..................... .................................................................. 37 Product Differentiation................... . . . . . . . . .. . . . . . . . . . . . . . . . . . . . . . .. . . .. . . . . 40 Bargaining Power......................................................... .. ........ . 4 1
Bargaining Power of Suppliers . . . . . .. .. . . . . .. . . . . . . . . . ...... .. . .. .. . . .. . . . 44 Bargaining Power of Buyers ...... . . .. . . ...... ..... .. ....... .. ............. 45
Conduct ................ . ................................................................ 46 Performance ............................................................................ 49
IV
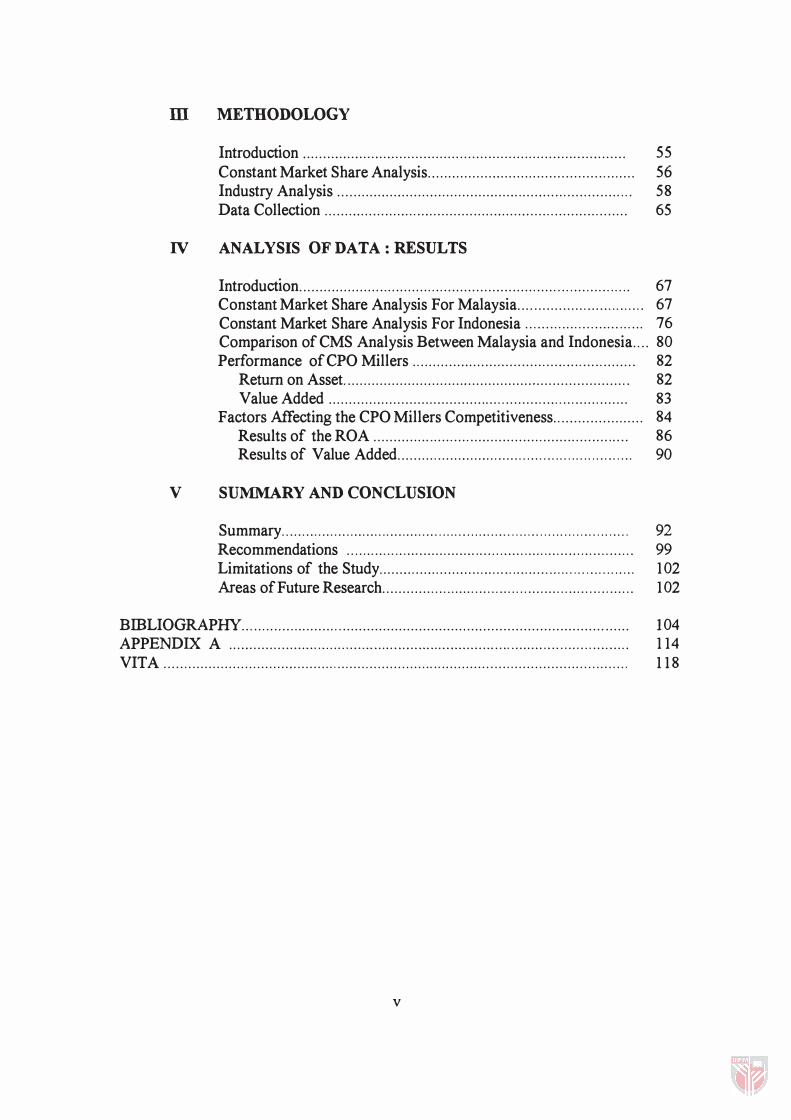
ill METHODOLOGY
Introduction ................................................................... ............. 55 Constant Market Share Analysis................................................... 56 Industry Analysis ...... . ...................................... ................ ........ .... 58 Data Collection ........................................................................... 65
IV ANALYSIS OF DATA: RESULTS
Introduction.................................................................................. 67 Constant Market Share Analysis For Malaysia............................... 67 Constant Market Share Analysis For Indonesia . . ...... ... .... . .... ... ..... . 76 Comparison of CMS Analysis Between Malaysia and Indonesia.... 80 Performance of CPO Millers ....................................................... 82
Return on Asset. ..................................................................... . 82 Value Added .......................................................................... 83
Factors Affecting the CPO Millers Competitiveness...................... 84 Results of the ROA ........... ... . ................................... ........ ..... 86 Results of Value Added.......................................................... 90
V SUMMARY AND CONCLUSION
Summary...................................................................................... 92 Recommendations . ......... . ... .................. ..... .................... .............. 99 Limitations of the Study............................................................... 102 Areas of Future Research.................. ........ ...................... .............. 102
BmLIOGRAPHY... ... ....... ... ........ .................................................................. ...... 104 APPENDIX A .. ......... .... ...... . . .... . .... .... . . .... . .... . . . . ............... . ... ........ . .. . . ... ... .......... 1 14 VITA . . . . . . . . . . . . . . . . . . . . . . . . . . . . . . . . . . . . . . . . . . . . . . . . . . . . . . . . . . . . . . . . . . . . . . . . . . . . . . . . . . . . . . . . . . . . . . . . . . . . . . . . . . . . . . . . . . . 1 18
v
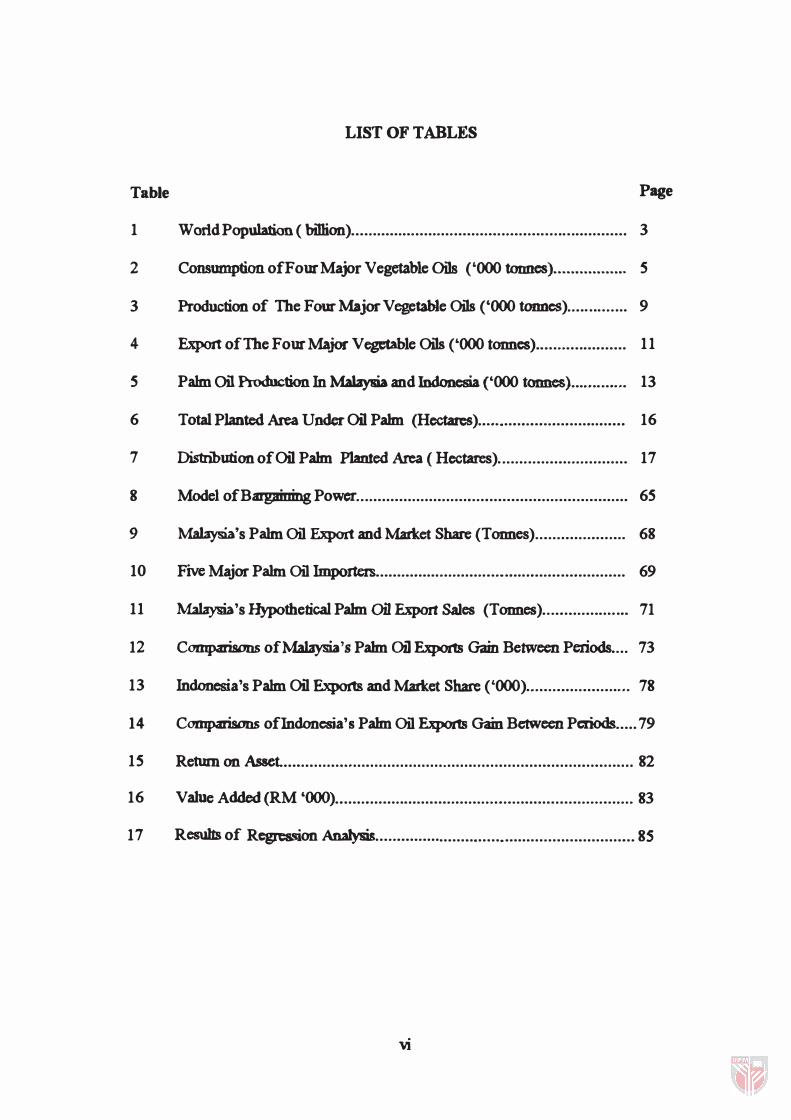
LIST OF TABLES
Table Page
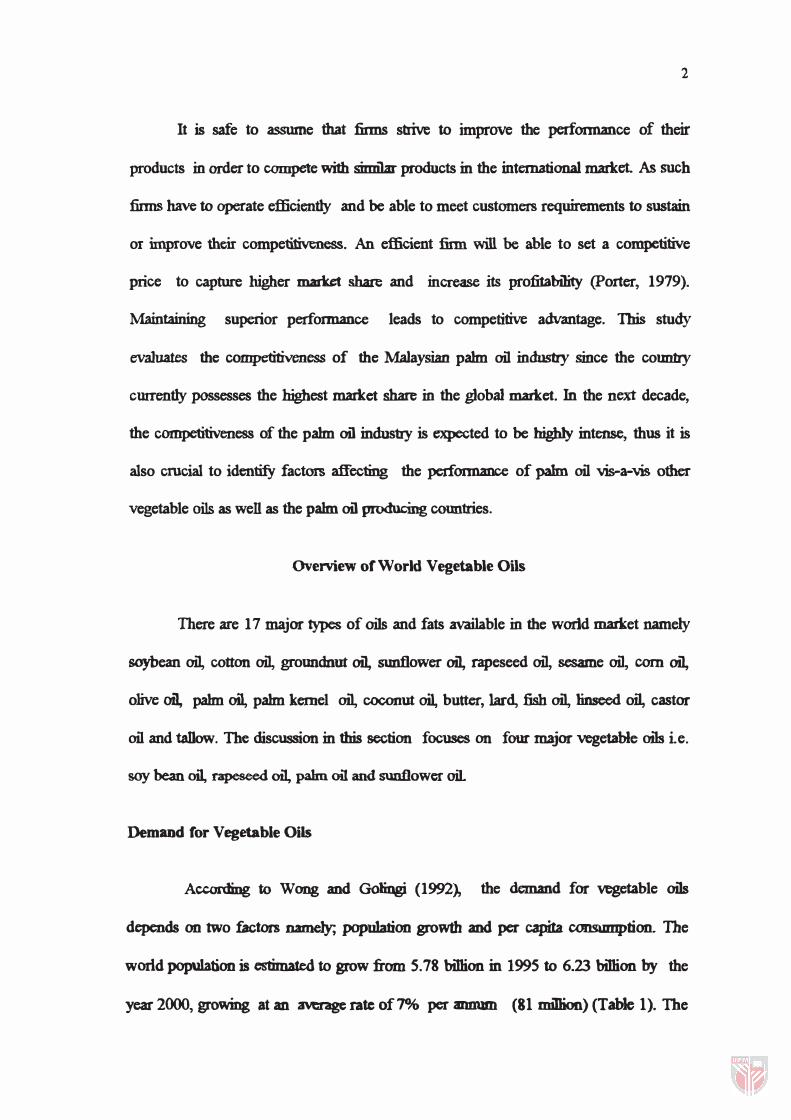
1 World Population ( billion).... . .......... . . . . . . . . . . . . . . . . . . . . . . . . . . . . .. . . . .. . .... . . . . . . . . . 3
2 Consumption of Four Major Vegetable Oils ('000 tonnes)................. 5
3 Production of The Four Major Vegetable Oils ('000 tODnCS)........ . . . ... 9
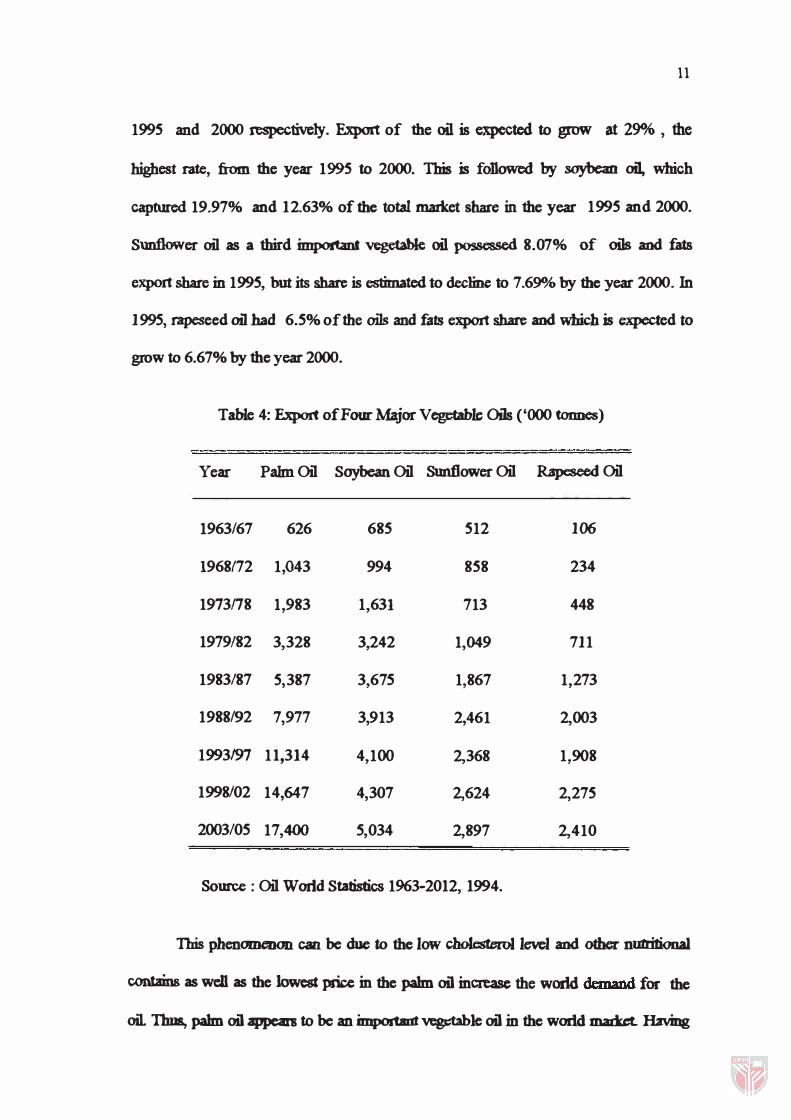
4 Export of The Four Major Vegetable Oils ('000 tonnes )... . . . .. . . .. . .. . . . . . . 11
5 Palm 00 Production In Malaysia and Indonesia ('000 tonnes)....... ...... 13
6 Total Planted Area Under Oil Pahn (Hectares)......... .. ..... .. . .. . . . . ......... 16
7 Distribution of Oil Pahn Planted Area ( Hectares). .. . . . . . . . . . . . . . . . . . . . . . . . . . . . 17
8 Model of Bargaining Power.. .. . . . . . . . . . . . . . . . . . . . . . .. . . . . . . . . . . . . . . . . . . . . . . . . . . . . . . . . . . . . 65
9 Malaysia's Palm Oil Export and Market Share (Tonnes).. . . . . . . . . . . . . . . . . . . . 68
10 Five Major Palm Oil Importers............... . . . . . . . . . .. . . ....... ........ . . ... . ... . . . .. . 69
11 MaLaysia's Hypothetical Pahn Oil Export Sales (Tonnes) . . .. . . . . . . . . .. . . . ... 71
12 Comparisons of MaLaysia '8 Pahn Oil Exports Gain Between Periods.... 73
13 Indonesia's Palm Oil Exports and Market Share ('000) ... . . . . . . . . . . . . . . . . ..... 78
14 Comparisons ofIndoncsia'5 Pahn Oil Exports Gain Between Periods ..... 79
15 Return on Asset ................................................................................. 82
16 Valoe Added (RM '(00) .. . . . . . . . . . . . . . .. . . . . . . . . . . . . . . . . .. . . . . . . . . .. . . . . . . . . . . . . . . . . . . . . . . . . 83
17 Results of Regression Analysis .... .... . . . . . . .. . . . . . . .. . . . . .... . . . .. . . . . . . . . . .. . . . . . . . . . . . . 8S
vi
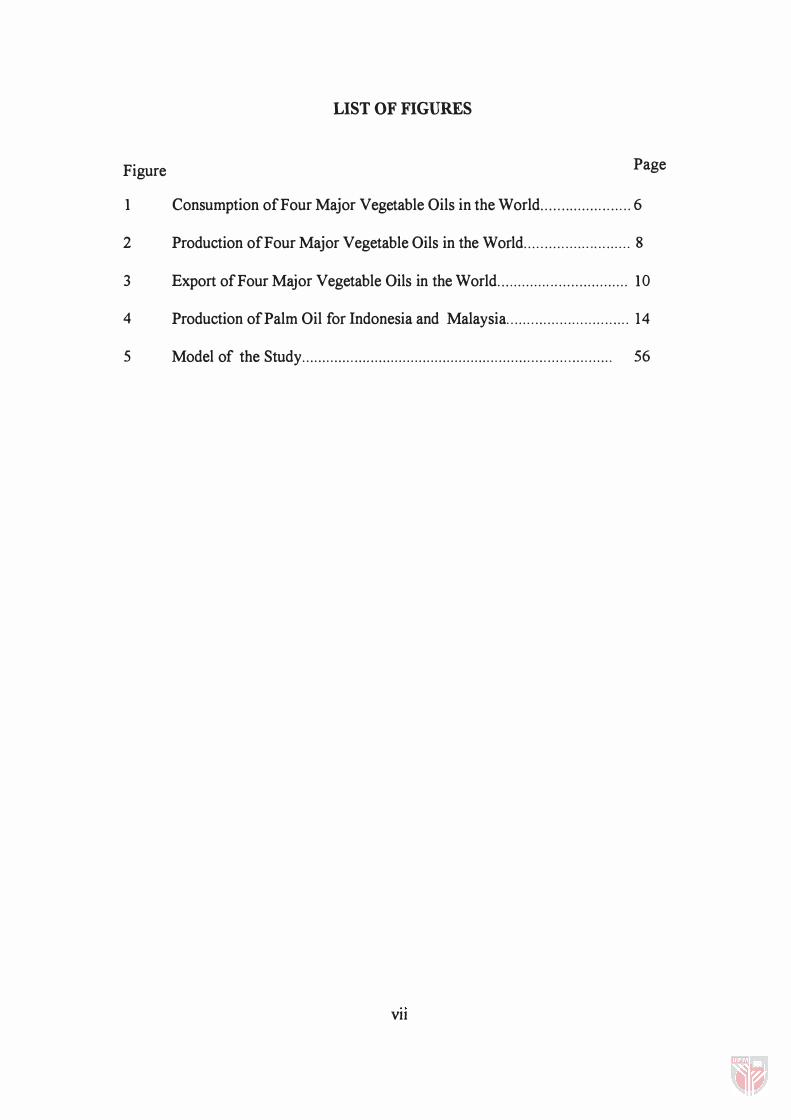
LIST OF FIGURES
Figure Page
1 Consumption of Four Major Vegetable Oils in the World ...................... 6
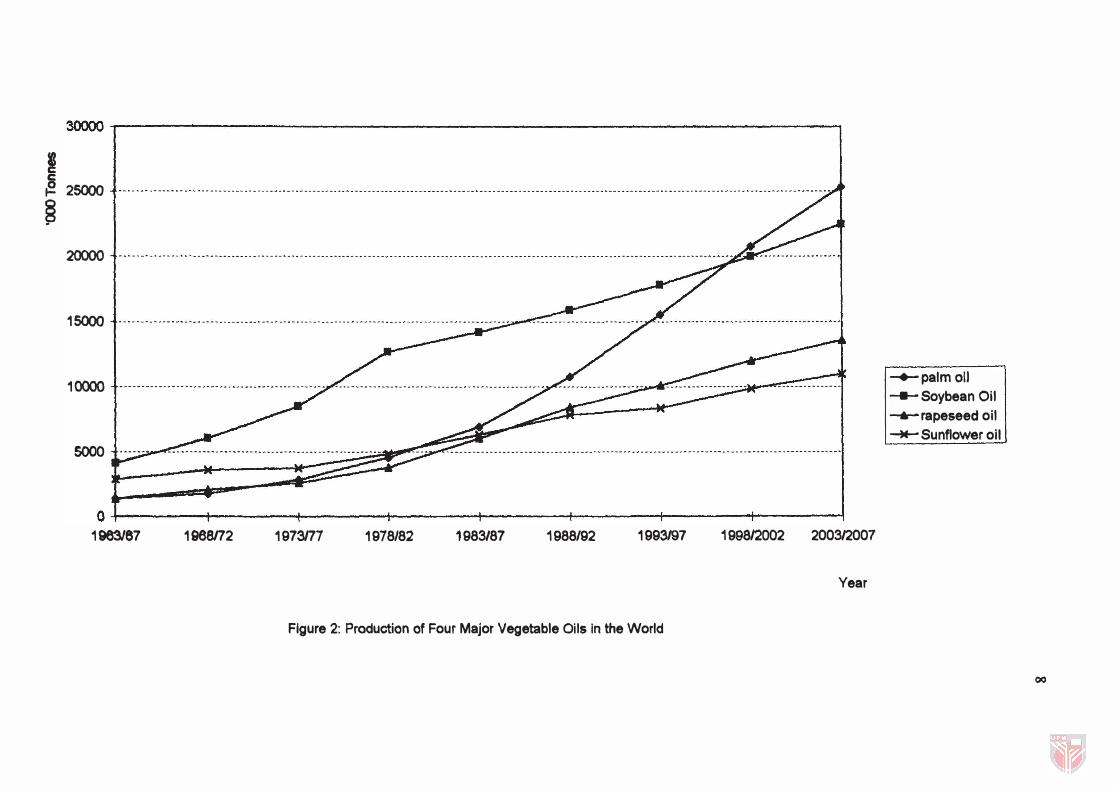
2 Production of Four Major Vegetable Oils in the World ......... ....... .......... 8
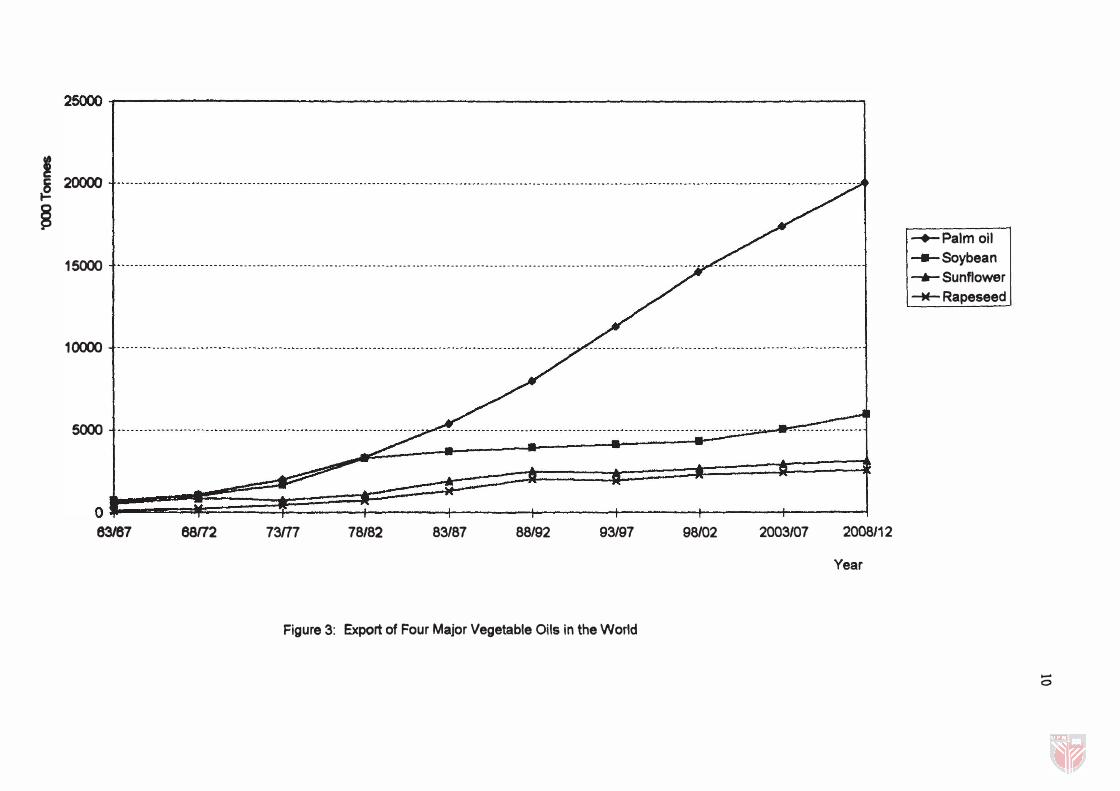
3 Export of Four Major Vegetable Oils in the World ... ......... . ................... 10
4 Production of Palm Oil for Indonesia and Malaysia ................ . . .. .......... 14
S Model of the Study............................................................................. S6
Vll
GATT
MIN
GDP
FELDA
FELCRA
RISDA
PORIM
PORLA
FFB
MOPGC
POMA
PORAM
MEOMA
MPOPC
CPO
FFA
CMS
SCP
ROA
ROI
ROS
TFP
PC
LIST OF ABBREVIATIONS
- General Agreement on Tariffs and Trade
- Multinational Trade Negotiations
- Gross Domestic Product
- Federal Land Development Authority
- Federal Land Consolidation and Rehabilitation Authority
- Rubber Industry Smallholders Development Authority
- Palm Oil Research Institute of Malaysia
- Palm Oil Registration and Licensing Authority
- Fresh Fruit Bunches
- Malaysian Oil Palm Growers Council
- Palm Oil Millers Association
- Palm Oil Refiners Association of Malaysia
- Malaysian Edible Oil Manufacturing
- Malaysian Palm Oil Promotion Council
- Crude Palm Oil
- Free Fatty Acid
- Constant Market Share
- Structure, Conduct and Performance
- Return on Asset
- Return on Investment
- Return on Sales
- Total Factor Productivity
- Productivity of Capital Vlll
Abstract of dissertation submitted to the Senate ofUniversiti Putra Malaysia in fulfillment of the requirements for the Degree of Master of Science.
ASSESSING THE COMPETITIVENESS OF THE MALAYSIAN PALM OIL INDUSTRY
By
DEV AGI SUBRAMANIAM
September 1997
Chairman: Professor Dr. Mohd. Ghazali Mohayidin
Faculty: Economics and Management
Malaysia has been the world's largest producer and exporter of palm oil for the
last fifteen years. The palm oil is facing stiff competition from other palm oil
producers especially Indonesia. Indonesia's production of palm oil is increasing
rapidly at more than 10% annually compared to Malaysia which showed an average
growth of only 8.2% from 1990 to 1995. In response the Malaysian government has
taken many efforts to improve the performance of the local palm oil industry.
Despite the efforts of the government as well as the private sector to develop the palm
oil industry in Malaysia, the performance of the industry, measured in terms of market
share and profitability, is declining relative to those of other countries especially
Indonesia. Therefore, the aim of this study is to assess the competitiveness of the
Malaysian palm oil industry and to identify the factors affecting it.
IX
This study analyzed the competi1iveness of the pahn oil industry at the country
and industay level The compcIitivmess at country level was detennincd by palm oil
export performance which was measured by 1he constant Market Share model (CMS).
The CMS model decomposes the export of palm oil into three effects ie. size of
market, distribution and competitive effects. The result of the CMS analysis for the
size of market effect shows that the cOlmtry was unable to cope with world palm oil
demand in the later periods, compared to Indonesia. The distribution effect showed
that both Malaysia '8 and Indonesia '8 palm oil expolls were concentrated in markets
where demand was growing at slower rates during earlier periods fonowed by faster
rates in the later periods. Finally, the competitive effect showed a decline in Malaysia' 8
market share for the later periods, while Indonesia's market share was increasing
continuously. Thus, Malaysia is graduaJly losing its competiJiveness to Indonesia in
tenns of market share.
The analysis was carried out on crude palm oil (CPO) millers. The
perfonnance of the industry was found to be affected by productivity, technology,
market share, quality, balgaining power and cost of production. Performance was
measured by value added and return on assets. The coefficient of determination was
64.0% and 42.08% for ROA and value added rcspec1ively. The results showed that the
cost of production, market share, productivity of capital, quality (free fatty acid
content) and technology were significant at S%. Balgainjhg power did not contribute
much to the performance of CPO mi11ers. In conclusion, it was found that the
compcIitivmess of the industry can be imprO\lCd if the :finns increase their production,
productivity, technology, madct share and reduce the cost of production.
x
Abstrak tesis yang dikemukakan kepada Senat Universiti Putra Malaysia sebagai memenuhi keperluan untuk ijazah Master Sains.
PENILAIAN PERSAINGAN INDUSTRI MINYAK KELAPA SA WIT MALAYSIA
Oleh
DEV AGI SUBRAMANIAM
September 1997
Pengerusi : Profesor Dr. Mobd. Gbazali Mobayidin
Fakulti : Ekonomi dan Pengurusan
Malaysia merupakan pengeluar dan pengekspot minyak kelapa sawit yang
terbesar di dunia selama 1 5 tahun yang lalu. Kini, industri tersebut menghadapi
persaingan yang hebat dari pengeluar minyak kelapa sawit lain seperti Indonesia.
Kadar produksi Indonesia telah meningkat lebih daripada 1 0% jika dibandingkan
dengan Malaysia hanya 8.2% dari tahun 1990 ke 1995. Kerajaan Malaysia dan
badan-badan swasta telah mengambil beberapa langkah untuk memperbaiki prestasi
industri tersebut yang ditentukan oleh keuntungan dan bahagian pasaran (market
share). Namun demikian, saham pasaran Malaysia semakin banyak diambil alih oleh
Indonesia. Jadi, tujuan kajian ini adalah untuk menilai persaingan industri minyak
kelapa sawit Malaysia dan mengenalpasti faktor-faktor yang mempengaruhi industri
tersebut.
Kajian ini menganalisa persaingan minyak kelapa sawit pada peringkat negara
dan industri. Persaingan pada peringkat negara ditentukan oleh prestasi eksport
negara.
Xl
1a diukur dengan menggunakan model" constant market share" (eMS). Model in
dibahagikan kepada tiga kesan iaitu: saiz pasaran, distribusi dan persaingan.
Keputusan analisa CMS untuk saiz pasaran menunjukkan bahawa negara ini tidak
dapat memenuhi pennintaan dunia jika dibandingkan dengan Indonesia. Pada
awalnya kesan distIibusi untuk Malaysia dan Indonesia menunjukkan pengeksportan
minyak kelapa sawit teltumpu pada negara-negara yang permintaannya bertambah
pada kadar yang perlahan. Tapi pada tempoh masa 1990-1994 pennintaan minyak
kelapa sawit dari negara-negara pengimpot telah meningkat. Kesan persaingan
menunjukkan saham pasaran negara Malaysia semakin berkurang manakala pasaran
Indonesia semakin meningkat untuk tempoh masa 1991 - 1994. Oleh yang demikian,
pasaran minyak kelapa sawit Malaysia semakin berkurangan berbanding dengan
Indonesia.
Setemsnya kajian ini menganalisa faktor-fak1:or yang mempengamhi prestasi
industri tersebut. Analisa regreasi dilakukan pada minyak kelapa sawit yang belum
diproses (CPO). Prestasi industri tersebut dipengamhi oleh produh.1:ivit� teknologi,
bahagian pasaran (market share), mutu, kuasa menawar and kos pengeluaran. Prestasi
tadi diukur oleh "value added" dan kadar pulangan pada asset. Angkali regreasi
men�jukkan 64% untuk pulangan pada asset dan 42.0% ulltuk" value added".
Keputusan regreasi menunjukkan kos pengeluaran, saham pasaran, produktiviti kapital
dan mutu adalah siknifikan pada 5% untuk kajian ini. Manakala k-uasa menawar adalah
tidak siknifikan untuk pengajian ini. Kesimpulan kajian ini adalah persaingan minyak
kelapa sawit boleh diperbaiki jika finna-finna meningkatkan produktivit� teknologi,
pasaran dan k-urangkan kos pengeluaran.
xii
CHAPTER I
INTRODUCTION
Background
Malaysia maintained its high economic growth rate of 9.2% and 9.6% � 1994
and 1995. This was mainly due to the expansion of local and external demand for
higher value added products. Domes1ic demand increased from 10.6% in 1994 to
17.7% in 1995 while export matket grew from 17.5% to 25.6% during the same
period. The higher external demand was driven by electrical and electronic products,
manufactured goods and palm oil, each contn"buting 48.6%, 25% and 5.3%
respectively.
The rapid growth of export can also be attributed to successful trade
negotiations through the General Agreement on Tariffs and Trade (GATT). The
successful completion of the eighth round of Uruguay Rounds (1986) of negotiations
under GATT provided additional stimulus to international trade. GATT's main
fimctions were to facilitate periodic multinational trade negotiations (M1N) and pr<Mde
a forwn for dispute settlement among the member countries (Markusen, 1995). The
GATT negonations were also aimed at creating a much more Jiberal Dade setting for
agriculture products through the reduction of 1rade barriers.. The remowl of such
baniers indicates opening of the domesIic madcet to international producers and
indirectly encourages competition.
2
It is safe to assume that finns strive to improve the perfonnance of their
products in order to compete with similar products in the international market. As such
finns have to operate efficiently and be able to meet customers requirements to sustain
or improve their competitiveness. An efficient firm. will be able to set a competitive
price to capture higher market slw'e and increase its profitability (porter, 1979).
Maintaining superior perfonnance leads to competitive advantage. This study
evaluates the competitiveness of the Malaysian palm oil industIy since the countJy
currently possesses the highest market share in the global market. In the next decade,
the competitiveness of the palm oil indus11y is expected to be highly intense, thus it is
also crucial to identify factors affecting the perfonnance of pahn oil vis-a-vis 01her
vegetable oils as well as the palm oil producing countries.
Overview of World Vegetable Oils
There are 17 major types of oils and fats available in the world market namely
soybean oil, cotton oil, groundnut oil, sunflower oil, rapeseed oil, sesame oil, com oil,
olive oil, palm oil, palm kernel oil, coconut oil, butter, lard, fish oil, linseed oil, castor
oil and tallow. The discussion in this section focuses on four major vegetable oils ie.
soy bean oil, rapeseed oil, pahn oil and sunflower oil.
Demand for Vegetable Oils
According to Wong and Golingi (1992), the demand for vegetable oils
depends on two factors namely; populaUon growth and per capita consumption. The
world population is estimated to grow from 5.78 billion in 1995 to 6.23 billion by the
year 2000, growing at an average rate of 7% per annum (81 million) (Table 1). The
3
United Nations Statistics forecasted that by the year 2025, the population of Asia,
Afiica, Latin America, Europe, USSR, North America and Ocenia will be 4.467,
1.643, 0.787, 0.527, 0.367, 0.347 and 0.04 billion respectively (Neilsen, 1994).
Table 1: World Population (Billion)
Year Population
1955 2.75
1%0 3.02
1965 3.34
1970 3.70
1975 4.08
1980 4.45
1985 4.85
1990 5.30
1995 5.76
2000 6.23
2005 6.69
2010 7.15
Source: Oil World statistics 1963- 2012, 1994 & Wong & GoDingi (1992)
The second important factor is consumption per capita, which is inftuenced by income,
government policy, prices and foreign exchange. Prices of vegetable oils are generaDy
detennined by world supply and demand.
4
Considering the expected changes in the two main factors, consump1ion for
vegetable oils is forecasted to increase from 80.236 million tonnes in 1990 to 104.844
million tonnes by the year 2000. During this period, the expected consumption growth
rate is 15.84% compared to a population growth rate of only 7%. In other words, a 1%
increase in population will increase the world consumption of vegetable oils by 2.26%
(Oil World Statistics 1963-2012, 1994). Conswnption per capita of oils and fats is
expected to increase :from 15.71 kg in the year 1995 to 16.82 kg in the year 2000. The
United Nations recommends that the nunirlltun per capita oil consumption to maintain
physical and mental health is 12 kg. However, the world average consumption per
capita is only 15 kg. Developed countries such as USA and the European Economic
Community consume more than their share wInle developing countries such as China
and India are Jagging behind with about half the world average at 7 kg. As China and
India account for 4()O;b of the world population, the growth in demand for oi1s and fats
from these two cotmtries will be VCJY high in the next decade as their economy is
expected to improve with the Jiberalization of their economic policies, particularly that
of China's .
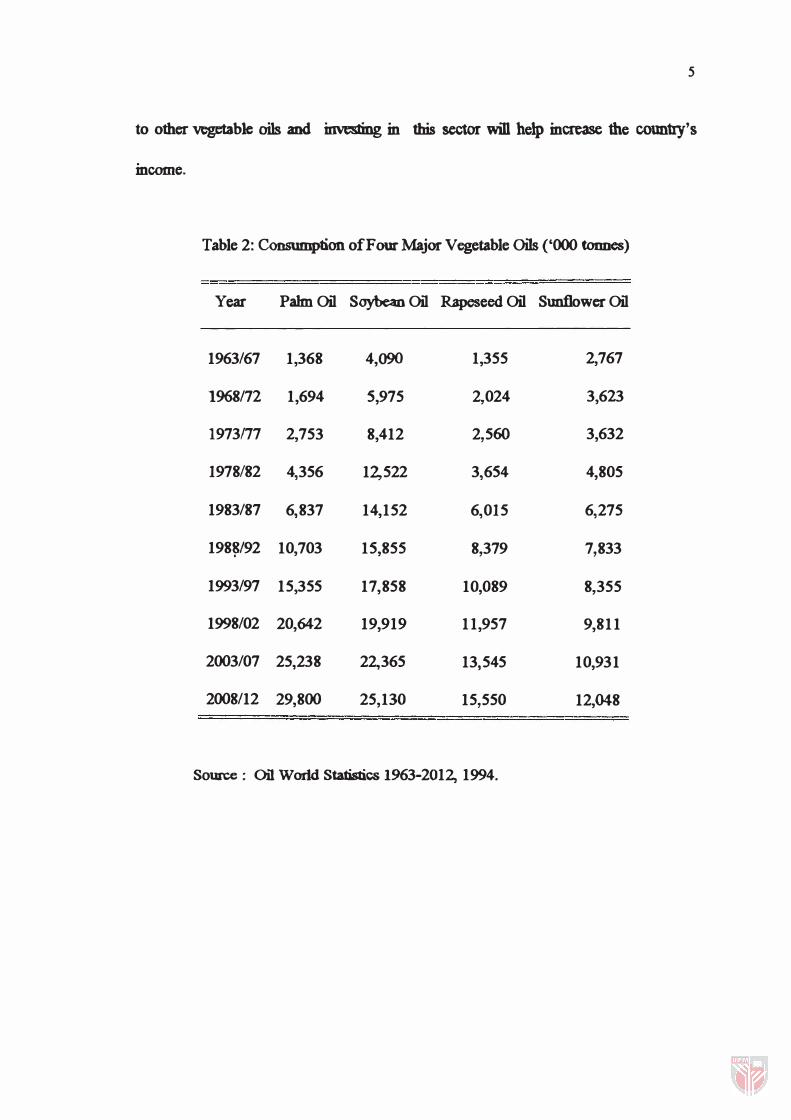
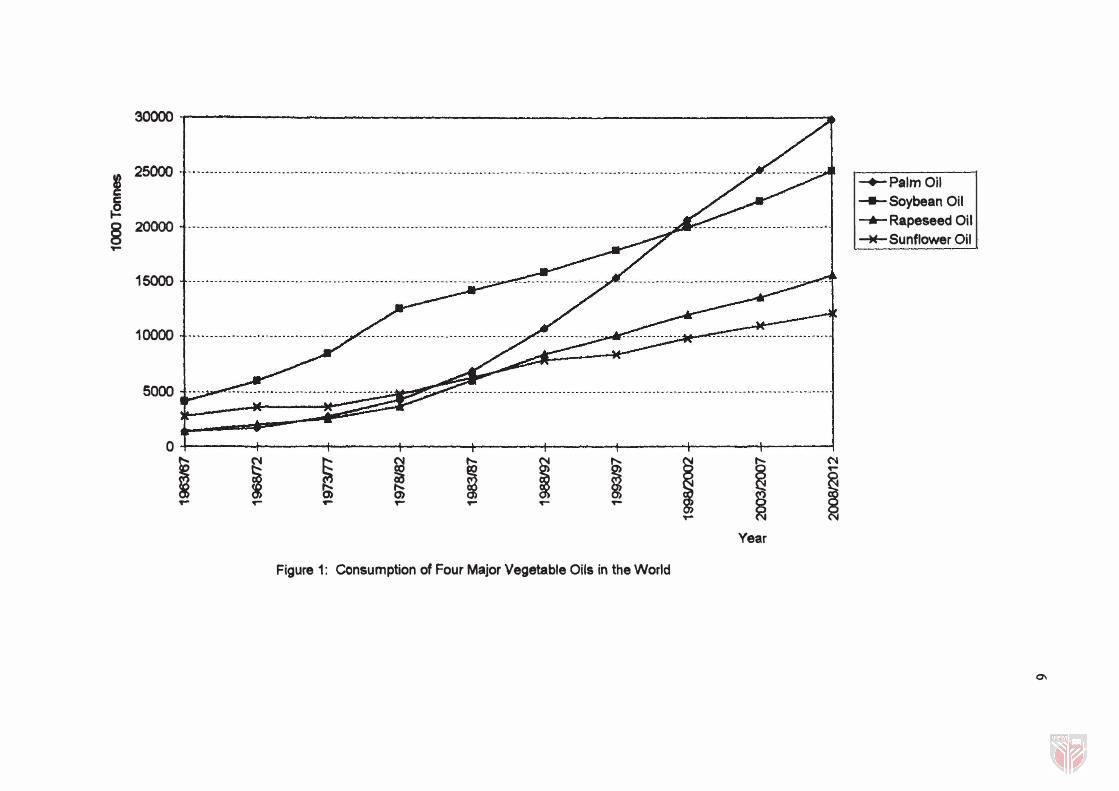
As shown in Table 2, the consumption per capita for palm oil is expected to
increase from 2.66 kg in 1995 to 3.31 kg in the year 2000. Comparing this with
soybean oil, consumption per capita is expected to increase from 3.1 kg in 1m to
3.197 kg in the year 2000. The consumption of major oils namely pahn oil, soybean
oil, rapeseed oil and sunflower oil is expected to grow at 34.43%, 1l.54%, 18.5% and
17.4% respectively from the year 1995 to 2000. The consumption pattern is shown in
the Figure 1. Therefore, pahn oil has a greatec pote.ntial in the world matket compared
5
to other vegetable oils and investing in this sector will help increase the c01m1ry's
income.
Table 2: Consumption of Four Major Vegetable Oils ('000 tonnes)
Year Palm Oil Soybean Oil Rapeseed Oil Sunflower Oil
1963/67 1,368 4,090 1,355 2,767
1968/72 1,694 5,975 2,024 3,623
1973n7 2,753 8,412 2,560 3,632
1978/82 4,356 12,522 3,654 4,805
1983/87 6,837 14,152 6,015 6,275
198�/92 10,703 15,855 8,379 7,833
1993/97 15,355 17,858 10,089 8,355
1998/02 20,642 19,919 11,957 9,811
2003/07 25,238 22,365 13,545 10,931
2008/12 29,800 25,130 15,550 12,048
Source: Oil World Statistics 1963-2012, 1994.
30000 ..
� 2� � � § 20000 ----------------------------------------------------------------------------------------------------------------- _ _ __ - -- _ _ _oj �
15000
10000 -1--------------------------------------/------------------------------------�-----------�-------.�--.---.--------------�
� r:':uuuu"u£ �� uuuunnn--nuu-ununnunuuu-ul 0
I � � � I I � i I ('II 1"-
� 0> � 1"" r ..... ,... ,... ..... ,...
�
Year
Figure 1: Consumption of Four Major Vegetable Oils in the World
-+-PalmOil - Soybean Oil -...- Rapeseed Oil -W- Sunflower Oil
01
7
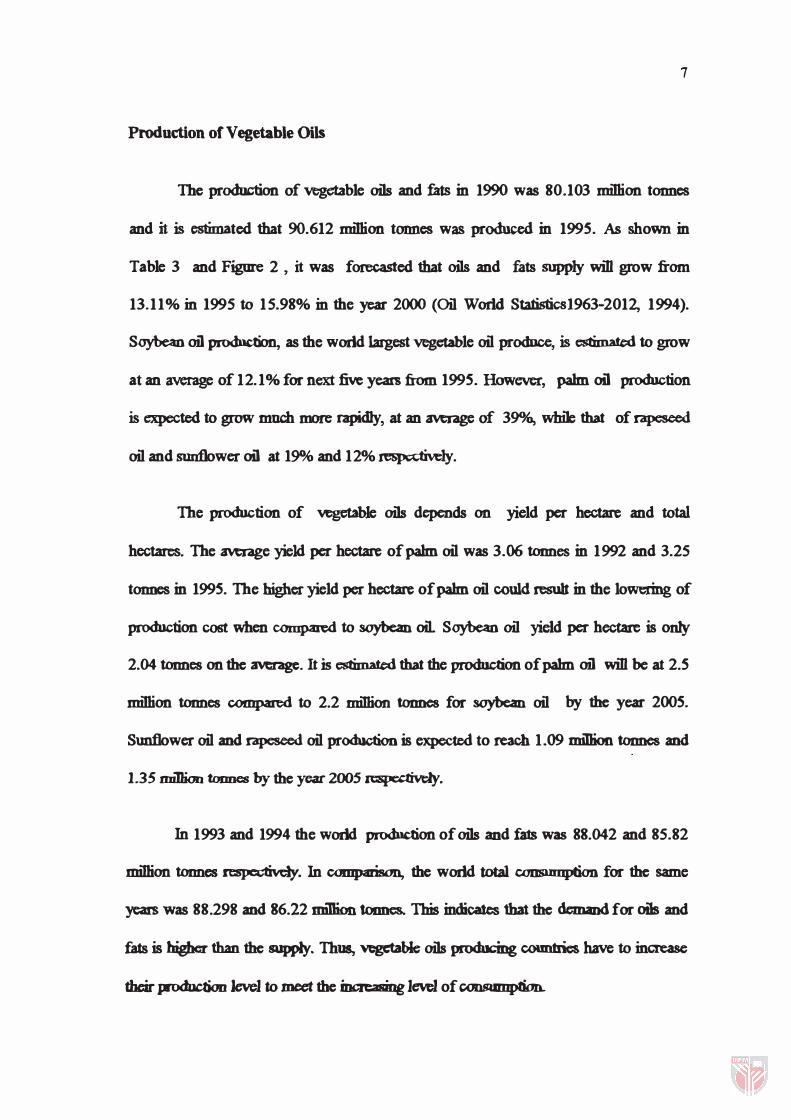
Production of Vegetable Oils
The production of vegetable oils and fats in 1990 was 80.103 million tonnes
and it is estimated that 90.612 million tonnes was produced in 1995. As shown in
Table 3 and Figure 2 , it was forecasted that oils and fats supply will grow from
13.11% in 1995 to 15.98% in the year 2000 (Oil World Statisticsl963-2012, 1994).
Soybean oil production, as the world largest vegetable oil produce, is estimated to grow
at an average of 12.1 % for next five years :from 1995. However, pahn oil production
is expected to grow much more rapidly, at an average of 3904., while that of rapeseed
oil and sunflower oil at 19010 and 12% respectively.
The production of vegetable oils depends on yield per hectare and total
hectares. The average yield per hectare of pahn oil was 3.()6 tonnes in 1992 and 3.25
tonnes in 1995. The higher yield per hectare of pahn oil could result in the lowering of
production cost when compared to soybean oil. Soybean oil yield per hectare is only
2.04 tonnes on the average. It is estimated that the production ofpalm oil will be at 2.5
million tonnes compared to 2.2 minion tonnes for soybean oil by the year 2005.
Sunflower oil and rapeseed oil production is expected to reach 1 .09 million tonnes and
1.35 miDion tonnes by the year 2005 respectiveJy.
In 1993 and 1994 the world production of oils and fats was 88.042 and 85.82
miDion tonnes respectiveJy. In comparison, the world total consumption for the same
years was 88.298 and 86.22 million tonnes. This indicates that the demand for oils and
fats is higher than the supply. Thus, vegetable oils producing coun1ries have to increase
their production level to meet the increasing level of CODSUIDpbon.
��--------------------------------------------------------------------�
I s � 25000 -f---------------------------------------------------------------------------------------------------------------------------------------------------------------------A
§ 20000 -t----------------------------------------------------------------------------------------------------------------------------------------------�-----------------I
15000 -t-----------------------------------------------------------------------------------------�---------------------�--------------------------------------·-·I
10000 -t-----------------------------------------------/----------------------------------------------.�-----.-.---.----,�--------.-----:..Wo_ ----------------1 -+-palm 011 --- Soybean Oil
--.- rapeseed oil
� Sunflower oil 5000 "t�
-----
O+I--------+-------�-------+--------+-------�------�--------+-------� 1�e7 1968172 1973177 1978182 1983/87 1988192 1993197 199812002 2003/2007
Year
Figure 2: Production of Four Major Vegetable Oils in the World
00
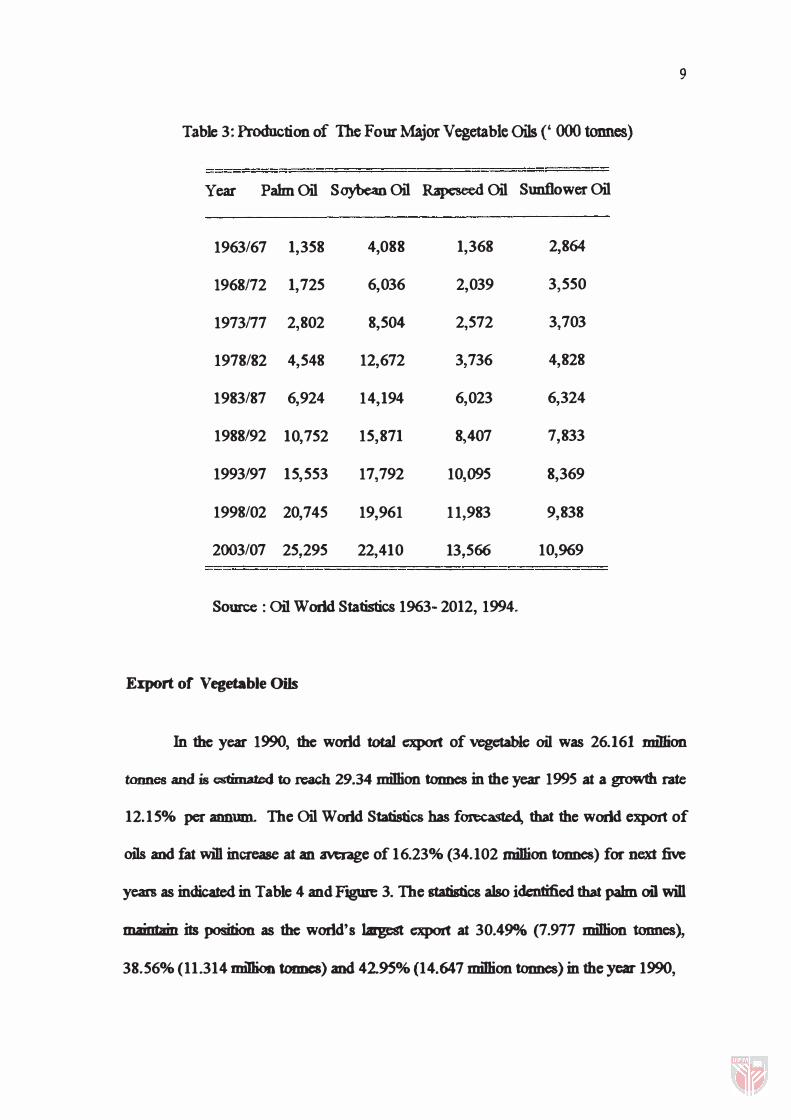
Table 3: Production of The Four Major Vegetable Oils (' 000 tonnes)
Year Palm Oil Soybean Oil Rapeseed Oil
1963/67 1,358 4,088 1,368
1968172 1,725 6,036 2,039
1973177 2,802 8,504 2,572
1978/82 4,548 12,672 3,736
1983/87 6,924 14,194 6,023
1988/92 10,752 15,871 8,407
1993/97 15,553 17,792 10,095
1998/02 20,745 19,961 11,983
2003/07 25,295 22,410 13,566
Source : Oil World Statistics 1963- 2012, 1994.
Export of Vegetable Oils
Sunflower Oil
2,864
3,550
3,703
4,828
6,324
7,833
8,369
9,838
10,969
9
In the year 1990, the world total export of vegetable oil was 26.161 million
tonnes and is estimated to reach 29.34 million tonnes in the year 1995 at a growth rate
12. 15% per annmn. The Oil World Statistics has forecasted, that the world export of
oils and fat win increase at an average of 16.23% (34.102 minion tonnes) for next five
years as indicated in Table 4 and FJgUre 3. The stabstics also identified that pahn oil will
maintain its position as the world's largest export at 30.490Al (7.977 miDion tonnes),
38.56% (11.314 miDion tonncs) and 42.95% (14.647 miDion tonnes) in the year 1990,
2��--------------------------------------------------------------------�
I g 20000 �
§ -+-Palm oil
15000 of----------------------------... -- .-.... --- ......... -- . . ... --.... - ... _.-.. ... _- ....... - ..... _ .. _._-_ ........ - . - .. --.. --- --... - .- . - .. --�-..... ....... - ... - ....... - .... --� 1--- Soybean
-.- Sunflower
-M- Rapeseed
/ 10000
5000
J = C;;;;c: -� �:: : r 63/87 68172 73f77 78/82 83/87 88192 93197 98102 2003/07 2008112
Year
Figure 3: Export of Four Major Vegetable Oils in the World
..... o
11
1995 and 2000 respectively. Export of the oil is expected to grow at 2901b , the
highest rate, :from the year 1995 to 2000. This is foUowed by soybean oil, which
captured 19.97% and 12.63% of the total market share in the year 1995 and 2000.
Sunflower oil as a third important vegetable oil possessed 8.07% of Oils and fats
export share in 1995, but its share is estimated to decline to 7.690.4 by the year 2000. In
1995, rapeseed oil bad 6.5% of the oi1s and fats export share and which is expected to
grow to 6.67% by the year 2000.
Table 4: Export of Four Mgor Vegetable Oils ('000 tonnes)
Year PaJmOil SoybcanOil Sunflower Oil Rapcsccd Oil
1963/67 626 685 512 106
1968172 1,043 994 858 234
1973178 1,983 1,631 713 448
1979/82 3,328 3,242 1,049 711
1983/87 5,387 3,675 1,867 1,273
1988192 7,977 3,913 2,461 2,003
1993197 11,314 4,100 2,368 1,908
1998/02 14,647 4,307 2,624 2,275
2003/05 17,400 5,034 2,897 2,410
Source : Oil World Statistics 1963-2012, 1994.
This phenomenon can be due to the low cbolesteroIleve1 and other nWritional
contains as well as the lowest price in the pahn oil increase the world demand for the
oil. Thus, pahn oil appears to be an important vegetable oil in the world maabt. Having
12
discussed the performance of the four major vegetable oils, it is also important to
analyze the perfonnance of the Malaysian palm oil industry with other producing
countries.
World Palm on Industry
Malaysia is the world leading producer of palm oil followed by Indonesia,
N'JgCria, Ivory Coast, Columbia, Thailand and others. Malaysia has successfu1ly
maintained its market share above 50% for the past fifteen yeats. However, its
position is threatened by the rapid expansion of Indonesia � s palm oil produc1ion and
shown on Figure 4 and Table 5. In 1995, Indonesia produced 27.7% of the world total
compared to only 14% in 1990. Oil World Statistics forecasted that Indonesia will be
able to capture almost the same madet share of palm oil production by the year 2010
(9.3 million tonnes) (Table 5). This is due to the co\Ultry�s matured area growing at
an average of 12.5% while Malaysia's is only 4.3% for the period 1992 to 1995.
Beside this, production growth rate for Indonesia is greater than l00At., compared to
that of Malaysia's which was only 8.2% for the same period. Therefore the Malaysian
export share is declining slowly. The country's export share is expected to decline
from 67.9% in 1990 to 63.37% and 56.46% in 1995 and 2000 respectively. In
contrast, Indonesia's export is expected to grow from 31.4% in 1995 to 38.4% in the
year 2000.
Wtth the entCIgCDCC of pahn oil in the world madet, oils and fats buyers have
focused on the South East Asian producing countries, notably Malaysia, for securing
their needs. Malaysia '8 major export cJestina1jons are Pa1cistan, China, ERe, Singapore,