vis annual report 2010
DESCRIPTION
Vis Annual Report 2010TRANSCRIPT

Annual Report 2010

| 2
Inde
x
Key figures …………………………………………………………… 3
Statement by the Chairman of the Board ………………………… 4
Statement by the CEO ……………………………………………… 4
Organisational Structure and Management Board …………… 5
Operations 2010 …………………………………………………… 6
Financial Statements …………………………………………… 17
Endorsement by the Board of Directors and CEO ……………… 18
Independent Auditor’s Report ……………………………………… 19
Income Statement …………………………………………………… 20
Balance Sheet ………………………………………………………… 21
Statement of Changes in Equity …………………………………… 22
Statement of Cash Flows …………………………………………… 23
Notes …………………………………………………………………… 24
Glossary ……………………………………………………………… 43
Editorship and supervision: Ingimar SigurðssonEnglish translation: Róbert MellkPhotographer: Páll GuðjónssonPrinting and layout: Svansprent
3 |
Key figures
Amounts in ISK millions.
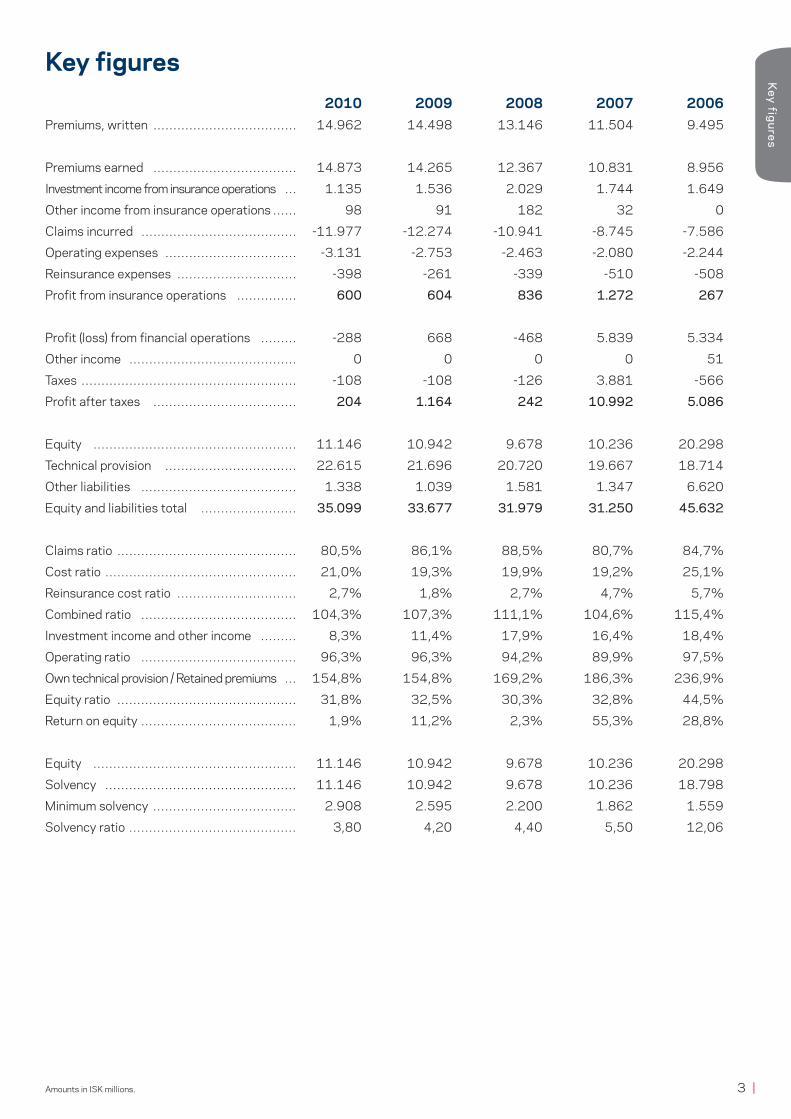
Key figures 2010 2009 2008 2007 2006Premiums, written ……………………………… 14.962 14.498 13.146 11.504 9.495
Premiums earned ……………………………… 14.873 14.265 12.367 10.831 8.956
Investment income from insurance operations … 1.135 1.536 2.029 1.744 1.649
Other income from insurance operations …… 98 91 182 32 0
Claims incurred ………………………………… -11.977 -12.274 -10.941 -8.745 -7.586
Operating expenses …………………………… -3.131 -2.753 -2.463 -2.080 -2.244
Reinsurance expenses ………………………… -398 -261 -339 -510 -508
Profit from insurance operations …………… 600 604 836 1.272 267
Profit (loss) from financial operations ……… -288 668 -468 5.839 5.334
Other income …………………………………… 0 0 0 0 51
Taxes ……………………………………………… -108 -108 -126 3.881 -566
Profit after taxes ……………………………… 204 1.164 242 10.992 5.086
Equity …………………………………………… 11.146 10.942 9.678 10.236 20.298
Technical provision …………………………… 22.615 21.696 20.720 19.667 18.714
Other liabilities ………………………………… 1.338 1.039 1.581 1.347 6.620
Equity and liabilities total …………………… 35.099 33.677 31.979 31.250 45.632
Claims ratio ……………………………………… 80,5% 86,1% 88,5% 80,7% 84,7%
Cost ratio ………………………………………… 21,0% 19,3% 19,9% 19,2% 25,1%
Reinsurance cost ratio ………………………… 2,7% 1,8% 2,7% 4,7% 5,7%
Combined ratio ………………………………… 104,3% 107,3% 111,1% 104,6% 115,4%
Investment income and other income ……… 8,3% 11,4% 17,9% 16,4% 18,4%
Operating ratio ………………………………… 96,3% 96,3% 94,2% 89,9% 97,5%
Own technical provision / Retained premiums … 154,8% 154,8% 169,2% 186,3% 236,9%
Equity ratio ……………………………………… 31,8% 32,5% 30,3% 32,8% 44,5%
Return on equity ………………………………… 1,9% 11,2% 2,3% 55,3% 28,8%
Equity …………………………………………… 11.146 10.942 9.678 10.236 20.298
Solvency ………………………………………… 11.146 10.942 9.678 10.236 18.798
Minimum solvency ……………………………… 2.908 2.595 2.200 1.862 1.559
Solvency ratio …………………………………… 3,80 4,20 4,40 5,50 12,06

| 4
Sta
tem
ent
Statements by the Chairman of the Board and the CEOAxel GíslasonVÍS stands on a solid foundation on Iceland’s insurance market. The company’s total assets at year-end 2010 were over ISK 35 billion, while equity was ISK 11.1 billion. VÍS has a dynamic team of employees with the experience and knowledge necessary to provide quality insurance services throughout Iceland.VÍS has not been immune to the economic slump that Icelanders have been undergoing in recent years. This is reflected, for example in a reduction in company profits during the last business year. This trend needs to be reversed.
VÍS’s new Board was elected at a shareholders’ meeting last December. Among its tasks is to continue the work that began the previous year to implement provisions of new insurance laws that went into effect in mid-2010. Several of the new regulations are still in the process of being instituted, which shall be confirmed by the Financial Supervisory Authority.
During times of difficulty, the role of insurance companies in a society is more important than ever, as individuals, families and businesses have less latitude when dealing with financial losses caused by unforeseen events. It can there-fore be expected that many will need to reassess their insurance protection in accordance with changed circumstances, and the risk that they choose to bear personally. The company’s service network is in part structured to pro-vide customers around the country with all such assistance, since VÍS intends to continue to provide the support that our customers can rely on.
I would like to thank VÍS customers, employees and Board members for their collaboration and trust over the past year.
Guðmundur Örn GunnarssonVÍS’s performance was considerably weaker in 2010 than the year before, which is of course disappointing. The company wrote-off many more accounts receiva-ble than previously, as difficult conditions on financial markets and declining inter-est revenue impacted quite negatively on the 2010 financial statements. One of the company’s primary tasks will be to increase profitability and reduce costs even further. Work will continue on rationalising operations whenever possible.
Profit on company operations after taxes totalled in excess of ISK 204 million, while profit after taxes in 2009 was ISK 1,164 million. The most important factor involved investment activities that showed a loss in 2010, but returned a good profit in 2009. It should be kept in mind that VÍS’s core operation, insurance, is on stable footing and returned a profit of over ISK 600 million.
When times are difficult, a downtrend in the insurance market can be expected, particularly regarding discretionary insurance. This is not true in relation to VÍS. In this respect the decline is less than might be anticipated, and is a welcome result. This indicates that VÍS customers clearly understand that their insurance protection should always be in order, no less so during economic crisis. VÍS puts great emphasis on preventative activities and education, as it is a policy that unmistakably reduces claims incurred. This also holds true in the battle against insurance fraud.
It is difficult getting Iceland’s economic wheels to start turning again after the financial collapse. The financial situation of homes and business reflect this difficulty. My hope is that the government succeeds in breaking through this sluggishness in Iceland’s economy so that circumstances for people and businesses will improve in 2011. There are many opportunities throughout Icelandic society, but as in football, being on the offensive can only bring results if the team is united. Icelanders must band together and choose solidarity instead of disunity if this period of recession is to end anytime soon.
Guðmundur Örn GunnarssonCEO
Axel GíslasonChairman of the Board

5 |
Operations 2
01
0S
tructure
Organisational Structure and Management Board
The Insurance Division is responsible for insurance operations of VÍS and Lífís. This includes providing comprehensive risk assessment, suitable pricing, admini-stration and product development. The Insurance Division is also responsible for the company’s overseas operations. Division Manager is Friðrik Bragason.
The Claims Division is responsible for loss assessment, determination of compensation and settlement of losses, and monitors claims development of individual insurance branches. Division Manager is Agnar Óskarsson.
The Sales and Services Division is responsible for sales and services of life- and non-life insurance to individuals, companies, municipalities and institutions. The Division also manages the company’s service network, and is responsible for marketing and public relations. Division Manager is Auður Björk Gudmundsdóttir.
The Finance Division is responsible for accounts, collections, reporting, settlements, accounting and operational matters for VÍS and Lífís. Division Manager is Guðmar Guðmundsson.
The IT Division is responsible for implementing and providing services relating to information technology economically and efficiently that provide support for company operations, employees and customers. This involves installing and servicing technical equipment and software, project management and consulting regarding information technology projects, development of IT systems and the operation of communications systems. Division Manager is Þórir Már Einarsson.
The Human Resources Division is responsible for all human resource issues, matters regarding education and training, hiring and wage processing, as well as providing consultation services to employees and management. Moreover, office supervision and cafeteria operations are the responsibility of this division. Division Manager is Anna Rós Ívarsdóttir.
Internal Auditing
Board
CEOGuðmundur Örn
Gunnarsson
Insurance DivisionFriðrik Bragason
Claims DivisionAgnar Óskarsson
Sales and Services Division
Auður Björk Guðmundsdóttir
Finance DivisionGuðmar Guðmundsson
IT DivisionÞórir Már Einarsson
Human Resources Division
Anna Rós Ívarsdóttir
Risk Management Legal and Compliance
Investment
| 6
Ope
rati
ons
20
10 Operations 2010
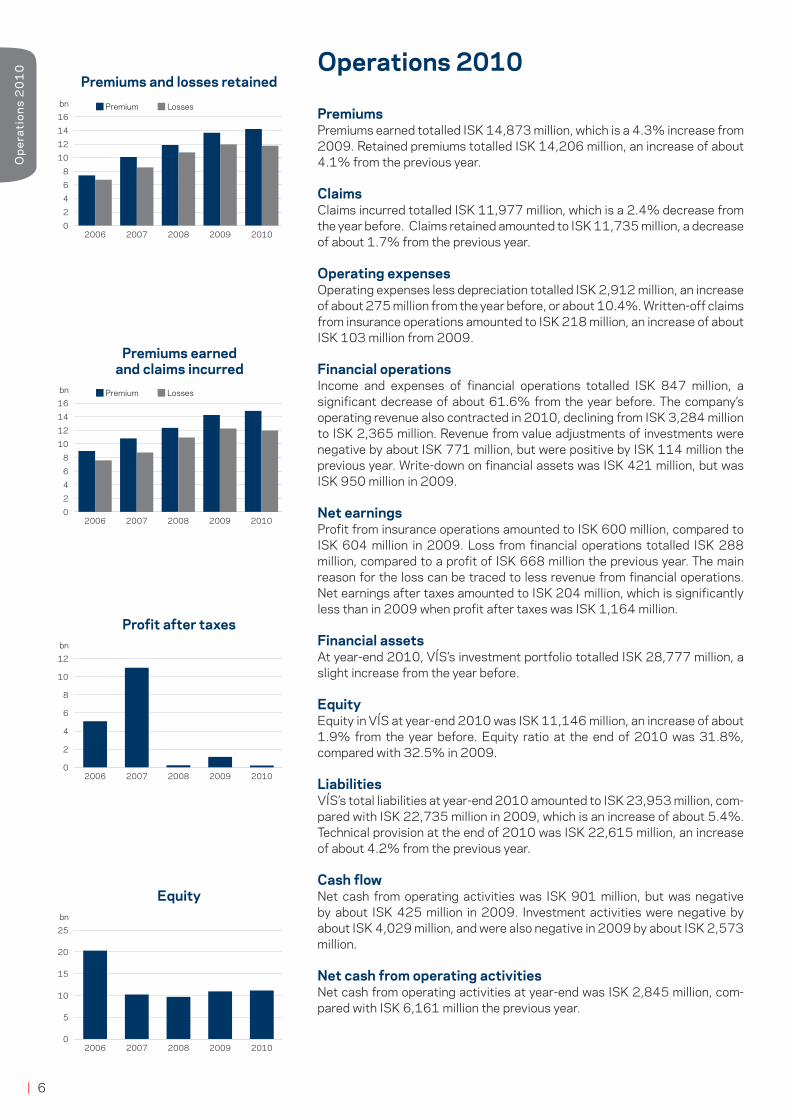
PremiumsPremiums earned totalled ISK 14,873 million, which is a 4.3% increase from 2009. Retained premiums totalled ISK 14,206 million, an increase of about 4.1% from the previous year.
ClaimsClaims incurred totalled ISK 11,977 million, which is a 2.4% decrease from the year before. Claims retained amounted to ISK 11,735 million, a decrease of about 1.7% from the previous year.
Operating expensesOperating expenses less depreciation totalled ISK 2,912 million, an increase of about 275 million from the year before, or about 10.4%. Written-off claims from insurance operations amounted to ISK 218 million, an increase of about ISK 103 million from 2009.
Financial operationsIncome and expenses of financial operations totalled ISK 847 million, a significant decrease of about 61.6% from the year before. The company’s operating revenue also contracted in 2010, declining from ISK 3,284 million to ISK 2,365 million. Revenue from value adjustments of investments were negative by about ISK 771 million, but were positive by ISK 114 million the previous year. Write-down on financial assets was ISK 421 million, but was ISK 950 million in 2009.
Net earningsProfit from insurance operations amounted to ISK 600 million, compared to ISK 604 million in 2009. Loss from financial operations totalled ISK 288 million, compared to a profit of ISK 668 million the previous year. The main reason for the loss can be traced to less revenue from financial operations. Net earnings after taxes amounted to ISK 204 million, which is significantly less than in 2009 when profit after taxes was ISK 1,164 million.
Financial assetsAt year-end 2010, VÍS’s investment portfolio totalled ISK 28,777 million, a slight increase from the year before.
EquityEquity in VÍS at year-end 2010 was ISK 11,146 million, an increase of about 1.9% from the year before. Equity ratio at the end of 2010 was 31.8%, compared with 32.5% in 2009.
LiabilitiesVÍS’s total liabilities at year-end 2010 amounted to ISK 23,953 million, com-pared with ISK 22,735 million in 2009, which is an increase of about 5.4%. Technical provision at the end of 2010 was ISK 22,615 million, an increase of about 4.2% from the previous year.
Cash flowNet cash from operating activities was ISK 901 million, but was negative by about ISK 425 million in 2009. Investment activities were negative by about ISK 4,029 million, and were also negative in 2009 by about ISK 2,573 million.
Net cash from operating activitiesNet cash from operating activities at year-end was ISK 2,845 million, com-pared with ISK 6,161 million the previous year.
Premiums and losses retained
2006 2007 2008 2009 2010 0
2
4
6
8
10
12
14
16 Eigin iðgjöld og eigin tjón
2006 2007 2008 2009 2010 0
2
4
6
8
10
12
14
16 452(678&&*"+,%+&*&3#9&'(#%$3&*"+,%+&
2006 2007 2008 2009 2010 0
2
4
6
8
10
12 >2#$2&3-%+,"-%;<2=2%
2006 2007 2008 2009 2010 0
5
10
15
20
25 5-63$%+"#"$%8/-%
Profit after taxes
Equity
Premiums earned and claims incurred
2006 2007 2008 2009 2010 0
2
4
6
8
10
12
14
16 Eigin iðgjöld og eigin tjón
2006 2007 2008 2009 2010 0
2
4
6
8
10
12
14
16 Eigin iðgjöld og eigin tjón
2006 2007 2008 2009 2010 0
2
4
6
8
10
12
14
16 Eigin iðgjöld og eigin tjón
2006 2007 2008 2009 2010 0
2
4
6
8
10
12
14
16 Eigin iðgjöld og eigin tjón
Premium
Premium
Losses
Losses
bn
bn
bn
bn
7 |
Operations 2
01
0
Operating profit of insurance segments
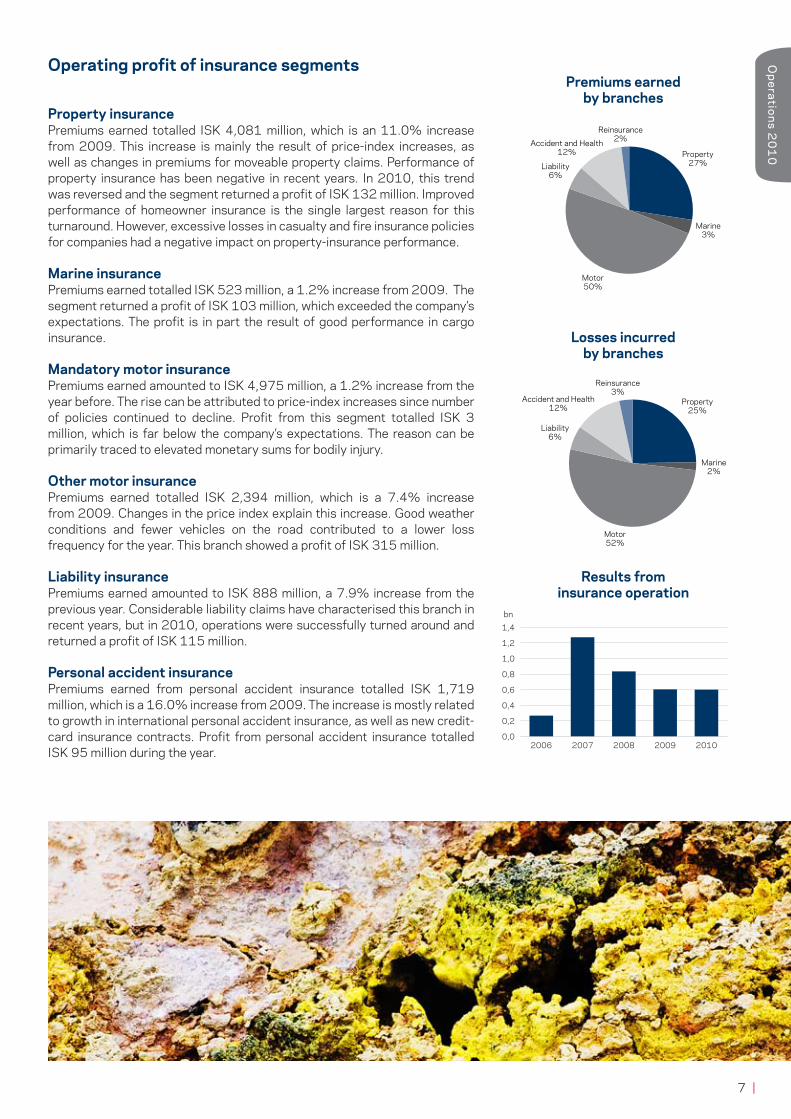
Property insurancePremiums earned totalled ISK 4,081 million, which is an 11.0% increase from 2009. This increase is mainly the result of price-index increases, as well as changes in premiums for moveable property claims. Performance of property insurance has been negative in recent years. In 2010, this trend was reversed and the segment returned a profit of ISK 132 million. Improved performance of homeowner insurance is the single largest reason for this turnaround. However, excessive losses in casualty and fire insurance policies for companies had a negative impact on property-insurance performance.
Marine insurancePremiums earned totalled ISK 523 million, a 1.2% increase from 2009. The segment returned a profit of ISK 103 million, which exceeded the company’s expectations. The profit is in part the result of good performance in cargo insurance.
Mandatory motor insurancePremiums earned amounted to ISK 4,975 million, a 1.2% increase from the year before. The rise can be attributed to price-index increases since number of policies continued to decline. Profit from this segment totalled ISK 3 million, which is far below the company’s expectations. The reason can be primarily traced to elevated monetary sums for bodily injury.
Other motor insurancePremiums earned totalled ISK 2,394 million, which is a 7.4% increase from 2009. Changes in the price index explain this increase. Good weather conditions and fewer vehicles on the road contributed to a lower loss frequency for the year. This branch showed a profit of ISK 315 million.
Liability insurancePremiums earned amounted to ISK 888 million, a 7.9% increase from the previous year. Considerable liability claims have characterised this branch in recent years, but in 2010, operations were successfully turned around and returned a profit of ISK 115 million.
Personal accident insurancePremiums earned from personal accident insurance totalled ISK 1,719 million, which is a 16.0% increase from 2009. The increase is mostly related to growth in international personal accident insurance, as well as new credit-card insurance contracts. Profit from personal accident insurance totalled ISK 95 million during the year.
Premiums earned by branches
Losses incurred by branches
Results from insurance operation
Property 27%
Marine 3%
Motor 50%
Liability 6%
Accident and Health 12%
Reinsurance 2%
23#'456%-+7"$7%)*"+%,-&+.##"$#/#+)"$01%
Property 25%
Marine 2%
Motor 52%
Liability 6%
Accident and Health 12%
Reinsurance 3%
8'($%-+7"$7%)*"+%,-&+.##"$#/#+)"$01%
2006 2007 2008 2009 2010 0
0,2
0,4
0,6
0,8
1
1,2
1,4 !"#$%&%'&()*+,--./-%+012*+.&&
,0
0,
bn

| 8
Ope
rati
ons
20
10
0
5
10
15
20
25
30
35
Eignir Vátryggingaskuld
Samsetning eigna á móti vátryggingaskuld
International reinsurancePremiums earned from international reinsurance were ISK 294 million, a 52.2% decrease from 2009. This decrease is largely the result of declining credit entries from past years. International reinsurance recorded a loss of ISK 159 million.
Accident prevention strategyVÍS operated in line with its accident prevention strategy during the year. Emphasis was placed on increasing employee knowledge in this area. Customers were provided with information concerning preventative measures in a variety of ways, for example interaction with employees, phone calls, emails, pamphlets and website content.
The company organised numerous preventative activities during the year, for example an information campaign about drugs aimed at teenagers, and a fire-prevention campaign focusing on families. Moreover, the company gave reflectors to children and jogging groups. The VÍS website regularly posted accident prevention news about weather, homes, traffic and leisure activities. In addition, the volcanic eruptions at Fimmvörðuháls and then Eyjafjallajökull were extensively covered on the website with detailed information and instructions.
The “Traustakot” animated home was introduced on VÍS’s website during the year. Individuals are guided through “Traustakot” and provided with informa-tion about burglary and fire prevention in a graphic format.
The company organised extensive accident prevention programs with numer-ous companies and municipalities in 2010. Special Traffic Safety Days were held in Greater Reykjavík in partnership with Strætó Public Bus System. The campaign focused on making pedestrians aware of traffic safety through positive messages. VÍS held an open conference on safety and accident prevention for companies in cooperation with the Administration of Occupa-tional Safety and Health in Iceland. This was the first time in Iceland that an insurance company held a conference on company safety.
The Maritime Safety and Survival Training Centre signed a three-year safety-at-sea agreement with the company. This was in line with VÍS’s commitment to be a leading insurance company in preventing accidents among seamen in Iceland.
Over 640 businesses were visited during the year where performance evaluations were conducted and safety measures assessed. This initiative has been received extremely well by customers, and led to preventative measures being improved. VÍS´s vision is to provide its customers with quality prevention services with the ultimate goal of reducing accidents and losses for all concerned.
Product developmentProduct development during the year primarily involved improving existing insurance sectors in areas of claims, rate structure and own risk.
A special motorcycle insurance policy was marketed, which offered optional protective equipment insurance.
Terms for F plus family insurance continued to evolve with the aim of improving insurance performance. For example, an inexpensive and economic addition was made to the benefits included in F plus travel insurance .
New credit card-insurance terms were added in response to expanding business during the year. Own risk and discount structure were reviewed, for example business liability insurance for commercial vehicles. Moreover, rates for moveable property claims were changed, and stand-in insurance simplified.
Composition of assets at year-end 2010
Composition of assets matching technical provisions
Assets
Government bondsLoss reserves
Bank deposits
Premium reserves
Market bondsMunicipal bonds
Real estateOther assets
0
5
10
15
20
25
30
35 bn
Technical provisions
Reinsurers’ share
Government bonds 47%
Investments, securities bond
19%
Secured loans and other loans
6%
Accounts receivable 12%
Bank deposit 8%
Other loans and assets
6%
Reinsurance assets 2%
Samsetning eigna 2010
Total assets
2006 2007 2008 2009 2010 0 5
10 15 20 25 30 35 40 45 50
Þróun heildareigna bn
International business, premiums written by insurance sectors
Property 15%
Marine 46%
Motor 4%
Accident and health 35%
!+5)$6%,"379"?@A%B(9CD+3%"3#'456%)*"+%,-&+.##"$#/#+)"$01%

9 |
Operations 2
01
0
In the autumn, new medical practitioner liability insurance was introduced. In addition, new terms were implemented for dental professional liability insurance
International marketsThere was an upturn in the company’s operations in international markets during 2010 compared with 2009. The claims ratio dropped from 130.9% to 121.0%, and the combined ratio went from 154.3% to 134.7%. The largest improvement was in marine insurance, in part due to the company’s actions in response to poor performance results in 2009. However, performance of accident and health insurance has declined, primarily because of heavy claims. The company has taken systematic actions to counteract this trend, including the following: increases in premiums, cost reductions and changes in terms and conditions. These measures contribute to reducing claims incurred.
As previously, the company bases its participation in foreign markets on strong connections with established partners rather than maintaining offices in the respective countries. The defensive posture taken after the financial collapse in 2008 has carried the company through the storm, which is best reflected in the increase in premiums written year on year. It appears that new opportunities are once again beginning to appear.
Growth continued in international accident and health insurance and property insurance. Premiums earned in these two sectors increased from ISK 251 million to ISK 370 million.
Premiums written relating to international business in 2010 totalled about ISK 793 million, an increase of about ISK 98 million from the year before. However, premiums earned decreased somewhat from the previous year from just under ISK 930 million to about ISK 703 million. This is mostly the result of decreasing credit entries from reinsurance contracts that were made in 2008 and 2009. Premiums earned from international reinsurance dropped from ISK 615 million to ISK 294 million. This was somewhat offset by increases in direct insurance fields year on year by about ISK 94 million.
Risk assessmentConsiderable emphasis was placed on risk assessment of new insurance policies. In order to further strengthen risk assessment, processes involving personal insurance, mandatory professional liability insurance and property insurance were improved during the year. At year-end, cooperation began with Frumherji involving risk inspections of properties for homeowner insurance. Special emphasis was concentrated on monitoring major risk in current insurance contracts. This is in connection with upcoming solvency directives, “Solvency II,” where considerable emphasis is placed on risk analysis in insurance operations.
Income 2010
Expenses 2010
Retained premiums 89%
Investment income 10%
Other income 1%
Tekjur ársins 2010
Retained losses 75%
Investment expenses 4%
Operational cost 21%
Gjöld ársins 2010

| 10
Ope
rati
ons
20
10 Claims
In 2010, claims totalling ISK 11 billion were paid, equal to over ISK 900 million per month. Over 32 thousand claims were reported for an average of 98 claims daily, every day of the year. There were seven major fires during 2010, of which several were caused by arson. Those responsible have not been found which is of great concern. There was no loss of life in these fires, but property loss cost hundreds of millions of króna.
There was no letup in burglaries and theft, although there was a slight reduction from the year before.
Automobiles burglarised and reported to VÍS during the year totalled 135, compared with 166 the previous year. Most were perpetrated in the first part of the year, and from August, their numbers dropped off significantly. As always, wallets and purses, GPS devices, computers and other valuables tempted thieves.
Burglaries of homes and businesses declined in 2010 compared to 2009, which was a record year. There were about 632 reported burglaries or a daily average of 1.73 during 2010. The worst months with over 70 burglaries each were March, May and October.
Reported bicycle thefts increased slightly in 2010 in comparison to the previous year, or 259 opposed to 243 in 2009.
CompetitionCompetition on the insurance market was hard during the year, as it has been in past years. Dumping characterised the market, which led to a considerable upsurge in requests for insurance consultation by customers. Despite market volatility, growth in the company’s market share exceeded expectations: from 35.5% in 2009 to 36.3% in 2010 and remains the largest insurance company in Iceland.
Business servicesCompetition was also strong on the business market. Companies are increasingly requesting quotes on insurance, as well as tender offers. In spite of increasingly robust price competition, VÍS has been able to hold its market share. A campaign was launched during the year to conduct performance evaluations of companies’ safety and prevention health, which proved successful in implementation and in management approval. Over 600 businesses were visited throughout the country.
Sales campaign for LífísA campaign to sell life and health insurance was launched during the year under the slogan “Gizzur the Great.” Digital signatures and telephone confirmations were used to close sales rather than signatures on paper.

11 |
Operations 2
01
0
Call centresTelephone calls at VÍS call centres have been increasing from year to year, along with the company’s growing market share in recent years. A total of 125 thousand phone calls were handled in the call centre during the year, which are about 10,400 calls per month. Calls increased by about 2,100 over the previous year. The response rate was over 90% at year-end.
MarketingA new image campaign was launched in 2010 with the slogan, “Our role is to protect and insure.” The advertisements depict daily life in Iceland in all its diversity. The aim of the campaign was to draw attention to VÍS’s diverse services and dynamic service network. The animated world of these adverts creatively presented colourful scenes popping out of VÍS family albums.
Emergency Road ServiceVÍS and Frumherji signed a cooperative agreement during the year titled “Tryggur Car assistance.” The scheme involves assisting drivers in trouble anywhere in the country, anytime of the day or night, any day of the year. VÍS customers who are operating private vehicles, and have F plus or a home insurance policy, receive this service at a discounted rate of 50-70%. This new service has been very well received by VÍS customers.
Sponsoring the arts and cultureVÍS and the Iceland Symphony Orchestra signed an agreement whereby VÍS became one of the orchestra’s main sponsors over the next three years. For many years, the Iceland Symphony Orchestra has been one of the foremost orchestras in Scandinavia, and received excellent reviews for its concerts and recordings at home and internationally.
VÍS and the Reykjavik City Theatre have enjoyed excellent cooperation for many years, and the company is one of the theatre’s strongest supporters. In 2010, a cooperative agreement with the theatre was renewed, and the play “Ofviðrið” presented as a VÍS performance. The company invited a large number of customers who would be celebrating their 40th or 50th birthday in 2010 to see the play.
VÍS and Akureyri City Theatre renewed their cooperative agreement during the year, and the company supported the acclaimed performance of “39 Steps.” VÍS customers in North Iceland celebrating their 40th or 50th birthday in 2010 were invited to see the play, which was much appreciated.
VÍS supports innovationVÍS was a participant in “Útgerðin,” an umbrella organisation for innovation projects that companies and universities in Iceland offer. The primary aims of this project were to launch Útgerðin, show solidarity and ensure that young students have a choice, that they do not emigrate abroad, but rather choose a career in the field of innovation and development. VÍS is proud to have helped Útgerðin, and by doing so promote innovation in Iceland.
VÍS loves handballVÍS continued as a main sponsor of Iceland’s National Handball Team. The company’s marketing division developed new and fun advertisements in connection with handball that drew considerable positive attention from the public. Television commercials were made using animated figures of Iceland’s handball stars, which were in line with the company’s other ads. These commercials were aired in connection with the European Men’s Handball Championship held in Austria, the European Women’s Championship in Denmark.
Ragnheiður named VÍS Athlete of the YearSwimmer Ragnheiður Ragnarsdóttir was named VÍS Athlete of the Year, which included a two-year collaboration and sponsorship contract with VÍS. Ragnheiður participated in two major competitions during the year: European Swimming Championships in Holland, and the World Swimming Championships

| 12
Ope
rati
ons
20
10 held in Dubai in December. Ragnheiður’s long-term goal is to qualify for the
2012 Olympics in London, and be one of the best swimmers in the sport.
VÍS Championship League in Horse SportsFor the fourth successive year, VÍS was a main sponsor of the Championship League in Horse Sports. The competition began in January and continued until the end of April. Competitors were an elite group of Icelandic equestrians. Winner of the individual competition was Sigurður Sigurðsson. Málning hf. won the team competition.
Participating on dog showsAs in past years, VÍS supported the work of the Icelandic Kennel Club, and was present at the dog shows. This support was clearly appreciated at the shows, where guests and participants were invited to purchase insurance for their animals. Owners of animals insured by VÍS were invited to have photographs taken of their pets, or have illustrations drawn by students from the Reykjavík School of Visual Art. Pet owners were delighted.
Information technologyVÍS places major emphasis on utilising information technology wherever possible in its operations.
The company’s IT team, working in cooperation with staff and subcontrac-tors, developed a new Net solution in 2010 that improves services and sim-plifies disseminating information to customers. The solution, which is open to all employees, is called “Miðgarður” and provides overviews of all interaction, insurance and claims handling with customers regardless of the underlying systems storing the data.
Work is ongoing to provide customers additional access to information about their personal business through a Net solution at www.vis.is, which has been named “My insurance.” The solution is built on the same technology as “Miðgarður.”
Customers can use electronic identification on their debit cards when logging into the solution. The banking sector is working on implementing such cards. It is expected that most people will have received E debit cards by year-end 2011. This innovation will allow customers to more securely identify themselves to VÍS, and sign documents and commitments. This saves time, effort and money, and makes it possible to conduct business wherever and whenever.
Economic activityIt can be stated that the recession, which has defined the economic environment for business and families after the financial system collapsed in autumn of 2008, has been rather stable during 2010. The exchange rate
13 |
Operations 2
01
0
of the Icelandic króna against major currencies has strengthened somewhat during the year. The exchange rate index at the beginning of the year was about 233, but was 208 by year-end. The Central Bank of Iceland’s mid-price in euros went from ISK 180 at the start of the year to about ISK 154 króna by year-end. The Central Bank of Iceland lowered its policy interest rate in 2010 from 8.5% í 3.25%, although there were restrictions on currency transfers in and out of Iceland. Inflation declined during the year. Twelve-month inflation was 6.6% at the beginning of 2010, but had dropped to 2.5% by year’s end, which is the Central Bank’s inflation target.
Private consumption and investments continued to decline in 2010. Measures by the government and financial institutions to help financially indebted homes and businesses were drawn out over the year. The Debtors’ Ombudsman has begun working on payment and debt mitigation for families in the greatest need. It is expected that this work will result in corrected debt obligations for homes during 2011. Later in the year, financial companies and the government agreed on ways to assist businesses in reducing their debt burdens in order to help ensure operational integrity.
It is anticipated that 2011 will be a year of considerable housecleaning in the balance sheets and debt situations of businesses and families respectively. It is hoped that private consumption and investments will take a turn for the better when the stagnation, brought about by delaying actions to help busi-nesses and homes, begins drawing to an end.
VÍS has felt this stagnation in its operations. Weak business activity among the company’s customers in the contracting sector and other industries is the direct result of a depression, and leads to reduced income for families. A considerable number of accounts receivable had to be written down during 2010, and more effort was required to collect premiums.
It is anticipated that the economic situation will gradually improve over the year, that inflation will continue to remain around the Central Bank’s inflation target, and that the currency rate of the króna will be stable.
Prudence will continue to be a key component in company operations during 2011.
InvestmentsThe year 2010 was in many ways special since circumstances were unlike any we had experienced. Currency restrictions were tightened at the end of 2009, with the exception that capital entering the country was allowed to leave if had been reported when entering the country. In the wake of this move, the Icelandic króna strengthened in very small trading on the currency market. However, volume increased somewhat after the Central Bank of Ice-land began regular purchases in August. The króna strengthened by 11%
| 14
Ope
rati
ons
20
10 over the year, mostly in midyear. It was strongest on 4 November and weak-
ened somewhat as the year ended.
As in the previous year, investment opportunities were very limited and many locked-in krónur were looking for investment possibilities. Investment money, therefore, often looked to government securities, which to a large extend was the only option apart from bank accounts. In addition, there were fears that government-backed bank accounts would have limitations, so investors looked for safe harbour in government securities. Other investment possibili-ties were in real estate.
The banks still have a strong grip on companies that have found themselves in difficulties, and are very occupied in attempting to assist them. Several of these companies were presented to investors, either through open or closed offerings. VÍS participated in many of them in an endeavour to find more favourable investment alternatives, as well as to take part in rebuilding Iceland’s economy.
Inflation dropped significantly during the year. At year-end, it was below the Central Bank’s 2.5% inflation target, and the 12-month inflation rate was just 1.8%. Investors, therefore, looked rather to non-inflation indexed securities than the inflation-indexed ones. The government responded to this demand by increasing the selection of the former.
International stock exchanges experienced increases during the year; Morgan Stanley World Index of equities rose about 9.6% in dollars. VÍS increased its portfolio of foreign stocks during the year.
It was very satisfying to be a participant in several stock offerings held in Iceland. We hope that other companies decide it in their interest to list their stock in Iceland’s market. It is important that pricing be based on market conditions to attract numerous investors, which would then better ensure active trading in the stock.
At year-end, work began on reviewing the company’s investment strategy, in addition to reassessing procedure policy.
Human resource policy and the environmentVÍS endeavours to employ amicable and reliable people who are well versed in how to approach and handle responsibilities, and understand the role of the company and its vision for the future.
VÍS had 233 employees at year-end, although the average number of full-time equivalent employees during the year was 220. VÍS employees possess broad-based experience in their fields of activity, and their average period of employment is about 10 years. About 40% of employees have university degrees. The average age of employees is 45 years. The company has implemented an egalitarian policy, and the gender ratio is not far apart: 131 men and 102 women work at VÍS. One-third of managers and middle managers are women.
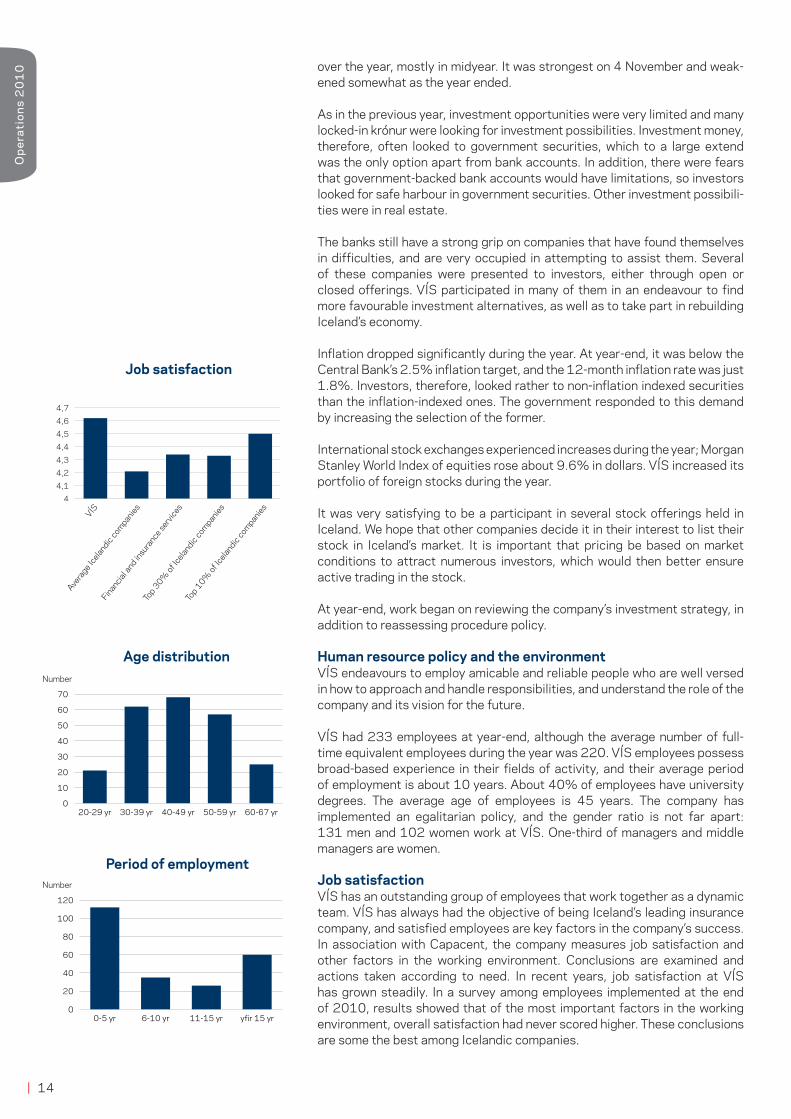
Job satisfactionVÍS has an outstanding group of employees that work together as a dynamic team. VÍS has always had the objective of being Iceland’s leading insurance company, and satisfied employees are key factors in the company’s success. In association with Capacent, the company measures job satisfaction and other factors in the working environment. Conclusions are examined and actions taken according to need. In recent years, job satisfaction at VÍS has grown steadily. In a survey among employees implemented at the end of 2010, results showed that of the most important factors in the working environment, overall satisfaction had never scored higher. These conclusions are some the best among Icelandic companies.
Job satisfaction
VÍS
Avera
ge Icelandic
companies
Financial a
nd insu
rance
serv
ices
Top 3
0% of
Icelandic
companies
Top 1
0% of
Icelandic
companies
Age distribution
Period of employmentNumber
Number
VÍS Fjármála og tryggingaþjónusta
Topp 10% íslenskra
fyrirtækja
4 4,1 4,2 4,3 4,4 4,5 4,6 4,7
Starfsánægja
20-29 yr 30-39 yr 40-49 yr 50-59 yr 60-67 yr 0
10
20
30
40
50
60
70 Aldursdreifing
0-5 yr 6-10 yr 11-15 yr yfir 15 yr 0
20
40
60
80
100
120 Starfsaldur

15 |
Operations 2
01
0
EducationThe company places great emphasis on education, and employees at VÍS have a wide range of opportunities for life-long education and continuing education. Organised training programs are offered to all employees, and endeavours are made to ensure that employees around the country can take advantage of the program. All seminars pertaining to the educational program are broadcast using teleconferencing equipment. The aim is for all employees working in insurance and claims to finish a specialised insurance course at the university level, taught at Reykjavík University. Eight employees finished this course in 2010, of which four were from regions outside Greater Reykjavík. Moreover, with the support of VÍS, many employees are enrolled in university studies while maintaining work responsibilities. For the third successive year, a group of employees took a Dale Carnegie seminar. About half of VÍS employees have now taken this seminar where emphasis is focused on communication and success at work.
A new procedure was instituted to improve the reception of new employees called the “recruitment system”. The aim of the recruitment system was to better prepare newcomers for their work at VÍS: to shorten the learning curve in relation to the working environment, equipment and procedures of the respective job. Seventeen employees received special training as recruitment mentors. They have the role of providing counsel, keeping an eye out and helping the new employee to grow into the job, as well as provide information, guidance and positive feedback. The mentors should do their best to help the newcomer feel welcome in the new workplace.
ReinsuranceVÍS’s reinsurance strategy requires that all reinsurers for VÍS have a secu-rity rating of A- or higher from Standard & Poor’s or another certified rating agency. This minimises reinsurance risk for VÍS, i.e. that the reinsurer does not uphold his obligations. Operating profit of reinsurers was good in 2010. VÍS’s reinsurance terms are good, as few claims having fallen on reinsurers for VÍS in recent years. Expenses relating to reinsurance are about 2.7% of premiums earned.
Risk managementRisk management is a growing segment of operations at VÍS, and has been given more weight within the company’s organisational structure. This development goes hand-in-hand with the changes appearing in the new solvency directives being discussed by the EU, which will include Icelandic insurance companies. These new solvency requirements, called Solvency II, shall become part of Icelandic law no later than year-end 2012.
The European Insurance and Occupational Pensions Authority (EIOPA) has in cooperation with insurance companies in the EU zone, conducted Quantitative Impact Studies (QIS) to determine the impact that various
Reinsurance cost ratio
2006 2007 2008 2009 2010 0
1
2
3
4
5
6 78-1$%$933(83#6/0%8#:#$")12#))&&%
Reinsurers’ security rating 2010
AAA 2%
AA+ 7%
AA- 36%
A+ 45%
A 5%
A- 5%
Styrkleikamat endurtryggjenda 2010

| 16
Ope
rati
ons
20
10 implementations of solvency requirements have on the calculated solvency
of insurance companies. Five such studies were conducted during the years 2005-2010. VÍS has always participated. The conclusion demonstrates the strong position held by VÍS according to the pending solvency directives.
In the upcoming solvency directives there will be greater emphasis placed on analysing risk factors in insurance company operations, and determining the financial resources necessary to meet them. This applies as much to risk in insurance operations as in investments. Risk management is a deep-rooted aspect of insurance operations. Performance of the various insurance segments are closely monitored, all endeavours are made to ensure that premiums coincide with the risk assigned to the insurance contracts, major risks are specially examined and assessed, and efforts are made to strengthen claims protection. Financial claim limits have been set on the loss risk that the company is prepared to carry on its own, and a policy has been demarcated regarding how the company reinsures itself. The company’s reinsurance policy stipulates limits on own risk, type of reinsurance contract, requirements regarding the reinsurer’s security rating, maximum risk placed on each reinsurer, and limitations on the number of reinsurers on reinsurance contracts.
Heightened emphasis is placed on risk management in the company’s financial operations. The company has an investment strategy that places great importance on secure and diversified assets and risk spreading.
The company intends to increase risk spreading in insurance operations by accepting insurance policies from abroad, albeit in limited quantity. As part of this move the company intends to receive a security rating from credit rating company Standard & Poor‘s. That process stopped when conditions changed on the financial markets, which created uncertainty regarding the financial position of the Icelandic State. There is now a wait until conditions change so that it will be possible to conclude the evaluation process.
Solvency ratio
Solvency and Minimum solvency
2006 2007 2008 2009 2010 0
2
4
6
8
10
12
14 +,#)-./)0")12#))&&
2006 2007 2008 2009 2010 0 2 4 6 8
10 12 14 16 18 20
Gjaldþol og lágmarksgjaldþol
2006 2007 2008 2009 2010 0
2
4
6
8
10
12
14
16 Eigin iðgjöld og eigin tjón
2006 2007 2008 2009 2010 0
2
4
6
8
10
12
14
16 Eigin iðgjöld og eigin tjón
Solvency Minimum solvency bn

17 |
Financial Statem
ents
Financial Statements
| 18
Fina
ncia
l Sta
tem
ents Endorsement by the Board of Directors and CEO
The financial statements for the year ended 31 December 2010, have been prepared in accordance with International Financial Reporting Standards (IFRS) as adopted by the EU.
Profit for the year, according to the Income Statement, amounted to ISK 204 million. According to the Balance Sheet total assets amounted to ISK 35.100 million and total equity amounted to ISK 11.146 million at the end of the year.
At year end the number of shareholders were 2. At the beginning of the year there were also 2 shareholders. At year end one shareholder holds more than 10% of the shares, Exista ehf. with 99,99% of the shares.
The objective of risk management is to ensure the safety of the company‘s assets. The company has approved an invest-ment strategy with an objective to ensure rate of return and safety of assets. The Board of Directors approves the invest-ment strategy on a regular basis.
The Board of Directors recommend that no dividend will be paid to shareholders in the year 2011, but otherwise refers to the financial statements regarding changes in the Company’s equity and disposal of profits.
The Board of Directors and the CEO of Vátryggingafélag Íslands hf. are of the opinion that the financial statements for the year 2010 contain all the information necessary to form a clear picture of the Company’s standing at year end, the years’s operating results and the years’s financial development.
The Board of Directors and the CEO of Vátryggingafélag Íslands hf. hereby confirm the financial statements for the year 2010 with their signature.
Reykjavík, March 1st, 2011
Board of Directors
CEO
Axel Gíslasonchairman
Guðmundur Pálsson
Hilmar Pétur Valgarðsson
Guðmundur Örn Gunnarsson
Guðrún Þorgeirsdóttir
Helga Jónsdóttir

19 |
Financial Statem
ents
Independent Auditor´s Report
To the Board of Directors and shareholders of Vátryggingafélag Íslands hf.
We have audited the accompanying financial statements of Vátryggingafélag Íslands hf., which comprise the balance sheet as at December 31, 2010, the income statement and cash flow statement for the year then ended, and a summary of sig-nificant accounting policies and other explanatory notes.
Management’s Responsibility for the financial statements
Management is responsible for the preparation and fair presentation of these financial statements in accordance with generally accepted accounting principles in Iceland. This responsibility includes: designing, implementing and maintaining internal control relevant to the preparation and fair presentation of financial statements that are free from material misstatement, whether due to fraud or error; selecting and applying appropriate accounting policies; and making accounting estimates that are reasonable in the circumstances.
Auditor’s Responsibility
Our responsibility is to express an opinion on these financial statements based on our audit. We conducted our audit in accord-ance with International Standards on Auditing. Those standards require that we comply with ethical requirements and plan and perform the audit to obtain reasonable assurance whether the financial statements are free from material misstatement.
An audit involves performing procedures to obtain audit evidence about the amounts and disclosures in the financial statements. The procedures selected depend on the auditor’s judgment, including the assessment of the risks of material misstatement of the financial statements, whether due to fraud or error. In making those risk assessments, the auditor considers internal control relevant to the entity’s preparation and fair presentation of the financial statements in order to design audit procedures that are appropriate in the circumstances, but not for the purpose of expressing an opinion on the effectiveness of the entity’s internal control. An audit also includes evaluating the appropriateness of accounting policies used and the reasonableness of accounting estimates made by management, as well as evaluating the overall presentation of the financial statements.
We believe that the audit evidence we have obtained is sufficient and appropriate to provide a basis for our audit opinion.
Opinion
In our opinion, the financial statements give a true and fair view of the financial position of Vátryggingafélag Íslands hf. as of December 31, 2010, and of its financial performance and its cash flows for the year then ended in accordance with generally accepted accounting principles in Iceland applied on a consistent basis.
Kópavogur, March 1st, 2011Deloitte hf.
Hilmar A. AlfreðssonState Authorized Public Accountant

| 20 Amounts in thousands ISK
Fina
ncia
l Sta
tem
ents Income Statement for the year 2010
Notes 2010 2009Income from insurance operationPremiums earned ………………………………………………………… 14.872.999 14.265.293
Premiums earned, reinsurers´share …………………………………… (667.259) (614.414)
Premiums earned, net of reinsurance ………………………………… 6 14.205.740 13.650.879
Other income from insurance operations …………………………… 97.999 91.203
Investment income from insurance operations ……………………… 1.135.063 1.535.838
Income from insurance operations total ……………………………… 15.438.802 15.277.920
Expenses from insurance operation:Claims incurred …………………………………………………………… (11.977.003) (12.274.148)
Claims incurred, reinsurers´share …………………………………… 242.229 336.597
Claims incurred, net of reinsurance …………………………………… 7 (11.734.774) (11.937.551)
Operating expenses ……………………………………………………… (2.912.129) (2.637.390)
Written off claims from insurance operations ……………………… (218.316) (115.385)
Commission and net gains from reinsurers …………………………… 26.628 16.712
Expense from insurance operations total …………………………… (14.838.591) (14.673.614)
Profit from insurance operations ……………………………………… 600.211 604.307
Income and expenses from investments:Investment income ……………………………………………………… 9 2.365.196 3.284.493
Net gain on investments at fair value ………………………………… (770.761) 114.119
Operating expenses ……………………………………………………… (323.763) (238.373)
Allowances for doubtful financial assets ……………………………… (420.865) (950.009)
Investment expenses …………………………………………………… 10 (2.770) (6.174)
Investment income total ………………………………………………… 847.037 2.204.056
Transferred investment income to insurance operations ………… (1.135.063) (1.535.838)
(Loss) Profit from investment operations ……………………………… (288.026) 668.218
Profit before taxes ………………………………………………………… 312.184 1.272.525
Income tax expense ……………………………………………………… 11 (108.044) (108.430)
Total Profit ………………………………………………………………… 204.140 1.164.095
Earnings per share ……………………………………………………… 12 0,08 0,45

21 |Amounts in thousands ISK
Financial Statem
ents
Balance Sheet at 31 December 2010
Notes 31.12.2010 31.12.2009AssetsProperty, plant and equipment ………………………………………… 13 460.150 503.174
Financial assets measured at fair value ……………………………… 14 23.214.246 18.702.819
Secured loans and other loans ………………………………………… 14 2.257.000 2.165.897
Deferred tax asset ………………………………………………………… 11 397.600 382.507
Accounts receivables …………………………………………………… 15 4.068.513 4.198.700
Reinsurance assets ……………………………………………………… 16 634.936 602.200
Other receivables ………………………………………………………… 17 1.221.400 960.643
Cash and cash equivalents ……………………………………………… 18 2.845.881 6.160.941
Total assets ………………………………………………………………… 35.099.726 33.676.880
EquityShare capital ……………………………………………………………… 19 2.602.481 2.602.481
Capital reserves …………………………………………………………… 456.130 445.923
Retained earnings ………………………………………………………… 8.087.603 7.893.670
Total equity ………………………………………………………………… 11.146.214 10.942.074
LiabilitiesTechnical provision ……………………………………………………… 21 22.615.078 21.695.896
Accounts payable ………………………………………………………… 22 941.550 631.751
Other liabilites …………………………………………………………… 22 396.884 407.160
Total liabilities ……………………………………………………………… 23.953.512 22.734.806
Total equity and liabilities ………………………………………………… 35.099.726 33.676.880
| 22 Amounts in thousands ISK
Fina
ncia
l Sta
tem
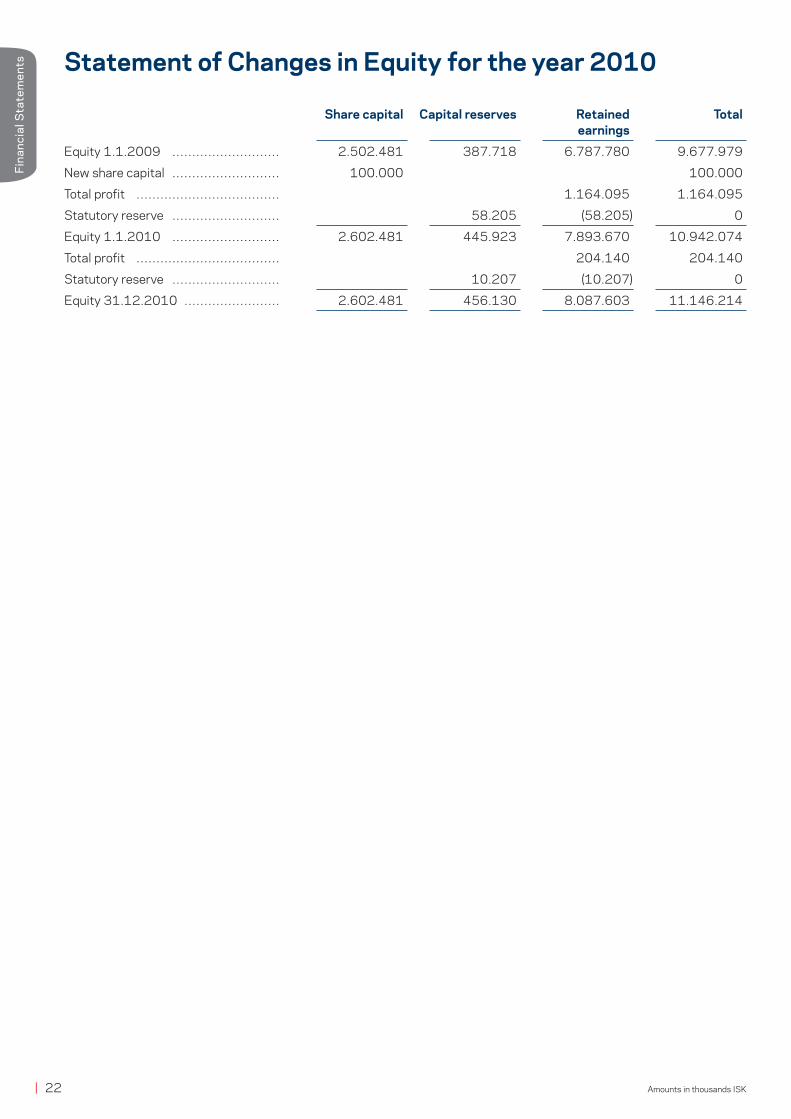
ents Statement of Changes in Equity for the year 2010
Share capital Capital reserves Retained Total earnings
Equity 1.1.2009 ……………………… 2.502.481 387.718 6.787.780 9.677.979
New share capital ……………………… 100.000 100.000
Total profit ……………………………… 1.164.095 1.164.095
Statutory reserve ……………………… 58.205 (58.205) 0
Equity 1.1.2010 ……………………… 2.602.481 445.923 7.893.670 10.942.074
Total profit ……………………………… 204.140 204.140
Statutory reserve ……………………… 10.207 (10.207) 0
Equity 31.12.2010 …………………… 2.602.481 456.130 8.087.603 11.146.214

23 |Amounts in thousands ISK
Financial Statem
ents
Statement of Cash Flow for the year 2010
Notes 2010 2009
Operating activitiesProfit for the year ………………………………………………………… 204.140 1.164.095
Investment income and expenses ……………………………………… (1.591.665) (2.487.047)
Depreciation and impairment of assets ……………………………… 69.000 69.615
Loss on sale of property and equipment ……………………………… 0 2.087
Technical provision net of reinsurance, changes …………………… 864.329 1.087.499
Obligation, changes ……………………………………………………… (15.093) (159.783)
Operating cash flow before movem. in working capital …………… (469.288) (323.534)
Other operating assets (increase) decrease ………………………… (74.933) (906.966)
Operating liabilites increase (decrease) ……………………………… 299.524 (274.103)
Cash generated (to) operations ………………………………………… (244.697) (1.504.603)
Dividend and interest revenue ………………………………………… 1.148.174 1.085.643
Paid interest ……………………………………………………………… (2.770) (6.174)
Net cash from (to) operating activities ………………………………… 900.707 (425.133)
Investing ActivitiesProperty and equipment ………………………………………………… (25.977) (213.690)
Investment in financial assets ………………………………………… (1.325.824) (1.092.799)
Investment in other securities ………………………………………… (2.677.838) (1.266.933)
(4.029.639) (2.573.422)
Financial acitiviesProceeds from issues of equity shares ……………………………… 0 100.000
0 100.000
(Decrease) increase in cash and cash equivalents ………………… (3.128.932) (2.898.555)
Cash and cash equivalents at beginning of the year ………………… 6.160.941 8.898.024
Effect of foreign exchange rates ……………………………………… (186.129) 161.473
Cash and cash equivalents at year-end ……………………………… 2.845.881 6.160.941
Other informationWorking capital from operation ………………………………………… 676.116 755.936

| 24 Amounts in thousands ISK
Not
es
Notes
1. General information
Vátryggingafélag Íslands hf. (the Company) is a limited company and operates subject to law no. 56/2010 concerning insurance operations and law no. 2/1995 concerning limited companies.
The company operates in the field of insurance and finance.
2. Adoption of new and revised Standards
2.1 New Standards and InterpretationsThe following new and revised Standards (IFRS/IAS) and Interpretations (IFRIC) adopted in the current period:
IFRS 5 (as revised in 2009) - Non-current Assets Held for sale and Discontinued Operations.IAS 1 (as revised in 2009) - Presentation of Financial Statements.IAS 1 (as revised in 2010) - Presentation of Financial Statements.IAS 7 (as revised in 2009) - Statement of Cash Flows.IAS 27 (as revised in 2008) - Consolidated and Separate Financial Statements.IAS 28 (as revised in 2008) - Investments in Associates.IFRS 3 (as revised in 2008) - Business Combinations.
The above Standards and Interpretations have not lead to changes of the financial statements.
2.2 Standards and Interpretations not yet effectiveBy confirmation of the Financial Statements following new and revised standars and interpretations have been issued but not yet adopted:
IFRS 1 - Adoption of International Financial Reporting Standards (effective for accounting periods beginning on or after July 1, 2010);IAS 24 - Related Party Disclosures (revised 2009, effective for accounting periods beginning on or after January 1, 2011);IAS 32 - Financial Instruments: Disclosures (effective for accounting periods beginning on or after February 1, 2010);IFRIC 14 - The Limit on a Defined Benefit Asset, Minimum Funding Requirements and their Interaction (effective for accounting periods beginning on or after February 1, 2010);IFRIC 19 - Extinguishing Financial Liabilities with Equity Instruments (effective for accounting periods beginning on or after July 1, 2010);
It is the management´s assessment that in general, the adoption of those new and revised standards and interpretations will have no material impact on the financial statements.
3. Significant accounting policies
3.1 Statement of complianceThe financial statements have been prepared in accordance with International Financial Standards (IFRS - International Financial Reporting Standars) as adopted by the EU.
3.2 Basis of preparationThe financial statements have been prepared on the historical cost basis except for the revaluation of certain non-current assets and financial instruments. Historical cost is generally based on the fair value of the consideration given in exchange for assets. The financial statements are presented in Icelandic Krona (ISK), rounded to nearest thousand.
The principal accounting policies are set out below.
3.3 Income from insurance operationsPremiumsPremiums entered as income comprise the premiums contracted during the fiscal year including premiums transferred from last year but excluding next year’s premiums, which are entered as unearned premiums. Unearned premiums in the Balance Sheet forms the part of premiums due to insurance risk during the period which belongs to unexpired insurance policies at year end.

25 |Amounts in thousands ISK
Notes
Dividend and interest revenueDividend revenue from investments is recognised when the shareholder’s right to receive payment has been established (provided that it is probable that the economic benefits will flow to the Company and the amount of revenue can be measured reliably).
Interest revenue is recognised when it is probable that the economic benefits will flow to the Company and the amount of revenue can be measured reliably. Interest revenue is accrued on a time basis, by reference to the principal outstanding and at the effective interest rate applicable, which is the rate that exactly discounts estimated future cash receipts through the expected life of the financial assets to that asset´s net carrying amount on initial recognition.
3.4 Expenses from insurance operationsClaims stated in the Income Statement are the claims incurred in the year including increases or decreases due to develop-ment of claims from previous fiscal years. Claims reserved in the Balance Sheet are the total amount of reported outstanding claims as well as provision for claims incurred but not reported.
3.5 Insurance contractsThe Company issues contracts that transfer both financial and insurance risk from the customer to the Company.
Insurance contracts - definitionInsurance contracts are contracts under wich the insurer accepts significant insurance risk from policyholders by agreeing to compensate the policyholders if a specified uncertain future event would occur.
The insured event is uncertain, it is not known if it occures or when and in general the financial concequences are not known in advance.
Non-life insurance - classificationNon-life insurance contracts are classified as general third party liability contracts, personal accidents contracts, property insurance contracts and marine insurance contracts.
Third party liability contracts protect the costumer for the risk of causing harm to third parties as a result of their legitimate activities.
Personal accident insurance contracts compensates the insured own bodily injuries in terms of the insurance contracts.
Property insurance contracts mainly compensate the Company’s customers for damage suffered to their properties or for the value of property lost. Customers in business could also receive compensation for the loss of earnings caused by the inability to use the insured properties in their business.
Technical provisionsThe company assesses, at the end of the fiscal year, whether the recorded insurance liability can carry out the Company’s estimated obligations by assessing future cash flows of the insurance liability. All changes in the insurance liability are recognized in the Income Statement. In performing these assessments statistical methods are used to estimate future cash flows related to the claims.
Reinsurance contractsReinsurance contracts are made in order to reduce the Company’s risks. Reinsurance contracts can be either proportional or carry the entire risk in the case of a damage exceeding a fixed damage cost.
Claims on reinsurers due to premiums and claims are recognized as reinsurance assets. The claims concern the reinsurers share in losses according to reinsured insurance contracts and share in unearned premiums. Obligations due to reinsurance are the reinsurers´ share in premiums for reinsurance contracts which are recognized in the Income Statement at the time of the renewal of the reinsurance contracts.
3.6 Foreign currenciesThe individual financial statements of the Company are presented in ISK, the currency of the primary economic environment in which the entity operates (its functional currency).
Exchange differences are recognised in profit or loss in the period in which they arise except for:
- exchange differences on foreign currency borrowings relating to assets under construction for future productive use, which are included in the cost of those assets when they are regarded as an adjustment to interest costs on those foreign currency borrowings;- exchange differences on transactions entered into in order to hedge certain foreign currency risks and- exchange differences on monetary items receivable from or payable to a foreign operation for which settlement is neither planned nor likely to occur.

| 26 Amounts in thousands ISK
Not
es
3.7 Borrowing costsBorrowing costs directly attributable to the acquisition, construction or production of qualifying assets, which are assets that necessarily take a substantial period of time to get ready for their intended use or sale, are added to the cost of those assets, until such time as the assets are substantially ready for their intended use or sale.
Investment income earned on the temporary investment of specific borrowings pending their expenditure on qualifying assets is deducted from the borrowing costs eligible for capitalisation.
All other borrowing costs are recognised in profit or loss in the period in which they are incurred.
3.8 TaxationIncome tax expense represents the sum of the tax currently payable and deferred tax.
Current tax The tax currently payable is based on taxable profit for the year. Taxable profit differs from profit as reported in the income statement because of items of income or expense that are taxable or deductible in other years and items that are never taxable or deductible. The Company´s liability for current tax is calculated using tax rates that have been enacted or sub-stantively enacted by the end of the reporting period.
Deferred taxDeferred tax is recognised on temporary differences between the carrying amounts of assets and liabilities in the financial statements and the corresponding tax bases used in the computation of taxable profit. Deferred tax liabilities are generally recognised for all taxable temporary differences. Deferred tax assets are generally recognised for all deductible temporary differences to the extent that it is probable that taxable profits will be available against which those deductible temporary differences can be utilised. Such deferred tax assets and liabilities are not recognised if the temporary difference arises from goodwill or from the initial recognition (other than in a business combination) of other assets and liabilities in a trans-action that affects neither the taxable profit nor the accounting profit.
The carrying amount of deferred tax assets is reviewed at the end of each reporting period and reduced to the extent that it is no longer probable that sufficient taxable profits will be available to allow all or part of the asset to be recovered.
Deferred tax assets and liabilities are offset when there is a legally enforceable right to set off current tax assets against current tax liabilities and when they relate to income taxes levied by the same taxation authority.
Deferred tax is recognized in the income statement except when it relates to items of equity, but he is also dealt with in equity.
3.9 Property, plant and equipmentAssets are recorded as fixed assets when it is probable that future economic benefits associated with the asset will flow to the Company and the cost of the asset can be measured in a reliable manner. Fixed assets are either presented under the cost method or the revaluaton model. Cost basis of fixed assets are stated at cost less accumulated depreciation and impairment losses. Cost of fixed assets comprises its purchase price and any directly attributable costs of bringing an asset into qualified income situation. According to the revaluatoin model fixed assets are stated at fair value at the date of revaluation, less any accumulated depreciation and subsequent accumulated impairment losses.
Land and buildings are stated at their revalued amounts and the re-evaluated amount is moved to a separate revaluation reserve account. The revaluation is the fair value at the date of revaluation, less any subsequent accumulated depreciation and sub-sequent accumulated impairment losses. Revaluations are performed with sufficient regularity such that the carrying amounts do not differ materially from those that would be determined using fair values at the end of the reporting period. Revaluation decrease is entered against the revaluation increase. If the decrease in fair value in excess of previously revaluation increase is charged to the income statement. Depreciation of revalued land and buildings are expensed in the income statement.
Fixtures and equipment are stated at cost less accumulated depreciation and accumulated impairment losses.
Depreciation is recognised so as to write off the cost or valuation of assets (other than freehold land and properties under construction) less their residual values over their useful lives, using the straight-line method. The estimated useful lives, residual values and deprecia-tion method are reviewed at each year end, with the effect of any changes in estimate accounted for on a prospective basis.
Assets held under finance leases are depreciated over their expected useful lives on the same basis as owned assets or, where shorter, the term of the relevant lease.
The gain or loss arising on the disposal or retirement of an item of property, plant and equipment is determined as the differ-ence between the sales proceeds and the carrying amount of the asset and is recognised in profit or loss. At sale of revalued fixed assets the revaluation is moved to retained earnings.
27 |Amounts in thousands ISK
Notes
3.10 Impairment of tangible and intangible assets excluding goodwillAt the end of each reporting period, the Company reviews the carrying amounts of its tangible and intangible assets to determine whether there is any indication that those assets have suffered an impairment loss. If any such indication exists, the recoverable amount of the asset is estimated in order to determine the extent of the impairment loss (if any). Where it is not possible to estimate the recoverable amount of an individual asset, the Company estimates the recoverable amount of the cash-generating unit to which the asset belongs. Recoverable amount is the higher of fair value less costs to sell and value in use. In assessing value in use, the estimated future cash flows are discounted to their present value using a pre-tax discount rate that reflects current market assessments of the time value of money and the risks specific to the asset for which the estimates of future cash flows have not been adjusted.
Intangible assets with indefinite useful lives and intangible assets not yet available for use are tested for impairment at least annually, and whenever there is an indication that the asset may be impaired.
If the recoverable amount of an asset is estimated to be less than its carrying amount, the carrying amount of the asset is reduced to its recoverable amount. An impairment loss is recognised immediately in profit or loss, unless the relevant asset is carried at a revalued amount, in which case the impairment loss is treated as a revaluation decrease.
Where an impairment loss subsequently reverses, the carrying amount of the asset (or cash-generating unit) is increased to the revised estimate of its recoverable amount. A reversal of an impairment loss is recognised immediately in profit or loss, unless the relevant asset is carried at a revalued amount, in which case the reversal of the impairment loss is treated as a revaluation increase.
3.11 ProvisionsProvisions are recognised when the Company has a present obligation as a result of a past event, it is probable that the Company will be required to settle the obligation, and a reliable estimate can be made of the amount of the obligation.
The amount recognised as a provision is the best estimate of the consideration required to settle the present obligation at the end of the reporting period. Where a provision is measured using the cash flows estimated to settle the present obliga-tion, its carrying amount is the present value of those cash flows.
When some or all of the economic benefits required to settle a provision are expected to be recovered from a third party, a receivable is recognised as an asset if it is virtually certain that reimbursement will be received and the amount of the receivable can be measured reliably.
Onerous contractsAn onerous contract is considered to exist where the Company has a contract under which the unavoidable costs of meeting the obligations under the contract exceed the economic benefits expected to be received under it.
RestructuringsA restructuring provision is recognised when the Company has developed a detailed formal plan for the restructuring and has raised a valid expectation in those affected that it will carry out the restructuring. The measurement of a restructuring provision includes only the direct expenditures arising from the restructuring.
CommitmentsProvisions for the expected cost of warranty obligations under local sale of goods legislation are recognised at the date of sale of the relevant products, at the directors’ best estimate of the expenditure required to settle the Company’s obligation.
- The amount of the underlying debt to be valued in accordance with IAS 37 - Provisions, Contingent Liabilities and Contin-gent Assets.- The amount of initial contract, less accumulated depreciation in accordance with the standards of accounting for revenue.
3.12 Financial assetsFinancial assets are classified into the following specified categories: financial assets ‘at fair value through profit or loss’ (FVTPL), ‘held-to-maturity’ investments, ‘available-for-sale’ (AFS) financial assets and ‘loans and receivables’. The classifi-cation depends on the nature and purpose of the financial assets and is determined at the time of initial recognition.
Financial assets that are intended to hold to maturity and available-for-sale are measured at fair value plus transaction costs at the date when the Company has entered into an agreement for the delivery or receipt of financial assets within a specified time. Financial assets at fair value through profit or loss are initially recognized at fair value.
Effective interest methodThe effective interest method is a method of calculating the amortised cost of a debt instrument and of allocating interest income over the relevant period. The effective interest rate is the rate that exactly discounts estimated future cash receipts (including all fees on points paid or received that form an integral part of the effective interest rate, transaction costs and

| 28 Amounts in thousands ISK
Not
es
other premiums or discounts) through the expected life of the debt instrument, or ( where appropriate) a shorter period, to the net carrying amount on initial recognition.
Income is recognised on an effective interest basis for debt instruments other than those financial assets classified as at FVTPL.
Financial assets at FVTPLFinancial assets are classified as at FVTPL when the purpose is to profit from short-term changes. The same applies with all other financial assets which the company defines FVTPL. Derivatives always fall under this category unless they are designated as hedges.
A financial asset is classified as held for trading if:- it has been acquired principally for the purpose of selling it in the near term; or- on initial recognition it is part of a portfolio of identified financial instruments that the Company manages together and has a recent actual pattern of short-term profit-taking; or - it is a derivative that is not designated and effective as a hedging instrument.
A financial asset other than a financial asset held for trading may be designated as at FVTPL upon initial recognition if:- such designation eliminates or significantly reduces a measurement or recognition inconsistency that would otherwise arise; or - the financial asset forms part of a company of financial assets or financial liabilities or both, which is managed and its per-formance is evaluated on a fair value basis, in accordance with the Company’s documented risk management or investment strategy, and information about the grouping is provided internally on that basis; or- it forms part of a contract containing one or more embedded derivatives, and IAS 39 Financial Instruments: Recognition and Measurement permits the entire combined contract (asset or liability) to be designated as at FVTPL.
Held-to-maturity investmentsBills of exchange and debentures with fixed or determinable payments and fixed maturity dates that the Company has the positive intent and ability to hold to maturity are classified as held-to-maturity investments. Held-to-maturity investments are measured at amortised cost using the effective interest method less any impairment, with revenue recognised on an effective yield basis.
AFS financial assetsListed shares and listed redeemable notes held by the Company that are traded in an active market are classified as AFS and are stated at fair value. The Company also has investments in unlisted shares that are not traded in an active market but that are also classified as AFS financial assets and stated at fair value. Gains and losses arising from changes in fair value are recognised in an equity account, the investments revaluation reserve, with the exception of impairment losses, interest calculated using the effective interest method, and foreign exchange gains and losses on monetary assets, which are recognised in profit or loss. Where the investment is disposed of or is determined to be impaired, the cumulative gain or loss previously accumulated in the investments revaluation reserve is reclassified to profit or loss.
Dividends on AFS equity instruments are recognised in profit or loss when the Company’s right to receive the dividends is established.
Loans and receivablesTrade receivables, loans, and other receivables that have fixed or determinable payments that are not quoted in an active market are classified as ‘loans and receivables’. Loans and receivables are measured at amortised cost using the effective interest method, less any impairment. Interest income is recognised by applying the effective interest rate, except for short-term receivables when the recognition of interest would be immaterial.
Impairment of financial assetsFinancial assets, other than those at FVTPL, are assessed for indicators of impairment at the end of each reporting period. Finan-cial assets are considered to be impaired when there is objective evidence that, as a result of one or more events that occurred after the initial recognition of the financial asset, the estimated future cash flows of the investment have been affected.
Portfolio assets are assessed for impairment if certain assets are not such that they are not assessed individually.
When an AFS financial asset is considered to be impaired, cumulative gains or losses previously recognised in an equity account are reclassified to profit or loss in the period.
In respect of AFS equity securities, impairment losses previously recognised in profit or loss are not reversed through profit or loss. Any increase in fair value subsequent to an impairment loss is recognised in an equity account.
Reclassification of financial assetsThe Company has authority to reclassify certain assets of the category FVTPL over the series AFS. Reclassification is only permitted in rare circumstances and where the asset is no longer held for the purpose of selling in the short-term.

29 |Amounts in thousands ISK
Notes
In all cases, reclassifications of financial assets are limited to debt instruments. Reclassifications are accounted for at the fair value of the financial asset at the date of reclassification.
Derecognition of financial assetsThe Company derecognises a financial asset only when the contractual rights to the cash flows from the asset expire, or when it transfers the financial asset and substantially all the risks and rewards of ownership of the asset to another entity.
3.13 Financial liabilities and equity instruments issued by the CompanyClassification as debt or equityDebt and equity instruments are classified as either financial liabilities or as equity in accordance with the substance of the contractual arrangement.
Equity instrumentsAn equity instrument is any contract that evidences a residual interest in the assets of an entity after deducting all of its liabilities. Equity instruments issued by the Company are recognised at the proceeds received, net of direct issue costs.
Compound instrumentsThe component parts of compound instruments (convertible bonds) issued by the Company are classified separately as financial liabilities and equity in accordance with the substance of the contractual arrangement. At the date of issue, the fair value of the liability component is estimated using the prevailing market interest rate for a similar non-convertible instru-ment. This amount is recorded as a liability on an amortised cost basis using the effective interest method until extinguished upon conversion or at the instrument’s maturity date. The equity component is determined by deducting the amount of the liability component from the fair value of the compound instrument as a whole. This is recognised and included in equity, net of income tax effects, and is not subsequently remeasured.
Financial guarantee contract liabilitiesFinancial guarantee contract liabilities are initially measured at their fair values and, if not designated as at FVTPL, are subsequently measured at the higher of:- the amount of the obligation under the contract, as determined in accordance with IAS 37 Provisions, Contingent Liabili-ties and Contingent Assets; and- the amount initially recognised less, where appropriate, cumulative amortisation recognised in accordance with the rev-enue recognition policies.
Financial liabilitiesFinancial liabilities are classified as either financial liabilities ‘at FVTPL’ or ‘other financial liabilities’.
Financial liabilities at FVTPLFinancial liabilities are classified as at FVTPL when the financial liability is either held for trading or it is designated as at FVTPL.
A financial liability is classified as held for trading if:- it has been acquired principally for the purpose of repurchasing it in the near term; or- on initial recognition it is part of a portfolio of identified financial instruments that the Company manages together and has a recent actual pattern of short-term profit-taking; or - it is a derivative that is not designated and effective as a hedging instrument.
A financial liability other than a financial liability held for trading may be designated as at FVTPL upon initial recognition if:- such designation eliminates or significantly reduces a measurement or recognition inconsistency that would otherwise arise; or - the financial liability forms part of a group of financial assets or financial liabilities or both, which is managed and its per-formance is evaluated on a fair value basis, in accordance with the Company’s documented risk management or investment strategy, and information about the grouping is provided internally on that basis; or- it forms part of a contract containing one or more embedded derivatives, and IAS 39 Financial Instruments: Recognition and Measurement permits the entire combined contract (asset or liability) to be designated as at FVTPL.
Other financial liabilitiesOther financial liabilities, including borrowings, are initially measured at fair value, net of transaction costs. Other financial liabilities are subsequently measured at amortised cost using the effective interest method, with interest expense recog-nised on an effective yield basis.
Derecognition of financial liabilitiesThe Company derecognises financial liabilities when, and only when, the Company’s obligations are discharged, cancelled or they expire.

| 30 Amounts in thousands ISK
Not
es
4. Critical accounting judgements and key sources of estimation uncertainty
In the application of the Company’s accounting policies, the directors are required to make judgements, estimates and assumptions about the carrying amounts of assets and liabilities that are not readily apparent from other sources. The esti-mates and associated assumptions are based on historical experience and other factors that are considered to be relevant. Actual results may differ from these estimates.
The estimates and underlying assumptions are reviewed on an ongoing basis. Revisions to accounting estimates are recog-nised in the period in which the estimate is revised if the revision affects only that period, or in the period of the revision and future periods if the revision affects both current and future periods.
The Board of Directors have made assumptions and evalutations on the following items that have significant effect on the financial statement.
- Financial assets and allowances for doubtful financial assets- Technical provision
5. Segment reporting
The following are the Company´s segments of operation: Insurance operation and Financial operation.
Results of operations of segments for 2010 is as following:
Insurance Investment operation operation TotalPremiums earned ………………………………………………… 14.872.999 14.872.999 Reinsurers´ share ………………………………………………… (667.259) (667.259)Other income ……………………………………………………… 97.999 97.999 Investment income ……………………………………………… 1.135.063 459.372 1.594.435 Total income ……………………………………………………… 15.438.802 459.372 15.898.174
Claims incurred …………………………………………………… (11.977.003) (11.977.003)Claims incurred, reinsurers´ share …………………………… 242.229 242.229 Operating expenses ……………………………………………… (2.885.501) (323.763) (3.209.264)Written off claims / financial assets …………………………… (218.316) (218.316)Investment expenses …………………………………………… (2.770) (2.770)Allowance for doubtful financial assets ……………………… (420.865) (420.865)Operating profit of Segment …………………………………… 600.211 (288.026) 312.184
Income tax …………………………………………………………………………………………………………… (108.044)Net earnings for the year …………………………………………………………………………………………… 204.140
Depreciation in the insurance segment amounted to 66.8 million during 2010. Depreciation in the financial segment amounted to 2.2 million. Investments in the insurance segment amounted to 29.8 million during 2010.
Assets and liabilities of Segments December 31, 2010 is as following:
Insurance Investment operation operation TotalAssetsLoans and other investments …………………………………… 23.157.352 135.408 23.292.760 Reinsurance assets ……………………………………………… 618.433 618.433 Other assets ……………………………………………………… 5.052.561 6.135.972 11.188.533 Segments´ assets ……………………………………………… 28.828.346 6.271.380 35.099.726
LiabilitiesTechnical provisons ……………………………………………… 22.615.078 22.615.078 Other liabilities …………………………………………………… 1.338.434 1.338.434 Segments´ liabilities …………………………………………… 23.953.512 0 23.953.512
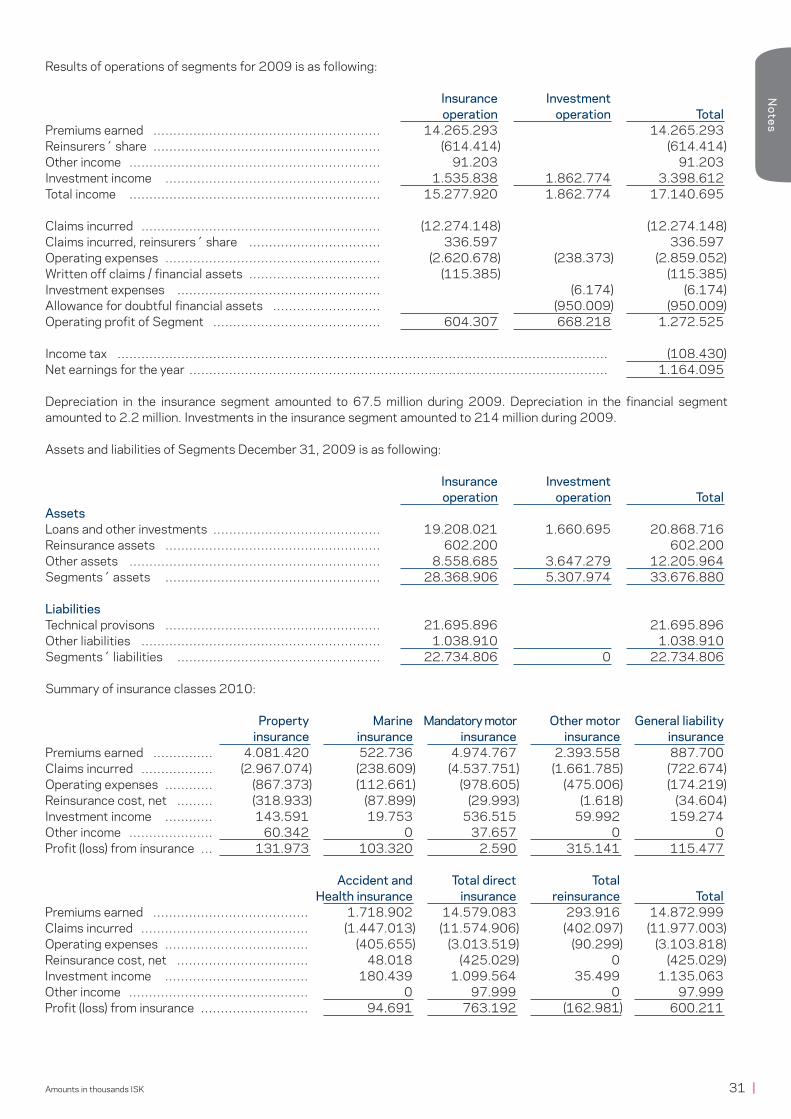
31 |Amounts in thousands ISK
Notes
Results of operations of segments for 2009 is as following:
Insurance Investment operation operation TotalPremiums earned ………………………………………………… 14.265.293 14.265.293 Reinsurers´ share ………………………………………………… (614.414) (614.414)Other income ……………………………………………………… 91.203 91.203 Investment income ……………………………………………… 1.535.838 1.862.774 3.398.612 Total income ……………………………………………………… 15.277.920 1.862.774 17.140.695
Claims incurred …………………………………………………… (12.274.148) (12.274.148)Claims incurred, reinsurers´ share …………………………… 336.597 336.597 Operating expenses ……………………………………………… (2.620.678) (238.373) (2.859.052)Written off claims / financial assets …………………………… (115.385) (115.385)Investment expenses …………………………………………… (6.174) (6.174)Allowance for doubtful financial assets ……………………… (950.009) (950.009)Operating profit of Segment …………………………………… 604.307 668.218 1.272.525
Income tax …………………………………………………………………………………………………………… (108.430)Net earnings for the year …………………………………………………………………………………………… 1.164.095
Depreciation in the insurance segment amounted to 67.5 million during 2009. Depreciation in the financial segment amounted to 2.2 million. Investments in the insurance segment amounted to 214 million during 2009.
Assets and liabilities of Segments December 31, 2009 is as following:
Insurance Investment operation operation TotalAssetsLoans and other investments …………………………………… 19.208.021 1.660.695 20.868.716 Reinsurance assets ……………………………………………… 602.200 602.200 Other assets ……………………………………………………… 8.558.685 3.647.279 12.205.964 Segments´ assets ……………………………………………… 28.368.906 5.307.974 33.676.880
LiabilitiesTechnical provisons ……………………………………………… 21.695.896 21.695.896 Other liabilities …………………………………………………… 1.038.910 1.038.910 Segments´ liabilities …………………………………………… 22.734.806 0 22.734.806
Summary of insurance classes 2010:
Property Marine Mandatory motor Other motor General liability insurance insurance insurance insurance insurancePremiums earned …………… 4.081.420 522.736 4.974.767 2.393.558 887.700 Claims incurred ……………… (2.967.074) (238.609) (4.537.751) (1.661.785) (722.674)Operating expenses ………… (867.373) (112.661) (978.605) (475.006) (174.219)Reinsurance cost, net ……… (318.933) (87.899) (29.993) (1.618) (34.604)Investment income ………… 143.591 19.753 536.515 59.992 159.274 Other income ………………… 60.342 0 37.657 0 0 Profit (loss) from insurance … 131.973 103.320 2.590 315.141 115.477
Accident and Total direct Total Health insurance insurance reinsurance TotalPremiums earned ………………………………… 1.718.902 14.579.083 293.916 14.872.999 Claims incurred …………………………………… (1.447.013) (11.574.906) (402.097) (11.977.003)Operating expenses ……………………………… (405.655) (3.013.519) (90.299) (3.103.818)Reinsurance cost, net …………………………… 48.018 (425.029) 0 (425.029)Investment income ……………………………… 180.439 1.099.564 35.499 1.135.063 Other income ……………………………………… 0 97.999 0 97.999 Profit (loss) from insurance ……………………… 94.691 763.192 (162.981) 600.211

| 32 Amounts in thousands ISK
Not
es
Summary of insurance classes 2009:
Property Marine Mandatory motor Other motor General liability insurance insurance insurance insurance insurancePremiums earned …………… 3.674.562 516.584 4.923.977 2.230.074 822.847 Claims incurred ……………… (2.941.864) (556.229) (3.611.795) (1.770.168) (1.080.915)Operating expenses ………… (712.773) (115.095) (895.900) (412.220) (151.181)Reinsurance cost, net ……… (379.875) (90.233) 63.462 (1.428) 150.315 Investment income ………… 169.087 25.213 802.408 76.995 188.297 Other income ………………… 53.155 0 38.048 0 0 Profit (loss) from insurance … (137.708) (219.760) 1.320.200 123.253 (70.637)
Accident and Total direct Total Health insurance insurance reinsurance TotalPremiums earned ………………………………… 1.482.300 13.650.344 614.950 14.265.294 Claims incurred …………………………………… (1.647.204) (11.608.175) (665.972) (12.274.147)Operating expenses ……………………………… (370.126) (2.657.295) (95.482) (2.752.777)Reinsurance cost, net …………………………… (1.797) (259.556) (1.548) (261.104)Investment income ……………………………… 229.366 1.491.366 44.472 1.535.838 Other income ……………………………………… 0 91.203 0 91.203Profit (loss) from insurance ……………………… (307.461) 707.887 (103.580) 604.307
6. Premiums earned
2010 2009Premiums written ………………………………………………………………………… 14.962.348 14.497.708 Premius witten, reinsurers’ share ……………………………………………………… (603.374) (619.151)Change in unearned premiums ………………………………………………………… (89.349) (232.415)Change in unearned premiums, reinsurers’ share …………………………………… (63.885) 4.737 14.205.740 13.650.879
7. Claims incurred
2010 2009Claims paid ………………………………………………………………………………… (11.147.170) (11.530.426)Claims paid, reinsurers’ share …………………………………………………………… 123.491 452.697 Change in claims provision ……………………………………………………………… (829.833) (743.721)Change in claims provision, reinsures’ share ………………………………………… 118.738 (116.100) (11.734.774) (11.937.551)
8. Salaries and related expenses
2010 2009Salaries …………………………………………………………………………………… 1.282.481 1.161.334Salaries related expenses ……………………………………………………………… 264.536 207.138 1.547.017 1.368.472
Average number of full time equivalent employees ………………………………… 220 218
2010 2009Salaries and benefits to the CEO and Board of Directors. Guðmundur Örn Gunnarsson …………………………………………………………… 19.874 19.789Board of Directors ………………………………………………………………………… 6.320 2.100
Total salaries and commission to executives in the year 2010 is ISK 108.2 million.
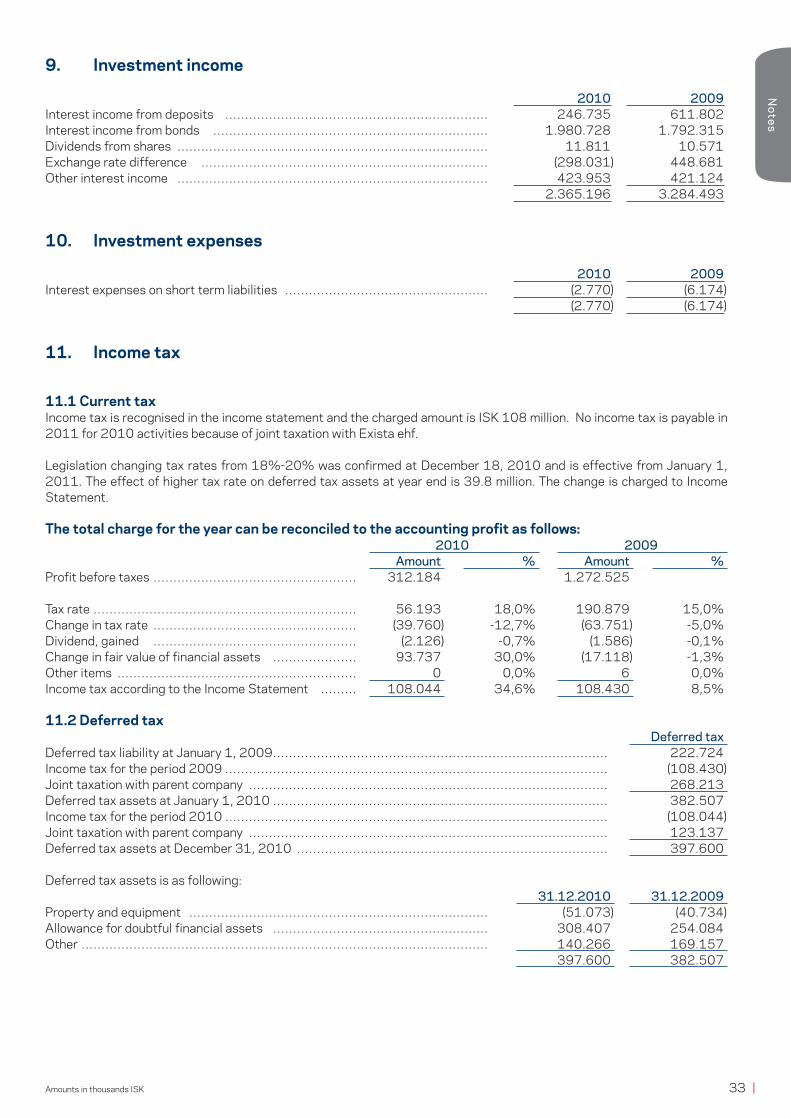
33 |Amounts in thousands ISK
Notes
9. Investment income
2010 2009Interest income from deposits ………………………………………………………… 246.735 611.802 Interest income from bonds …………………………………………………………… 1.980.728 1.792.315 Dividends from shares …………………………………………………………………… 11.811 10.571 Exchange rate difference ……………………………………………………………… (298.031) 448.681 Other interest income …………………………………………………………………… 423.953 421.124 2.365.196 3.284.493
10. Investment expenses
2010 2009Interest expenses on short term liabilities …………………………………………… (2.770) (6.174) (2.770) (6.174)
11. Income tax
11.1 Current taxIncome tax is recognised in the income statement and the charged amount is ISK 108 million. No income tax is payable in 2011 for 2010 activities because of joint taxation with Exista ehf.
Legislation changing tax rates from 18%-20% was confirmed at December 18, 2010 and is effective from January 1, 2011. The effect of higher tax rate on deferred tax assets at year end is 39.8 million. The change is charged to Income Statement.
The total charge for the year can be reconciled to the accounting profit as follows: 2010 2009 Amount % Amount %Profit before taxes …………………………………………… 312.184 1.272.525
Tax rate ………………………………………………………… 56.193 18,0% 190.879 15,0%Change in tax rate …………………………………………… (39.760) -12,7% (63.751) -5,0%Dividend, gained …………………………………………… (2.126) -0,7% (1.586) -0,1%Change in fair value of financial assets ………………… 93.737 30,0% (17.118) -1,3%Other items …………………………………………………… 0 0,0% 6 0,0%Income tax according to the Income Statement ……… 108.044 34,6% 108.430 8,5%
11.2 Deferred tax Deferred taxDeferred tax liability at January 1, 2009 ………………………………………………………………………… 222.724 Income tax for the period 2009 …………………………………………………………………………………… (108.430)Joint taxation with parent company ……………………………………………………………………………… 268.213 Deferred tax assets at January 1, 2010 ………………………………………………………………………… 382.507 Income tax for the period 2010 …………………………………………………………………………………… (108.044)Joint taxation with parent company ……………………………………………………………………………… 123.137 Deferred tax assets at December 31, 2010 …………………………………………………………………… 397.600
Deferred tax assets is as following: 31.12.2010 31.12.2009Property and equipment ………………………………………………………………… (51.073) (40.734)Allowance for doubtful financial assets ……………………………………………… 308.407 254.084 Other ………………………………………………………………………………………… 140.266 169.157 397.600 382.507
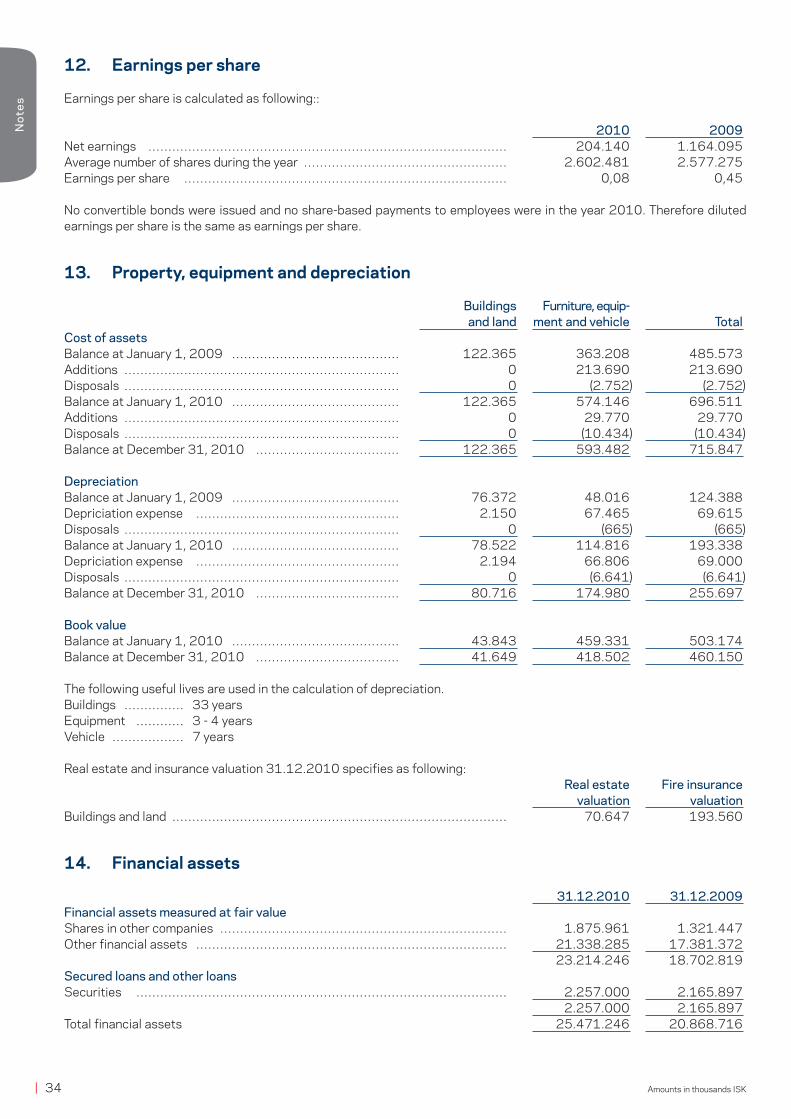
| 34 Amounts in thousands ISK
Not
es
12. Earnings per share
Earnings per share is calculated as following::
2010 2009Net earnings ……………………………………………………………………………… 204.140 1.164.095 Average number of shares during the year …………………………………………… 2.602.481 2.577.275 Earnings per share ……………………………………………………………………… 0,08 0,45
No convertible bonds were issued and no share-based payments to employees were in the year 2010. Therefore diluted earnings per share is the same as earnings per share.
13. Property, equipment and depreciation
Buildings Furniture, equip- and land ment and vehicle TotalCost of assetsBalance at January 1, 2009 …………………………………… 122.365 363.208 485.573 Additions …………………………………………………………… 0 213.690 213.690 Disposals …………………………………………………………… 0 (2.752) (2.752)Balance at January 1, 2010 …………………………………… 122.365 574.146 696.511 Additions …………………………………………………………… 0 29.770 29.770 Disposals …………………………………………………………… 0 (10.434) (10.434)Balance at December 31, 2010 ……………………………… 122.365 593.482 715.847
DepreciationBalance at January 1, 2009 …………………………………… 76.372 48.016 124.388 Depriciation expense …………………………………………… 2.150 67.465 69.615 Disposals …………………………………………………………… 0 (665) (665)Balance at January 1, 2010 …………………………………… 78.522 114.816 193.338 Depriciation expense …………………………………………… 2.194 66.806 69.000 Disposals …………………………………………………………… 0 (6.641) (6.641)Balance at December 31, 2010 ……………………………… 80.716 174.980 255.697
Book valueBalance at January 1, 2010 …………………………………… 43.843 459.331 503.174 Balance at December 31, 2010 ……………………………… 41.649 418.502 460.150
The following useful lives are used in the calculation of depreciation.Buildings …………… 33 yearsEquipment ………… 3 - 4 yearsVehicle ……………… 7 years
Real estate and insurance valuation 31.12.2010 specifies as following: Real estate Fire insurance valuation valuationBuildings and land ………………………………………………………………………… 70.647 193.560
14. Financial assets
31.12.2010 31.12.2009Financial assets measured at fair valueShares in other companies ……………………………………………………………… 1.875.961 1.321.447 Other financial assets …………………………………………………………………… 21.338.285 17.381.372 23.214.246 18.702.819 Secured loans and other loansSecurities ………………………………………………………………………………… 2.257.000 2.165.897 2.257.000 2.165.897 Total financial assets 25.471.246 20.868.716
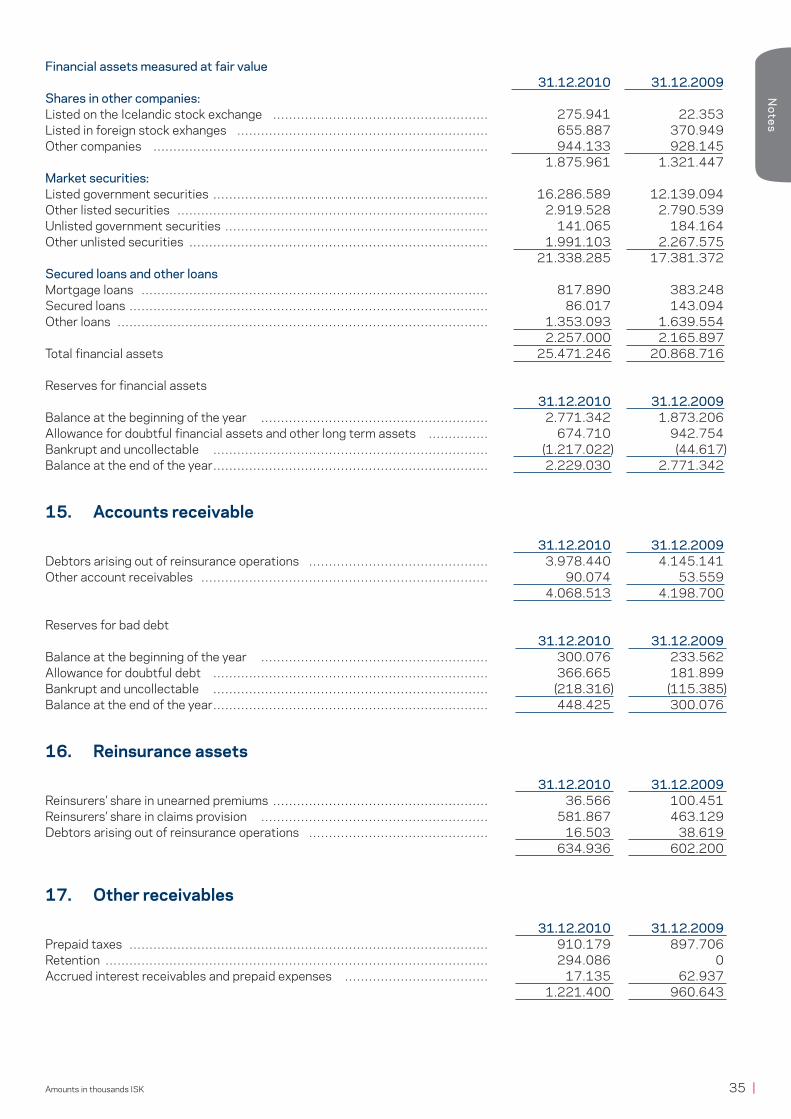
35 |Amounts in thousands ISK
Notes
Financial assets measured at fair value 31.12.2010 31.12.2009Shares in other companies:Listed on the Icelandic stock exchange ……………………………………………… 275.941 22.353 Listed in foreign stock exhanges ……………………………………………………… 655.887 370.949 Other companies ………………………………………………………………………… 944.133 928.145 1.875.961 1.321.447 Market securities:Listed government securities …………………………………………………………… 16.286.589 12.139.094 Other listed securities …………………………………………………………………… 2.919.528 2.790.539 Unlisted government securities ………………………………………………………… 141.065 184.164 Other unlisted securities ………………………………………………………………… 1.991.103 2.267.575 21.338.285 17.381.372 Secured loans and other loansMortgage loans …………………………………………………………………………… 817.890 383.248 Secured loans ……………………………………………………………………………… 86.017 143.094 Other loans ………………………………………………………………………………… 1.353.093 1.639.554 2.257.000 2.165.897 Total financial assets 25.471.246 20.868.716
Reserves for financial assets 31.12.2010 31.12.2009Balance at the beginning of the year ………………………………………………… 2.771.342 1.873.206 Allowance for doubtful financial assets and other long term assets …………… 674.710 942.754 Bankrupt and uncollectable …………………………………………………………… (1.217.022) (44.617)Balance at the end of the year …………………………………………………………… 2.229.030 2.771.342
15. Accounts receivable
31.12.2010 31.12.2009Debtors arising out of reinsurance operations ……………………………………… 3.978.440 4.145.141 Other account receivables ……………………………………………………………… 90.074 53.559 4.068.513 4.198.700
Reserves for bad debt 31.12.2010 31.12.2009Balance at the beginning of the year ………………………………………………… 300.076 233.562 Allowance for doubtful debt …………………………………………………………… 366.665 181.899 Bankrupt and uncollectable …………………………………………………………… (218.316) (115.385)Balance at the end of the year …………………………………………………………… 448.425 300.076
16. Reinsurance assets
31.12.2010 31.12.2009Reinsurers’ share in unearned premiums ……………………………………………… 36.566 100.451 Reinsurers’ share in claims provision ………………………………………………… 581.867 463.129 Debtors arising out of reinsurance operations ……………………………………… 16.503 38.619 634.936 602.200
17. Other receivables
31.12.2010 31.12.2009Prepaid taxes ……………………………………………………………………………… 910.179 897.706 Retention …………………………………………………………………………………… 294.086 0 Accrued interest receivables and prepaid expenses ……………………………… 17.135 62.937 1.221.400 960.643

| 36 Amounts in thousands ISK
Not
es
18. Cash and cash equivalent
Cash and cash equivalent specifies as cash at bank in hand and short-term bank deposits. 31.12.2010 31.12.2009Cash ………………………………………………………………………………………… 2.604 2.394 Bank deposits in Icelandic krona ……………………………………………………… 1.898.590 4.003.363 Bank deposits in foreign currency ……………………………………………………… 944.687 2.155.184 2.845.881 6.160.941
19. Share Capital
Share Capital is devided into two categories, A and B Shares RatioShare Capital in category A …………………………………………………………… 2.502.757 96,16%Share Capital in category B …………………………………………………………… 100.000 3,84%Authorised Share Capital ……………………………………………………………… 2.602.757 100%Own shares ………………………………………………………………………………… (277) -0,01%Share Capital according to annual report …………………………………………… 2.602.481 99,99%
Changes in Share Capital is as following: Share Capital SharesAt January 1, 2009 ……………………………………………………………………… 2.502.481 2.502.481 Paid-in Capital ……………………………………………………………………………… 100.000 100.000 At January 1, 2010 ……………………………………………………………………… 2.602.481 2.602.481 At December 31, 2010 ………………………………………………………………… 2.602.481 2.602.481
Shareholders in category B will always have 75% votes in stockholders meetings in proportion to their shares in the cat-egory. Both categories have the same entitlement in divident and other rights. The Share capital is fully paid.
20. Solvency
According the Act on Insurance Activities, the minimum solvency of the Company at the year-end was ISK 2.908 million and calculated solvency ISK 11.146 million, and solvency ratio is 3,8. By considering cross-financing within the Group adapted solvency of the Company is calculated. Adapted solvency of the Company at the year-end was ISK 9.819 million and adapted solvency ratio 3,4. Difference on calculated solvency and book value of equity specifies as follows:
31.12.2010 31.12.2009Equity according to Balance Sheet …………………………………………………… 11.146.214 10.942.074 Dividend paid ……………………………………………………………………………… 0 0 Solvency …………………………………………………………………………………… 11.146.214 10.942.074
The minimum solvency …………………………………………………………………… 2.908.316 2.595.290 Solvency ratio ……………………………………………………………………………… 3,8 4,2
21. Technical provisions
31.12.2010 31.12.2009Technical provisions:Claims reported …………………………………………………………………………… 13.867.773 13.655.031 Claims incurred but not reported ……………………………………………………… 3.329.590 2.712.500 Claims outstanding ……………………………………………………………………… 17.197.363 16.367.531 Unearned premiums ……………………………………………………………………… 5.417.715 5.328.365 Technical provisions total ………………………………………………………………… 22.615.078 21.695.896
Reinsurers’ share:Claims reported ………………………………………………………………………… 459.926 398.107 Claims incurred but not reported ……………………………………………………… 121.941 65.022 Claims outstanding ……………………………………………………………………… 581.867 463.129 Unearned premiums ……………………………………………………………………… 36.566 100.451 Reinsurers’ share total …………………………………………………………………… 618.433 563.580
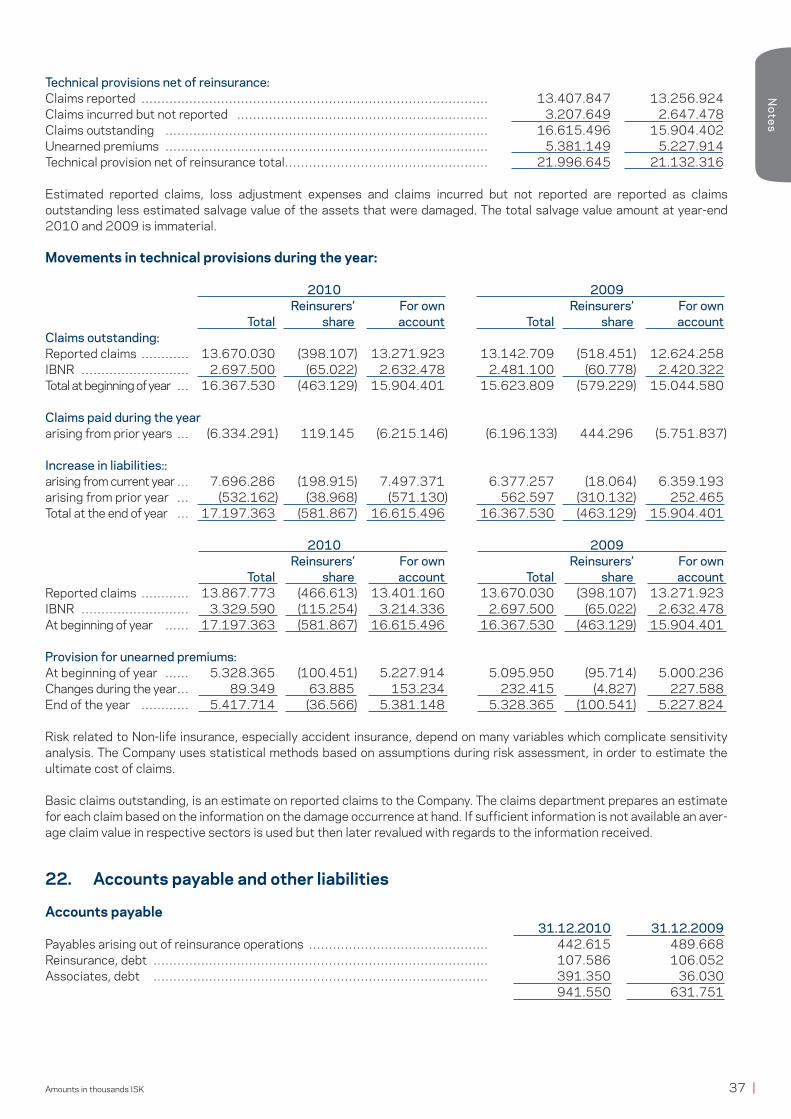
37 |Amounts in thousands ISK
Notes
Technical provisions net of reinsurance:Claims reported …………………………………………………………………………… 13.407.847 13.256.924 Claims incurred but not reported ……………………………………………………… 3.207.649 2.647.478 Claims outstanding ……………………………………………………………………… 16.615.496 15.904.402 Unearned premiums ……………………………………………………………………… 5.381.149 5.227.914 Technical provision net of reinsurance total…………………………………………… 21.996.645 21.132.316
Estimated reported claims, loss adjustment expenses and claims incurred but not reported are reported as claims outstanding less estimated salvage value of the assets that were damaged. The total salvage value amount at year-end 2010 and 2009 is immaterial.
Movements in technical provisions during the year:
2010 2009 Reinsurers’ For own Reinsurers’ For own Total share account Total share accountClaims outstanding:Reported claims ………… 13.670.030 (398.107) 13.271.923 13.142.709 (518.451) 12.624.258 IBNR ……………………… 2.697.500 (65.022) 2.632.478 2.481.100 (60.778) 2.420.322 Total at beginning of year … 16.367.530 (463.129) 15.904.401 15.623.809 (579.229) 15.044.580
Claims paid during the yeararising from prior years … (6.334.291) 119.145 (6.215.146) (6.196.133) 444.296 (5.751.837)
Increase in liabilities::arising from current year … 7.696.286 (198.915) 7.497.371 6.377.257 (18.064) 6.359.193 arising from prior year … (532.162) (38.968) (571.130) 562.597 (310.132) 252.465 Total at the end of year … 17.197.363 (581.867) 16.615.496 16.367.530 (463.129) 15.904.401
2010 2009 Reinsurers’ For own Reinsurers’ For own Total share account Total share accountReported claims ………… 13.867.773 (466.613) 13.401.160 13.670.030 (398.107) 13.271.923 IBNR ……………………… 3.329.590 (115.254) 3.214.336 2.697.500 (65.022) 2.632.478 At beginning of year …… 17.197.363 (581.867) 16.615.496 16.367.530 (463.129) 15.904.401
Provision for unearned premiums:At beginning of year …… 5.328.365 (100.451) 5.227.914 5.095.950 (95.714) 5.000.236 Changes during the year … 89.349 63.885 153.234 232.415 (4.827) 227.588 End of the year ………… 5.417.714 (36.566) 5.381.148 5.328.365 (100.541) 5.227.824
Risk related to Non-life insurance, especially accident insurance, depend on many variables which complicate sensitivity analysis. The Company uses statistical methods based on assumptions during risk assessment, in order to estimate the ultimate cost of claims.
Basic claims outstanding, is an estimate on reported claims to the Company. The claims department prepares an estimate for each claim based on the information on the damage occurrence at hand. If sufficient information is not available an aver-age claim value in respective sectors is used but then later revalued with regards to the information received.
22. Accounts payable and other liabilities
Accounts payable 31.12.2010 31.12.2009Payables arising out of reinsurance operations ……………………………………… 442.615 489.668 Reinsurance, debt ………………………………………………………………………… 107.586 106.052 Associates, debt ………………………………………………………………………… 391.350 36.030 941.550 631.751
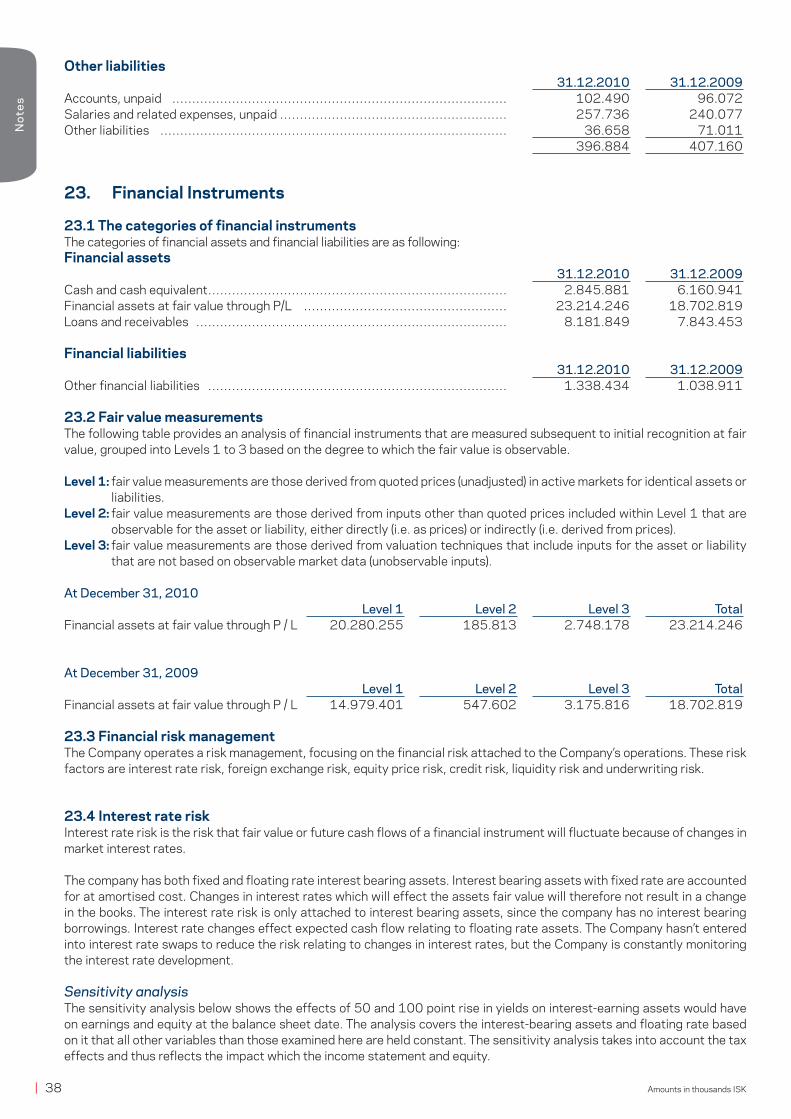
| 38 Amounts in thousands ISK
Not
es
Other liabilities 31.12.2010 31.12.2009Accounts, unpaid ………………………………………………………………………… 102.490 96.072 Salaries and related expenses, unpaid ………………………………………………… 257.736 240.077 Other liabilities …………………………………………………………………………… 36.658 71.011 396.884 407.160
23. Financial Instruments
23.1 The categories of financial instrumentsThe categories of financial assets and financial liabilities are as following:Financial assets 31.12.2010 31.12.2009Cash and cash equivalent ………………………………………………………………… 2.845.881 6.160.941Financial assets at fair value through P/L …………………………………………… 23.214.246 18.702.819Loans and receivables …………………………………………………………………… 8.181.849 7.843.453
Financial liabilities 31.12.2010 31.12.2009Other financial liabilities ………………………………………………………………… 1.338.434 1.038.911
23.2 Fair value measurementsThe following table provides an analysis of financial instruments that are measured subsequent to initial recognition at fair value, grouped into Levels 1 to 3 based on the degree to which the fair value is observable.
Level 1: fair value measurements are those derived from quoted prices (unadjusted) in active markets for identical assets or liabilities.
Level 2: fair value measurements are those derived from inputs other than quoted prices included within Level 1 that are observable for the asset or liability, either directly (i.e. as prices) or indirectly (i.e. derived from prices).
Level 3: fair value measurements are those derived from valuation techniques that include inputs for the asset or liability that are not based on observable market data (unobservable inputs).
At December 31, 2010 Level 1 Level 2 Level 3 TotalFinancial assets at fair value through P / L 20.280.255 185.813 2.748.178 23.214.246
At December 31, 2009 Level 1 Level 2 Level 3 TotalFinancial assets at fair value through P / L 14.979.401 547.602 3.175.816 18.702.819
23.3 Financial risk managementThe Company operates a risk management, focusing on the financial risk attached to the Company’s operations. These risk factors are interest rate risk, foreign exchange risk, equity price risk, credit risk, liquidity risk and underwriting risk.
23.4 Interest rate riskInterest rate risk is the risk that fair value or future cash flows of a financial instrument will fluctuate because of changes in market interest rates.
The company has both fixed and floating rate interest bearing assets. Interest bearing assets with fixed rate are accounted for at amortised cost. Changes in interest rates which will effect the assets fair value will therefore not result in a change in the books. The interest rate risk is only attached to interest bearing assets, since the company has no interest bearing borrowings. Interest rate changes effect expected cash flow relating to floating rate assets. The Company hasn’t entered into interest rate swaps to reduce the risk relating to changes in interest rates, but the Company is constantly monitoring the interest rate development.
Sensitivity analysisThe sensitivity analysis below shows the effects of 50 and 100 point rise in yields on interest-earning assets would have on earnings and equity at the balance sheet date. The analysis covers the interest-bearing assets and floating rate based on it that all other variables than those examined here are held constant. The sensitivity analysis takes into account the tax effects and thus reflects the impact which the income statement and equity.

39 |Amounts in thousands ISK
Notes
The effects on P/L and equity are the same since change in fair value of financial investments are not under any circum-stances through equity. Positive amount stands for increase in the profit of the year and net assets. Decline in interest would have the same effects but in opposite direction.
31.12.2010 31.12.2009 50 pkt 100 pkt 50 pkt 100 pktEffects on P/L and equity ……………… 13.507 27.014 27.786 55.572
23.5 Foreign exchange riskForeign exchange risk is the risk that the fair value or future cash flows of a financial instrument will fluctuate because of changes in foreign exchange rates. Foreign exchange risk arises when there is a difference in the balance between assets and liabilities in foreign currency.
A dominant part of the Company’s assets and liabilities are in ISK the domestic currency, but the Company holds some for-eign currency financial assets. Below, the foreign currencies that mainly affect the Company’s operations are stated. Rates reflect buying rate, but annual volatility is calculated based on mid rate.
Closing rate Average rate Volatility 2010 2009 2010 2009 2010CurrencyEUR ……………………… 153,80 179,88 161,89 172,67 4,3%GBP ……………………… 178,47 201,60 188,55 193,89 9,1%DKK ……………………… 20,64 24,17 21,74 23,19 4,3%NOK ……………………… 19,67 21,67 20,21 19,80 8,8%SEK ……………………… 17,16 17,52 16,96 16,30 8,4%USD ……………………… 115,05 124,90 122,04 123,59 11,0%CHF ……………………… 122,91 121,26 117,24 114,32 9,4%CAD ……………………… 115,26 119,04 118,46 109,04 11,8%
Foreign currency exposure 31.12.2010 Assets Liabilities Net balanceEUR ………………………………………………………………… 1.383.129 606.437 776.692 GBP ………………………………………………………………… 528.608 26.031 502.577 DKK ………………………………………………………………… 40.832 867 39.965 NOK ………………………………………………………………… 36.001 0 36.001 SEK ………………………………………………………………… 9.504 2.085 7.419 USD ………………………………………………………………… 2.411.481 851.922 1.559.559 CHF ………………………………………………………………… 32.409 0 32.409 CAD ………………………………………………………………… 0 13 (13)Other ………………………………………………………………… 11.761 0 11.761
Foreign currency exposure 31.12.2009 Assets Liabilities Net balanceEUR ………………………………………………………………… 2.578.885 348.111 2.230.774 GBP ………………………………………………………………… 376.047 33.487 342.561 DKK ………………………………………………………………… 798.314 0 798.314 NOK ………………………………………………………………… 1.243.601 0 1.243.601 SEK ………………………………………………………………… 11.678 57.918 (46.240)USD ………………………………………………………………… 1.627.792 836.831 790.961
Sensitivity analysisThe table below shows the effects that 5% and 10% change of the relevant foreign currency rate against the ISK would have on income statement and equity based on the assets and liabilities denominated at balance sheet date. In the table above the effects of sensitivity analysis in foreign assets and liabilities are shown but it are mainly foreign securities. The sensitivity analysis assumes that all other variables, than the relevant foreign currency rate, are held constant. The analysis takes into account foreign currency which involve high foreign exchange risk. The sensitivity analysis takes into account the tax effects and impact which reflects the income statement and equity. Because changes in fair value of the underlying foreign financial instruments are not throught equity the effects on P/L and equity are the same. The depreciation of the Icelandic krona against the following currencies would result in an increase in profit and equity. Appreciation of the Icelandic krona would have the same effect, but in the opposite direction.
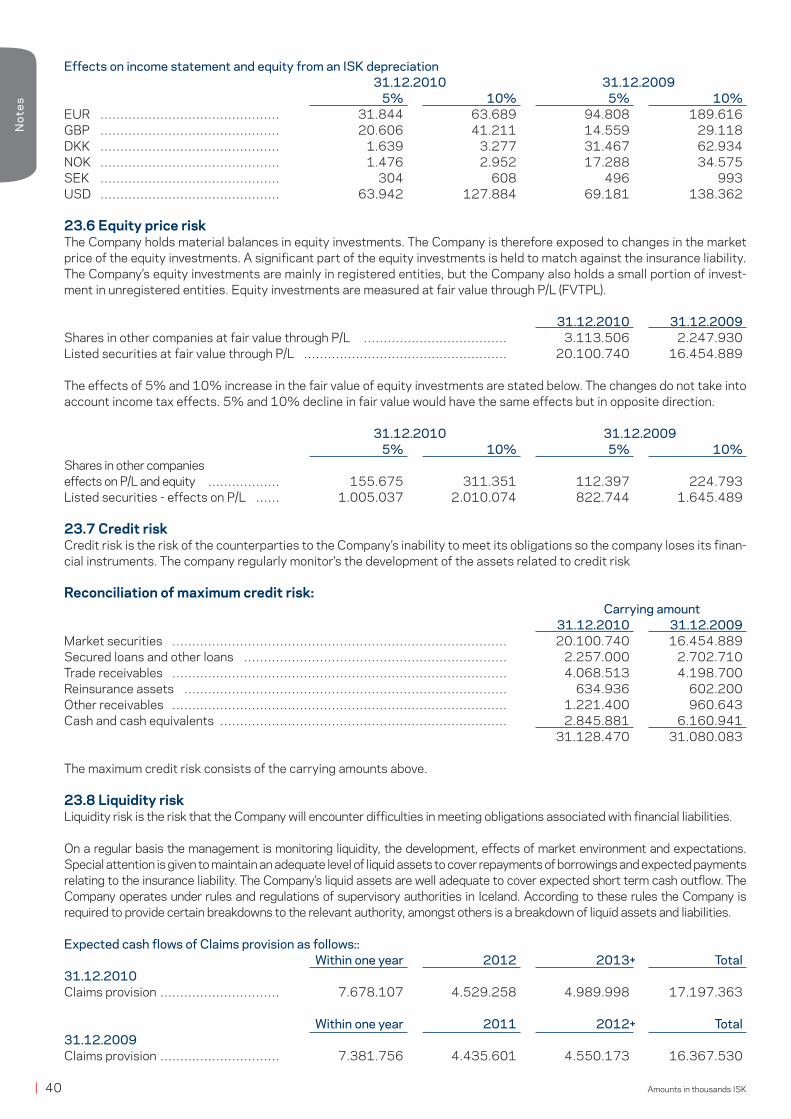
| 40 Amounts in thousands ISK
Not
es
Effects on income statement and equity from an ISK depreciation 31.12.2010 31.12.2009 5% 10% 5% 10%EUR ……………………………………… 31.844 63.689 94.808 189.616 GBP ……………………………………… 20.606 41.211 14.559 29.118 DKK ……………………………………… 1.639 3.277 31.467 62.934 NOK ……………………………………… 1.476 2.952 17.288 34.575 SEK ……………………………………… 304 608 496 993 USD ……………………………………… 63.942 127.884 69.181 138.362
23.6 Equity price riskThe Company holds material balances in equity investments. The Company is therefore exposed to changes in the market price of the equity investments. A significant part of the equity investments is held to match against the insurance liability.The Company’s equity investments are mainly in registered entities, but the Company also holds a small portion of invest-ment in unregistered entities. Equity investments are measured at fair value through P/L (FVTPL).
31.12.2010 31.12.2009Shares in other companies at fair value through P/L ……………………………… 3.113.506 2.247.930Listed securities at fair value through P/L …………………………………………… 20.100.740 16.454.889
The effects of 5% and 10% increase in the fair value of equity investments are stated below. The changes do not take into account income tax effects. 5% and 10% decline in fair value would have the same effects but in opposite direction.
31.12.2010 31.12.2009 5% 10% 5% 10%Shares in other companies effects on P/L and equity ……………… 155.675 311.351 112.397 224.793Listed securities - effects on P/L …… 1.005.037 2.010.074 822.744 1.645.489
23.7 Credit riskCredit risk is the risk of the counterparties to the Company’s inability to meet its obligations so the company loses its finan-cial instruments. The company regularly monitor’s the development of the assets related to credit risk
Reconciliation of maximum credit risk: Carrying amount 31.12.2010 31.12.2009Market securities ………………………………………………………………………… 20.100.740 16.454.889Secured loans and other loans ………………………………………………………… 2.257.000 2.702.710Trade receivables ………………………………………………………………………… 4.068.513 4.198.700Reinsurance assets ……………………………………………………………………… 634.936 602.200Other receivables ………………………………………………………………………… 1.221.400 960.643Cash and cash equivalents ……………………………………………………………… 2.845.881 6.160.941 31.128.470 31.080.083
The maximum credit risk consists of the carrying amounts above.
23.8 Liquidity riskLiquidity risk is the risk that the Company will encounter difficulties in meeting obligations associated with financial liabilities.
On a regular basis the management is monitoring liquidity, the development, effects of market environment and expectations. Special attention is given to maintain an adequate level of liquid assets to cover repayments of borrowings and expected payments relating to the insurance liability. The Company’s liquid assets are well adequate to cover expected short term cash outflow. The Company operates under rules and regulations of supervisory authorities in Iceland. According to these rules the Company is required to provide certain breakdowns to the relevant authority, amongst others is a breakdown of liquid assets and liabilities.
Expected cash flows of Claims provision as follows:: Within one year 2012 2013+ Total31.12.2010Claims provision ………………………… 7.678.107 4.529.258 4.989.998 17.197.363
Within one year 2011 2012+ Total31.12.2009Claims provision ………………………… 7.381.756 4.435.601 4.550.173 16.367.530
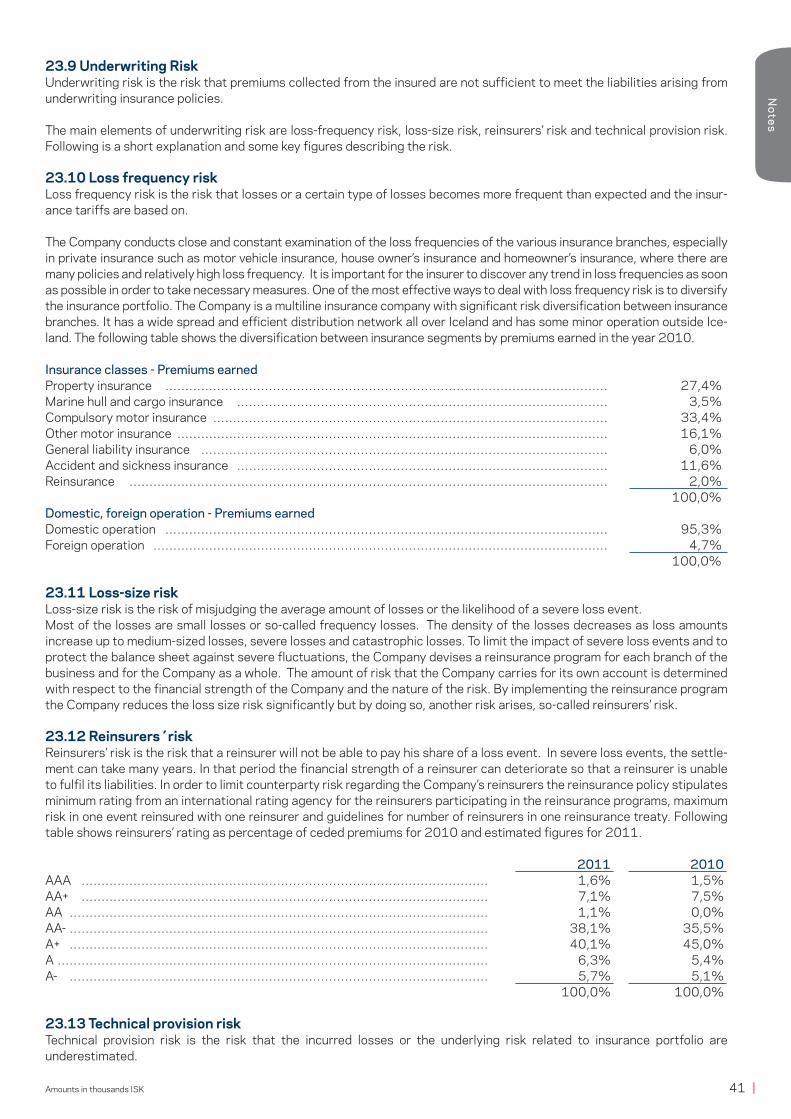
41 |Amounts in thousands ISK
Notes
23.9 Underwriting RiskUnderwriting risk is the risk that premiums collected from the insured are not sufficient to meet the liabilities arising from underwriting insurance policies.
The main elements of underwriting risk are loss-frequency risk, loss-size risk, reinsurers’ risk and technical provision risk. Following is a short explanation and some key figures describing the risk.
23.10 Loss frequency riskLoss frequency risk is the risk that losses or a certain type of losses becomes more frequent than expected and the insur-ance tariffs are based on.
The Company conducts close and constant examination of the loss frequencies of the various insurance branches, especially in private insurance such as motor vehicle insurance, house owner’s insurance and homeowner’s insurance, where there are many policies and relatively high loss frequency. It is important for the insurer to discover any trend in loss frequencies as soon as possible in order to take necessary measures. One of the most effective ways to deal with loss frequency risk is to diversify the insurance portfolio. The Company is a multiline insurance company with significant risk diversification between insurance branches. It has a wide spread and efficient distribution network all over Iceland and has some minor operation outside Ice-land. The following table shows the diversification between insurance segments by premiums earned in the year 2010.
Insurance classes - Premiums earnedProperty insurance ………………………………………………………………………………………………… 27,4%Marine hull and cargo insurance ………………………………………………………………………………… 3,5%Compulsory motor insurance ……………………………………………………………………………………… 33,4%Other motor insurance ……………………………………………………………………………………………… 16,1%General liability insurance ………………………………………………………………………………………… 6,0%Accident and sickness insurance ………………………………………………………………………………… 11,6%Reinsurance ………………………………………………………………………………………………………… 2,0% 100,0%Domestic, foreign operation - Premiums earnedDomestic operation ………………………………………………………………………………………………… 95,3%Foreign operation …………………………………………………………………………………………………… 4,7% 100,0%
23.11 Loss-size riskLoss-size risk is the risk of misjudging the average amount of losses or the likelihood of a severe loss event. Most of the losses are small losses or so-called frequency losses. The density of the losses decreases as loss amounts increase up to medium-sized losses, severe losses and catastrophic losses. To limit the impact of severe loss events and to protect the balance sheet against severe fluctuations, the Company devises a reinsurance program for each branch of the business and for the Company as a whole. The amount of risk that the Company carries for its own account is determined with respect to the financial strength of the Company and the nature of the risk. By implementing the reinsurance program the Company reduces the loss size risk significantly but by doing so, another risk arises, so-called reinsurers’ risk.
23.12 Reinsurers´riskReinsurers’ risk is the risk that a reinsurer will not be able to pay his share of a loss event. In severe loss events, the settle-ment can take many years. In that period the financial strength of a reinsurer can deteriorate so that a reinsurer is unable to fulfil its liabilities. In order to limit counterparty risk regarding the Company’s reinsurers the reinsurance policy stipulates minimum rating from an international rating agency for the reinsurers participating in the reinsurance programs, maximum risk in one event reinsured with one reinsurer and guidelines for number of reinsurers in one reinsurance treaty. Following table shows reinsurers’ rating as percentage of ceded premiums for 2010 and estimated figures for 2011.
2011 2010AAA ………………………………………………………………………………………… 1,6% 1,5%AA+ ………………………………………………………………………………………… 7,1% 7,5%AA …………………………………………………………………………………………… 1,1% 0,0%AA- …………………………………………………………………………………………… 38,1% 35,5%A+ …………………………………………………………………………………………… 40,1% 45,0%A ……………………………………………………………………………………………… 6,3% 5,4%A- …………………………………………………………………………………………… 5,7% 5,1% 100,0% 100,0%
23.13 Technical provision riskTechnical provision risk is the risk that the incurred losses or the underlying risk related to insurance portfolio are underestimated.

| 42 Amounts in thousands ISK
Not
es
Technical provisions consist of unearned premiums and loss reserves. Unearned premiums are the estimated amount of insurance liabilities of unexpired policies. Loss reserves are the amount of unsettled losses, both reported losses and losses that are incurred but not reported to the insurer. The strength of technical reserves is examined by a set of statistical methods that makes it possible to estimate the outstanding losses and the risk margin.
23.14 Combined ratio and operating ratioCombined ratio is the sum of the incurred losses, operating expenses and net reinsurance cost as a proportion of earned premiums. Operating ratio is the same as combined ratio but as a proportion of earned premiums and investment return from insurance operation.
The Company has a policy to lower combined ratio and the aim is that it will become lower than 100%. Improved ratio makes it possible for the company to meet lower return on its investments in the future. Following table shows the combined ratio and other key ratios for the insurance activity over the last five years:
2010 2009 2008 2007 2006Loss ratio ………………………………… 80,5% 86,1% 88,5% 80,7% 87,6%Operating expenses ratio …………… 21,1% 19,3% 19,9% 19,2% 22,1%Reinsurance cost ratio ………………… 2,7% 1,8% 2,7% 4,7% 5,7%Combined ratio ………………………… 104,3% 107,2% 111,1% 104,6% 115,4%Investment income ratio ……………… 7,6% 10,8% 16,4% 16,1% 18,4%Other income ratio ……………………… 0,7% 0,6% 1,5% 0,3% - Operating ratio ………………………… 96,3% 96,2% 94,2% 89,9% 97,5%
24. Related party transactions
Related parties are those parties which have considerable influence over the Company, directly or indirectly, including par-ent company, owners or their families, large investors, key employees and their families and parties that are controlled or dependent on the Company, i.e. affiliates and joint ventures. Business with related parties has been done on a similar basis as business with unrelated parties. In Note 8 salaries and commissions to executvies are shown.
Related parties transaticions in the year 2010: Purchases of Sales of Premiums goods/servicies goods/services earned ClaimsExista ehf. and related parties ……… 24.965 175.063 40.315 37.086 24.965 175.063 40.315 37.086
Related parties transaticions in the year 2010: Receivables LiabilitiesExista ehf. and related parties ………………………………………………………… 1.769.585 319.350 1.769.585 319.350
Related parties transaticions in the year 2009: Purchases of Sales of Premiums goods/servicies goods/services earned ClaimsExista ehf. and related parties ……… 43.697 163.128 56.737 8.821 43.697 163.128 56.737 8.821
Related parties transaticions in the year 2009: Kröfur SkuldirExista ehf. and related parties ………………………………………………………… 3.144.982 36.030 3.144.982 36.030
25. Events after the Balance Sheet date
No events have occurred since the the balance sheet date, which would change the financial position of the Company and which would require adjustment of or disclosure in the annual accounts now presented.
26. Approval of the Financial Statements
The Financial Statements were approved by the Board of Directors and authorised for issue on March 1st, 2011.
43 |
Glossary
Glossary of termsReturn on owners’ equity Profit as a ratio of owner‘s equityPremiums entered Premiums written during yearOwn equity Assets in excess of debts Claim‘s ratio Own claims in comparison with own premiums Earned premiums Premiums earned less reinsurers‘ share Claims incurred Premiums entered less reinsurers’ share Own technical provision Retained premiums less reinsurers’ share Equity ratio Own equity in comparison with total assets Reinsurers’ assets Reinsurers’ share in claims outstanding and provision for unearned premiums
along with debts arising out of reinsurance operations Reinsurance expense ratio Reinsurance expense as a ratio of premiums earnedReinsurance expenses Premiums to reinsurers less the reinsurers’ share in claims and received
commissions from reinsurers Investment income from insuranceoperations Calculated return on own technical provisionSolvency Owner’s equity less prospective dividend payment, intangible assets and
foreseeable impairment of own equitySolvency ratio Solvency as a ratio of minimum solvency Net cash from operating activities Funds and bank depositsProvision for unearned premiums Premiums from risk that has not expired Premiums earned Premiums from risk pertaining to year under review Cost ratio Cost as a ratio of premiums earned Minimum solvency Minimum solvency requirement according to law regarding insurance
activities Retained earnings Accumulated profits from previous years Operating ratio Operating costs as a ratio of premiums earned Combined ratio Claims, reinsurance expenses and operating costs from insurance activities
as a ratio of premiums earned Claims paid Paid claims with appendant changes to claims outstandingClaims ratio Claims paid compared to premiums earned Claims outstanding Calculated unpaid claims at end of accounting period Technical provision Total liabilities from of insurance contracts, i.e. claims outstanding along with
provisions for unearned premiums

Vátryggingafélag Íslands hf – Ármúli 3 – 108 Reykjavík– Telephone: +354 560 5000 – [email protected] – vis.is