visioning opioid informatics
TRANSCRIPT
Visioning Opioid Informatics
Controlled Substance Reporting System 2.0 & Dashboard Reporting MIKE DOLAN FL ISS , MSW
4TH YEAR EPIDEMIOLOGY PHD STUDENT
PROFESSIONAL SCIENCE MASTERS IN BIOMEDICAL AND HEALTH INFORMATICS

Today’s TalkBackground: PDMPs & Opioid Epidemic
Visioning CSRS 2.0◦ Research◦ Stakeholder Meetings◦ Informatics Outputs
Opioid Action Plan: Data Dashboard
Background:Opioids & PDMPs
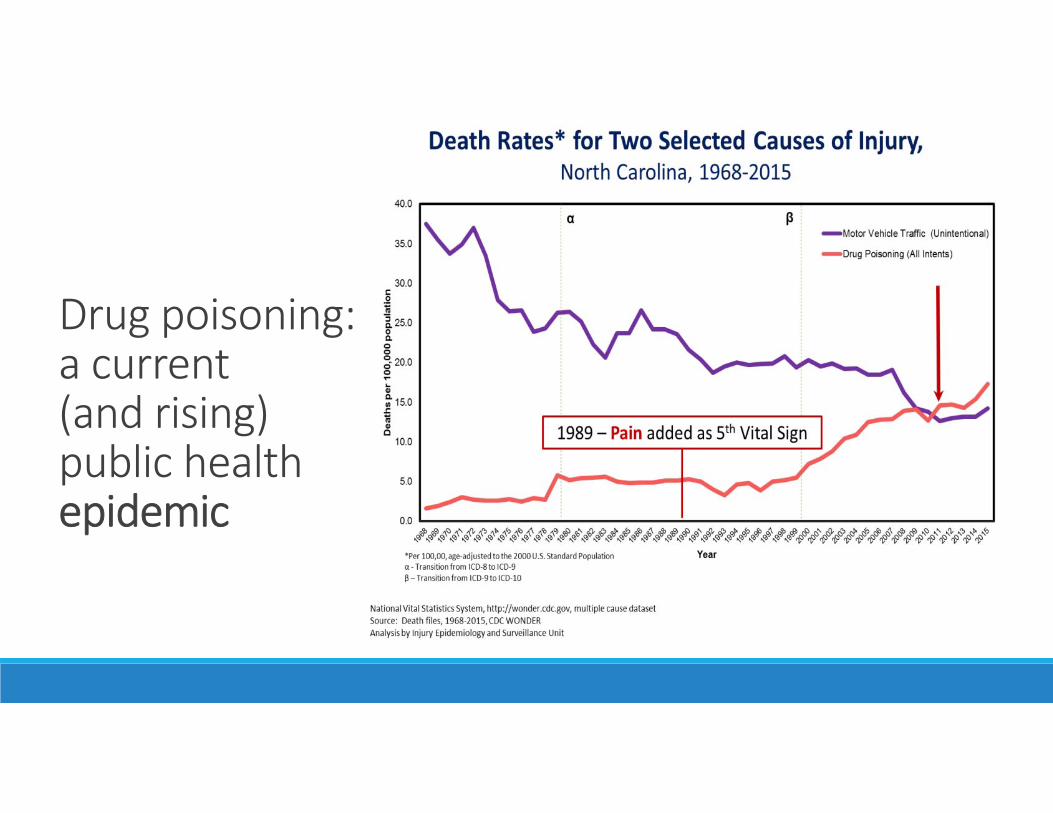
Drug poisoning:a current (and rising) public health epidemic
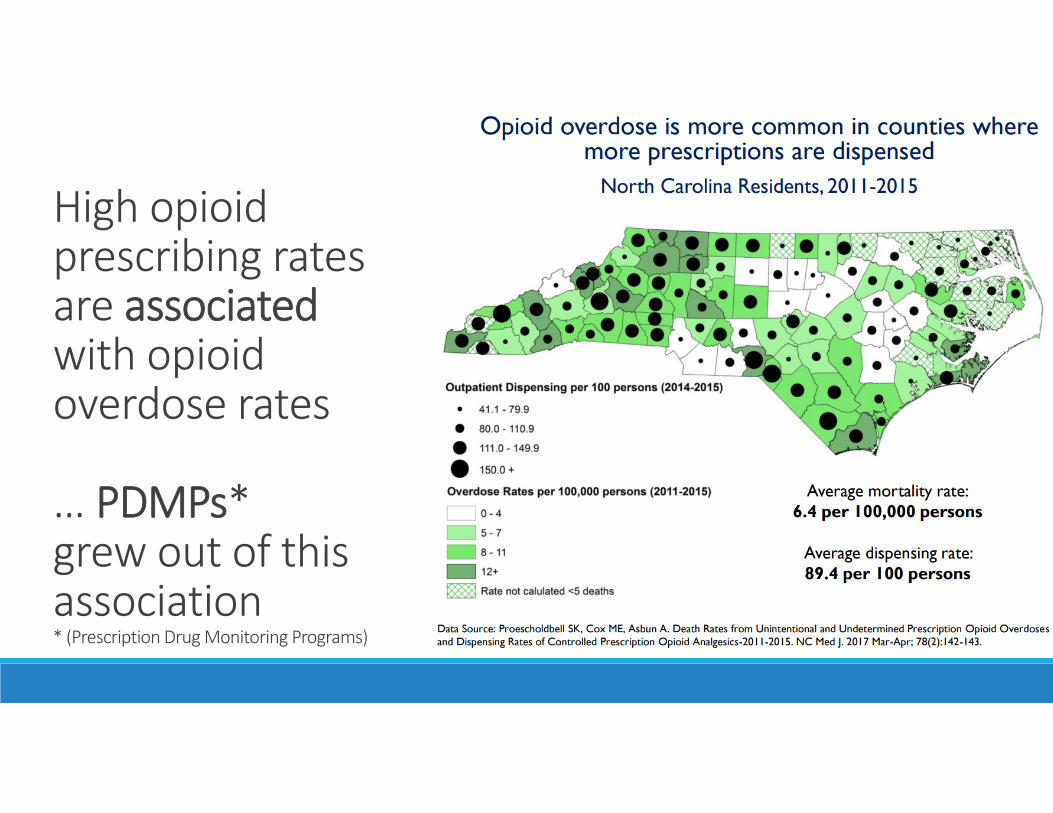
High opioid prescribing rates are associatedwith opioid overdose rates
… PDMPs* grew out of this association* (Prescription Drug Monitoring Programs)
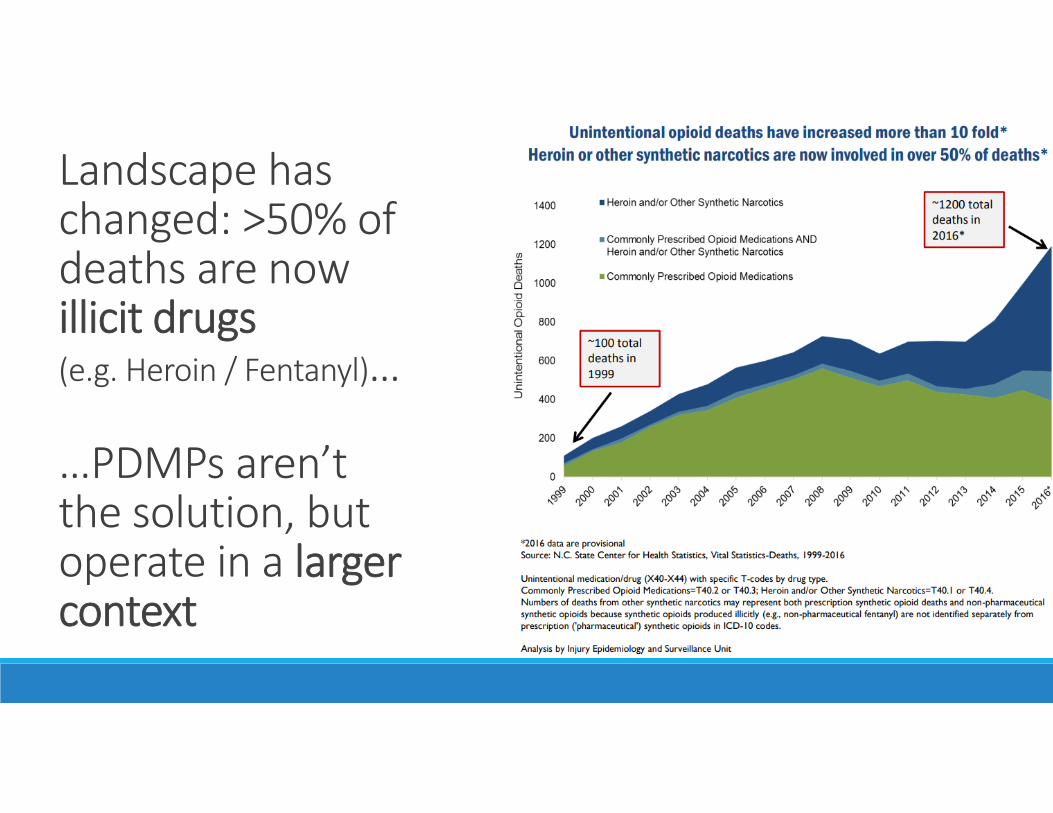
Landscape has changed: >50% of deaths are now illicit drugs (e.g. Heroin / Fentanyl)…
…PDMPs aren’t the solution, but operate in a larger context
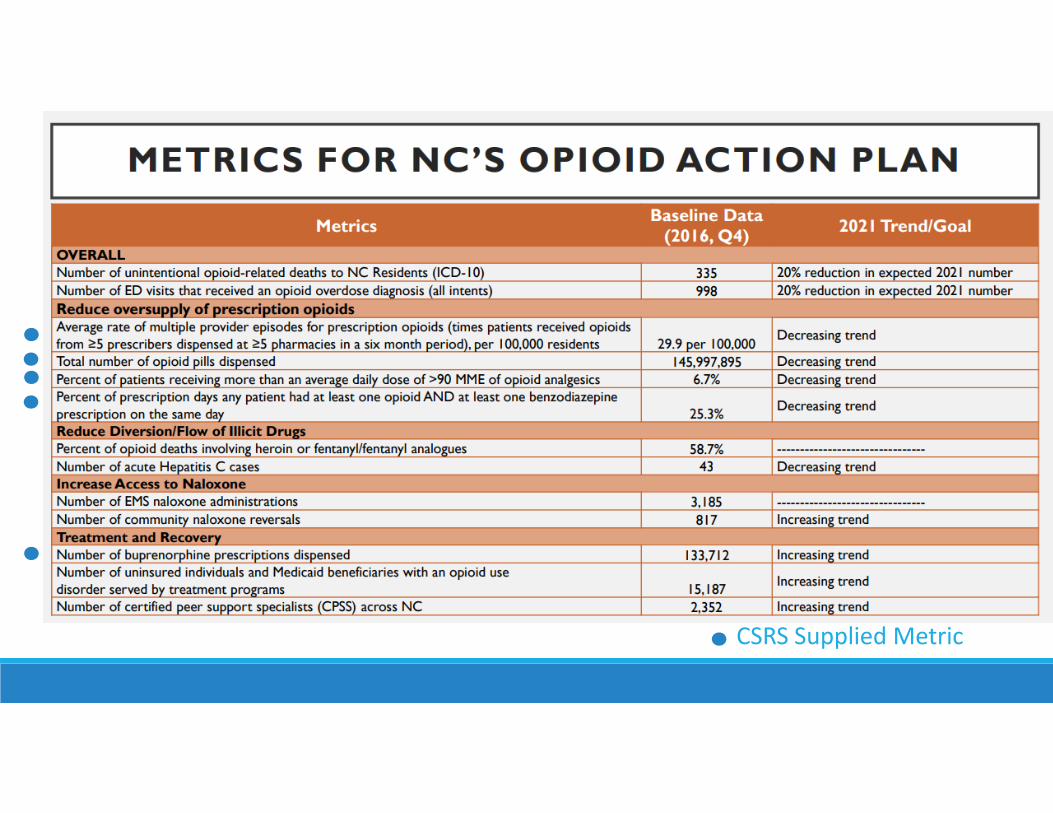
CSRS Supplied Metric

PDMP Context• NC’s PDMP is the Controlled Substance Reporting System (CSRS), started in 2009
• CSRS collects prescription, prescriber, dispenser and patient details within 72 hours of a dispensation• Epidemiology note: …making this closest to ITT data• Historically used primarily to address prescriber diversion and basic prescribing patterns• Beginning to be used for research, but largely unlinked dataset
• CSRS is managed by a 3rd party vendor (APPRISS), who, after consolidation in the last few years, now has a near monopoly on the US PDMP marketplace.• Local, flat table download provided by vendor to small analytics team at DMH/SA. • Data challenges (non‐normal, time lag, infrastructure for big analysis, etc.).
CSRS 2.0A COLLABORATION BETWEEN
UNC INJURY PREVENTION RESEARCH CENTER (UNC IPRC) AND
NC DIVISION OF MENTAL HEALTH & SUBSTANCE ABUSE (NC DMH)
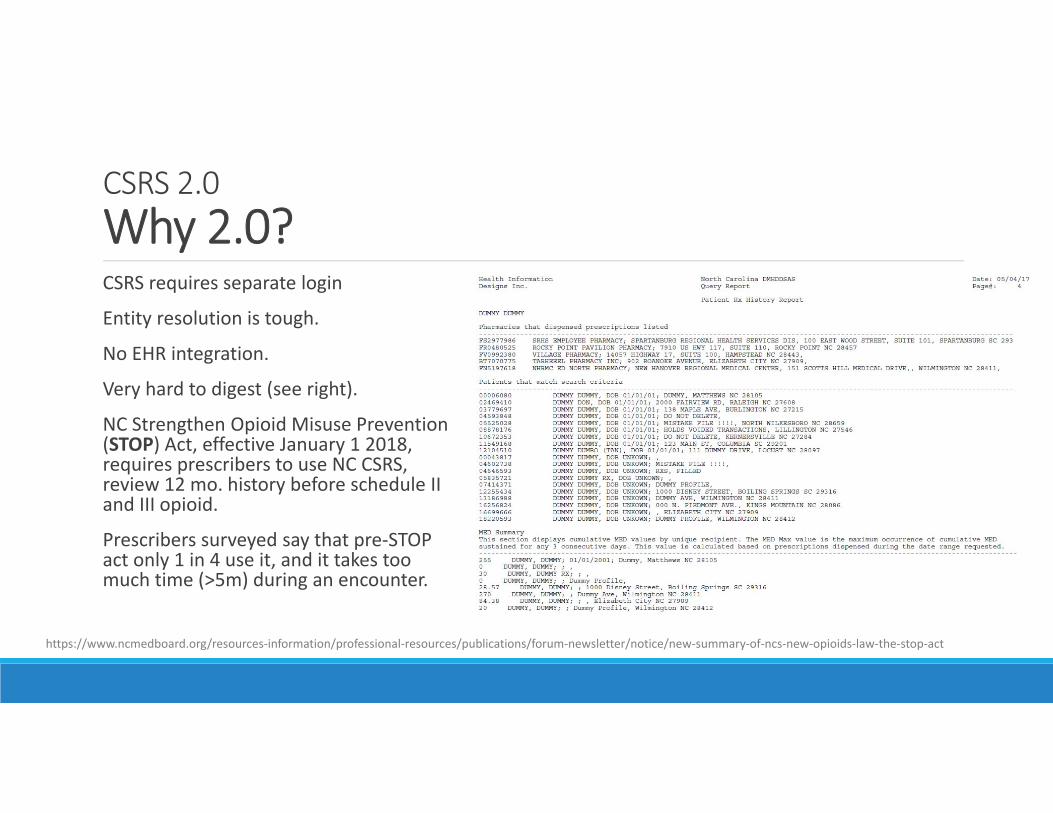
CSRS 2.0Why 2.0?CSRS requires separate login
Entity resolution is tough.
No EHR integration.
Very hard to digest (see right).
NC Strengthen Opioid Misuse Prevention (STOP) Act, effective January 1 2018, requires prescribers to use NC CSRS, review 12 mo. history before schedule II and III opioid.
Prescribers surveyed say that pre‐STOP act only 1 in 4 use it, and it takes too much time (>5m) during an encounter.
https://www.ncmedboard.org/resources‐information/professional‐resources/publications/forum‐newsletter/notice/new‐summary‐of‐ncs‐new‐opioids‐law‐the‐stop‐act
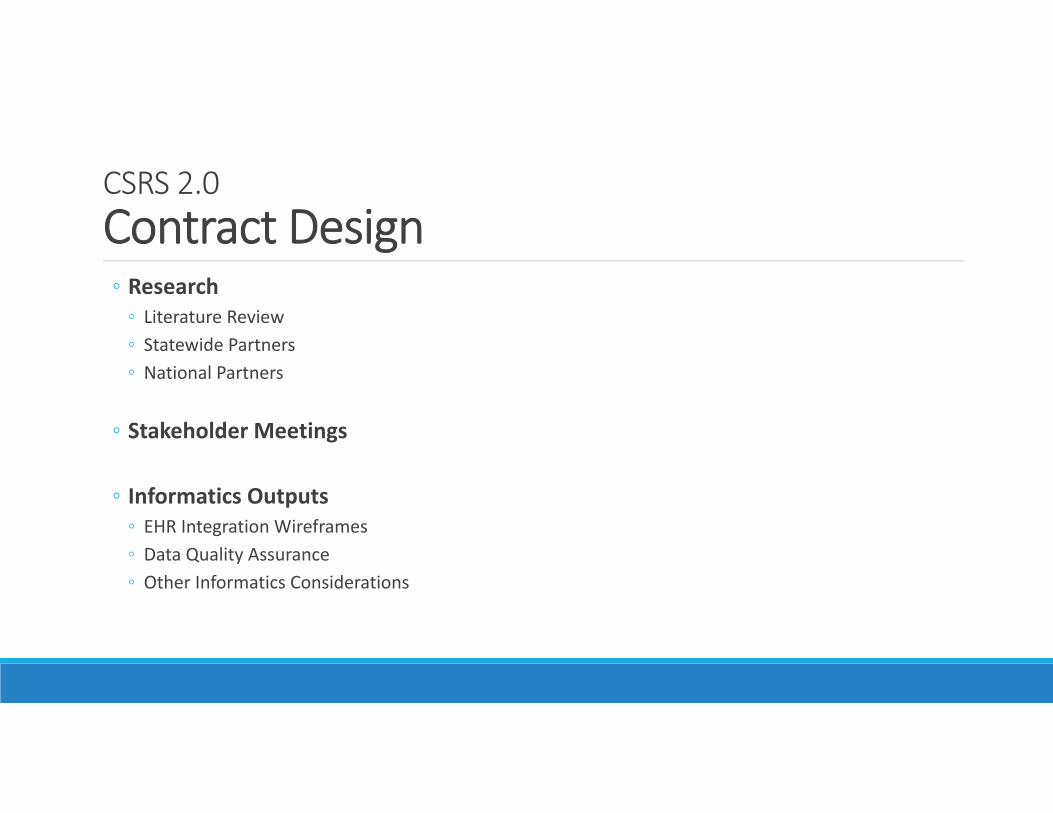
CSRS 2.0Contract Design◦ Research◦ Literature Review◦ Statewide Partners◦ National Partners
◦ Stakeholder Meetings
◦ Informatics Outputs◦ EHR Integration Wireframes◦ Data Quality Assurance◦ Other Informatics Considerations
CSRS 2.0: Research Activities
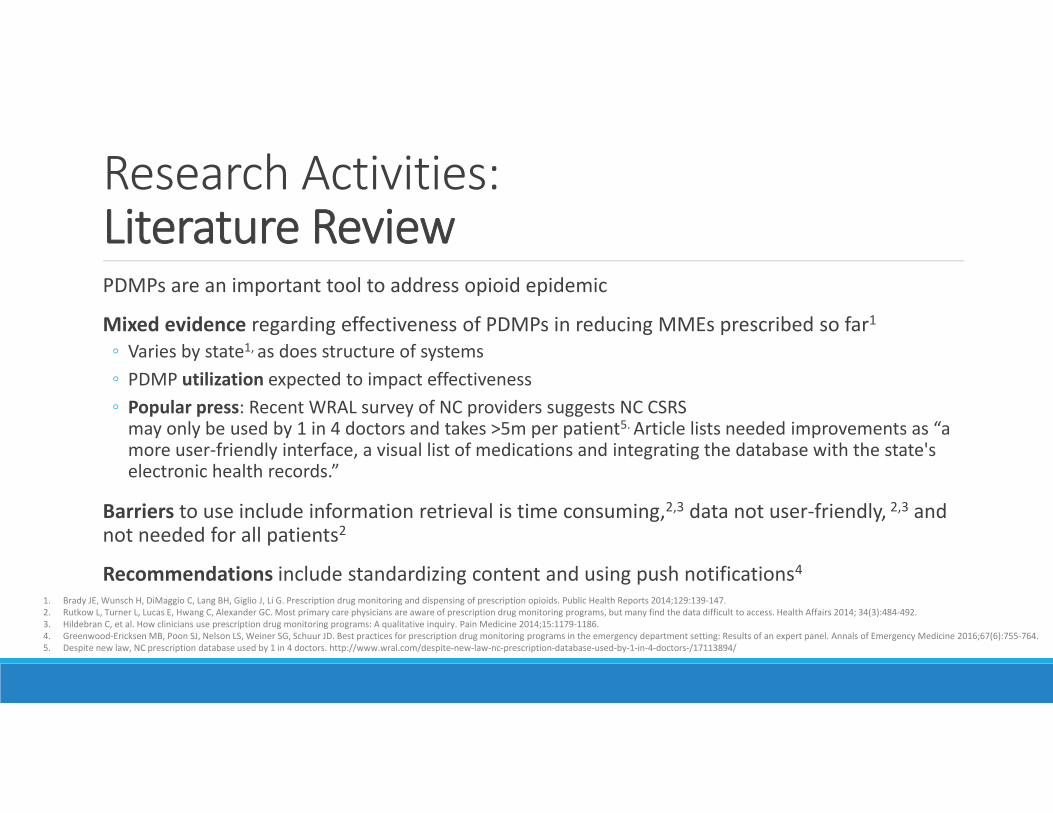
Research Activities: Literature ReviewPDMPs are an important tool to address opioid epidemic
Mixed evidence regarding effectiveness of PDMPs in reducing MMEs prescribed so far1◦ Varies by state1, as does structure of systems◦ PDMP utilization expected to impact effectiveness◦ Popular press: Recent WRAL survey of NC providers suggests NC CSRS may only be used by 1 in 4 doctors and takes >5m per patient5. Article lists needed improvements as “a more user‐friendly interface, a visual list of medications and integrating the database with the state's electronic health records.”
Barriers to use include information retrieval is time consuming,2,3 data not user‐friendly, 2,3 and not needed for all patients2
Recommendations include standardizing content and using push notifications41. Brady JE, Wunsch H, DiMaggio C, Lang BH, Giglio J, Li G. Prescription drug monitoring and dispensing of prescription opioids. Public Health Reports 2014;129:139‐147.2. Rutkow L, Turner L, Lucas E, Hwang C, Alexander GC. Most primary care physicians are aware of prescription drug monitoring programs, but many find the data difficult to access. Health Affairs 2014; 34(3):484‐492. 3. Hildebran C, et al. How clinicians use prescription drug monitoring programs: A qualitative inquiry. Pain Medicine 2014;15:1179‐1186.4. Greenwood‐Ericksen MB, Poon SJ, Nelson LS, Weiner SG, Schuur JD. Best practices for prescription drug monitoring programs in the emergency department setting: Results of an expert panel. Annals of Emergency Medicine 2016;67(6):755‐764. 5. Despite new law, NC prescription database used by 1 in 4 doctors. http://www.wral.com/despite‐new‐law‐nc‐prescription‐database‐used‐by‐1‐in‐4‐doctors‐/17113894/
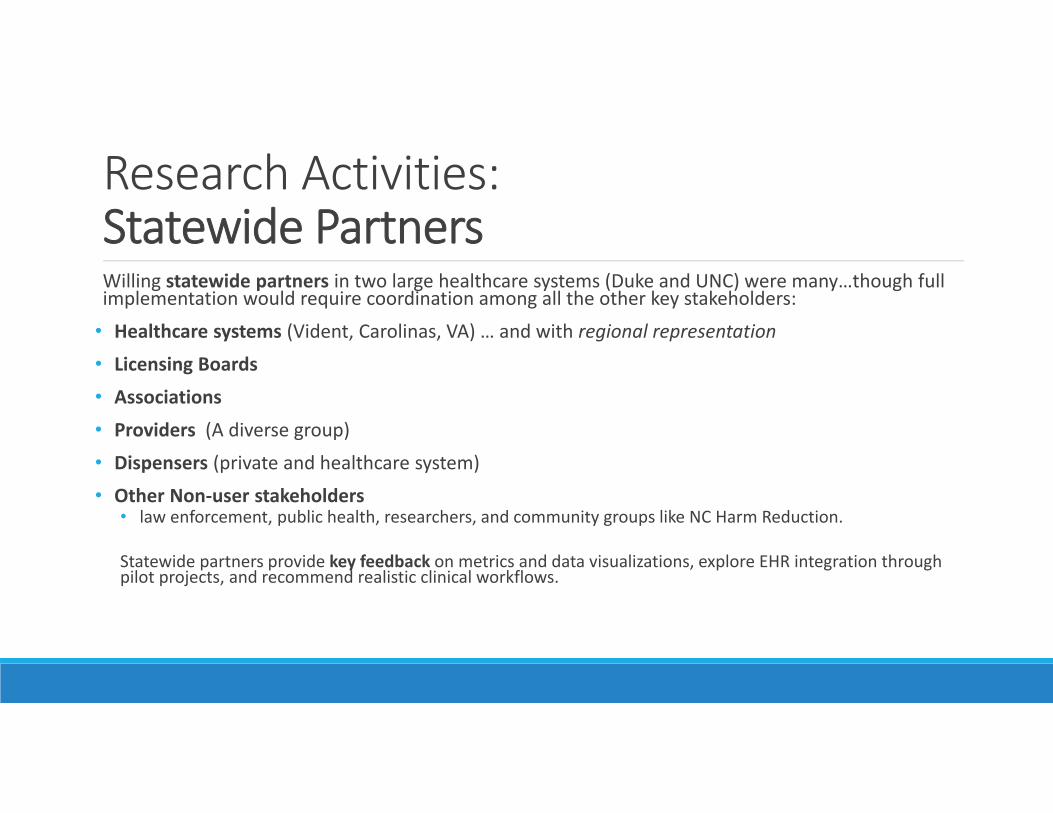
Research Activities: Statewide PartnersWilling statewide partners in two large healthcare systems (Duke and UNC) were many…though full implementation would require coordination among all the other key stakeholders:
• Healthcare systems (Vident, Carolinas, VA) … and with regional representation
• Licensing Boards
• Associations
• Providers (A diverse group)
• Dispensers (private and healthcare system)
• Other Non‐user stakeholders • law enforcement, public health, researchers, and community groups like NC Harm Reduction.
Statewide partners provide key feedback on metrics and data visualizations, explore EHR integration through pilot projects, and recommend realistic clinical workflows.

Research Activities: National PartnersNational partners in other states can provide lessons learned on topics including • Data linkages• EHR integration pilots• Informatics vendors• Metrics• Reporting and alert systems. Tennessee and Kentucky are national thought‐leaders who have built systems North Carolina could likely learn from. APPRISS is everywhere! But other states have different contractual relationships (including with other third party vendors like SAS and IBM).

Stakeholder Meetings Two in‐person group stakeholder meetings (with Duke and UNC healthcare system thought‐leaders) and targeted follow‐up meetings and interviews suggested important improvements to and priorities for CSRS 2.0.
Researchers & institutions emphasized data access for linkages, data quality assurance, and timely research studies.
Clinicians prioritized interpretable metrics, data visualization, EHR integration, HIPAA issues and better user interfaces.
Informatics teams recommended pilot projects to test metrics and workflows.
Dozens of stakeholders in just those two healthcare systems suggest there are likely over 100 key expert stakeholders to engage as implementation and design plans solidify.

CSRS 2.0: EHR Wireframes

EHR Wireframes: Overview◦ Represents Stakeholder Feedback: Design used to visually represent priorities and challenges
from stakeholder meetings with providers and healthcare system informatics teams◦ Preliminary: A first iteration only◦ Untested: Any implementation would require serious iteration and pilot testing, with a strong attention to realistic workflows. What happens if X‐Y‐Z?
◦ Idealized: Loosely based on Epic modules, but largely EHR‐agnostic. Must be instantiated in a particular EHRs… and EHRs aren’t monoliths, and may differ within the same system significantly by specialty.
◦ Outstanding issues are many: include ethical considerations, metric validation, data privacy concerns, and linkage and architecture questions.

EHR Wireframes: Existing StateReminder: Current Status
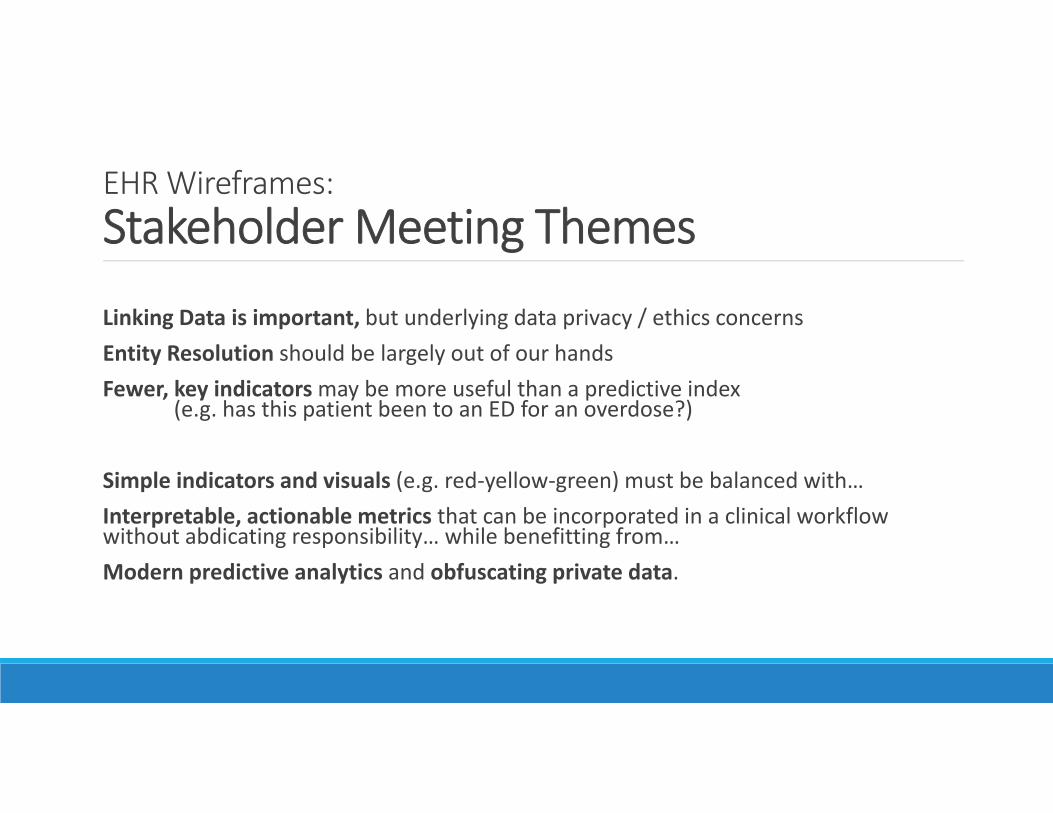
EHR Wireframes: Stakeholder Meeting Themes
Linking Data is important, but underlying data privacy / ethics concernsEntity Resolution should be largely out of our handsFewer, key indicators may be more useful than a predictive index
(e.g. has this patient been to an ED for an overdose?)
Simple indicators and visuals (e.g. red‐yellow‐green) must be balanced with…Interpretable, actionable metrics that can be incorporated in a clinical workflow without abdicating responsibility… while benefitting from…Modern predictive analytics and obfuscating private data.
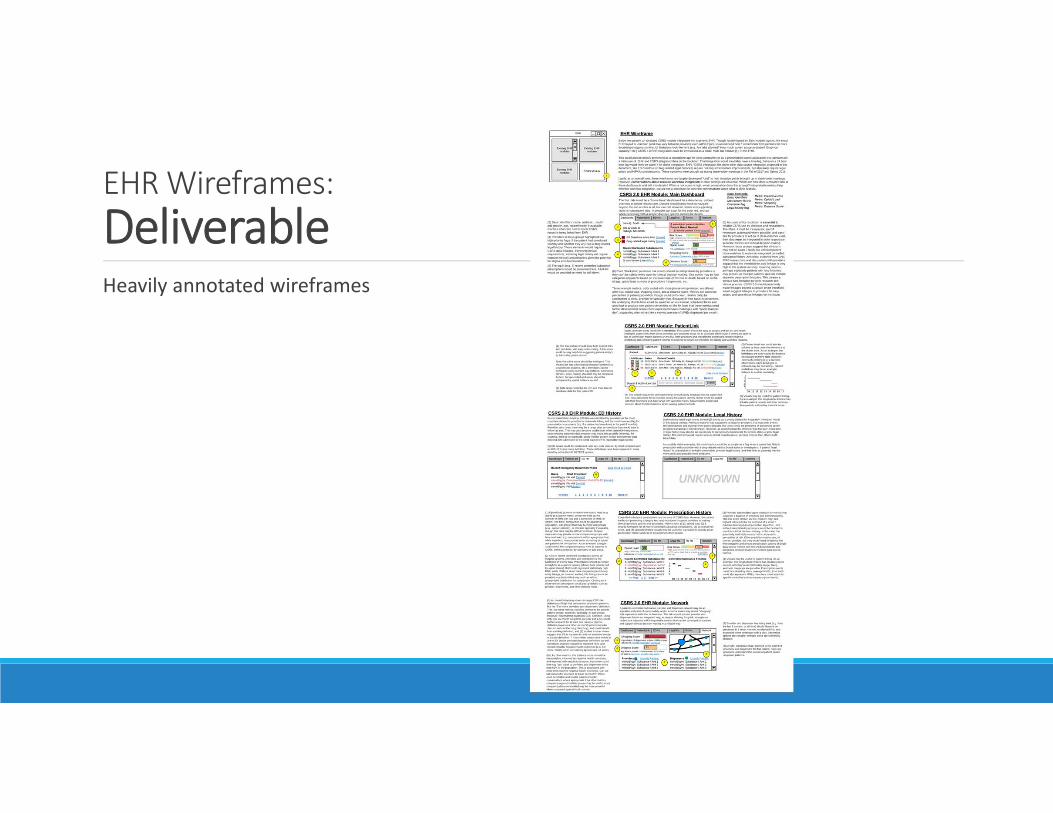
EHR Wireframes: DeliverableHeavily annotated wireframes

EHR Wireframes: Deliverable (zoomed, but still illegible…)

EHR Wireframes: Dashboard

EHR Wireframes: PatientLink (Entity Resolution)

EHR Wireframes: ED Hx / Legal HxEthical Considerations: Linking data
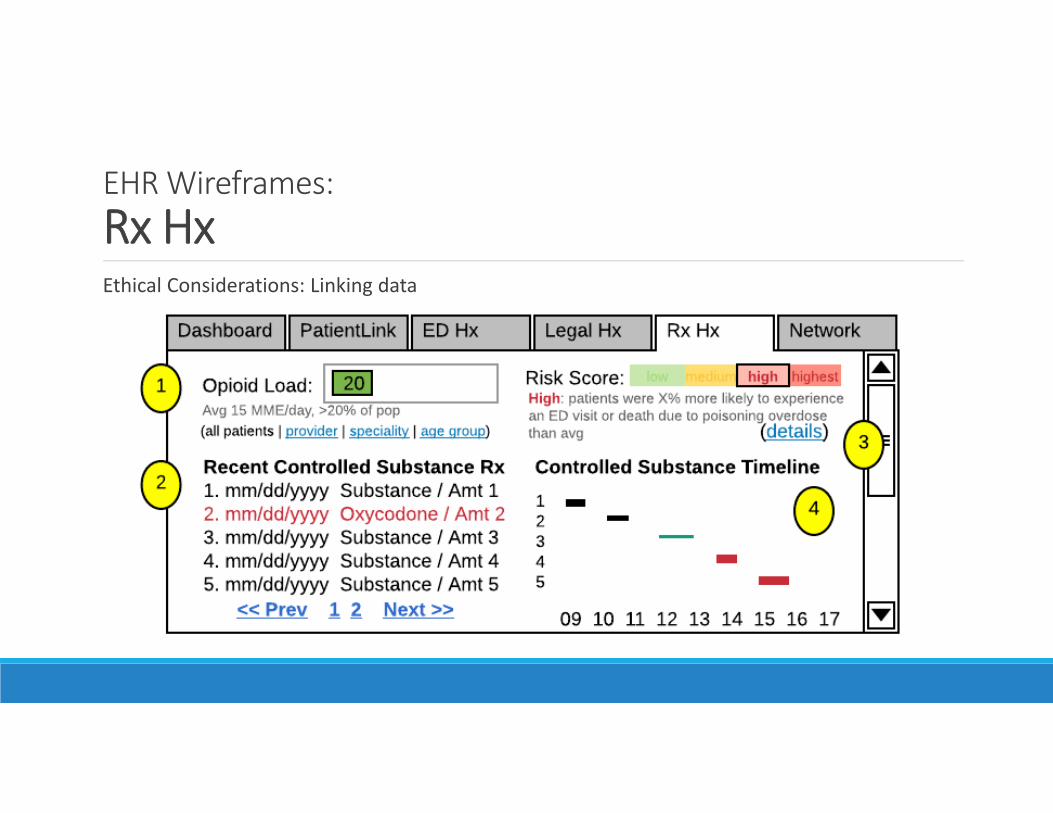
EHR Wireframes: Rx HxEthical Considerations: Linking data

EHR Wireframes: Network
CSRS 2.0: Data Quality Assurance
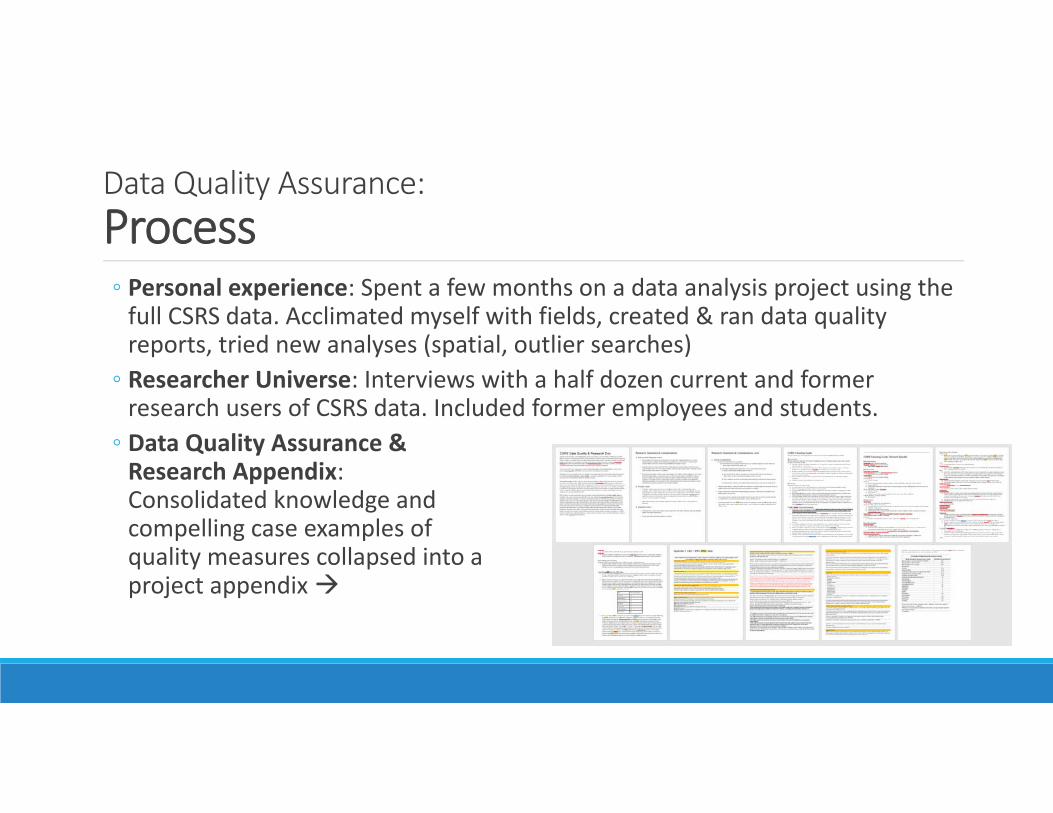
Data Quality Assurance: Process◦ Personal experience: Spent a few months on a data analysis project using the full CSRS data. Acclimated myself with fields, created & ran data quality reports, tried new analyses (spatial, outlier searches)
◦ Researcher Universe: Interviews with a half dozen current and former research users of CSRS data. Included former employees and students.
◦ Data Quality Assurance & Research Appendix: Consolidated knowledge and compelling case examples of quality measures collapsed into a project appendix

Data Quality Assurance: Overall LessonsCSRS data quality assurance is paramount: without it, metrics are unusable for providers, research fails, and system trust falters.
Comprehensive data quality assurance relies on many processes and knowledge sets, including: • Improving original data entry
• Cleaning primary fields
• Effective automation of entity resolution with minimal provider input
• Descriptive and predictive metric validity
IPRC offered ongoing support to organizations and third‐party vendors tasked with maintaining the data quality at the foundation of these efforts.
• Error feedback
• Script and supplementary table* maintenance
• integrating ever‐evolving content‐knowledge expertise
• data quality reports, well‐designed and regularly reviewed
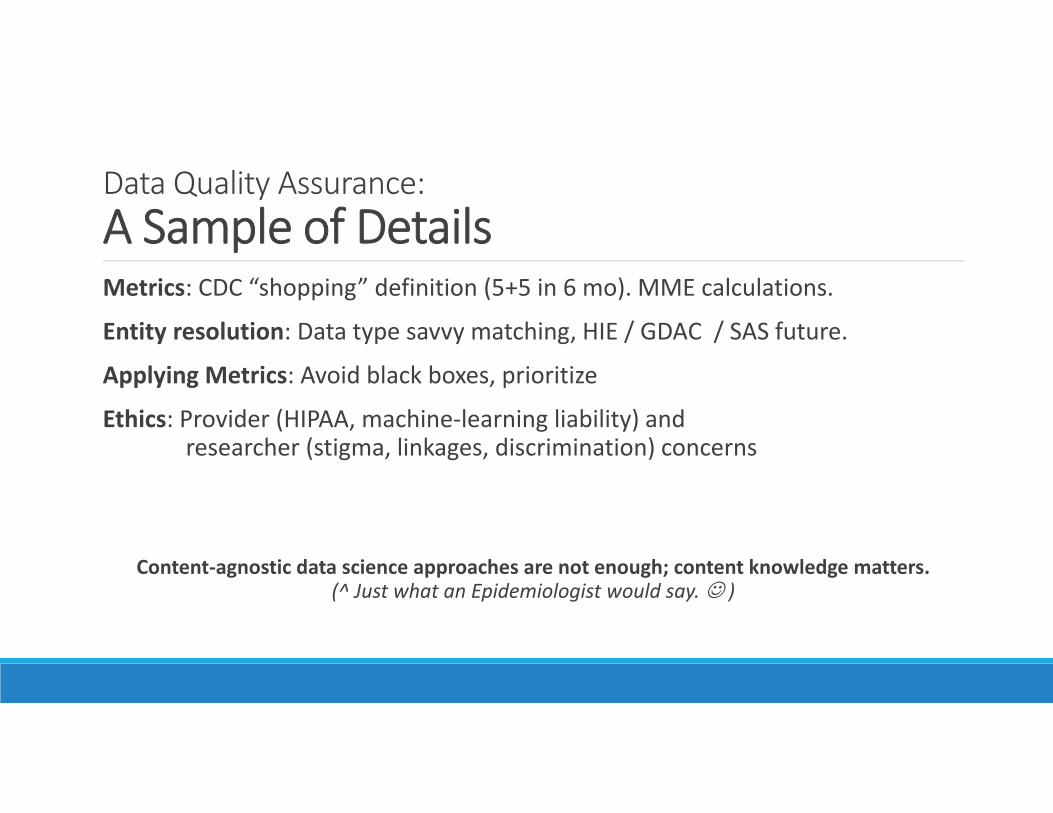
Data Quality Assurance: A Sample of DetailsMetrics: CDC “shopping” definition (5+5 in 6 mo). MME calculations.
Entity resolution: Data type savvy matching, HIE / GDAC / SAS future.
Applying Metrics: Avoid black boxes, prioritize
Ethics: Provider (HIPAA, machine‐learning liability) and researcher (stigma, linkages, discrimination) concerns
Content‐agnostic data science approaches are not enough; content knowledge matters. (^ Just what an Epidemiologist would say. )
CSRS 2.0: Informatics Considerations

Informatics Considerations:Highlights
Miscellaneous informatics considerations between stakeholder meetings, interviews and past research projects were collected. Highlights:
• As data linkage grows and EHR integration possibilities grow, automation and documentation of extract‐transfer‐load (ETL) operations is key.
• Automation and documentation of cleaning and reporting will need improvements as data throughput and timeliness increases.
• Moving to a more push‐ and alert‐centric system (while avoiding alert fatigue) is key for effective utilization.
• Assuring data quality will be even more paramount as new calculated metrics are integrated into workflows.
Informatics Considerations:Highlights, cont.
• New and regular data quality reports are required and should include human and algorithm process metrics as well as measures of data quality and distributions.
• Novel functionality and metrics should not be limited to existing fields, but be guided by past, current and future needs and evidence‐based clinical and public health interventions.
• Policies and practices regarding data privacy (notice/choice/access, HIPAA and related provider liabilities) and data governance need continued scrutiny, improvement and expansion to support clinician workflows, increased data linkages, practice‐focused research, and informatics integration.
• All these improvements must move ahead while underlying data security is ensured.
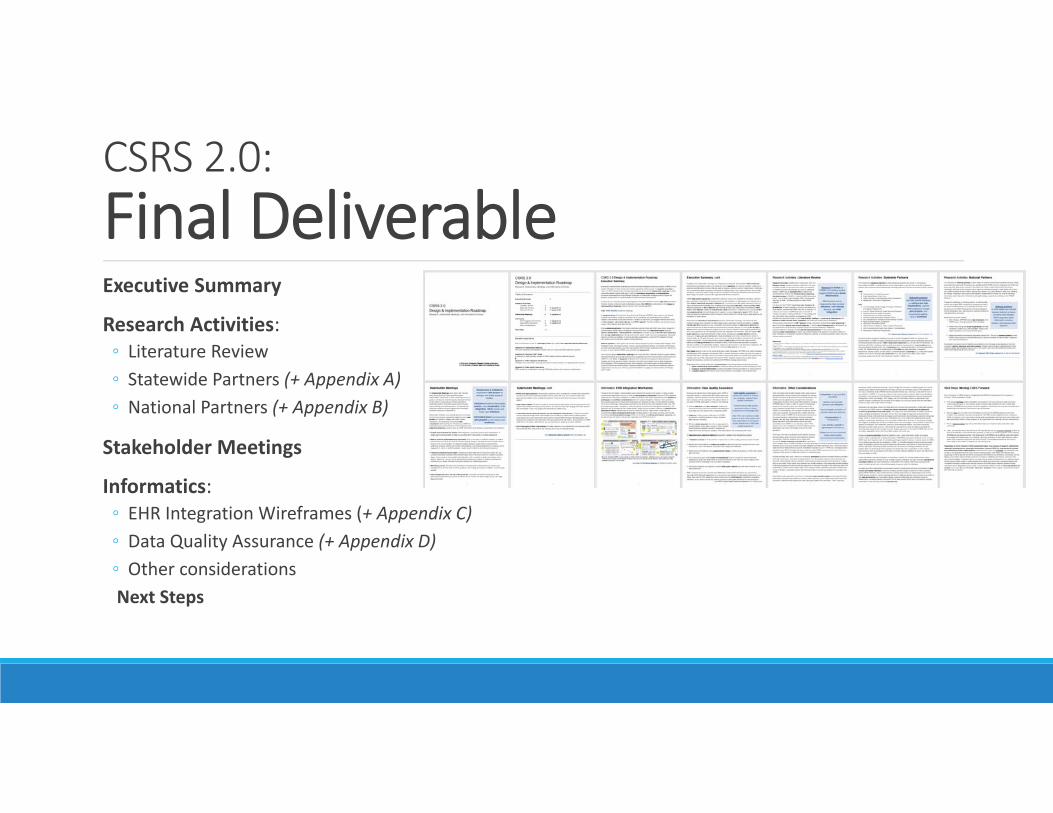
CSRS 2.0:Final DeliverableExecutive Summary
Research Activities: ◦ Literature Review◦ Statewide Partners (+ Appendix A)◦ National Partners (+ Appendix B)
Stakeholder Meetings
Informatics: ◦ EHR Integration Wireframes (+ Appendix C)◦ Data Quality Assurance (+ Appendix D)◦ Other considerationsNext Steps
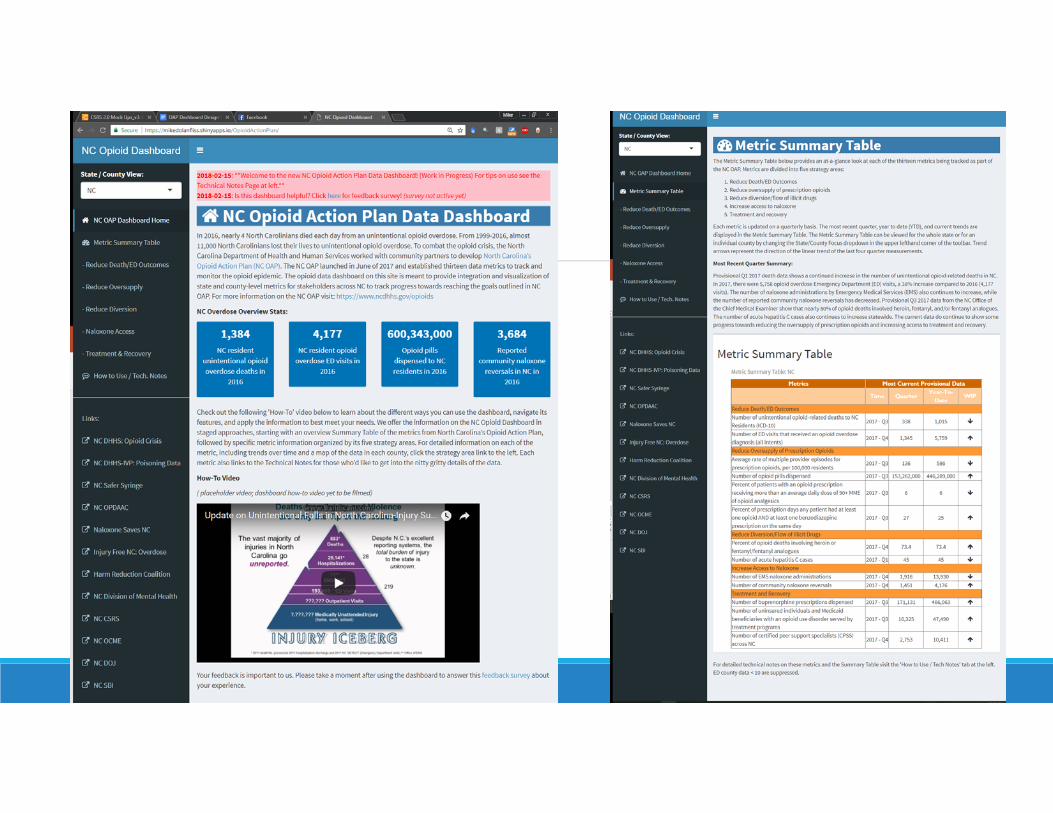
Opioid Action Plan:Data DashboardA SEPARATE INITIATIVE WITH NC DIVISION OF PUBLIC HEALTHHTTPS://INJURYFREENC.SHINYAPPS.IO/OPIOIDACTIONPLAN/
Data Dashboard:Why?
Opioid data spread across multiple longitudinal metrics, many currently unavailable / hard to get at the county level, the site of local intervention design.
Previously have excel doc w/ VBA to automate production of some county data, but looking for a more robust, online solution.
Desire to deeply test a system (in this case, R Shiny) for visualization. (State DHHS likely moving to Tableau.)
Extensible framework for future metric improvements and additions.
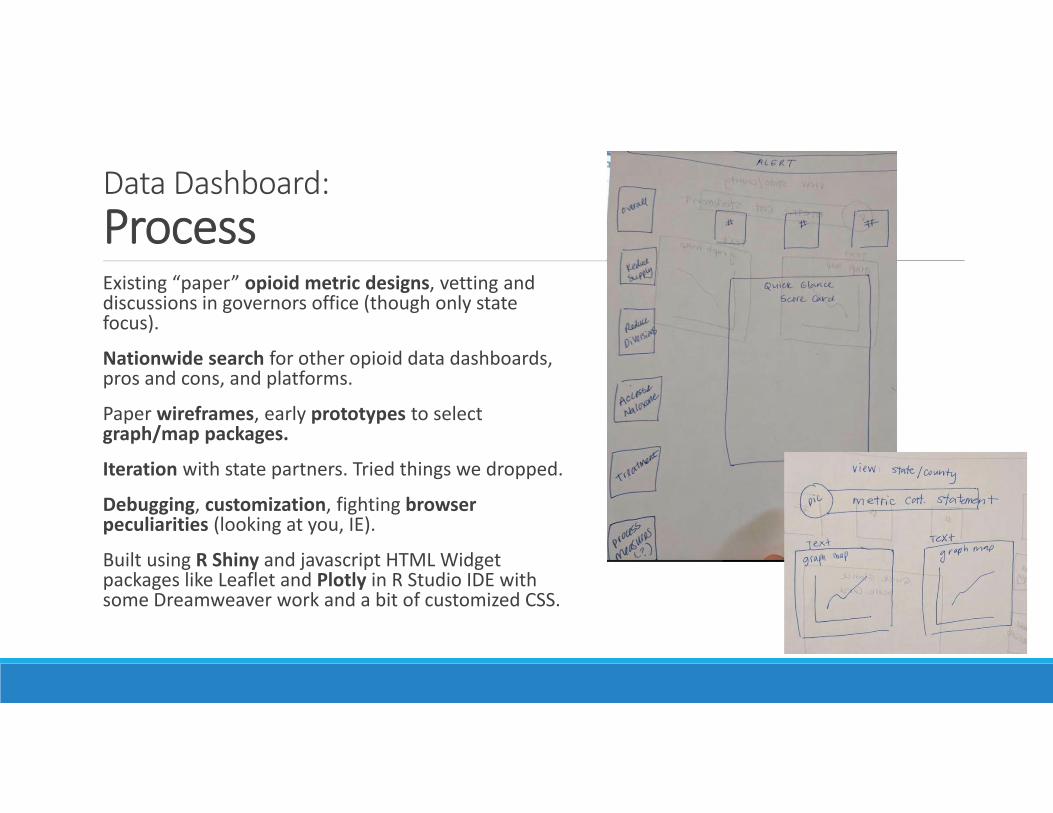
Data Dashboard:ProcessExisting “paper” opioid metric designs, vetting and discussions in governors office (though only state focus).
Nationwide search for other opioid data dashboards, pros and cons, and platforms.
Paper wireframes, early prototypes to select graph/map packages.
Iteration with state partners. Tried things we dropped.
Debugging, customization, fighting browser peculiarities (looking at you, IE).
Built using R Shiny and javascript HTML Widget packages like Leaflet and Plotly in R Studio IDE with some Dreamweaver work and a bit of customized CSS.
Data Dashboard:Challenges: Technical• Platform: R Shiny vs. Tableau vs...• Packages: Fighting with javascript, customizations (Plotly / Leaflet)• Functions vs. Customization: Flexibly accommodate “live” data• Pretty Printing / Formatting.• Coding overhead: This much R Shiny is challenging if not R fluent. No CMS, but use flexible google sheets based alerts & summaries.
• Partners / Data Specifics: Tried to standardize formats from multiple partners, but mixed success. That said, custom data munging is efficient in R. e.g. missingness, suppression.

Data Dashboard:Challenges: Epidemiology & Content• Suppression: small numbers, smoothing, data speed
• Data density: balancing • Trends: defining• Vintage: Data start, time lags
• Intervention Focus: What to DO about these metrics?
• Next Steps: Interventions, Strategies & Process Measures

Data Dashboard:Feedback & Iteration HighlightsDropped linear trend line, goals from graphs.
Added mark for OAP start‐date.
Consistent axes regardless of data availability to build data source fluency.
Many combinations of mouseovers and/or labels.
Over/under labeling: new users vs. repeat users (e.g. only need to see X once?…mouseover).
Created landing page to force navigation / reading, rather than drop users into data density (metrics or summary table) from get go.
Example discussion: trend icons in table. Example…

Data Dashboard:
Example GraphsDiscussion Example:
On a “last‐four‐points” definition of time‐local trend, Opioid Related Deaths are decreasing statewide.
But not when considering a statistical significance test for trend.
Options: More points? “No trend?” Different for each metric? Time already non‐standard…
Data Dashboard:
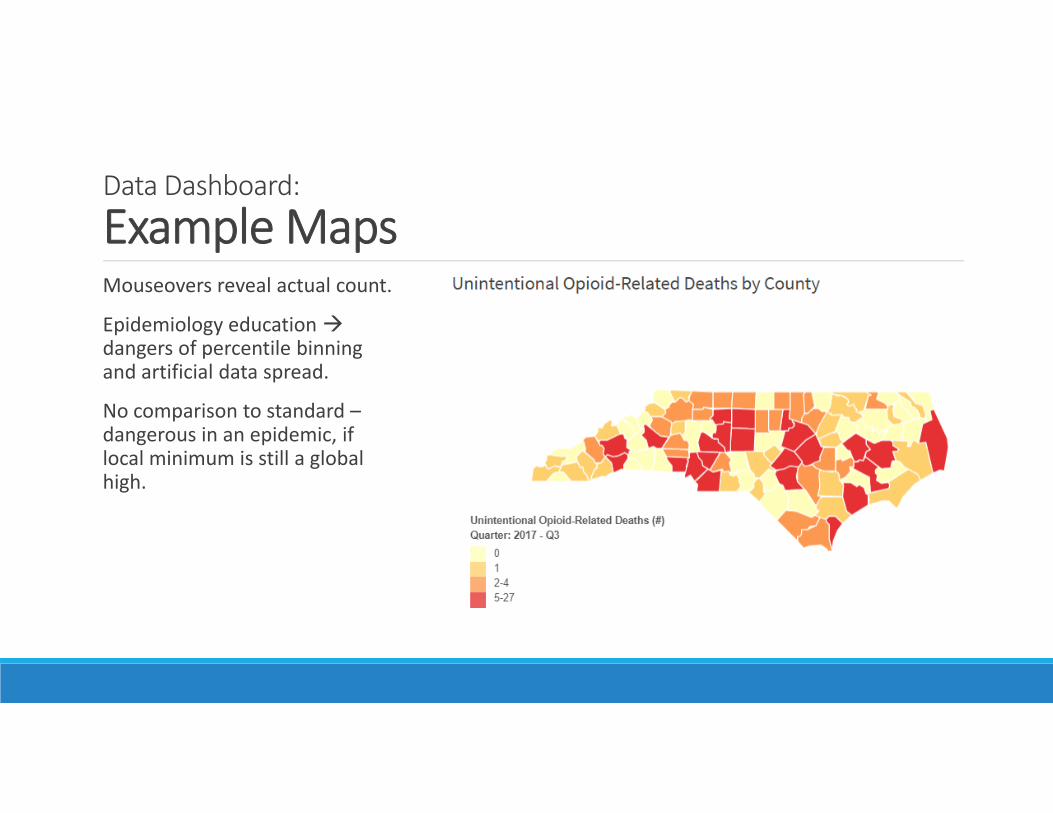
Example MapsMouseovers reveal actual count.
Epidemiology education dangers of percentile binning and artificial data spread.
No comparison to standard –dangerous in an epidemic, if local minimum is still a global high.