visualizing production related information in patria …
TRANSCRIPT
VISUALIZING PRODUCTION RELATED INFORMATION IN PATRIA
LAND OY
Bachelor’s thesis
Valkeakoski International Business
Spring 2020
Jennina Taavitsainen

ABSTRACT International Business Valkeakoski Author Jennina Taavitsainen Year 2020 Title Visualizing Production Related Information in Patria Land Oy Supervisor(s) Annaleena Kolehmainen
TIIVISTELMÄ Tämän opinnäytetyön tarkoituksena oli tutkia sisäistä informaation kulkua ja viestintää toimeksiantajayrityksessä. Tavoitteena oli luoda visuaalinen työkalu tuotannon informaation esittämiseen. Toimeksiantajana tässä opinnäytetyössä toimi Patria Land Oy, joka valmistaa ja huoltaa panssaroituja pyöräajoneuvoja sekä asejärjestelmiä. Teoreettinen viitekehys käsittelee yleisesti yrityskommunikaatiota, tiedonkulkua sekä visualisointia. Tutkimusmenetelmänä tässä työssä käytettiin laadullista tutkimusmenetelmää. Ensisijainen data muodostui toimeksiantajayrityksessä toteutetuista haastatteluista. Toissijainen data kerättiin kirjallisuudesta ja artikkeleista. Teoreettisen viitekehyksen ja haastatteluiden pohjalta, kirjoittaja loi lopputuotteena ja suosituksena yritykselle visuaalisen diashown esittelemään tuotannon tilannetta. Tämän diashown tarkoituksena on esittää mitkä ajoneuvot ovat tuotannossa ja milloin niiden olisi tarkoitus valmistua.
Avainsanat kommunikaatio, informaatio, tiedonkulku, visualisointi Sivut 46 sivua, joista liitteitä 11 sivua
ABSTRACT International Business Valkeakoski Author Jennina Taavitsainen Year 2020 Subject Visualizing Production Related Information in Patria Land Oy Supervisor(s) Annaleena Kolehmainen ABSTRACT
The purpose of this thesis was to research internal information flow and communication for the commissioning company. The objective was to create a visual tool for displaying production related information. The commissioning company in this thesis was Patria Land Oy, who manufactures and maintains armoured wheeled vehicles and mortar systems.
The theoretical background processes organizational communication, information flow and visualization in general. This research was conducted by using qualitative research method. Primary data was formed by interviews conducted in the commissioning company. Secondary data was collected from literature and articles. Based on theoretical background and interviews, the author created as an end product and recommendation a visual slideshow to demonstrate the stage of the production. The purpose of this slideshow is to display which vehicles are in production and when they should be finished.
Keywords communication, information, information flow, visualization Pages 46 pages including appendices 11 pages
CONTENTS
1 INTRODUCTION.............................................................................................................. 1
1.1 Research question and objectives ........................................................................ 1
1.2 Structure ............................................................................................................... 2
2 CASE COMPANY PATRIA ................................................................................................ 2
2.1 Patria Land ............................................................................................................ 3
3 THEORETICAL BACKGROUND ........................................................................................ 5
3.1 Communication and information flow ................................................................. 5
3.1.1 Communicational culture ........................................................................... 6
3.1.2 Communication management ................................................................... 8
3.1.3 Barriers of communication ......................................................................... 8
3.2 Organizational culture and knowledge .............................................................. 10
3.2.1. Knowledge-based organization ............................................................... 10
3.2.2 Tacit knowledge ....................................................................................... 11
3.2.3 Knowledge management ......................................................................... 11
3.2.4 Creating new knowledge .......................................................................... 13
3.2.5 Continuous improvement ........................................................................ 15
3.3 Change management.......................................................................................... 16
3.3.1 Resistance to change ................................................................................ 18
3.4 Visual communication ........................................................................................ 19
4 RESEARCH .................................................................................................................... 20
4.1 Methods of working ........................................................................................... 20
4.2 Interviews ........................................................................................................... 21
5 ANALYSING THE INTERVIEWS ...................................................................................... 22
5.1 Management ...................................................................................................... 23
5.2 Production .......................................................................................................... 24
5.3 Project Management Office and Services .......................................................... 25
5.4 Technical possibilities for visualization .............................................................. 26
5.5 Overview ............................................................................................................. 27
6 RECOMMENDATIONS .................................................................................................. 28
6.1 End result ............................................................................................................ 28
6.2 Future actions ..................................................................................................... 31
7 CONCLUSION ............................................................................................................... 32
REFERENCES .................................................................................................................... 34
Appendices Appendix 1 Interview for Vice President, Operations Appendix 2 Interview for Vice President, Services Appendix 3 Interview for Workshop Managers (2 persons) Appendix 4 Interview for Director, Production Appendix 5 Interview for Production Planner Appendix 6 Interview for Sourcing Specialist Appendix 7 Interview for Director, Project Management Office Appendix 8 Interview for Sales Manager Appendix 9 Interview for Information Technology Specialist Appendix 10 Power Point- demonstration

1
1 INTRODUCTION
The amount of information flow in companies can be massive. Some employees might drown from information flow and emails while others are searching for relevant information. Information can be shared in many ways, but is it easily available when needed? Is the information simple to understand and easy to find? Every company aims towards optimal productivity. Key concepts relating towards that goal are also communication, information sharing and receiving as well as knowledge. If information and knowledge are not widely available inside the company, the production capability could suffer. Finding relevant information from information flow could be resource consuming.
In a large company where several different projects might be ongoing at the same time, some information might get lost or be known only by few employees. General information should be available to all employees, not only for certain project teams. With more visibility, more knowledge can be shared within the company. Actions can be better planned and predicted. This thesis studied internal information flow in the case company Patria Land Oy. This information flow is related to general production related information. The objective of this thesis was to find a way to visualize production related information and to make it easily available internally in the case company.
1.1 Research question and objectives
The purpose of this thesis was to find out how internal information flows now in Patria Land and how it could possibly be developed. Which factors effect information flow and how it could be more efficient? The primary research question of this thesis is; “How could production related information flow be improved and visualized in Patria Land Oy?” The goal was to develop a new tool for visualizing production related information, so that the employees and the management of the case company could have an easy and efficient way of obtaining more knowledge about the current situation of production. Inside the case company Patria Land, there was not an actual problem with information flow or internal communication, but instead the objective of

2
this research was to find a new tool that could be utilized in information sharing. As an outcome the commissioning company wished for a visual way of displaying general information about the production and different stages of projects. When researching this internal information flow, it is important to realize what the sender wants to achieve and who the message concerns. Within production related information, forecasting the future projects is also important. The target group for this thesis were the personnel of Patria Land Oy. The objective of this study was to find ways for more effective internal information flow that can benefit all, or at least as many as possible of the company’s departments. An efficient way of general information displaying could provide better methods of working and a wider internal knowledge base. The benefits could be for present employees as well as new employees entering the case company.
1.2 Structure
After introducing the objectives of the research and information about the case company, this thesis processes theoretical background on how information and communication could be handled in an organization. Key concepts introduced are for example communication and knowledge. In the research part employees and management of the case company are interviewed, to find out how information flows in the company now and how it could be improved from their point of view. Which tools do they prefer for sharing and viewing information? By analysing these answers and opinions, this thesis introduces as a recommendation a tool for information visualization. Lastly these findings are concluded. This thesis follows the APA6 referencing guidelines.
2 CASE COMPANY PATRIA
Patria is a Finnish company providing international defense, security and aviation products, life cycle support services, pilot training and technology solutions. Patria’s main owner is the State of Finland (50,1 %) together with Norwegian Kongsberg Defence & Aerospace AS (49,9 %). Patria owns 50 % of Norwegian company Nammo. Together these three create a leading Nordic defense alliance. (Patria, 2017)
3
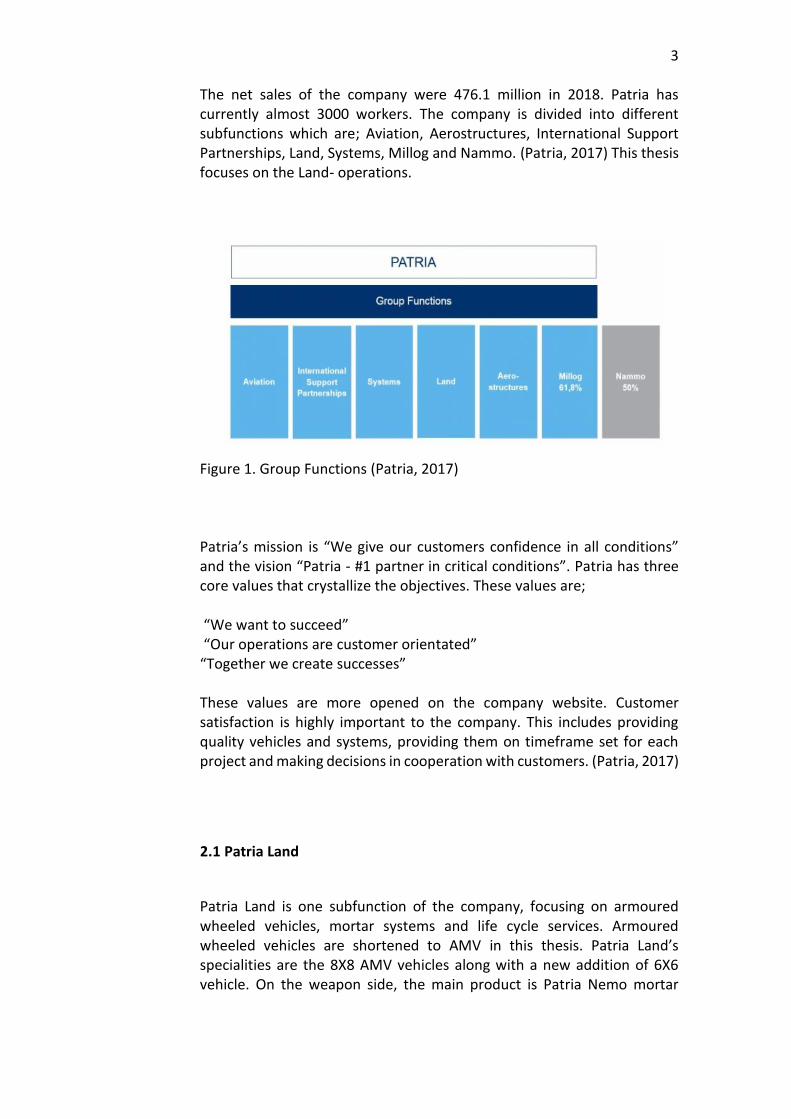
The net sales of the company were 476.1 million in 2018. Patria has currently almost 3000 workers. The company is divided into different subfunctions which are; Aviation, Aerostructures, International Support Partnerships, Land, Systems, Millog and Nammo. (Patria, 2017) This thesis focuses on the Land- operations.
Figure 1. Group Functions (Patria, 2017) Patria’s mission is “We give our customers confidence in all conditions” and the vision “Patria - #1 partner in critical conditions”. Patria has three core values that crystallize the objectives. These values are; “We want to succeed” “Our operations are customer orientated” “Together we create successes” These values are more opened on the company website. Customer satisfaction is highly important to the company. This includes providing quality vehicles and systems, providing them on timeframe set for each project and making decisions in cooperation with customers. (Patria, 2017)
2.1 Patria Land
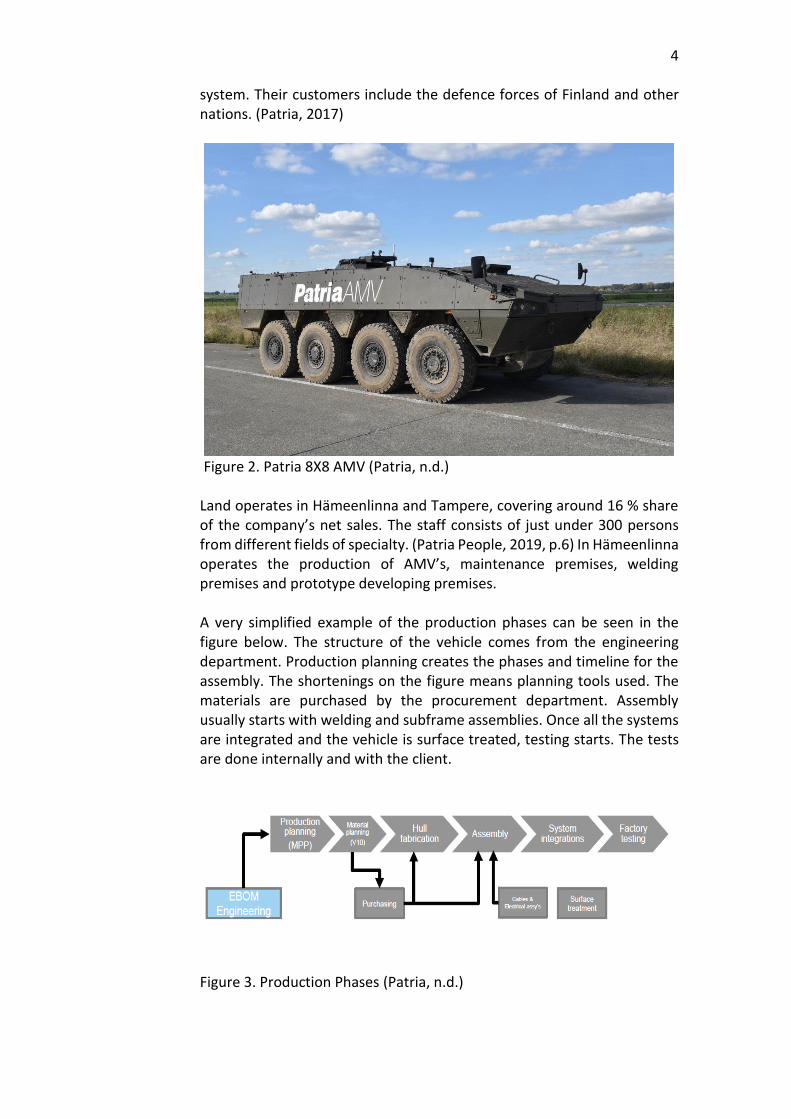
Patria Land is one subfunction of the company, focusing on armoured wheeled vehicles, mortar systems and life cycle services. Armoured wheeled vehicles are shortened to AMV in this thesis. Patria Land’s specialities are the 8X8 AMV vehicles along with a new addition of 6X6 vehicle. On the weapon side, the main product is Patria Nemo mortar
4
system. Their customers include the defence forces of Finland and other nations. (Patria, 2017)
Figure 2. Patria 8X8 AMV (Patria, n.d.)
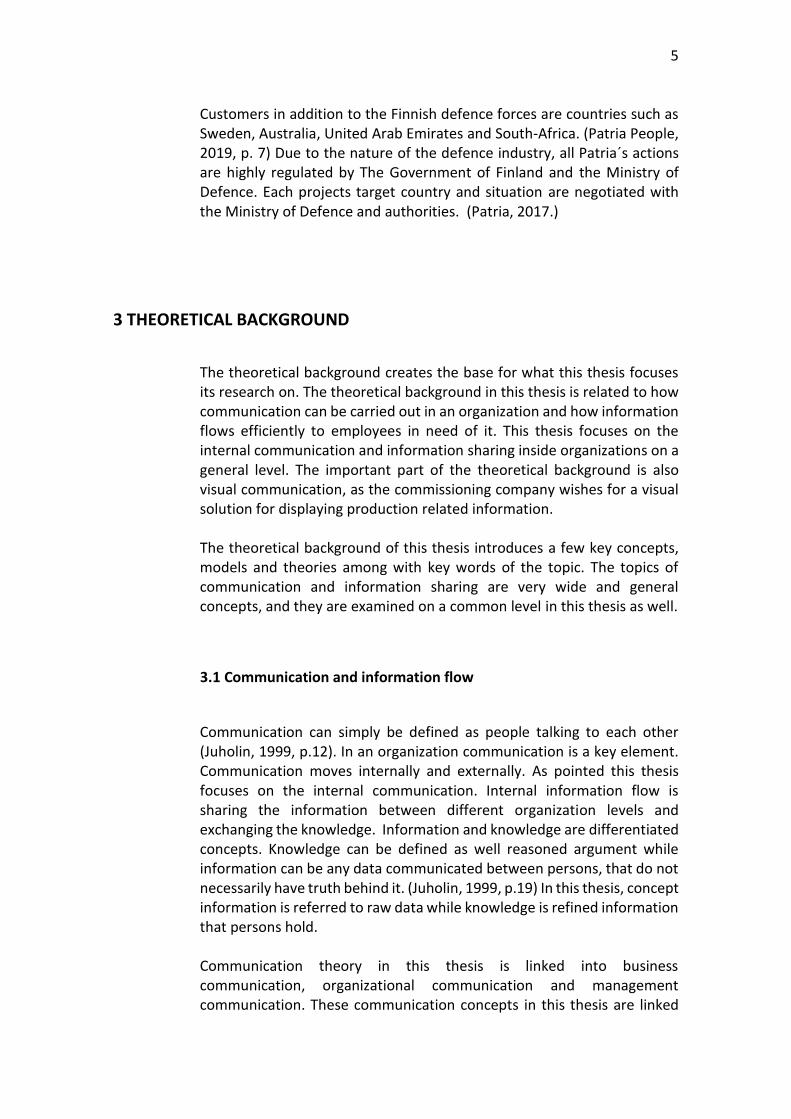
Land operates in Hämeenlinna and Tampere, covering around 16 % share of the company’s net sales. The staff consists of just under 300 persons from different fields of specialty. (Patria People, 2019, p.6) In Hämeenlinna operates the production of AMV’s, maintenance premises, welding premises and prototype developing premises. A very simplified example of the production phases can be seen in the figure below. The structure of the vehicle comes from the engineering department. Production planning creates the phases and timeline for the assembly. The shortenings on the figure means planning tools used. The materials are purchased by the procurement department. Assembly usually starts with welding and subframe assemblies. Once all the systems are integrated and the vehicle is surface treated, testing starts. The tests are done internally and with the client.
Figure 3. Production Phases (Patria, n.d.)
5
Customers in addition to the Finnish defence forces are countries such as Sweden, Australia, United Arab Emirates and South-Africa. (Patria People, 2019, p. 7) Due to the nature of the defence industry, all Patria´s actions are highly regulated by The Government of Finland and the Ministry of Defence. Each projects target country and situation are negotiated with the Ministry of Defence and authorities. (Patria, 2017.)
3 THEORETICAL BACKGROUND
The theoretical background creates the base for what this thesis focuses its research on. The theoretical background in this thesis is related to how communication can be carried out in an organization and how information flows efficiently to employees in need of it. This thesis focuses on the internal communication and information sharing inside organizations on a general level. The important part of the theoretical background is also visual communication, as the commissioning company wishes for a visual solution for displaying production related information. The theoretical background of this thesis introduces a few key concepts, models and theories among with key words of the topic. The topics of communication and information sharing are very wide and general concepts, and they are examined on a common level in this thesis as well.
3.1 Communication and information flow
Communication can simply be defined as people talking to each other (Juholin, 1999, p.12). In an organization communication is a key element. Communication moves internally and externally. As pointed this thesis focuses on the internal communication. Internal information flow is sharing the information between different organization levels and exchanging the knowledge. Information and knowledge are differentiated concepts. Knowledge can be defined as well reasoned argument while information can be any data communicated between persons, that do not necessarily have truth behind it. (Juholin, 1999, p.19) In this thesis, concept information is referred to raw data while knowledge is refined information that persons hold. Communication theory in this thesis is linked into business communication, organizational communication and management communication. These communication concepts in this thesis are linked
6
into organizational business environments. Communication is based on organizations’ goals and it should support reaching these goals in all actions. (Juholin, 1999, p.22) Communication is partially regulated within certain norms. These norms should also drive towards the goal-oriented communication. (Juholin, 1999, p.25) In an organization communication responsibility is usually shared within employees’ competences. Communication is related to position and tasks. External communication might have mutual rules, but internal communication ways and contents may vary. It is important to remember that external communication influences company’s image and marketing. External communication is created with internal decisions. (Juholin, 1999, p.30) Internally information flows usually either face-to-face in meetings, through documentation and newsletters or electronically through email, phone or via internet. (Juholin, 1999, p.36) It is important to determine the purpose of what for the information is needed and to whom. Channel-orientated approach helps to determine to whom the information is pointed. Information culture in an organization can have long traditions and developing these learned patterns may be challenging. (Juholin, 1999, p.36) Organization could have set rules and norms for information sharing but individuals such as employees might experience these operating models differently. The danger is that information is too much narrowed down and simplified. Communication and information flow are usually considered as important factors in an organization. However, verbal communication and messages are overestimated, and other ways of communication are forgotten. (Juholin, 1999, p.53) British professor John Smythe believed that the purposes of internal communication should not be evaluated on the tools used but based on how well people understand the message coming from these different tools. More tools do not necessarily mean more information. It is important to recognize valid information from the information flow. Valid information differs on different sections of a company. (Juholin, 1999, p.38)
3.1.1 Communicational culture
Communication is linked into organization’s nature and culture. Culture is the way the organization functions. It is not necessarily conscious actions, but more formed over time. Culture reflects organizations environment. It is affected by the field of operation and goods or services produced. (Juholin, 1999, p.62) In this case company the defense industry has its own culture. It might be easier for new employee to detect cultural characteristics. Long time employees are so familiar with organizations’
7
culture that small nuances do not stand out. (Juholin, 1999, p.62) Communication strategy’s purpose is to determine the strategic and operative plans for the communication. Strategic planning consists of determining the purpose and tasks of communication, the basic principles used, and goals aimed. Operative plans determine the center of attention and actions chosen. (Juholin, 1999, p.106) Communication covers the general information flow, but also more specifically for example project information flow, like in this thesis. This means specific project related information that might not even be relevant to all organizational levels. Communication circulates from intrapersonal to interpersonal communication. This means that a person first communicates internally as themselves by having their own thoughts and ideas, and then exchanges these thoughts to other members of the organization. This cycle is ongoing as a person processes interpersonal communication data also before and after receiving it. (Carter, 2012, p.31) According to Carter (2012) communication happens through four steps. These steps are: 1. Communicator develops an idea that she/he wants to deliver. 2. Idea is delivered through a channel. This channel can be for example a meeting or a text message. 3. Recipient receives the message. Assumption is that the recipient understands the message delivered and moves on to phase number 4. Sending a response or feedback. This is highly simplified version of communication model and not all the elements occur in all communication exchange situations. (Carter, 2012, p.32) The most common ways of communication are oral or written communication. There are advantages and disadvantages in both ways. Oral communication could be defined more efficient for quick answering, opportunity for social interaction and spontaneous discussion. Facts and misunderstandings can be corrected immediately, and non-verbal communication can also be seen. On disadvantage point of view, participants must be in the same location, no data is saved unless meetings are recorded, facts can be lost or forgotten, and communication can be overly emotional. Written communication in turn is a tool for clarifying, document sharing and for more objectively communication. It gives the opportunity to plan the message and format beforehand. Written communication creates more control. Documentation is not related to space or time and documents are saved for later use. On the contrary, written communication has time lapses, messages might not be delivered, or might get misunderstood and non-verbal behavior is not seen. (Carter, 2012, p.114-115) Information can flow differently inside an organization. Information flow can be upward or downward. It may also be diagonal or horizontal. The structure and size of the company determines a lot of how information travels. In downward information flow the information travels from management level to lower levels of employees. This kind of information can be for example announcements to all staff members. This kind of

8
information does not usually require answering back. In upward information flow, information comes from lower levels to upper levels, for example like in this case from production to management. This may happen for example through reports or meetings. (Lumen Principles of management, n.d.) In this case company, important ways of information flow are also diagonal and horizontal information flow. In diagonal model communication happens inside the same department and in horizontal model information travels from department to another. (Lumen Principles of management, n.d.) For example, a purchaser communicates with other members of purchasing team, but also shares information with production planners.
3.1.2 Communication management
Communication is a key part in management functions. An organization’s management department does not only gather information, but also shares it by setting vision and strategies. According to Leif Åberg, strategic management is connected into communication in three different ways; through vision, communication of changes and sounding, that means messages and information gathered in order to change the strategy and vision. (Juholin, 1999, p.86) The management department is reliant on information flow coming from the production and other departments. Management and communication are linked into each other but differentiated. Communication creates understanding towards actions and goals of the organization, whereas management gets people working towards these goals. (Juholin, 1999, p.86) Goal of management communication is to get employees understand the function and purpose of their work and how it gets the whole organization closer to the goals. The main objective of organizational communication is usually seen as management giving information to employees and the information flow is seen as one-way task. Recipients are seen passive and the actual communication between management and employees is missing. The challenge is to get communication between these actors more interactive. (Juholin, 1999, p.88)
3.1.3 Barriers of communication
“The single biggest problem in communication is the illusion that it has taken place” -George Bernard Shaw. (Wise Old Sayings, n.d.)
9
As explained earlier, organization sets goals for internal and external communication. Organizations’ succeed in communication can be evaluated by these goals. Usually some kind of measurements are taken to see if communication is succeeding or failing. (Juholin, 1999, p.162-163) In communication messages are not always received or understood correctly. Problems can be technical or human. Many employees categorize incoming messages by how important or urgent they are. (Juholin, 2015, p.46-47) Messages can be interpret differently in different departments or by different individuals. (Juholin, 2015, p.48) Some news might be delicate or problematic. Delivering these messages requires careful approach. Even though, delicate messages need to be forwarded honestly. If delicate messages or problems are ignored communication suffers and critical information can get lost. Consequences can increase for the company. (Juholin, 1999, p.189) Distractions can interfere communication. Unexpected phone calls, messages or social encounter as well as music, noise and movement can affect individuals’ concentration skills. Unpleasant working space or atmosphere are also key factors. (Lunenburg, 2010) Psychological barriers consist of emotions, sincerity, roles and empathy. Employees need to know their roles and responsibilities in order to act correctly. Empathy skills can help individuals understand other’s feelings. But overly emotional approach can distort the actual meaning of the message. Sincerity in turn creates the foundation of communication. False communication does not lead to rightful outcomes. (Lunenburg, 2010) Semantics, meaning how the words are formulated, can affect the concept of the message. As pointed, different words might mean different to different actors. (Lunenburg, 2010) Language barriers can occur with foreign speakers, but also with persons who speak the same language. Differences between departments, generations, genders or different backgrounds can affect. (Communication Skills Training, 2012) The subject of the message can be uninteresting or unpleasant to the receiver. These kinds of barriers could be defined as attitudinal barriers. Communication can be affected by attitude, conflicts, management issues, motivational problems or poor information. (Phicare, n.d.) Assumptions made before hearing all the facts can affect decision making. (Communication Skills Training, 2012) Technical barriers are directly related to costs. New systems and developing options consume resources. Solutions develop fast and require time and effort. System failures are possible. Less time on face-to-face interaction can be a barrier or different option for communication. (Toppr, n.d.)

10
Many barriers of communication can be solved and improved. Communication skills can be taught. Use of simple language, questions and feedback can improve communication both internally and externally in the organization. (Phicare, n.d.) Reasons behind problems can be figured and planning on how to improve or avoid them in the future can be done. (Juholin, 1999, p.188)
3.2 Organizational culture and knowledge
Organization’s internal process for information management helps on decision making, information handling, information providing and problem solving. Even this process is internal, it uses external information as a resource. With interaction internal and external information flow creates the base for knowledge management in organization. (Huotari, Hurme & Valkonen, 2015, p.54)
3.2.1. Knowledge-based organization
In a knowledge-based organization, knowledge and information are key resources. Work is conducted based on information. Information forms the products produced and creates the foundation on operations. Same as in communication, these organizations can connect on intraorganizational level and in interorganizational level, meaning both internally in the organization and as well as with other organizations or departments. (Huotari et al., 2015, p.54) In this case Patria Land creates its own intraorganizational network and Patria as a company including all the departments introduced in chapter two, creates interorganizational network. In knowledge-based organization knowledge is linked into employees. Employees may change organizations or retire. Therefore, managers need to identify that knowledge is not a disappearing resource but is highly linked into persons who distribute it. (Dalkir, 2011, p.2) By using individuals’ knowledge, ideas and creations the organization can create a base for better functioning company. With these new ideas and innovative approaches, company can add value to existing products or services as the objective of management knowledge is. (Dalkir, 2011, p.3)

11
3.2.2 Tacit knowledge
Inside an organization can be identified tacit knowledge. Tacit knowledge is “silent” knowledge, that is not directly detected or shared. It can be physical skills or mental models. These skills are a sum of experiences, knowledge and learned behavior. Tacit knowledge is linked into organizational culture and interaction. Even a person itself might have difficulties recognizing this kind of information, so the lack of sharing might not be intentional. (Huotari et al., 2015, p.66-67) Sharing tacit knowledge demands that individuals are truly willing to share the information to others. Sharing tacit knowledge in an organization is meaningful for reaching mutual goals. Sharing tacit knowledge requires interaction with other members of the organization. (Huotari et al., 2015, p. 126) Tacit knowledge can create concepts that are valuable in future actions. Creating these concepts can help tacit knowledge to become more explicit knowledge. (Huotari et al., 2015, p.126) Explicit knowledge is formal and defined knowledge, that is available to individuals, such as company’s code of conduct. (Huotari et al., 2015, p.68). As mentioned, tacit knowledge is also linked into cultural knowledge. Cultural knowledge is formed with understandings, feelings and estimations on how things work in the organization. Values and assumptions direct cultural knowledge. Cultural knowledge is formed by the individuals working in the organization. (Huotari et al., 2015, p.69) Both tacit and cultural knowledge are present in everyday activities without being noticeable. Quality and quantity are methods of measuring benefits. Both can be used as individual methods, but also as complementing each other. Quality is affected when adding quantity and vice versa. Quality and quantity are in interaction together, same as tacit and explicit knowledge. (Kesti, M. 2005, p.60)
3.2.3 Knowledge management
Knowledge management leads company towards a better functioning organization by creating value to existing products and developing new products or services. Knowledge management aims for sustainable competitive advantage, that develops products or services constantly. These actions long for constant updating of existing knowledge but also creating new knowledge. (Huotari et al., 2015, p.134) It is important to

12
remember in this section that the concepts of knowledge and information are separated. Information management is controlling the information, while knowledge management is a concept of strategic management that is based on information. (Huotari et al., 2015, p.135) This thesis focuses on the knowledge management and views it as a part of an organization’s strategic operations and how it affects the production. Knowledge management can be introduced as a process, that was first demonstrated by researcher Chun Wei Choo in 1998. This process first determines the need for information, moving on to information gathering, developing this information into knowledge and then distributing it. (Huotari et al., 2015, p.56) According to Choo knowledge is needed in organizations in especially when decisions are made, or situations solved. Existing knowledge is also important when creating new knowledge. On actual situations the model of knowledge management is not always so straight forward. Knowledge management needs to recognize the interaction between people and the operating environment. (Huotari et al., 2015, p.60)
Knowledge management uses information from prediction phase to decision making. It is also connected to other organizational functions, such as for example human resources department. The information that these departments handle transfers into knowledge that can be used in knowledge management. (Huotari et al., 2015, p.135) Knowledge management aims to maintain the status of what the company has reached. All existing knowledge, as well as new knowledge must be within the company’s strategy and values. By these aims the company tries to develop and maintain its production towards more sustainable operations. (Huotari et al., 2015, p.138) Influential organization needs to recognize valuable information from the information flow, that contributes the organizations’ strategy. Written and formal information and tacit knowledge that exists only on employees are separated. Knowledge management cycle combines these together. (Dalkir, 2011, p.32) Key models for knowledge management could be named The Meyer and Zack model, McElroy model, Wiig model and Bukowitz and Williams model. (Dalkir, 2011, p.33) The Meyer and Zack model indicates that findings from the actual products can be utilized in managing the knowledge advantages. Thorough exploring of the physical products can benefit the knowledge management cycle and by that help generate new information and value to products. Valuable knowledge can be utilized in action immediate. (Dalkir, 2011, p.33) The McElroy model presents that knowledge life cycles includes knowledge production and knowledge integration that are related to memory, beliefs, learned patterns and organizational environment.

13
Knowledge is in both individuals and in groups. With these two actors the base of company’s knowledge is created. Knowledge usage in the company can either work or fail. (Dalkir, 2011, p.42-43) According to the Wiig model, organization must have a product or a service, customers, resources and capacity to work. Knowledge is an asset that drives the company to act towards productivity and profits. According to Wiig, the better the knowledge is, the higher the changes are for the employee to succeed in his/her tasks. Succeeding acquires the best knowledge possible. In Wiig model the knowledge life cycle stages from knowledge building, knowledge holding, knowledge pooling to knowledge applying. (Dalkir, 2011, p.45-46) The Bukowitz and Williams cycle characterizes on how organizations can maintain, storage and exploit knowledge in order to create value. Knowledge usage is related to the current situation of the markets and macro environmental changes. The focus is more on long-term processes of how to utilize knowledge. (Dalkir, 2011, p.38) These four knowledge management cycles have different terminology and approaches to knowledge management. Integration to organizational environment is related into company’s goals and strategy. (Dalkir, 2011, p.57)
3.2.4 Creating new knowledge
Ikujiro Nonaka presented in 1994 the so called “SECI” – process for knowledge creation. With this model Nonaka wanted to justify that organizations are not just handling information but creating new knowledge all the time with interaction. In the SECI -process tacit knowledge refines into explicit knowledge, keeps on progressing and then transfers back to tacit knowledge again. (Huotari et al., 2015, p.108) SECI – process moves on ongoing cycles and proceeds from one level to another. As an example, knowledge can come from individual employee to the whole department. (Huotari et al., 2015, p.109)
14
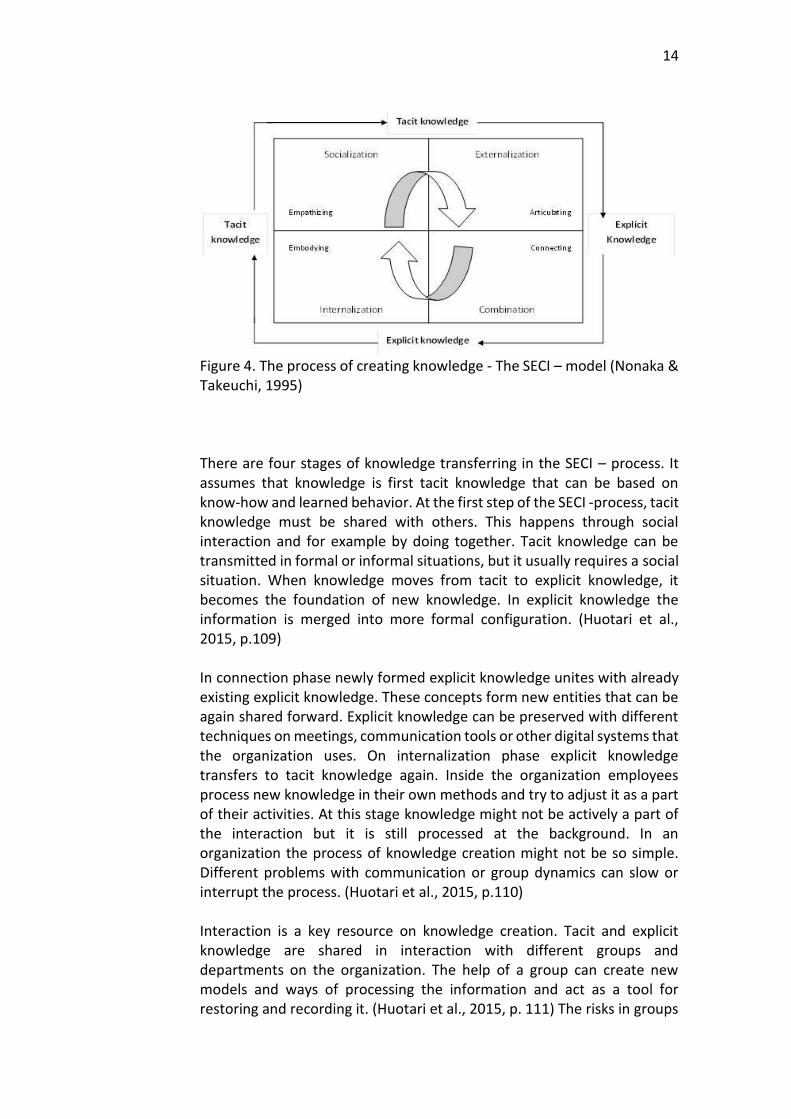
Figure 4. The process of creating knowledge - The SECI – model (Nonaka & Takeuchi, 1995)
There are four stages of knowledge transferring in the SECI – process. It assumes that knowledge is first tacit knowledge that can be based on know-how and learned behavior. At the first step of the SECI -process, tacit knowledge must be shared with others. This happens through social interaction and for example by doing together. Tacit knowledge can be transmitted in formal or informal situations, but it usually requires a social situation. When knowledge moves from tacit to explicit knowledge, it becomes the foundation of new knowledge. In explicit knowledge the information is merged into more formal configuration. (Huotari et al., 2015, p.109) In connection phase newly formed explicit knowledge unites with already existing explicit knowledge. These concepts form new entities that can be again shared forward. Explicit knowledge can be preserved with different techniques on meetings, communication tools or other digital systems that the organization uses. On internalization phase explicit knowledge transfers to tacit knowledge again. Inside the organization employees process new knowledge in their own methods and try to adjust it as a part of their activities. At this stage knowledge might not be actively a part of the interaction but it is still processed at the background. In an organization the process of knowledge creation might not be so simple. Different problems with communication or group dynamics can slow or interrupt the process. (Huotari et al., 2015, p.110) Interaction is a key resource on knowledge creation. Tacit and explicit knowledge are shared in interaction with different groups and departments on the organization. The help of a group can create new models and ways of processing the information and act as a tool for restoring and recording it. (Huotari et al., 2015, p. 111) The risks in groups
15
are incorrect information and errors on groups’ memory. These errors need to be corrected immediately in order to prevent false information from spreading. (Huotari et al., 2015, p.112) Even in interaction and knowledge sharing the importance of individual knowledge can be detected. Every individual brings their own knowledge into the group activities. The load and accessibility of this knowledge affects the groups’ knowledge. With information sharing more is not always better. Large amount of shared information can be difficult to process and handle. (Huotari et al., 2015, p.115) When individual knowledges are joined, the foundation of groups’ knowledge is created. This group knowledge should be at the use of all group members. (Huotari et al., 2015, p.116) One group can be for example one department of the organization. How knowledge is now treated in the group is affected by the size of the group, group dynamics, purpose of the group, power between the relationships and the interaction within the group. (Huotari et al., 2015, p.116) When creating new knowledge, the focus should be on the intention. How can this knowledge benefit the organization and the support its strategy? (Huotari et al., 2015, p.129) Key concepts are also flexibility and variety for the organization to meet the changing circumstances. (Huotari et al., 2015, p.130)
3.2.5 Continuous improvement
Continuous improvement is a way for individuals and companies to improve and gain more competitive advance. Continuous improvement desires for innovative ideas and creativity to push outside the usual operating models and in this case, knowledge sharing models. (Sydänmaanlakka, 2009, p.13) Individuals and companies live on a constant change on a work environment. Changes can be technological, economic, political or social. Due to these changes, many companies feel the need for continuous improvement. (Sydänmaanlakka, 2009, p.25-26) Changes inside the company need to happen rapidly, but also externally company should be one step ahead of its competitors. Concepts usually combined to continuous improvement are innovation management, continuous learning, collecting, forming and modifying information and innovative strategic thinking. (Sydänmaanlakka, 2009, p.58-59) Innovation management’s goal is to create and support new innovations and innovative actions on companies. Innovations bring new value to the company by changes and improvements. Innovations can also be viewed as processes that lead to these new products services. Innovativeness is the ability to create innovation. This is a desired skill for individuals, teams and organizations. (Sydänmaanlakka, 2009, p.61)
16
However, innovation management is not only about leading innovation. It can be seen as more flexible concept that includes for example managing human resources, resources on a general level and strategic visioning. (Sydänmaanlakka, 2009, p.61) Continuous learning should also happen on individual, team and organization levels. The objective is to implement and control learning on all of these levels. Learning is the base foundation of improvement. On individual level, employees should seek and question information and operating models. On a team level, learning should be shared. And on organizational level new information and operating models should be implemented. (Sydänmaanlakka, 2009, p.61-62) Inside large organizations the problem can be with massive information flows. How to control, divide and manage large amount of data? Not all data can be no longer collected and used, due to its massive amount. Therefore, it is important to be able to determine and collect relevant information from information flow. Collecting, forming and modifying information has become more important. (Sydänmaanlakka, 2009, p.41)
3.3 Change management
In this thesis the whole structure of the case company is not changing. There are no dramatical or major changes required, but the objective is to increase efficiency and improve existing methods. Therefore, change management can also be introduced and implemented in this case. Change in business environments is inevitable. Systems, approaches and technologies change and evolves. World in the future will be different than in today. The key is to prepare for the changes. By developing organization and its functions, survival and success capabilities increase. Change management’s objectives are to plan a strategy to recognize problem areas, make a diagnosis and implement actions in order to improve problem areas. (Brown, 2014, p. 3)

17
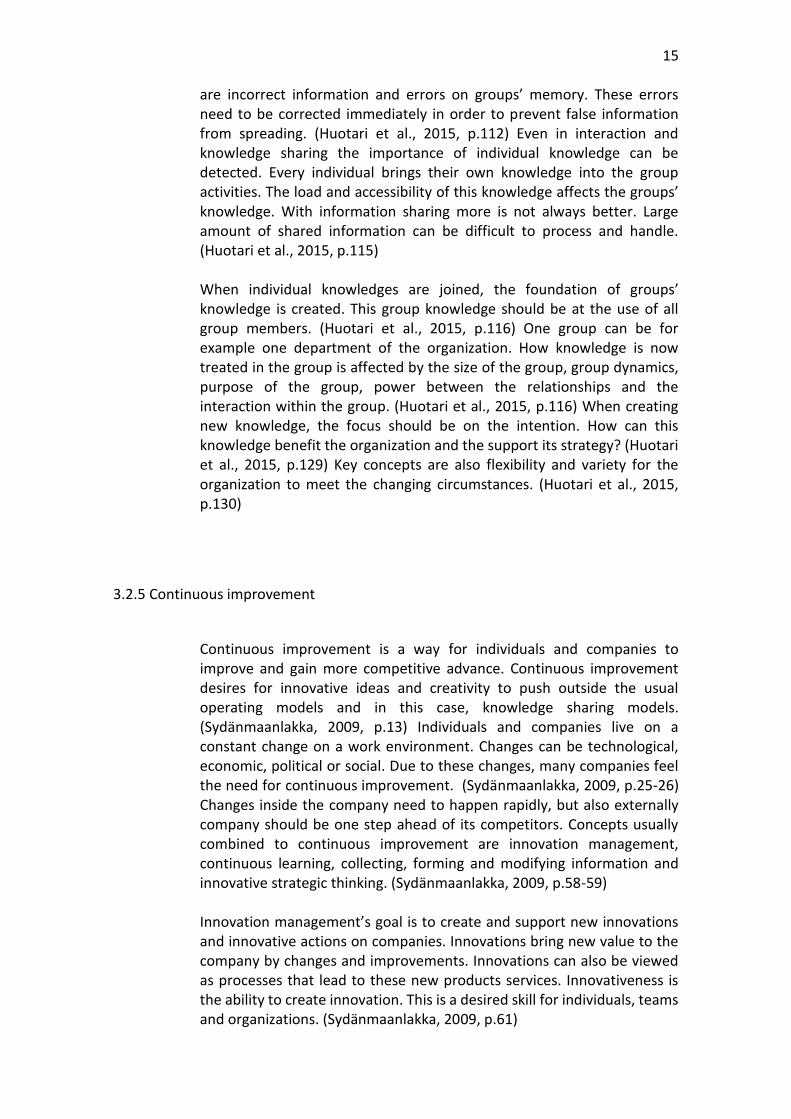
Figure 5. Organizational Development’s Five Stages. (Brown, 2014, p.13) Organizational development and change management are long-term processes that aim towards continuous improvement. On an organizational development process, 5 stages can be recognized. Stage 1, anticipating a need for change means that before a change occurs, organization needs to be able to approve and recognize changes. Changes may occur due to different circumstances such as for example competition, technological changes, legal changes or social changes. (Brown, 2014, p.13) Stage 2, developing the practitioner-client relationship forms the change and the solution. The client in this stage is the organization in need of a change or overgoing a change. Practitioner may interfere the change process. Stage 3 is the diagnostic process in which practitioner has interfered and the data collecting begins. This data is analyzed in order to find a problem-solving solution. (Brown, 2014, p.13-14) On stage 4 the analyzed data and interventions lead to actions and strategies that are trying to increase the organizations productivity and efficiency. By setting goals and development roles, stage 4 is usually the stage that consumes most time and resources. (Brown, 2014, p.14) On stage 5 self-renewal, monitoring and stabilizing begins. When changes and solutions are implemented the task is to monitor success or possible new
18
problems. Stage 5 monitors how the implemented change strategy has worked and how the actions should be continued. (Brown, 2014, p.14) The role of managers in change management is highly important. Their responsibility is to create an environment that approves and adapts change. Change needs to be seen as a positive outcome. The size of the change and its effects has a large role in this process. (Brown, 2014, p.64) In an organization where culture is deeply rooted, new techniques and methods might be hard to implement. Employees might resist to change and learning new. (Brown, 2014, p.65) Important tools for helping on the change process are information, support and resources provided. (Brown, 2014, p.69-70)
3.3.1 Resistance to change
As mentioned in the previous chapter, employees might have resistance towards change. Employees might feel underestimated and overloaded of work and pressure. If things have previously worked in a certain way, why change them? Resistance may develop into conflicts. Five phases of resistance to change can also be identified. On phase 1 change is being introduced. Usually only a few persons recognize the need for change at this point. Resistance is usually high and at this point the change may continue or be overruled. (Brown, 2014, p.119) At phase 2 forces are identified. Change is now more widely recognized and discussed. However, on phase 3 direct conflict may occur. Conflict may occur between those who recognize the need of change and those who do not either recognize it or are against it. Phase 4 introduces residual resistance. The power keeps on shifting between resistance and those in favor of the change. On phase 5 change is established. It may seem that there is a battle going on based on the previous phases, but conflicts are usually small and quiet mostly verbal encounters. At phase 5 those against change are trying to approve it. (Brown, 2014, p.119) Organizational changes can be divided into four categories; 1. Minor change, low impact on the culture
2. Minor change, high impact on the culture
3. Major change, low impact on the culture
4. Major change, high impact on the culture
Based on the size of the change and the impact that it has to the organizational change, this thesis and its outcome may implement category 1, minor change and low impact on the culture. However, impacts
19
can be valued thoroughly only after the implementation of change. (Brown, 2014, p.119)
3.4 Visual communication
Visual communication can be defined as communication that is sensed through visual elements. Visual communication can be for example pictures, symbols, illustrations or animations. Advantages of visual communication can be seen on the effectiveness of it. It makes messages simple and easily explainable to the receiver. Presentations can be made fast to interpret. (The Business Communication, 2019) Visual communication can help detecting and memorizing important information from daily information flow (Hoopla, 2018). Choosing the right tools for communication helps the receivers to understand the objective of the message. Messages should have goals. What does the sender want to achieve and to whom the message concerns? Some receivers might drown from information overflow while others do not have enough necessary information to perform their tasks. (Loiri & Juholin, 1998, p.9) Visual communication can combine text and pictures. Which one is more dominant, is related to the subject of the message. The goal of visual communication is that both aspects, picture and text clarify each other’s purpose. (Loiri & Juholin, 1998, p.52) The purpose of visual tools is to make something more visible. Therefore, it is important that the tool is located or otherwise found easily. Visual tool should not be too difficult to find or use. Visual tools need to be accessible, not hidden. One example could a board located at the production to display visual information. The goal of this board would be to add positive productivity and accessibility to the production information. (Ortiz & Park, 2011, p.10-11) Information about company’s performance capabilities should be available to all employees. All departments should be taken into consideration when deciding a place for visual displaying tool. This way the physical barriers are minimized. (Ortiz & Park, 2011, p.15) By visualizing information, large amounts of data can be transformed into simpler form. This way visualization can create a quantitative analysis such as tables and figures or qualitative display of information. Visualization can be used to summarize information. (Fayyad, Grinstein & Wierse, 2002, p.21) Visualization techniques can be categorized in multiple ways, for example by the nature of data, by task, by structure and by display method used. Person looking for a visual display can either know what to look for or not.

20
When a person knows what they are viewing for they are usually searching for information. On the contrary, an advertisement can be an example of a visual display that the person is viewing unintentional. (Fayyad et al., 2011, p.23)
4 RESEARCH
The research began by determining the current situation of production and how information is delivered to other departments of the company. Production in this case means all activities relating to either manufacturing or maintaining the products. Commission for this thesis came from the Senior Vice President of Operations. Visual and simple solution for real-time production information could improve information flow internally. Buildings and facilities are in different places of the company plot. Every production facility has its own features and projects ongoing. By gathering basic information of each project’s status, information is more easily available and enables more knowledge to be transferred. Production related information determines the basis of the business functions. In product-based business, sales and revenue are dependent of the production. Therefore, the role of information flow is so important.
4.1 Methods of working
In the interviews conducted the goal was to find out how information is now transferred between production and other departments, what information is relevant to employees, how this information should be available, how often it should be updated and to which department the updating should be linked. When reviewing the interviews, it is valid to understand that the company functions in this research are divided into Operations-projects and Services-projects. Service-projects consist of maintenance, lifecycle upgrades and spare part sales. By offering lifecycle support systems, Patria can widen its functions and remain as a long-term partner to its customers. Services focuses on developing and maintaining, supporting, sales and supply activities. Operations responsibilities are the activities of supply chains and financial efficiencies of all production and developing projects.
At the beginning of this research the research method was chosen between qualitative and quantitative method. Qualitative method uses objective data gathered for example with interviews. Qualitative method approaches persons feelings and ideas. Quantitative method on the

21
contrary uses data, numbers and statistics. The approach is more subjective and measurable. (Difference Between Qualitative and Quantitative Research, 2019) Interviews were the primary data collection that consist of observation and information that the case company provided to the author. Inside data and conversations with the employees provided material that is not available to all authors. Secondary data collection consists of theory part including books, e-books, articles and other releases gathered in order to understand the background of organizational functions. Questions were related to the situation of production and information flow. Current situation of production and how information is now conducted from production was clarified by the author. As an employee of the case company, the author had access to production facilities and was able to determine different tools and technologies used now and how these techniques could be improved. Quantitative method would have been difficult to execute in this kind of research. Many answers got from the interviews were opinions, because of the nature of the research. Qualitative method helped on getting deeper into the research and allowed more conversation about the subject than quantitative approach. By using qualitative research method this thesis strives to understand the whole entity of production information flow.
4.2 Interviews
The research in this thesis was conducted with qualitative research method and by interviews. The interviews took place between October and December 2019. All the interviews were done face-to-face, and the persons were employees and members of the management in the case company Patria Land Oy. Interviews were divided into different categories; 1. Management department 2. Production related departments 3. Project Management Office and Sales 4. Information Technology The interviews had a clear theme and objective, but the questions formed and changed over the interviews. Facts and opinions answered by the persons interviewed formed the direction of each interview. Current situation was clarified in these interviews and ideas for improvement were developed. Interviews were held on Finnish and translated into English. Interview questions were specially formed within every interviewees
22
position and tasks. Questions vary within every interview based on these factors. Interview question can be found on the Appendices.
5 ANALYSING THE INTERVIEWS
The goal of the in-depth interviews was to search answers to questions introduced in previous chapter and find solutions to research question; “How could production related information flow be improved and visualized in Patria Land Oy?” By interviewing and listening the case company’s employees, a clearer picture of current situation was easier to form. By analyzing the gathered data, improvement suggestions could be made.
As pointed out, the interviews had a clear theme and objectives, but the form of the questions were open. This way the answers were wide and thoroughly explained by the interviewees. Open questions allowed for more conversation about the topic without being too leading. These kinds of actions accompanied well with qualitative research method that was chosen for the research. For this kind of topic very straight and simple questions would have been difficult to answer. The point of the answers was not to be measured, but to be analyzed. Inside the case company sharing production related information was decentralized. Informing of common issues was handled by the Human Resources department and assistants, but these informed matters were related to topical issues such as healthcare services, not straight to production related information. However, inside the case company Patria Land there was not an actual problem with internal communication or information flow. Instead the goal was to utilize different tools for information sharing and think of ways for improving the information flow into more efficient direction. The goal was to benefit all or as many organization levels as possible in a large company. Wide availability of general production related information could also benefit new employees entering the company and help with the acquaintance process. Analysis of the interviews was done by the author based on the opinions and conversations with the interviewees. Other important questions related to internal communication are for example who the information concerns and who is responsible for delivering and sharing the information? At this research, information sharing is not processed very reciprocated, instead it is treated relatively one-way flow from production to other departments. It is important to notice that in an organization information flows both ways. Next chapters introduce the contents and findings of the interviews.

23
5.1 Management
The interviewed persons from the management department consist of two Senior Vice Presidents, from Operations and Services- functions. Operations and Services can roughly be divided so, that the Operations part consists of new development and production of the vehicles. Services side’s key activities focuses on maintenance, life cycle support and spare parts selling. Because of the different nature of these two functions, they might need different kind of information. According to the Senior Vice President of Services, delivery assurance should always be 95 % or more. Delivering on time is one of the company’s key targets and a highly valued asset. On Services point of view, the most important information is the schedule and time managing. When scheduling projects it is important to take into consideration when the parts are arriving and how long the assembly or maintenance will take time. Changes can happen and may cause delays in schedules but with up to date information, company can be prepared. By knowing of possible delays early, informing the customers can also be done well in advance. From Services- point of view, turnaround of some parts might be so short, that displaying their stages and schedules is not relevant. The focus should be on larger assemblies and maintenances. From Operations perspective the vehicles should move from one assembly stage to another and an end-product should be a readymade vehicle. Delivery assurance is of course important on the Operations side as well. Management department receives reports and figures from other channels, so the purpose of finding a new visual tool for information sharing is not to show figures, numbers and tables deeply, but more to show overall situation of the production in a simple and understandable way. On Operations side timelines and schedules are also important and by showing some important dates of production could help management and employees to get a clearer picture of the overall situation. Based on the interviews, management department wishes to have access to the information fast and efficient, preferably from their own computers. By having access to information easily, many departments of the company could have the same knowledge and overview at the same time. This helps tacit knowledge of becoming more explicit knowledge as introduced in the theory part. The objective of management members interviews was to find out what kind of information would be relevant to know, how this information could be displayed and to whom the updating should be linked. Important questions are also how often this kind of information should be updated and as mentioned who is responsible of sharing the information? Is it up
24
to the production department to share information or is it other departments’ task to search the information needed? Based on the interviews, members of the management department thought that they could visit the production facilities on a more regular basis. Even tough, the wish of management was to enter informative files from wherever, entering production facilities could be beneficial to both managers and employees by adding visibility and interplay.
5.2 Production
The interviewed persons from production departments were the Director, two Workshop Managers, Production Planner and Sourcing Specialist. Each of these employees have different tasks and perspectives, but on the interviews, similarities were also found. Production of AMV’s in Hämeenlinna premises is divided into different buildings as mentioned earlier. In this research the focus was on AMV- hall and maintenance-hall premises. Both buildings have their own Workshop Managers and mechanics. On production planning and sourcing perspective, the same persons handle all the activities on all premises and projects. The Director is also responsible for the whole production. All the interviewees agreed on the benefits of displaying production related information more. All recipients told that the main sources they were getting information were meetings and emails. Project related information was shared within project meetings and smaller details were handled in emails or phone calls. Information was also shared within own teams, for example together with sourcing team. Interviewees also visited the production premises on a regular basis in order to get knowledge of current situations. One perspective that also came up from the interviews was the acquisition of new employees. In Patria Land the acquisition is done with online courses among with the help of colleagues showing the premises. The situation of projects however is “learned by doing”. Perhaps a general information sharing tool, could help also new employees to understand different functions of production faster and easier. The case company’s area of expertise is very special, and some new employees might not necessarily have any prior experience on large vehicles and their production or defense industry. From production point of view relevant information could be different dates. Important dates on a production of a vehicle could be different stages of the assembly, completion date, delivery date, possible important

25
tests for example swimming test or other milestones within the production. Sourcing department is interested on purchased parts and for example possible delays with suppliers that might affect the production. Possible issues might be beneficial to display, so that parts and assembly are on mutual timeline. The workshop Managers are responsible for the production and mechanics and work within the production. Therefore, they hold a lot of real-time information. As for example Souring Specialist gets most of the information on meetings and through emails. It is important to notice that these employees might hold very different information and the objective is to combine this information into an overall picture.
5.3 Project Management Office and Services
In this part the interviewed persons were from Project Management Office and Services. Project Management Office is responsible for scheduling each project, monitoring resources, financial support and project development. Services department was introduced in previous chapter. In this chapter the interviewed employee from Services was a Sales Manager, who’s responsibilities were spare part selling. These employees were chosen for the interviews because of their knowledge about project management and customer relationships. Schedules for each project are created based on customer’s needs. The main tool used for schedule handling in the case company is Microsoft Online. Each project has its own schedule and due dates. Project management together with customer sets and controls these dates and schedules. The goal is that Microsoft Online always holds the real-time schedule of each project. One tool used for reporting in the case company is a program called QlikView. QlikView is used for data visualization, but based on the interview with Project Management Office, at the moment it does not meet the requirements of the case company as well as that it could be directly utilized in this project. QlikView uses quantitative data and demonstrates it in a visual way by different charts. According to the interviews, the company has many reporting systems and it wishes to reduce them and have QlikView as the primary source. This is why the purpose of this research is not to create a new reporting system or to display reports. Different charts about numbers and figures should be left outside of this research. The focus should be more on meeting the needs of as many as possible employees, in terms of overall picture.

26
From the Services point of view, the same topics that already came up in the interview with Senior Vice President of Services apply. Timing of parts and assembly schedules are important in order for delivering parts or vehicles on time to customers. A new view that came up in the interview was a wish of seeing the mechanics name doing a certain job. This way possible questions could also be addressed directly to the mechanic.
5.4 Technical possibilities for visualization
Technical possibilities were discussed in an interview with Information Technology Specialist. In every production premises including AMV-hall, maintenance hall, welding hall and prototype developing hall locates tv-screens. In some of these areas the TV-screens are not on use and in others they show information pointed to the mechanics. From technical point of view, an excel based slide show already exist. However, this slideshow was not widely in use and the information it had was mainly pointed out for the mechanics including their weekly tasks and absences. This information was not meant for other departments but hold the basis of what could be utilized. Based on these existing tv-screens, possible outcome for visualizing production related information could be a slide show displaying production information, in both production premises and a visibility from employee’s own computer. This slide show could also be available in company’s internal webpages. This way it could benefit employees from everywhere they wish to access the information. For updating, the interviewed Information Technology Specialist suggested that two separate files could be made. One for viewing and the other one for updating. This way, unintentional updates could be avoided, and the information would be as relevant as possible. Due to the nature of the products and layout of the production premises, every production location including AMV-, maintenance-, welding- and prototype developing halls should have their own slide shows, showing only projects and vehicles that are under work at that specific location. All of these slide shows could however be available on the company´s internal webpage, or some other internal browser. The end-product of this research, a Power Point - slideshow demonstrated more in chapter 6 was done with the technical help of Information Technology Specialist. From updating point of view, this slideshow needed
27
to be as simple, fast and easy to refresh as possible. The objective of updating should be to add value, not to take too much time and effort away from other tasks. Updating this kind of slide show is manual according to the Information Technology Specialist and should be linked into some specific department. Possible department could be Production Planning, as it works closely with the production.
5.5 Overview
All together ten employees and members of the management were interviewed. These persons were from different departments and positions. This is relatively small portion of the personnel of Patria Land but gave the frames for the research. Each of these interviewees work towards functioning and efficient production. The purpose of analyzing these interviews was to introduce relevant points that came up in the interviews. In-depth analysis of each question was left outside, and the focus was on the overview of interviews. Questions leading to these answers and conclusion can be found on the Appendices. Even though the number of questions was not relatively large, the topics were very wide and opened conversations for thorough answers. Some questions were the same for all or most of the interviewees, but other questions varied within each person’s position and tasks. All interviewed persons were highly enthusiastic about answering the questionnaire. This tells that, even there is not an actual problem with information sharing inside the case company, employees are willing to think of ways to improve existing models. This could be seen as an indicator of continuous improvement. Continuous improvement is a part of Patria’s strategy (Patria, 2018). What it means on this case is that successes are joint, and failures are analyzed together so that improvements can be made for further actions. The concept of continuous improvement has the same goals as business operations in general; better production capacity, flow efficiency, delivery assurance and financial control. (Patria, 2018) As an overview, the interviews provided internal information and point of views that helped to develop the end-result of this research, a Power Point demonstration to visualize production related information accessible to all employees. By sharing production related information in a new way, more knowledge is available for every department of a large organization.

28
6 RECOMMENDATIONS
Finding a solution that benefits every member of a large organization is a very difficult task. Different employees and departments utilize different kind of information. Employees working closely with the production have more real-time information and do not necessarily need another tool for viewing it. Other employees might have only minimum knowledge of production related information. With multiple tools the possibilities of extending knowledge inside the company are improving.
6.1 End result
Based on the research made on the case company, the author developed a new tool for sharing and visualizing production related information. This tool is physically located at the center of the production. As mentioned on the research – part, tv-screens already exist in the production facilities. On AMV-production hall and maintenance premises, these screens are not on use or utilized in anyway now. General production related information could be displayed in these tv-screens on a visual way as planned. The author made a simple Power Point- based slideshow. This slideshow consists of information that was found relevant by the interviewed employees. The first version of this Power Point was developed to the AMV- production hall, but the idea was that it could be in every production hall. In this Power Point, first slide demonstrates which vehicles are on production now and what is the stage of their production. First slide shows the weekly situation as an overview. On the right there is also a box that is meant for important issues and announcements, such as abnormal situations on the production or for example long-term absences of some mechanics that might affect the production. This box can be adjusted to many situations that might require informing.

29
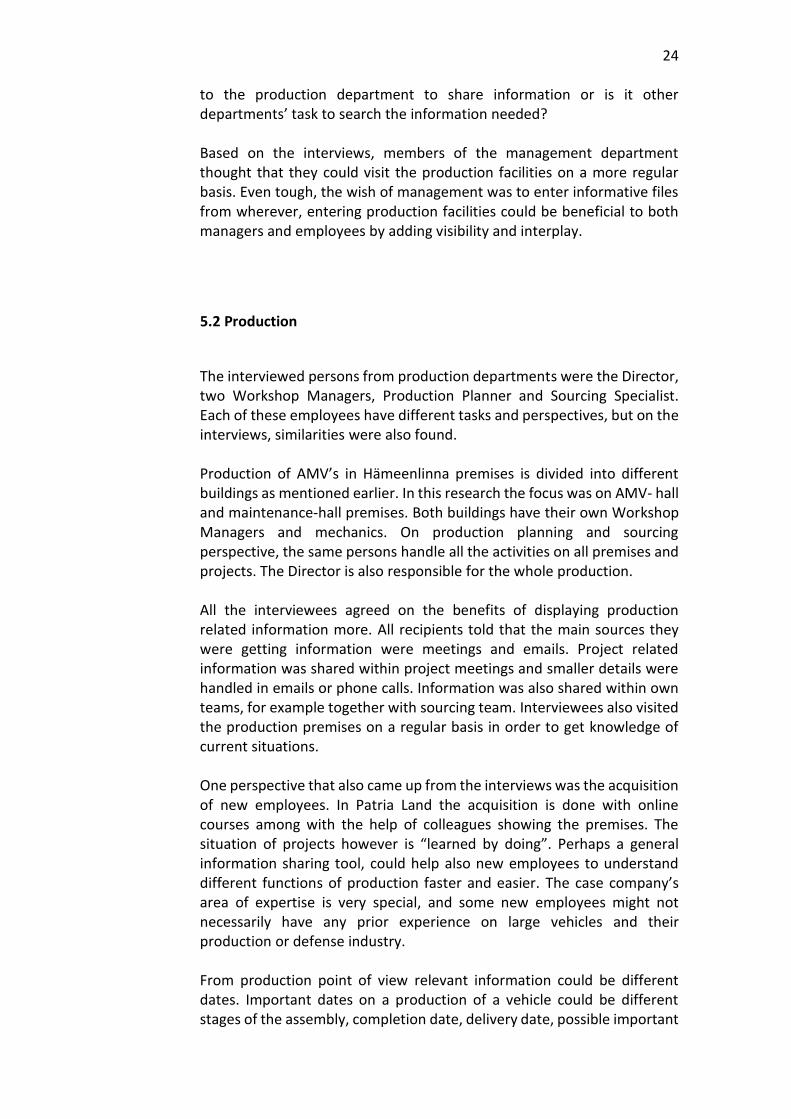
Figure 6. Slide one Figure 6 demonstrates what the first slide of presentation looks like. Due to confidentiality the license numbers or other recognizable features of the vehicles are removed. On the actual version displayed to the employees, license numbers and other features are shown, and each vehicle is recognizable. This slide demonstrates the weekly situation of AMV-hall, including which vehicles are on progress, what is their situation of completion and who is the main mechanic. The second slide consists of crucial dates and progress of each vehicle, including completion date and delivery date. The arrows show if the vehicle is on schedule. The green arrow represents that the vehicle is on schedule and everything is going well. The yellow arrow points that there might be possible delays coming and it should be monitored closely. The red arrow points out that the vehicle is having troubles and the schedule is behind. Together with the Director of Production it was discussed that these arrows do not use dates or other specific timeframes for measuring how much the vehicle is behind, but instead they show the situation generally. Days would have to be updated every day and the point of this display is to show just the overall situation. Number of delayed days can be viewed from other sources.
30
Figure 7. Slide two
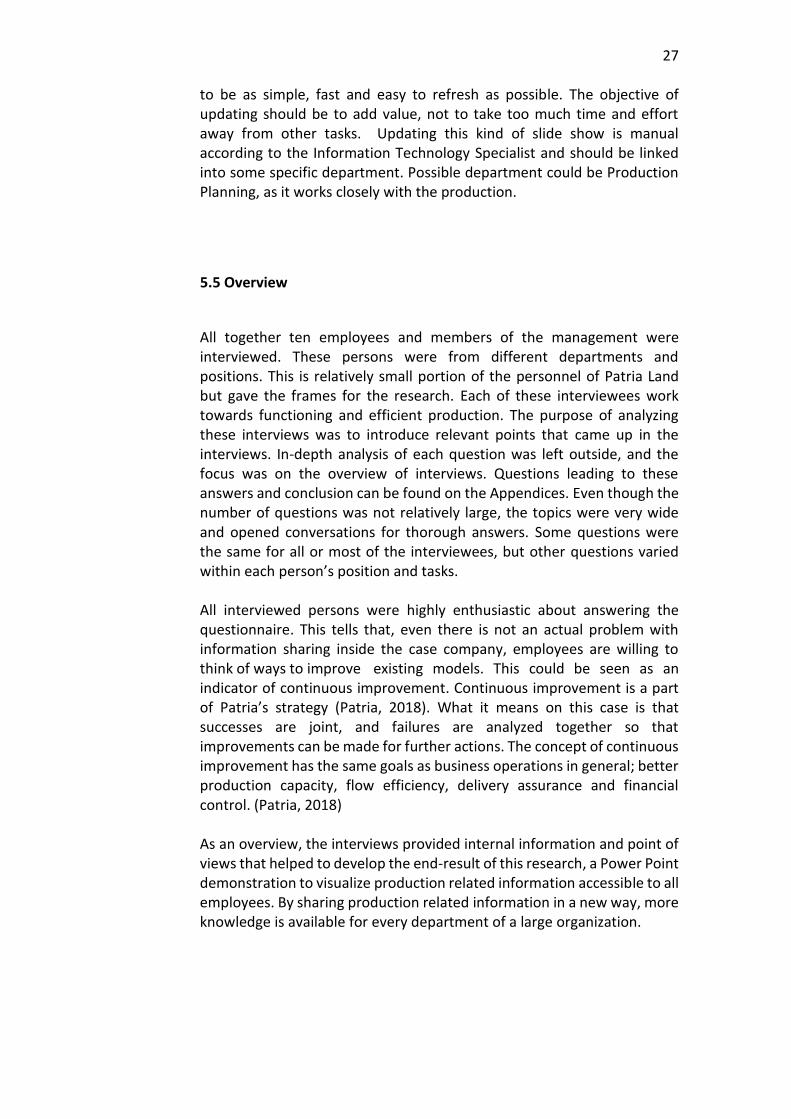
Third slide is about what is going to happen next on this specific premises, for example which projects are starting. For this purpose, the slide show holds a table that can be easily updated. This table points what information comes to what column and by that it limits the amount of information and keeps it simple. Updating is fast with only few key words and it limits space from unnecessary information. Upcoming projects can be introduced shortly, for example by telling how many vehicles they are going to cover and what is the preliminary timeline. Upcoming projects-slide could also introduce what stage the planning is and what possible milestones the projects have. This kind of slide would develop within use, when it is noticed what kind of information is needed and relevant and which facts could be left outside.
Figure 8. Slide three
31
The objective of this slideshow is also to display the capacity of the production. If a new order comes unpredicted, this tool could help to see which vehicles could be moved to other facilities or which vehicles might not be so urgent. By knowing the amount of work each project takes, it is easier to resource workforce and predict how many employees are needed on each project. This drives towards optimal productivity again. However, the content of the slideshow should be monitored if it would be displayed in the production premises. There are visitors on a regular basis on Patria Land. Visitors are shown the production premises by controlled tours and might see the Power Point on the tv-screens. The content of the slide show should be monitored, or the screens turned off when visitors are on the premises, if the data is very delegate. Some projects are more sensitive than the others. Updating this kind of tool is manual according to the Information Technology Specialist. The goal of this tool is to add value and provide more knowledge and information internally. Therefore, the updating part should not be too demanding or time consuming. Updating a new tool adds load to certain departments or employees’ tasks. Workload could be divided between departments, and perhaps the weekly situation could be discussed in a meeting. This way the information is handled both oral and written. Based on the nature of this information and answers got from the interviews, the updating could perhaps be linked into Production Planning department, which already deals with projects and production schedules. Production Planning is working closely with the production and Workshop Managers. If the updating of the slideshow could be handled in a meeting with certain departments, such as for example Production Planning and Workshop Managers, possible issues can be discussed immediately and the interaction between different departments increases. Chances of forgetting to update the slideshow are lower as the situation is processed with multiple employees. Adding more slides or deleting existing ones is possible. If the slideshow would be tested in action, it could be determined more thoroughly what kind of information is relevant and what could be left outside of this slideshow. This first version holds only three slides in order to keep it as simple as possible to read and update. The slides can also be seen on the Appendices as larger pictures. The Power Point is made by the author.
6.2 Future actions
In the future, the company could consider developing information sharing into more digital form. For example, by using touchscreens or mobile applications, updating this kind of slide show could be easier and faster.
32
Currently updating requires computer and access to files. Situations might sometimes change fast in the production, and by making the updating even faster and easier, it could help the employees. Fast updating is important especially if the slideshow is used on maintenance premises, where some assemblies might be relatively fast. Even with new technological solutions, the importance of face-to-face communication should not be forgotten. All employees and management members should remember to visit the production premises on a regular basis. Finding relevant information, is also dependent on every employee’s own activity. If some information is not available, is it up to the employee to find the needed answers? This relates again to the topic of who shares information and to whom it is meant for? All information might not even be relevant to all employees.
7 CONCLUSION
This thesis researched the internal communication and information flow in case company Patria Land Oy. By interviewing employees and management of the case company, inside data was gathered in order to find a new solution for visualizing production related information. General, real-time information about the stage of the production and what kind of projects are ongoing, could benefit employees with more knowledge. A new visual tool could help making information sharing easy and efficient. This thesis introduced the commissioning company Patria as a group and focused more on one of its subfunction, Patria Land. By introducing the case company and its production functions in brief, this thesis aims for the reader to have a glimpse of defence industry and the production of large vehicles. The theoretical background in this thesis consist of communication and knowledge culture. The research in this thesis consist of primary and secondary data. Interviews for the employees and management members of the case company were the primary data. These interviewees were from different departments of the company such as management, workshop management, production planning, procurement and information technology departments. Secondary data consist of theoretical sources. By using theoretical background and interviews inside the case company, a new tool for visual information sharing was introduced as an end result of this research. This research and the end-product Power Point- demonstration was made based on the interviews and opinions of the persons interviewed. The sample was relatively small considering the size of the company but valid given the criteria and extend of the research. The
33
outcomes of this research could be considered fairly reliable as the interviewed persons were employees and managers of the case company and would benefit from more knowledge and information. The purpose of the Power Point was to demonstrate in one of the production premises, what options for visual information sharing could be utilized. The Power Point slideshow is a demonstration and a suggestion of how production related information could be visualized. Reflecting to the research question; “How could production related information be improved and visualized in Patria Land Oy?”, the interviews gave inside data that advocated that a new tool for these purposes could be needed and beneficial. The Power Point -demonstration was introduced to some interviewed employees and commissioning parties. Feedback was positive and the hope is to test and take the tool in use on year 2020. By analysing these answers, the conclusion could be that production related information flow could be improved by using a visual tool for internal information display. The case company had some organizational changes during the finishing phase of this thesis. Some persons interviewed for this thesis earlier on the autumn 2019, might have changed to different positions inside the company or left the case company. However, this does not affect the research objectives or findings. The same structures still apply to production functions. For further actions, the Power Point can be adjusted and modified to meet changing needs of information even better. A wider research could be made among the employees and the visualization of the presentation could be improved if necessary. These actions can be determined by testing the Power Point among employees and gathering feedback.
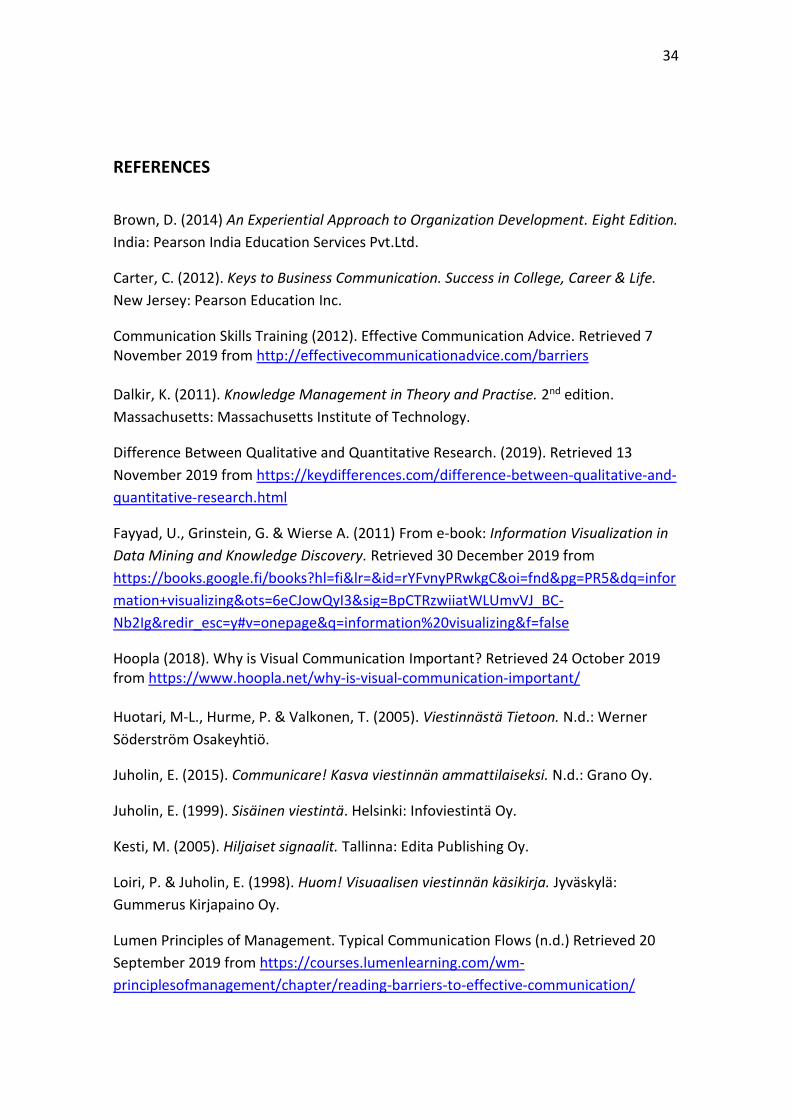
34
REFERENCES
Brown, D. (2014) An Experiential Approach to Organization Development. Eight Edition.
India: Pearson India Education Services Pvt.Ltd.
Carter, C. (2012). Keys to Business Communication. Success in College, Career & Life.
New Jersey: Pearson Education Inc.
Communication Skills Training (2012). Effective Communication Advice. Retrieved 7 November 2019 from http://effectivecommunicationadvice.com/barriers Dalkir, K. (2011). Knowledge Management in Theory and Practise. 2nd edition.
Massachusetts: Massachusetts Institute of Technology.
Difference Between Qualitative and Quantitative Research. (2019). Retrieved 13
November 2019 from https://keydifferences.com/difference-between-qualitative-and-
quantitative-research.html
Fayyad, U., Grinstein, G. & Wierse A. (2011) From e-book: Information Visualization in
Data Mining and Knowledge Discovery. Retrieved 30 December 2019 from
https://books.google.fi/books?hl=fi&lr=&id=rYFvnyPRwkgC&oi=fnd&pg=PR5&dq=infor
mation+visualizing&ots=6eCJowQyI3&sig=BpCTRzwiiatWLUmvVJ_BC-
Nb2Ig&redir_esc=y#v=onepage&q=information%20visualizing&f=false
Hoopla (2018). Why is Visual Communication Important? Retrieved 24 October 2019 from https://www.hoopla.net/why-is-visual-communication-important/ Huotari, M-L., Hurme, P. & Valkonen, T. (2005). Viestinnästä Tietoon. N.d.: Werner
Söderström Osakeyhtiö.
Juholin, E. (2015). Communicare! Kasva viestinnän ammattilaiseksi. N.d.: Grano Oy.
Juholin, E. (1999). Sisäinen viestintä. Helsinki: Infoviestintä Oy.
Kesti, M. (2005). Hiljaiset signaalit. Tallinna: Edita Publishing Oy.
Loiri, P. & Juholin, E. (1998). Huom! Visuaalisen viestinnän käsikirja. Jyväskylä:
Gummerus Kirjapaino Oy.
Lumen Principles of Management. Typical Communication Flows (n.d.) Retrieved 20
September 2019 from https://courses.lumenlearning.com/wm-
principlesofmanagement/chapter/reading-barriers-to-effective-communication/

35
Lunenburg, F. (2010). Communication: The Process, Barriers, And Improving
Effectiveness. Retrieved 24 October 2019 from
https://www.mcgill.ca/engage/files/engage/communication_lunenburg_2010.pdf
Ortiz, C. & Park, M. (2011) Visual Controls – Applying Visual Management to the
Factory. Florida: Taylor & Francis Group.
Patria (2017). Armoured Wheeled Vehicles. Retrieved 9 September 2019 from
https://www.patria.fi/en/products-and-services/armoured-wheeled-vehicles
Patria (2017). Corporate Structure and Shareholder Voting Rights. Retrieved 10
September 2019 from https://www.patria.fi/en/patria/corporate-structure-and-
shareholder-voting-rights
Patria (2017). Tietoa Patriasta. Retrieved 9 September 2019 from
https://www.patria.fi/fi/patria
Patria (2017). Vientilupakäytäntö. Retrieved 18 January from
https://www.patria.fi/fi/yritysvastuu/eettinen-toimija-alallaan/vientilupakaytanto
Patria People. (2019) Patria in brief. Patria Group’s magazine 1/19.
Phicare (n.d.) Communication Barriers. Retrieved 7 November 2019 from http://phicare.com/competencies/communicationbarriers.php Sydänmaanlakka, P. (2009). Jatkuva uudistuminen. Luovuuden ja innovatiivisuuden johtaminen. Hämeenlinna. Kariston Kirjapaino Oy. The Business Communication (2019). What is visual communication? Advantages and Disadvantages. Retrieved 24 October 2019 from https://thebusinesscommunication.com/what-is-visual-communication-advantages-and-disadvantages/ Toppr (n.d.) Barriers in Communication. Retrieved 7 November 2019 from https://www.toppr.com/guides/business-correspondence-and-reporting/communication/barriers-in-communication/ Wise Old Sayings (n.d.) Communication Sayings and Quotes. Retrieved 8 November 2019 from http://www.wiseoldsayings.com/communication-quotes/

36
Appendix 1
INTERVIEW FOR VICE PRESIDENT, OPERATIONS
1. Since you were the commissioning person for this thesis, could you please tell some background of what kind of outcome is wanted?
2. What kind of information would be relevant for displaying?
3. How do you get information about the production now?
4. How do you share information?
5. What channels do you prefer for internal communication?
6. How often do you feel that the information on this kind of display should be
updated?
7. What do you think of the idea of displaying this kind of information on tv-screens located on the production and access from your own computer?
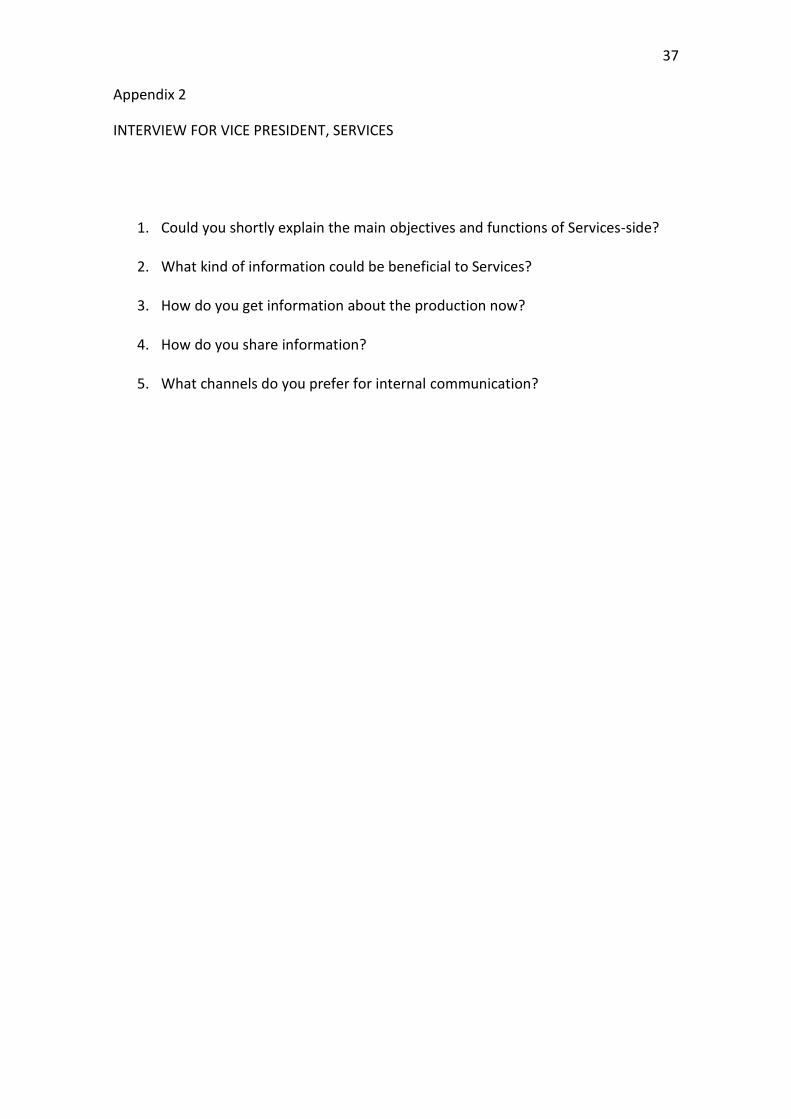
37
Appendix 2
INTERVIEW FOR VICE PRESIDENT, SERVICES
1. Could you shortly explain the main objectives and functions of Services-side?
2. What kind of information could be beneficial to Services?
3. How do you get information about the production now?
4. How do you share information?
5. What channels do you prefer for internal communication?
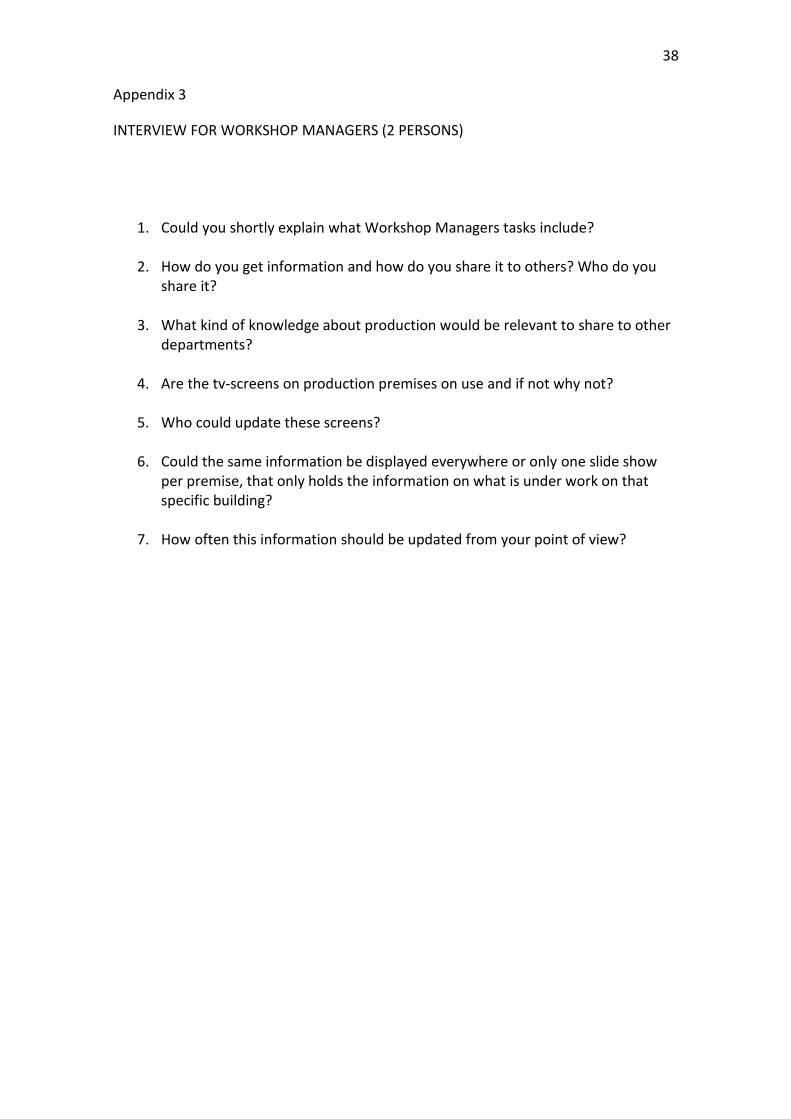
38
Appendix 3
INTERVIEW FOR WORKSHOP MANAGERS (2 PERSONS)
1. Could you shortly explain what Workshop Managers tasks include?
2. How do you get information and how do you share it to others? Who do you share it?
3. What kind of knowledge about production would be relevant to share to other
departments?
4. Are the tv-screens on production premises on use and if not why not?
5. Who could update these screens?
6. Could the same information be displayed everywhere or only one slide show per premise, that only holds the information on what is under work on that specific building?
7. How often this information should be updated from your point of view?

39
Appendix 4
INTERVIEW FOR DIRECTOR, PRODUCTION
1. What kind of information would be relevant to display?
2. How do you get information about the production now?
3. How do you share information?
4. What channels do you prefer for internal communication?
5. What do you think about proactive point of view? Meaning should this display be proactive between departments? Or more one-directional?
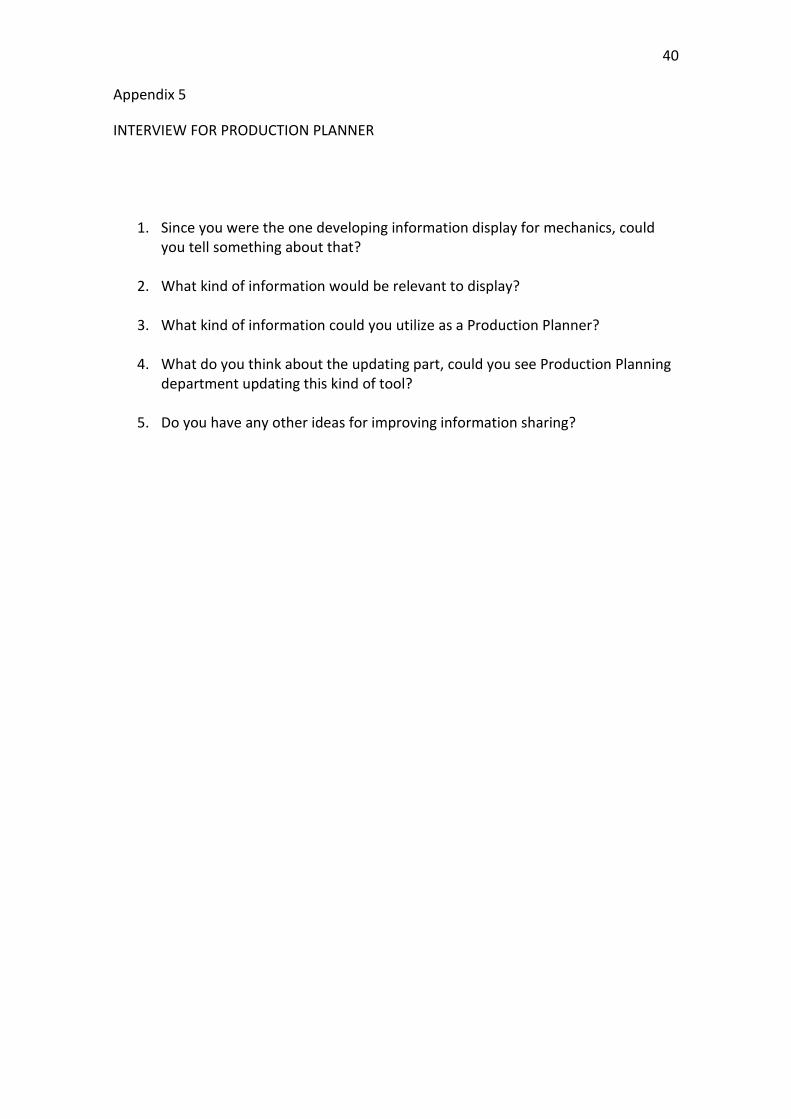
40
Appendix 5
INTERVIEW FOR PRODUCTION PLANNER
1. Since you were the one developing information display for mechanics, could you tell something about that?
2. What kind of information would be relevant to display?
3. What kind of information could you utilize as a Production Planner?
4. What do you think about the updating part, could you see Production Planning
department updating this kind of tool?
5. Do you have any other ideas for improving information sharing?

41
Appendix 6
INTERVIEW FOR SOURCING SPECIALIST
1. What kind of information would be relevant for sourcing or purchasing purposes?
2. How would you prefer to see this kind of information?
3. Since you are relatively new employee, how do you see information sharing in
Patria Land? Do you feel that you have enough production related information all the time?
4. How do you get information about production?
5. What channels do you prefer to use?
6. Would you go to production premises to see the current situation or prefer
seeing it from some internal browser on your own computer?
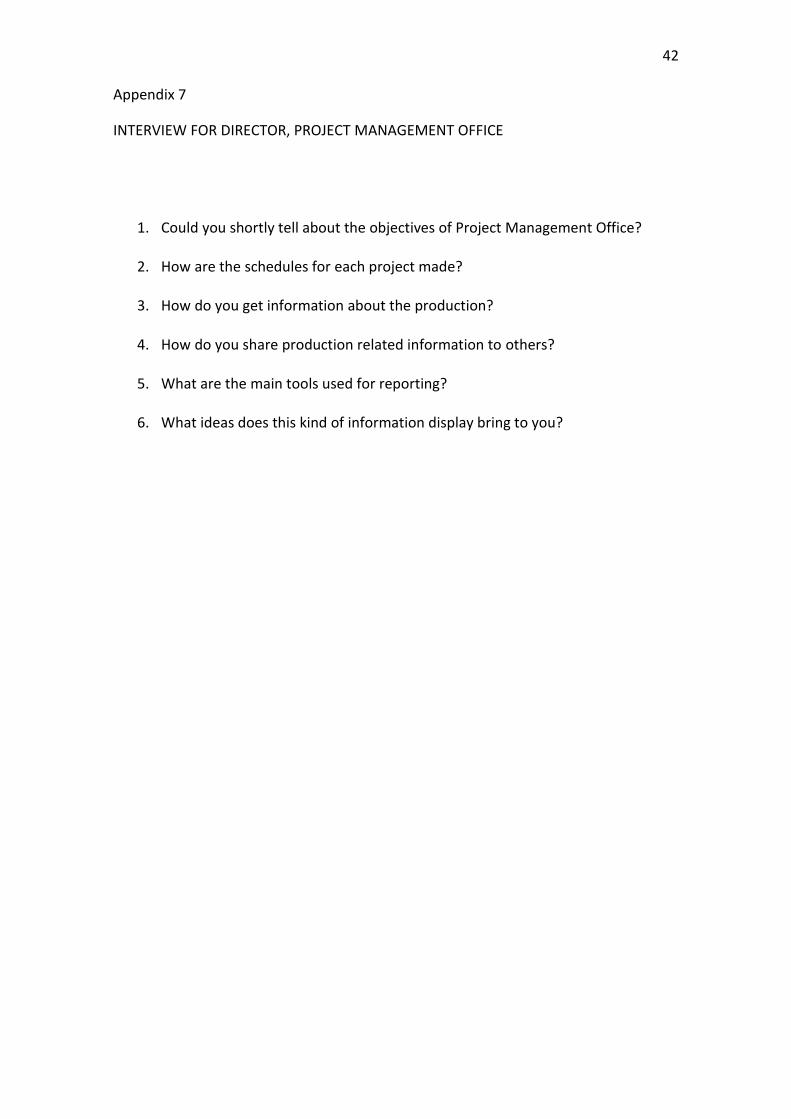
42
Appendix 7
INTERVIEW FOR DIRECTOR, PROJECT MANAGEMENT OFFICE
1. Could you shortly tell about the objectives of Project Management Office?
2. How are the schedules for each project made?
3. How do you get information about the production?
4. How do you share production related information to others?
5. What are the main tools used for reporting?
6. What ideas does this kind of information display bring to you?
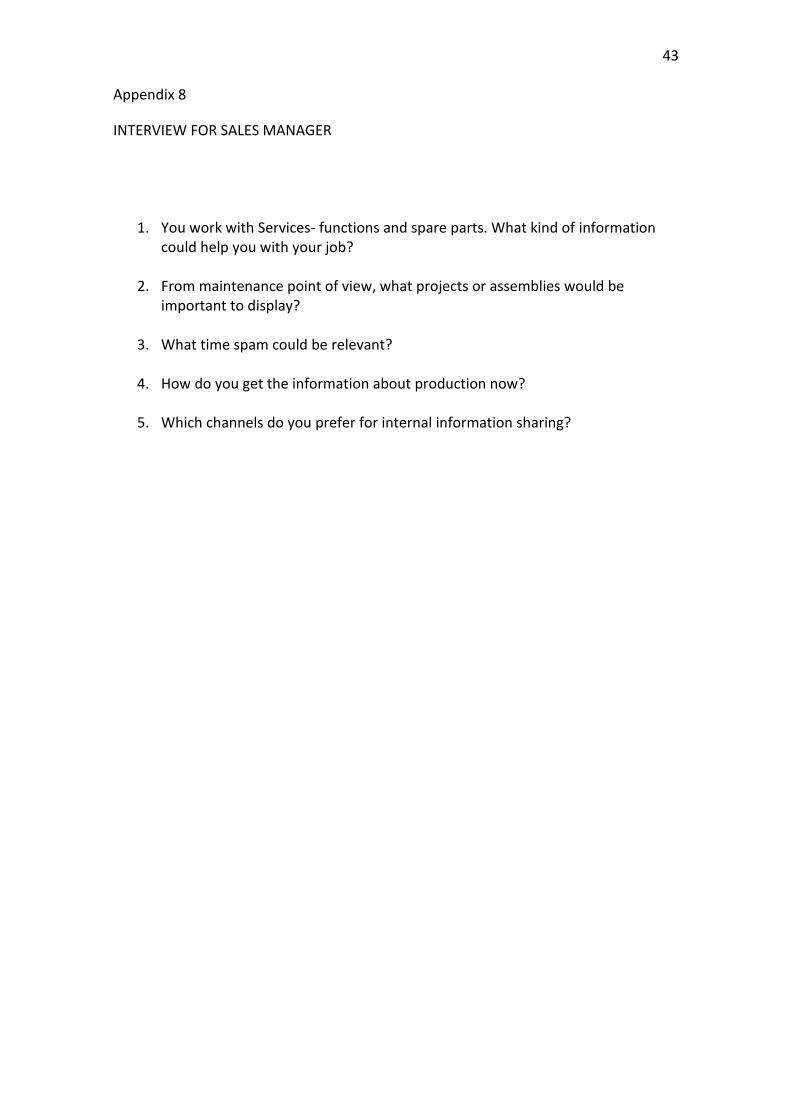
43
Appendix 8
INTERVIEW FOR SALES MANAGER
1. You work with Services- functions and spare parts. What kind of information could help you with your job?
2. From maintenance point of view, what projects or assemblies would be
important to display?
3. What time spam could be relevant?
4. How do you get the information about production now?
5. Which channels do you prefer for internal information sharing?

44
Appendix 9
INTERVIEW FOR INFORMATION TECHNOLOGY SPECIALIST
1. From technical point of view, what kind of possibilities there is for information displaying?
2. Could the updating be somehow automatic?
3. Could the display be on tv-screens and internal webpages?
4. What tools or reporting systems could be utilized?
5. How do you think the updating could be handled?
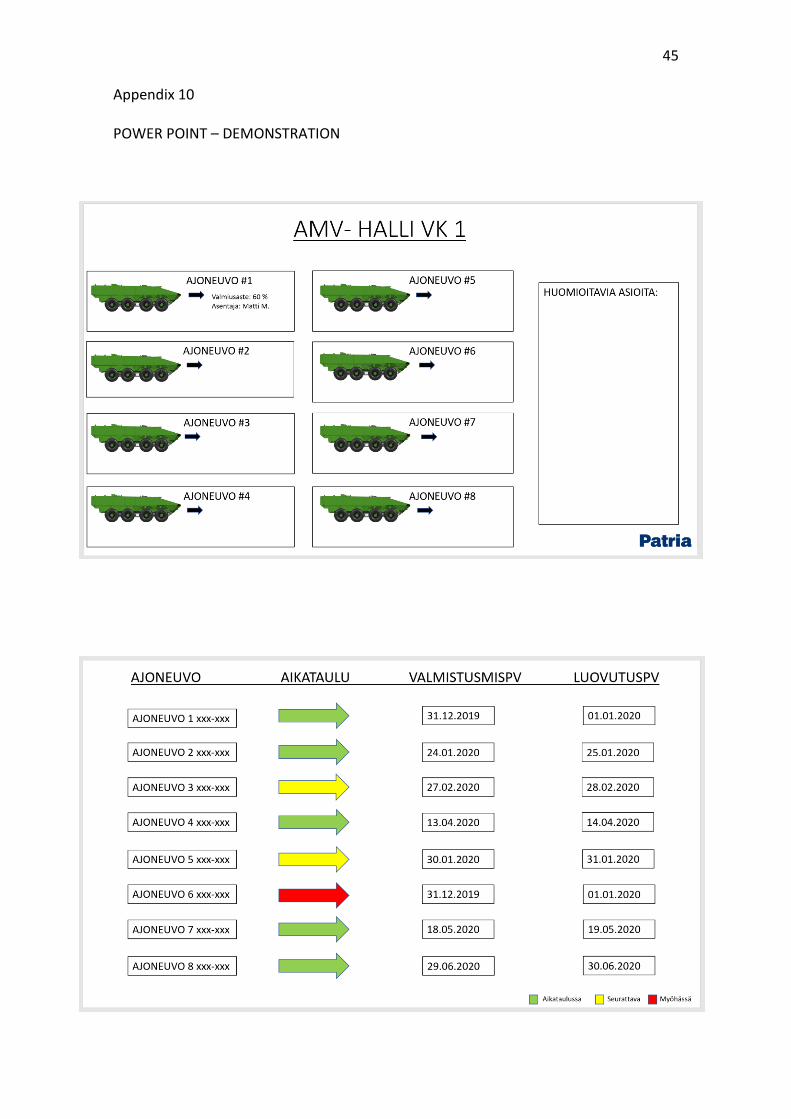
45
Appendix 10 POWER POINT – DEMONSTRATION
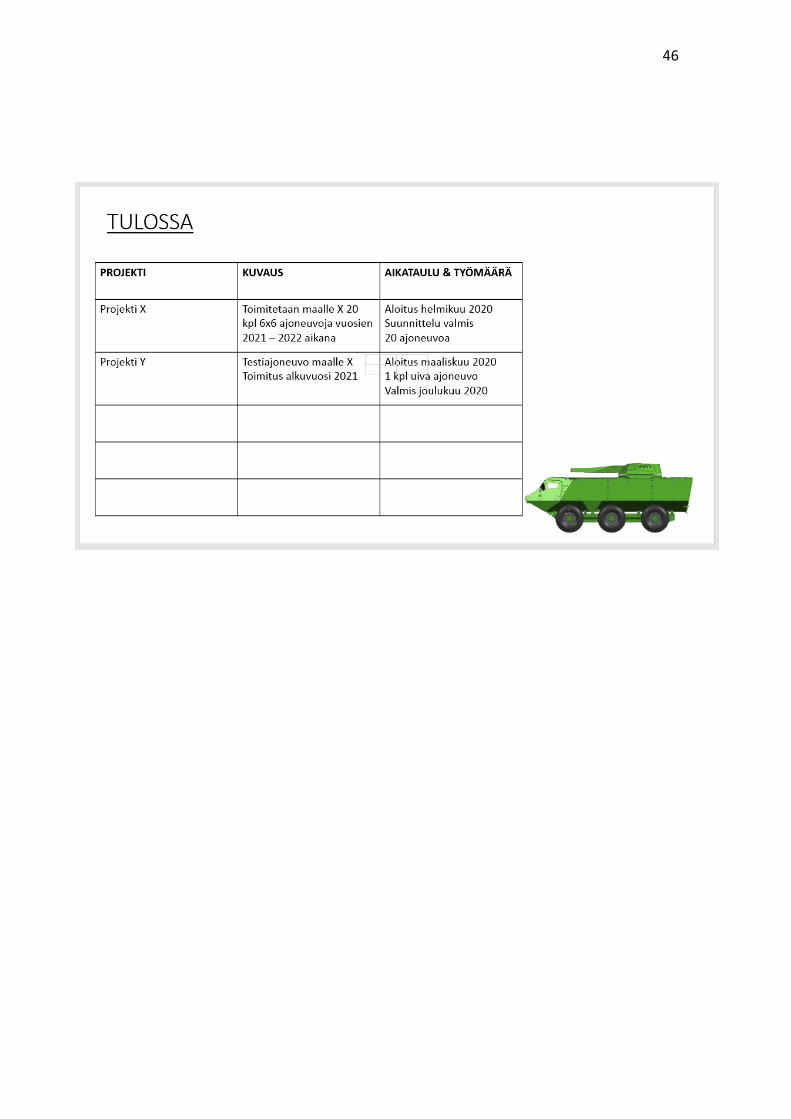
46