waste to energy power plant project for bali … project for ministry of the environment japan...
TRANSCRIPT
FY2016 Project for Ministry of the Environment Japan
FY2016
Feasibility Study of Joint Crediting Mechanism
Project by City to City Collaboration
Waste to Energy Power Plant Project
for Bali Province in Indonesia
Final Report
10th March, 2017
JFE Engineering Corporation
Clean Authority of TOKYO

リサイクル適性の表示:印刷用の紙へリサイクルできます。
この印刷物は、グリーン購入法に基づく基本方針における「印刷」に係る判断の基
準にしたがい、印刷用の紙へのリサイクルに適した材料[A ランク]のみを用いて作製
しています。
i
Table of Contents
Chapter 1 Investigation Overview ................................................................................................................ 1-1
1.1 Background and Purpose of Investigation ............................................................................... 1-1
1.2 Business Feasibility ..................................................................................................................... 1-1
1.2.1 Current state of target regions .................................................................................................. 1-1
1.2.2 Enactment of the Indonesia Presidential Decree and Feed-in Tariff revision ..................... 1-3
1.3 Investigation Contents ................................................................................................................. 1-4
1.4 Organization Chart for Investigation ......................................................................................... 1-5
1.5 Investigation Schedule ................................................................................................................ 1-5
Chapter 2 Current Survey in the Target Region .................................................................................... 2-1
2.1 Social and economic situation ................................................................................................... 2-1
2.1.1 Overview of the Republic of Indonesia ................................................................................... 2-1
2.1.2 Overview of Indonesian economy............................................................................................. 2-2
2.1.3 Electric powers in the Republic of Indonesia ......................................................................... 2-3
2.1.3.1 Energy resources ......................................................................................................................... 2-3
2.1.3.2 Energy balance ............................................................................................................................ 2-4
2.1.3.3 Energy supply and demand estimates ...................................................................................... 2-6
2.1.3.4 Renewable energy strategy......................................................................................................... 2-6
2.1.4 General aspects of Bali Province ............................................................................................. 2-9
2.1.5 Overview of the Bali Province Economy .............................................................................. 2-10
2.1.6 Electric power in Bali Province ............................................................................................. 2-10
2.2 Natural environment.................................................................................................................. 2-11
2.2.1 Weather in Bali Province......................................................................................................... 2-11
2.2.1.1 Temperature in Bali Province .................................................................................................. 2-11
2.2.1.2 The amount of precipitation and humidity in Bali Province .............................................. 2-11
2.2.1.3 The percentage of sunshine in Bali Province ....................................................................... 2-11
2.2.2 Topography and geology of Bali Province ............................................................................ 2-12
2.2.2.1 Topography of Bali Province .................................................................................................. 2-12
2.2.2.2 Geological features in Bali Province ...................................................................................... 2-12
2.3 Current status of the waste treatment in the target region ................................................. 2-13
2.3.1 Flow of waste, the amount of production, collection and disposal ................................... 2-13
2.3.2 Types and composition of wastes ........................................................................................... 2-21
2.3.3 Current status of collection and transportation, treatment and disposal and recycling .... 2-21
2.4 Waste related legal system, policies and plans ..................................................................... 2-22
2.4.1 Waste related legal system ...................................................................................................... 2-22
2.4.2 Other relevant legal systems ................................................................................................... 2-31
ii
2.4.2.1 Spread of renewable energy .................................................................................................... 2-31
2.4.2.2 Outline of the Public Private Partnership (PPP) laws in the Republic of Indonesia ...... 2-34
2.4.2.3 IIGF ............................................................................................................................................ 2-39
2.4.2.4 VGF(Viability Gap Funding) ................................................................................................... 2-41
2.5 Meeting with local stakeholders .............................................................................................. 2-43
2.5.1 JCM feasibility study kickoff meeting based on the city-to-city collaboration ................. 2-43
2.5.2 Project Scheme assumed .......................................................................................................... 2-44
2.5.3 Risk sharing in BOT projects ................................................................................................. 2-46
2.5.4 Introduction of the failures in waste-to-energy projects and the explanation of proper .. 2-47
2.5.5 Importance of the selection methods of operators and the disposal cost
in the Tokyo’s 23 wards ......................................................................................................... 2-47
2.5.6 Summary of this Chapter ........................................................................................................ 2-48
Chapter 3 Characteristics of Waste Incineration Method ....................................................................... 3-1
3.1 Types of incineration methods .................................................................................................. 3-1
3.1.1 Considerations for incinerator method ...................................................................................... 3-1
3.1.2 Overview of incinerator type .................................................................................................... 3-3
3.1.3 Overview of gasifying and melting furnace types .................................................................. 3-5
3.2 Comparison of types of incineration ........................................................................................ 3-7
3.2.1 Construction and operation costs .............................................................................................. 3-7
3.2.2 Stability ........................................................................................................................................ 3-7
3.2.3 Residue volume ........................................................................................................................... 3-8
3.2.4 Environmental load ..................................................................................................................... 3-9
3.2.5 Results of implementation .......................................................................................................... 3-9
3.2.6 Summary of incineration methods .......................................................................................... 3-10
3.3 Technological superiority .......................................................................................................... 3-10
3.3.1 Superiority of Japanese technology......................................................................................... 3-10
3.3.2 Technology of JFE Engineering’s stoker furnace ................................................................. 3-11
3.3.2.1 Hot air combustion system which achieves low air ratio combustion .............................. 3-11
3.3.2.2 Application of two-way gas flow ........................................................................................... 3-15
3.3.2.3 Long-term stable operation with highly reliable grates ........................................................ 3-16
Chapter 4 Planning of Waste to Energy Plant ..................................................................................... 4-1
4.1 Basic plant planning ................................................................................................................... 4-1
4.1.1 Facility flow ................................................................................................................................ 4-1
4.1.2 Workings of each equipment ..................................................................................................... 4-2
4.1.2.1 Combustion Equipment ............................................................................................................... 4-2
4.1.2.2 Automatic combustion control (ACC) system ......................................................................... 4-3
4.1.2.3 Combustion Gas Cooling Facilities........................................................................................... 4-4
iii
4.1.2.4 Flue gas treatment facilities ...................................................................................................... 4-4
4.1.2.5 Heat recovery device .................................................................................................................. 4-5
4.1.2.6 Ash handling equipment ............................................................................................................ 4-5
4.1.3 Design conditions ........................................................................................................................ 4-7
4.1.3.1 Waste quantity/quantity ............................................................................................................... 4-7
4.1.3.2 Flue gas emission standards ...................................................................................................... 4-8
4.1.3.3 Specifications of major facilities ............................................................................................... 4-8
4.1.4 Layout plan ................................................................................................................................. 4-9
4.1.5 Overall construction schedule .................................................................................................. 4-10
4.1.6 Plant construction costs ............................................................................................................ 4-10
4.2 Plant operational plan ............................................................................................................... 4-11
4.2.1 Operational plan ........................................................................................................................ 4-11
4.2.2 Operation costs .......................................................................................................................... 4-11
4.2.3 Power generation plan .............................................................................................................. 4-14
Chapter 5 Stakeholders and Interested Parties ........................................................................................ 5-1
5.1 Various types of stakeholders and interested parties .............................................................. 5-1
5.1.1 Indonesian government central ministries and agencies ......................................................... 5-1
5.1.2 Stakeholders in Bali.................................................................................................................... 5-2
5.1.3 Stakeholders required in project formation .............................................................................. 5-3
Chapter 6 Project Finance Application .................................................................................................... 6-1
6.1 About project finance application ............................................................................................. 6-1
6.2 Advantages to project finance application ............................................................................... 6-5
6.3 Security package structure ......................................................................................................... 6-6
6.4 Possibility to apply project finance .......................................................................................... 6-7
Chapter 7 Business Structure ....................................................................................................................... 7-1
7.1 Implementation structure ............................................................................................................. 7-1
7.2 Requisites for implementing special purpose company business ................................................. 7-3
Chapter 8 Feasibility Evaluation .................................................................................................................. 8-1
8.1 Feasibility evaluation .................................................................................................................. 8-1
8.1.1 Business prerequisites ................................................................................................................. 8-1
8.1.2 Financing conditions ................................................................................................................... 8-2
8.1.3 Specifications of waste to energy plant ................................................................................... 8-2
8.1.4 Fuel (waste quality) setting ....................................................................................................... 8-3
8.1.5 Construction fees ......................................................................................................................... 8-4
8.1.6 Operation maintenance repair fees ............................................................................................ 8-4
iv
8.1.7 Costs related to environmental assessment .............................................................................. 8-4
8.1.8 Expenses related to commissioning .......................................................................................... 8-5
8.1.9 Insurance fees .............................................................................................................................. 8-5
8.1.10 Public charges ............................................................................................................................. 8-5
8.2 Profitability evaluation ................................................................................................................ 8-6
8.2.1 Prerequisites for profitability evaluation ................................................................................... 8-6
8.3 Sensitivity analysis ...................................................................................................................... 8-7
8.3.1 Fluctuations in economic indicators due to the price of selling electricity
to a power company .................................................................................................................. 8-7
8.3.2 Changes in the economic indicators due to tipping fee fluctuations ................................... 8-9
8.3.3 Sensitivity analysis based on the application of Viability Gap Funding (VGF)............... 8-11
8.3.4 Sensitivity analysis based on the application of JCM subsidy for equipment of plant .. 8-12
Chapter 9 JCM Proposed Methodology .................................................................................................. 9-1
9.1 JCM Proposed Methodology Form .............................................................................................. 9-1
9.2 JCM Proposed Methodology Spreadsheet ................................................................................. 9-14
Chapter 10 Future tasks and conclusions of the Feasibility Study ........................................................ 10-1
10.1 Future tasks ................................................................................................................................ 10-1
10.2 Conclusion ................................................................................................................................. 10-2
v
Table of Figures
Figure 1.1 Position of Bali ....................................................................................................................... 1-2
Figure 1.2 Current situation of TPA Suwung landfill (As of August 2016) ............................................. 1-2
Figure 1.3 Current situation of TPA Suwung landfill (As of August 2016) ............................................. 1-3
Figure 1.4 Organization chart for investigation and role ......................................................................... 1-5
Table 1-1 Implementation schedule ........................................................................................................ 1-6
Figure 2.1 Population trends of the Republic of Indonesia ...................................................................... 2-1
Figure 2.2 GDP trends of the Republic of Indonesia ............................................................................... 2-2
Figure 2.3 Composition of Gross Domestic Product by Sector ............................................................... 2-3
Figure 2.4 Electric power generation by PLN (2013, unit GWh) ............................................................ 2-4
Figure 2.5 The amount of electricity purchased by PLN from IPP and private power generation........... 2-5
Figure 2.6 The amount of electricity selling by buyer (2013, unit GWh) ................................................ 2-5
Table 2.1 Estimates of electricity selling in the Republic of Indonesia (unit % and TWh) .................... 2-6
Figure 2.7 Electricity Composition Ratio (2011) ..................................................................................... 2-7
Figure 2.8 Target Value for Electricity Composition Ratio (2025) .......................................................... 2-7
Figure 2.9 Target Value for Electricity Composition Ratio (2050) .......................................................... 2-8
Figure 2.10 Map of Bali Province in the Republic of Indonesia ................................................................ 2-9
Table 2.2 Estimates for electric power demand and electrification rate in the Java and Bali ............... 2-10
Table 2.3 Composition of energy production by fuel in the Java and Bali ........................................... 2-11
Figure 2.11 Waste disposal method in the Republic of Indonesia ............................................................ 2-14
Figure 2.12 Flow of waste in Denpasar .................................................................................................... 2-15
Figure 2.13 Overview on the zones of Suwung Landfill (as shown on site) ............................................ 2-16
Figure 2.14 Block 1 being used for land reclamation (July 2016) ........................................................... 2-17
Figure 2.15 Sanitary Landfill ................................................................................................................... 2-17
Figure 2.16 NOEI facilities (they are assumed to be the pretreatment facilities for separation).............. 2-18
Figure 2.17 NOEI facilities (concrete tanks that look like methane fermentation tanks) ........................ 2-18
Figure 2.18 July 2016 (the gas engine building on the right side of the photo) ....................................... 2-19
Figure 2.19 November 2016 (the roof of gas engine building can be seen at the center of the photo) .... 2-19
Figure 2.20 Compost Center .................................................................................................................... 2-20
Table 2.4 Unit requirement and the amount generated by the composition of waste ........................... 2-21
Table 2.5 Delivery to the Suwung Landfill .......................................................................................... 2-22
Figure 2.21 Waste Bank in Denpasar City ............................................................................................... 2-25
Table 2.6 Policy and strategy ................................................................................................................ 2-26
Table 2.7 Target for 3R ......................................................................................................................... 2-28
Figure 2.22 Seven cities designated by the Presidential Decree No. 18/2016 and their waste volume ... 2-31
Table 2.8 Laws and regulations related to renewable energy ............................................................... 2-32
Table 2.9 FIT price for the methane gas power generation technology ................................................ 2-32
vi
Table 2.10 FIT price for the thermal treatment power generation technology ....................................... 2-32
Table 2.11 Overview of PPP system ....................................................................................................... 2-34
Figure 2.23 Flow of PPP scheme ............................................................................................................. 2-38
Figure 2.24 Functions of IIGF ................................................................................................................. 2-40
Figure 2.25 VGF application flow ........................................................................................................... 2-43
Table 2.12 Kick-off meeting outline ....................................................................................................... 2-44
Figure 2.26 Business scheme ................................................................................................................... 2-45
Table 2.13 Risk allocation ...................................................................................................................... 2-46
Figure 2.27 Kickoff meeting .................................................................................................................... 2-48
Figure 3.1 Incinerator method .................................................................................................................. 3-1
Figure 3.2 Number of waste incinerators introduced throughout the world ............................................ 3-2
Figure 3.3 Ratio of incineration methods introduced throughout the world ............................................ 3-2
Table 3.1 Overview of Incinerator types ................................................................................................ 3-3
Table 3.2 Comparison between Incinerator types ................................................................................... 3-4
Table 3.3 Overview of gasifying and melting furnace types .................................................................. 3-5
Table 3.4 Comparison between types of gasifying and melting furnaces ............................................... 3-6
Table 3.5 Construction and operation costs ............................................................................................ 3-7
Table 3.6 Stability ................................................................................................................................... 3-8
Table 3.7 Amount of residue .................................................................................................................. 3-9
Table 3.8 Environmental load ................................................................................................................. 3-9
Table 3.9 Worldwide introduction results ............................................................................................. 3-10
Table 3.10 Summary of comparison of various incineration methods ................................................... 3-10
Figure 3.4 Exhaust gas recirculation system .......................................................................................... 3-13
Figure 3.5 Hot air combustion system ................................................................................................... 3-13
Figure 3.6 Improved air ratio due to the hot air combustion system
(Comparison of results of JFE Engineering)......................................................................... 3-14
Figure 3.7 Improved power output due to the hot air combustion system
(Comparison of results of JFE Engineering)......................................................................... 3-14
Figure 3.8 Mechanism of two-way gas flow furnace ............................................................................. 3-15
Figure 4.1 Summary of incinerator flow .................................................................................................. 4-1
Figure 4.2 Structural drawing of JFE stoker furnace ............................................................................... 4-3
Figure 4.3 Overview of JFE Hybrid ACC ................................................................................................ 4-3
Figure 4.4 Outline flow of fly ash treatment equipment .......................................................................... 4-7
Table 4.1 Waste conditions ..................................................................................................................... 4-7
Table 4.2 Emission standards ................................................................................................................. 4-8
Table 4.3 Specifications of major equipment ......................................................................................... 4-8
Figure 4.5 Overall schedule ................................................................................................................... 4-10
vii
Table 4.4 Construction costs of waste to energy plant .......................................................................... 4-10
Table 4.5 Operator planning ................................................................................................................. 4-11
Table 4.6 List of utilities ....................................................................................................................... 4-12
Table 4.7 Operation costs ..................................................................................................................... 4-13
Table 4.8 Electric power revenue and expenditure ............................................................................... 4-14
Figure 5.1 Organizational chart of central ministries and agencies in Indonesia ..................................... 5-1
Table 6.1 Differences between project finance and corporate finance ................................................... 6-2
Figure 6.1 JICA investment scheme (estimate) ........................................................................................ 6-4
Figure 6.2 Security package (Source: Development Bank of Japan) ....................................................... 6-6
Figure 6.3 PPP implementation process ................................................................................................. 6-10
Table 6.2 Risk sharing in waste to energy business .............................................................................. 6-13
Figure 6.4 Plant construction formation estimate chart.......................................................................... 6-18
Figure 6.5 Risk classifications ............................................................................................................... 6-20
Figure 6.6 O&M structure image ........................................................................................................... 6-22
Figure 7.1 Implementation structure (draft) ............................................................................................. 7-1
Table 7.1 Conditions required for implementing business (for Indonesia) ............................................. 7-3
Table 8.1 Scope of work related to incineration residue ......................................................................... 8-2
Table 8.2 Project finance procurement cost ............................................................................................ 8-2
Table 8.3 Specifications of waste to energy plant equipment ................................................................. 8-3
Table 8.4 Fuel (waste quality) ................................................................................................................ 8-3
Table 8.5 Construction fees .................................................................................................................... 8-4
Table 8.6 Operational costs .................................................................................................................... 8-4
Table 8.7 Commissioning costs .............................................................................................................. 8-5
Table 8.8 Various insurance fees ............................................................................................................ 8-5
Table 8.9 Corporate tax .......................................................................................................................... 8-6
Table 8.10 Prerequisites for profitability evaluation ................................................................................ 8-6
Table 8.11 Impacts of the fluctuations in the price of selling electricity to a power company ................. 8-7
Figure 8.1 Impacts of the fluctuations in the price of selling electricity to a power company ................. 8-8
Table 8.12 Impacts of tipping fee fluctuations ......................................................................................... 8-9
Figure 8.2 Impacts of tipping fee fluctuations ....................................................................................... 8-10
Table 8.13 PIRR when VGF is applied................................................................................................... 8-11
Table 8.14 EIRR when VGF is applied .................................................................................................. 8-12
Table 8.15 DSCR when VGF is applied ................................................................................................. 8-12
Table 8.16 PIRR when the JCM subsidy for equipment of plant is applied ........................................... 8-13

viii
Table 8.17 EIRR when the JCM subsidy for equipment of plant is applied ........................................... 8-14
1-1
Chapter 1 Investigation Overview
1.1 Background and Purpose of Investigation
In Asian countries with significant economic growth, increased population and improved standards of
living cause an increase in waste generation and require appropriate waste processing. However in
countries for which the waste processing system is undeveloped and immature, there is concern for the
environmental pollution caused by inappropriate treatment of waste.
On the other hand, for Japan, who has improved advanced waste processing and recycling system
technology, it is necessary to develop that technology for countries that are currently facing waste
processing problems and achieve worldwide low-carbon society. At the 21st Conference of Parties to the
United Nations Framework Convention on Climate Change (COP21) held in November 2015, all
companies participated and the Paris Convention was adopted, becoming a fair and effective framework
and announcement of forming early and steady global warming measures plan and taking measures for
emission reductions and emphasizing the importance of city-to-city collaboration. Also, at the 22nd
Conference of Parties to the United Nations Framework Convention on Climate Change (COP22) held in
2016, Japan gathered 16 countries who signed in a Joint Credit Mechanism (JCM) at the Fourth JCM
Partner Country Assembly for the market mechanism that is an important pillar of the Paris Convention.
There, representatives of the 16 countries and JCM’s progress, including issuing JCM credit, were
welcomed and JCM’s further promotion confirmed.
Therefore, this investigation is to evaluate the feasibility of the JCM project based on achieving
city-to-city collaboration for a low-carbon society, partnering with Clean Authority of TOKYO, who has
that know-how, providing guidance of appropriate waste processing for municipal waste in SARBAGITA,
Bali, Indonesia to achieve a resource circulation society.
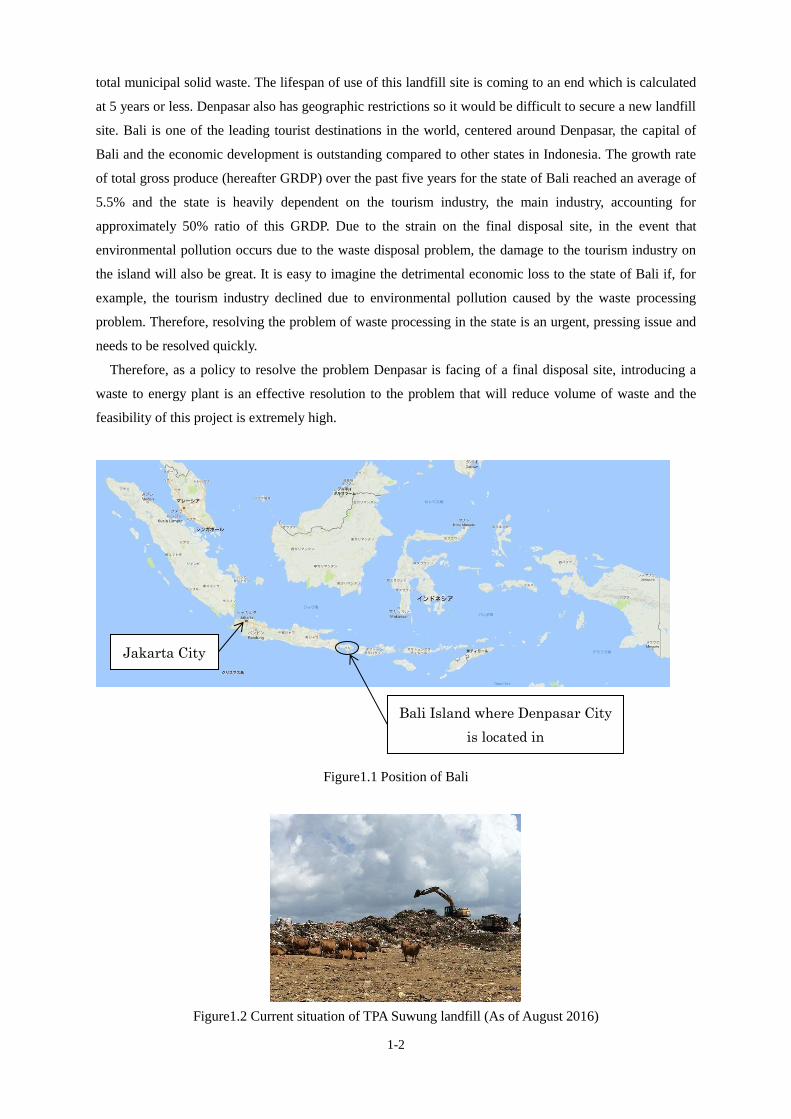
At the local site, lifespan of the existing landfill site is getting tight and it is currently difficult to secure
a new landfill site with Bali’s geographic limitations. Therefore, this investigation evaluates the feasibility
of this business under the premise that a power generation by waste plant would be introduced, facilitating
appropriate waste treatment and improvement of the demand for electric power that Japan already has.
1.2 Business Feasibility
1.2.1 Current state of target regions Bali is approximately 950 km from Jakarta, the capital of Indonesia, located on the East side of the
island of Java. Denpasar is the capital of Bali located in southern Bali. It is located in the middle of the
Lesser Sunda Islands. The area of Denpasar is 123.98 m2 and as of 2005 the population was approximately
570,000, but this increased to approximately 800,000 in 2011 with a recorded population growth of at least
6% per year.
In Denpasar, municipal solid waste (hereafter MSW) is landfilled in the TPA Suwung landfill located in
Denpasar with approximately 800 to 1,000 tons of MSW per day. The economy in Bali is growing greatly
and with the accelerated increase in economic development and population, there is also an increase in the
1-2
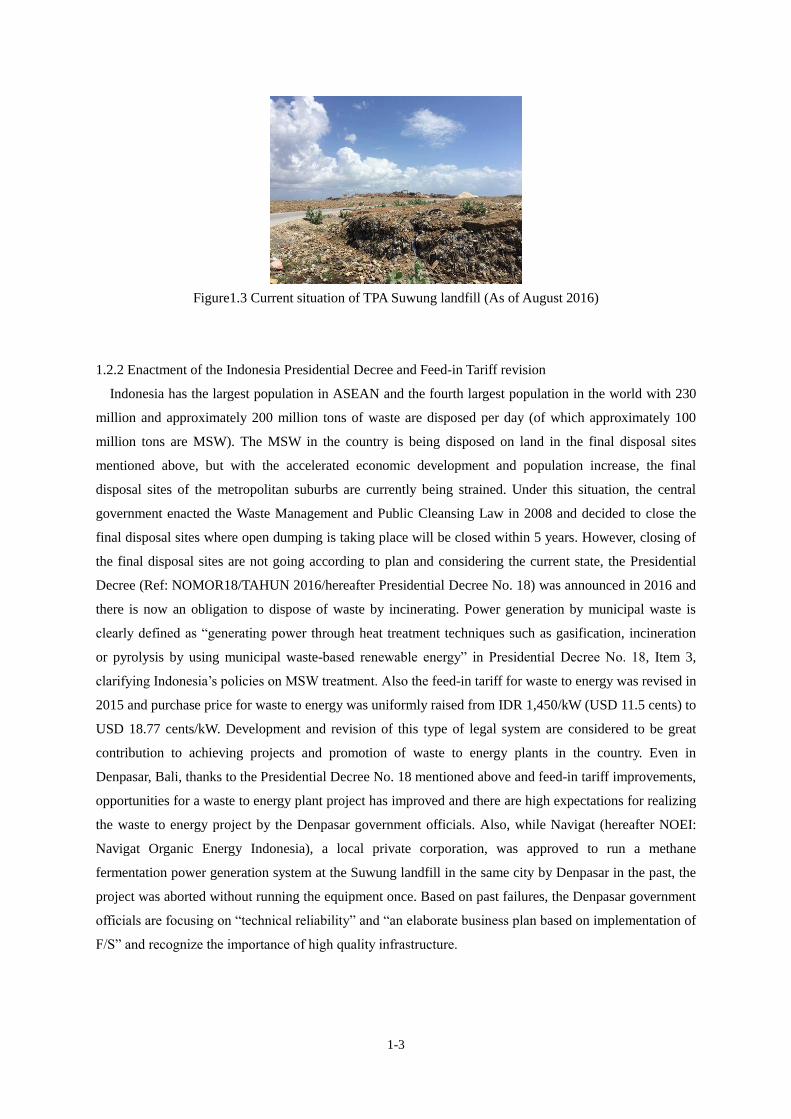
total municipal solid waste. The lifespan of use of this landfill site is coming to an end which is calculated
at 5 years or less. Denpasar also has geographic restrictions so it would be difficult to secure a new landfill
site. Bali is one of the leading tourist destinations in the world, centered around Denpasar, the capital of
Bali and the economic development is outstanding compared to other states in Indonesia. The growth rate
of total gross produce (hereafter GRDP) over the past five years for the state of Bali reached an average of
5.5% and the state is heavily dependent on the tourism industry, the main industry, accounting for
approximately 50% ratio of this GRDP. Due to the strain on the final disposal site, in the event that
environmental pollution occurs due to the waste disposal problem, the damage to the tourism industry on
the island will also be great. It is easy to imagine the detrimental economic loss to the state of Bali if, for
example, the tourism industry declined due to environmental pollution caused by the waste processing
problem. Therefore, resolving the problem of waste processing in the state is an urgent, pressing issue and
needs to be resolved quickly.
Therefore, as a policy to resolve the problem Denpasar is facing of a final disposal site, introducing a
waste to energy plant is an effective resolution to the problem that will reduce volume of waste and the
feasibility of this project is extremely high.
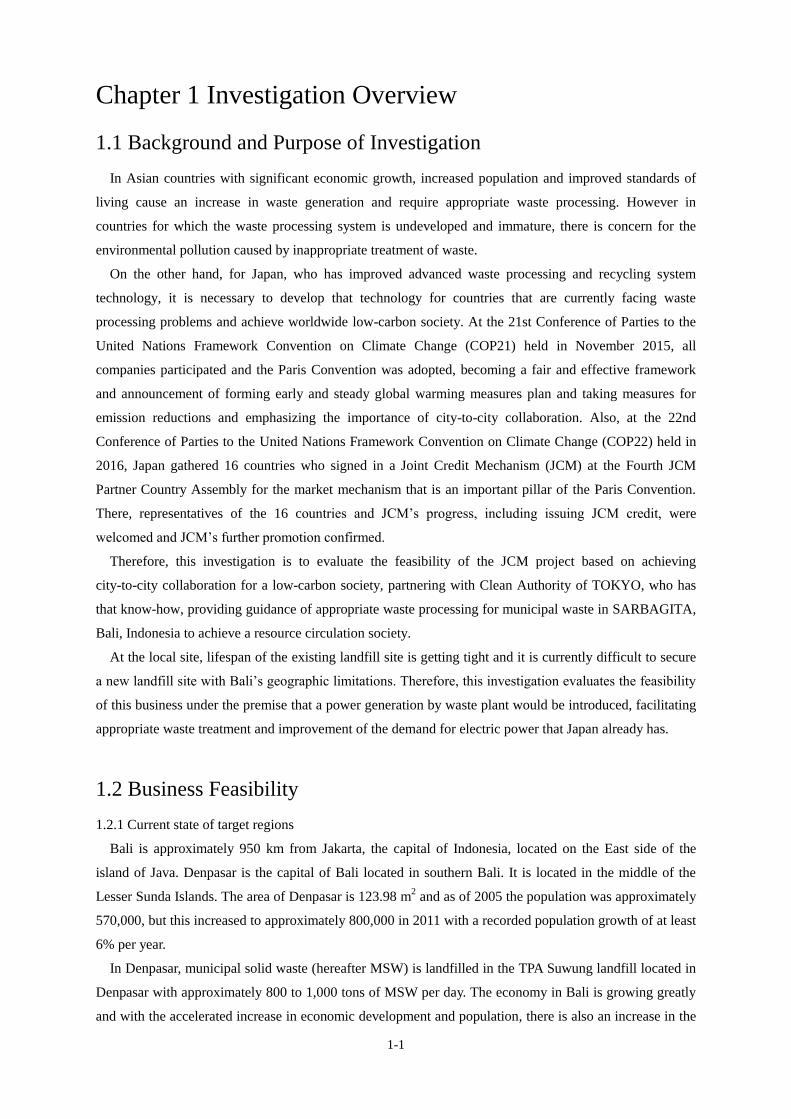
Figure1.1 Position of Bali
Figure1.2 Current situation of TPA Suwung landfill (As of August 2016)
Bali Island where Denpasar City
is located in
Jakarta City
1-3
Figure1.3 Current situation of TPA Suwung landfill (As of August 2016)
1.2.2 Enactment of the Indonesia Presidential Decree and Feed-in Tariff revision
Indonesia has the largest population in ASEAN and the fourth largest population in the world with 230
million and approximately 200 million tons of waste are disposed per day (of which approximately 100
million tons are MSW). The MSW in the country is being disposed on land in the final disposal sites
mentioned above, but with the accelerated economic development and population increase, the final
disposal sites of the metropolitan suburbs are currently being strained. Under this situation, the central
government enacted the Waste Management and Public Cleansing Law in 2008 and decided to close the
final disposal sites where open dumping is taking place will be closed within 5 years. However, closing of
the final disposal sites are not going according to plan and considering the current state, the Presidential
Decree (Ref: NOMOR18/TAHUN 2016/hereafter Presidential Decree No. 18) was announced in 2016 and
there is now an obligation to dispose of waste by incinerating. Power generation by municipal waste is
clearly defined as “generating power through heat treatment techniques such as gasification, incineration
or pyrolysis by using municipal waste-based renewable energy” in Presidential Decree No. 18, Item 3,
clarifying Indonesia’s policies on MSW treatment. Also the feed-in tariff for waste to energy was revised in
2015 and purchase price for waste to energy was uniformly raised from IDR 1,450/kW (USD 11.5 cents) to
USD 18.77 cents/kW. Development and revision of this type of legal system are considered to be great
contribution to achieving projects and promotion of waste to energy plants in the country. Even in
Denpasar, Bali, thanks to the Presidential Decree No. 18 mentioned above and feed-in tariff improvements,
opportunities for a waste to energy plant project has improved and there are high expectations for realizing
the waste to energy project by the Denpasar government officials. Also, while Navigat (hereafter NOEI:
Navigat Organic Energy Indonesia), a local private corporation, was approved to run a methane
fermentation power generation system at the Suwung landfill in the same city by Denpasar in the past, the
project was aborted without running the equipment once. Based on past failures, the Denpasar government
officials are focusing on “technical reliability” and “an elaborate business plan based on implementation of
F/S” and recognize the importance of high quality infrastructure.
1-4
1.3 Investigation Contents
The investigation and implementation contents in this investigation are laid out below.
1) Understanding of the social/economic situation
Collect new, local information based on the Incubation and Overseas Promotion of Japanese Waste
Management and Recycling Industry in 2014, Waste to Energy Project for SARBAGITA in Bali,
Indonesia, Environmental Baseline Survey and reconsider the content. For collection of new, local
information, get the cooperation of local companies and continue collecting information rapidly and
effectively.
2) Legal system investigation
Collect new, local information based on the Incubation and Overseas Promotion of Japanese Waste
Management and Recycling Industry in 2014, Waste to Energy Project for SARBAGITA in Bali,
Indonesia, Environmental Baseline Survey and reconsider the content. The various standards,
especially the flue gas emission standards required for plant planning, shall be determined after
agreement with SARBAGITA Solid Waste Management Agency. Also, accept the advice of the
Ministry of Environment and Forestry.
3) Planning of waste to energy plant
Examine the appropriate waste treatment method based on 1 and 2 above. Implement the schematic
design of the plant for the considered waste treatment method. Schematic design creates appropriate
process flow, material balance and layout using past waste to energy plant construction achievements.
Also estimate the construction and operational costs and use it as the base for evaluation of feasibility.
4) Evaluation of feasibility
Evaluate profitability using the construction and operation costs estimated in 3 above. Also,
quantitatively evaluate reduced effects for the burden on environment and perform a comprehensive
evaluation and judgment of feasibility of a low carbon society.
5) Business plan drafting
Prepare business project in order to make the feasibility more concrete.
6) MRV Methodology plan creation
By introducing the waste incineration facility in this proposal, reduction of methane (CH4) and
greenhouse effect gas emission in place of fossil fuel power from the landfill, and appropriate waste
treatment are achieved. Effectively create an MRV methodology plan by utilizing an external
consultant with a lot of experience in creating plans.
7) City-to-city collaboration
Introduce Japanese advanced technology and explain Tokyo’s waste treatment management
operation methods and international cooperation arrangement. Contribute to improvements of the
waste processing management at the SARBAGITA Solid Waste Management Agency in the region
being investigated and reinforce the partnership between cities.
1-5
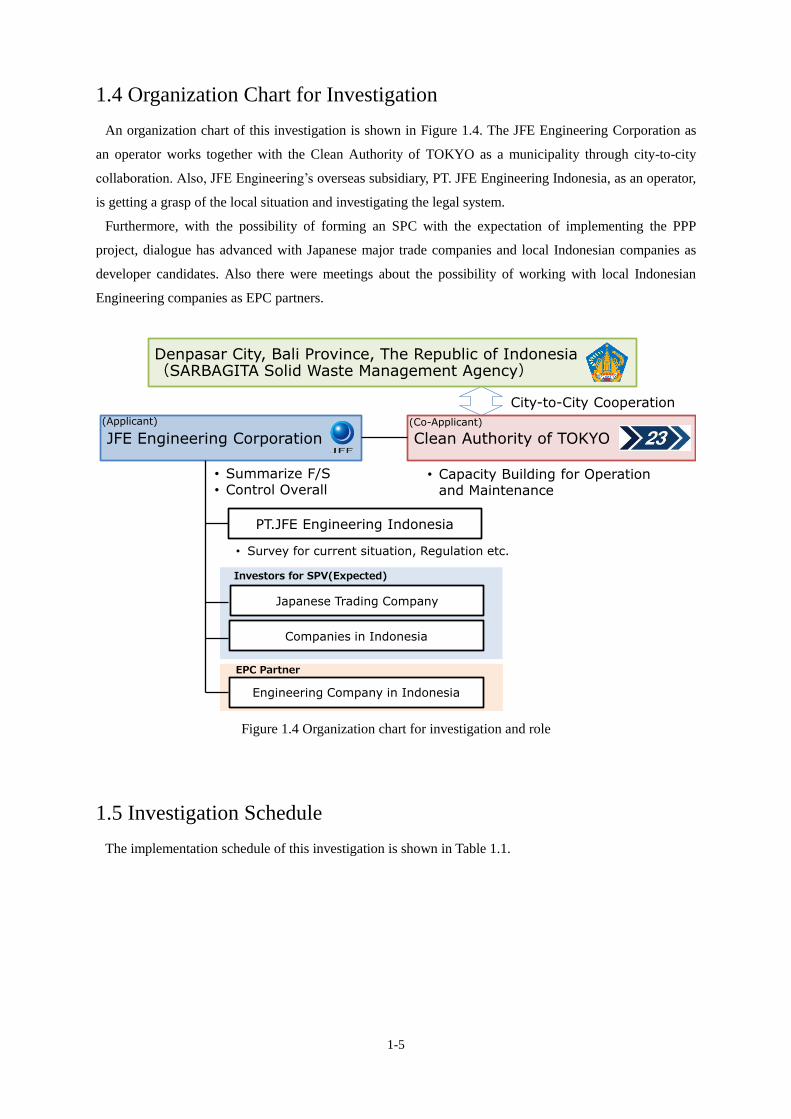
1.4 Organization Chart for Investigation
An organization chart of this investigation is shown in Figure 1.4. The JFE Engineering Corporation as
an operator works together with the Clean Authority of TOKYO as a municipality through city-to-city
collaboration. Also, JFE Engineering’s overseas subsidiary, PT. JFE Engineering Indonesia, as an operator,
is getting a grasp of the local situation and investigating the legal system.
Furthermore, with the possibility of forming an SPC with the expectation of implementing the PPP
project, dialogue has advanced with Japanese major trade companies and local Indonesian companies as
developer candidates. Also there were meetings about the possibility of working with local Indonesian
Engineering companies as EPC partners.
Figure 1.4 Organization chart for investigation and role
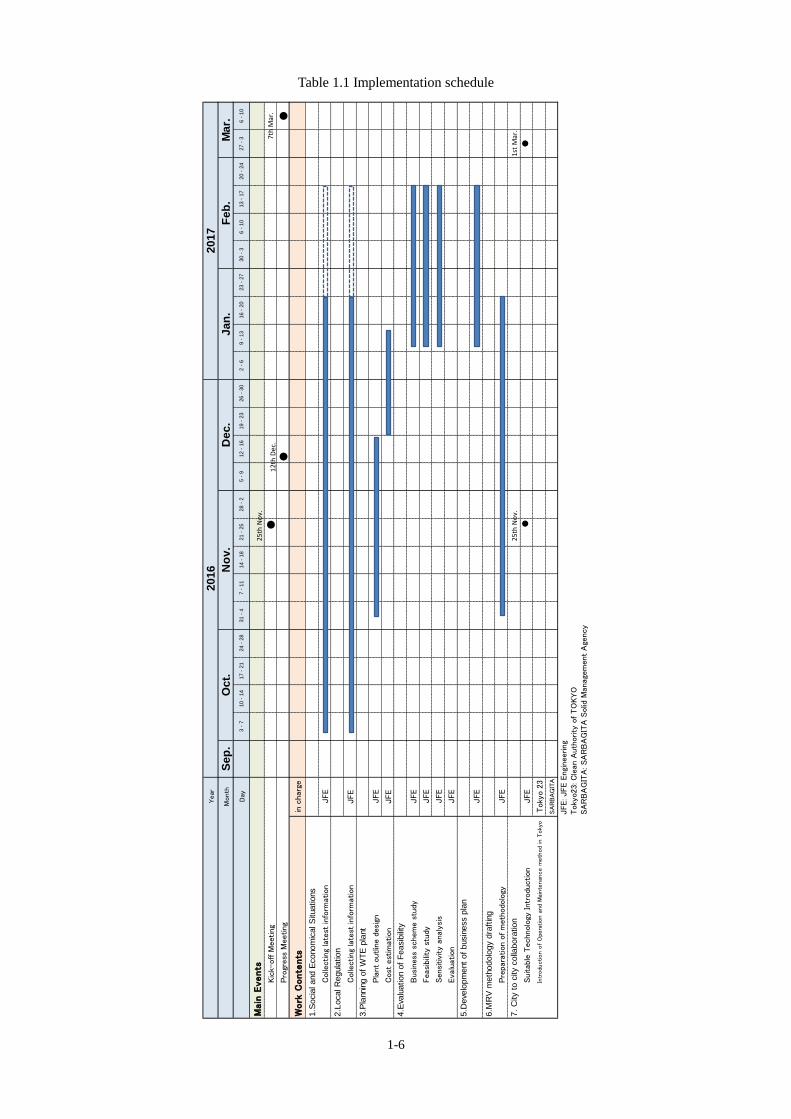
1.5 Investigation Schedule
The implementation schedule of this investigation is shown in Table 1.1.
Denpasar City, Bali Province, The Republic of Indonesia (SARBAGITA Solid Waste Management Agency)
Clean Authority of TOKYOJFE Engineering Corporation
City-to-City Cooperation
• Capacity Building for Operation and Maintenance
• Summarize F/S• Control Overall
(Applicant) (Co-Applicant)
PT.JFE Engineering Indonesia
Japanese Trading Company
• Survey for current situation, Regulation etc.
Engineering Company in Indonesia
Companies in Indonesia
Investors for SPV(Expected)
EPC Partner
1-6
Table 1.1 Implementation schedule
Year
Month
Se
p.
Day
3 -
710 -
14
17 -
21
24 -
28
31 -
47 -
11
14 -
18
21 -
25
28 -
25 -
912 -
16
19 -
23
26 -
30
2 -
69 -
13
16 -
20
23 -
27
30 -
36 -
10
13 -
17
20 -
24
27 -
36 -
10
Main
Events
Kic
k-off M
eeting
●
Pro
gress
Meeting
●●
Work
Conte
nts
in c
har
ge
1.S
ocia
l and E
conom
ical S
ituations
Colle
cting
late
st in
form
atio
nJFE
2.L
ocal R
egula
tion
Colle
cting
late
st in
form
atio
nJFE
3.P
lannin
g o
f W
TE
pla
nt
Pla
nt
outlin
e d
esi
gnJFE
Cost
est
imat
ion
JFE
4.E
valu
ation o
f F
easib
ility
Busi
ness
schem
e s
tudy
JFE
Feas
ibility
stu
dyJFE
Sensi
tivi
ty a
nal
ysis
JFE
Eva
luat
ion
JFE
5.D
eve
lopm
ent
of
busin
ess p
lan
JFE
6.M
RV
meth
odolo
gy d
raft
ing
Pre
par
ation o
f m
eth
odolo
gyJFE
7.
City t
o c
ity c
olla
bora
tion
Suitab
le T
echnolo
gy Intr
odu
ction
JFE
●●
Intr
odu
ction o
f O
pera
tion a
nd
Mai
nte
nan
ce m
eth
od
in T
oky
oToky
o 2
3
SA
RB
AG
ITA
JFE: JFE E
ngi
neering
Toky
o23: C
lean
Auth
ority
of TO
KYO
SA
RB
AG
ITA
: SA
RB
AG
ITA
Sol
id M
anag
em
ent
Age
ncy
2016
2017
Oc
t.N
ov
.D
ec
.J
an
.F
eb
.M
ar.
12
th D
ec.
25th
No
v.
25
th N
ov.
1st
Mar
.
7th
Mar
.
2-1
Chapter 2 Current Survey in the Target Region
2.1 Social and economic situation
2.1.1 Overview of the Republic of Indonesia
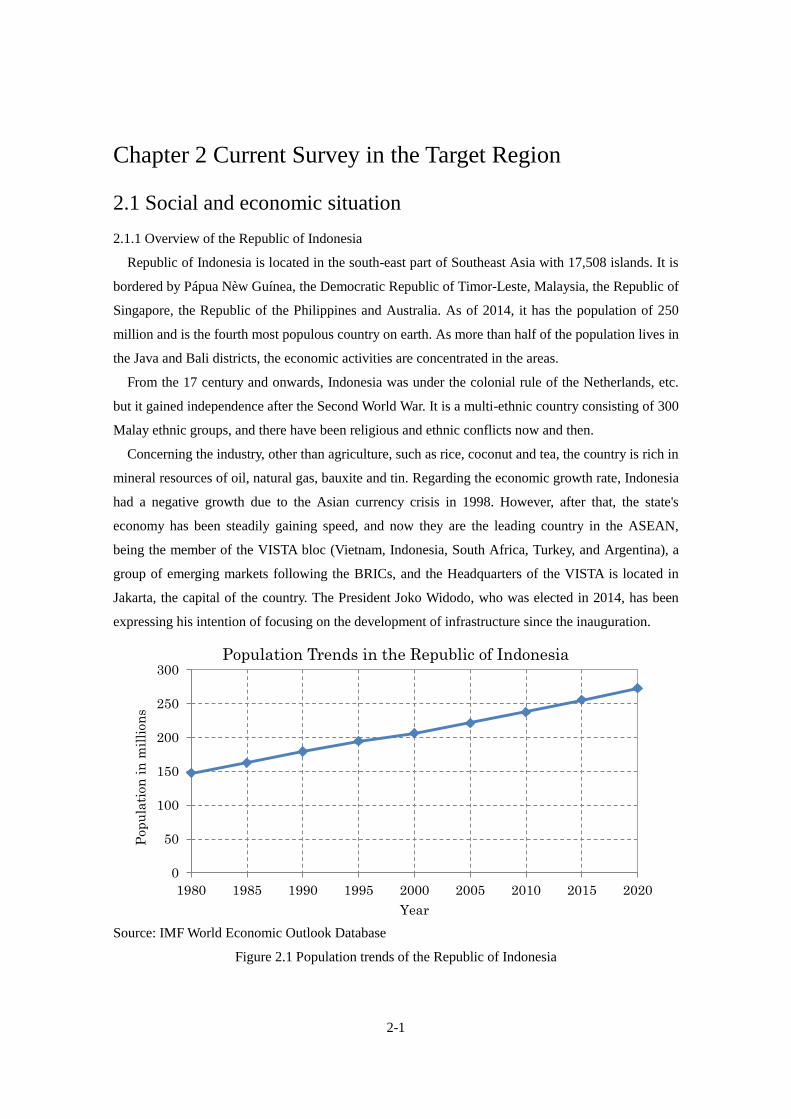
Republic of Indonesia is located in the south-east part of Southeast Asia with 17,508 islands. It is
bordered by Pápua Nèw Guínea, the Democratic Republic of Timor-Leste, Malaysia, the Republic of
Singapore, the Republic of the Philippines and Australia. As of 2014, it has the population of 250
million and is the fourth most populous country on earth. As more than half of the population lives in
the Java and Bali districts, the economic activities are concentrated in the areas.
From the 17 century and onwards, Indonesia was under the colonial rule of the Netherlands, etc.
but it gained independence after the Second World War. It is a multi-ethnic country consisting of 300
Malay ethnic groups, and there have been religious and ethnic conflicts now and then.
Concerning the industry, other than agriculture, such as rice, coconut and tea, the country is rich in
mineral resources of oil, natural gas, bauxite and tin. Regarding the economic growth rate, Indonesia
had a negative growth due to the Asian currency crisis in 1998. However, after that, the state's
economy has been steadily gaining speed, and now they are the leading country in the ASEAN,
being the member of the VISTA bloc (Vietnam, Indonesia, South Africa, Turkey, and Argentina), a
group of emerging markets following the BRICs, and the Headquarters of the VISTA is located in
Jakarta, the capital of the country. The President Joko Widodo, who was elected in 2014, has been
expressing his intention of focusing on the development of infrastructure since the inauguration.
Source: IMF World Economic Outlook Database
Figure 2.1 Population trends of the Republic of Indonesia
0
50
100
150
200
250
300
1980 1985 1990 1995 2000 2005 2010 2015 2020
Pop
ula
tion
in
mil
lion
s
Year
Population Trends in the Republic of Indonesia
2-2
2.1.2 Overview of Indonesian economy
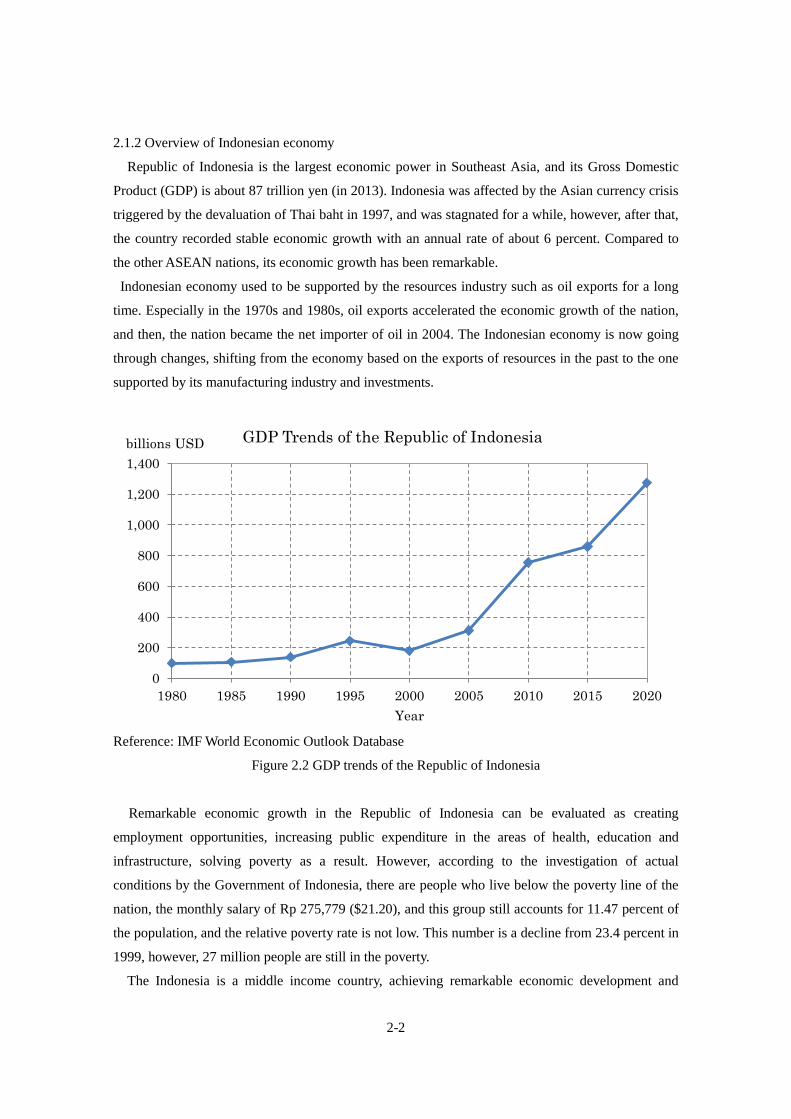
Republic of Indonesia is the largest economic power in Southeast Asia, and its Gross Domestic
Product (GDP) is about 87 trillion yen (in 2013). Indonesia was affected by the Asian currency crisis
triggered by the devaluation of Thai baht in 1997, and was stagnated for a while, however, after that,
the country recorded stable economic growth with an annual rate of about 6 percent. Compared to
the other ASEAN nations, its economic growth has been remarkable.
Indonesian economy used to be supported by the resources industry such as oil exports for a long
time. Especially in the 1970s and 1980s, oil exports accelerated the economic growth of the nation,
and then, the nation became the net importer of oil in 2004. The Indonesian economy is now going
through changes, shifting from the economy based on the exports of resources in the past to the one
supported by its manufacturing industry and investments.
Reference: IMF World Economic Outlook Database
Figure 2.2 GDP trends of the Republic of Indonesia
Remarkable economic growth in the Republic of Indonesia can be evaluated as creating
employment opportunities, increasing public expenditure in the areas of health, education and
infrastructure, solving poverty as a result. However, according to the investigation of actual
conditions by the Government of Indonesia, there are people who live below the poverty line of the
nation, the monthly salary of Rp 275,779 ($21.20), and this group still accounts for 11.47 percent of
the population, and the relative poverty rate is not low. This number is a decline from 23.4 percent in
1999, however, 27 million people are still in the poverty.
The Indonesia is a middle income country, achieving remarkable economic development and
0
200
400
600
800
1,000
1,200
1,400
1980 1985 1990 1995 2000 2005 2010 2015 2020
billions USD
Year
GDP Trends of the Republic of Indonesia
2-3
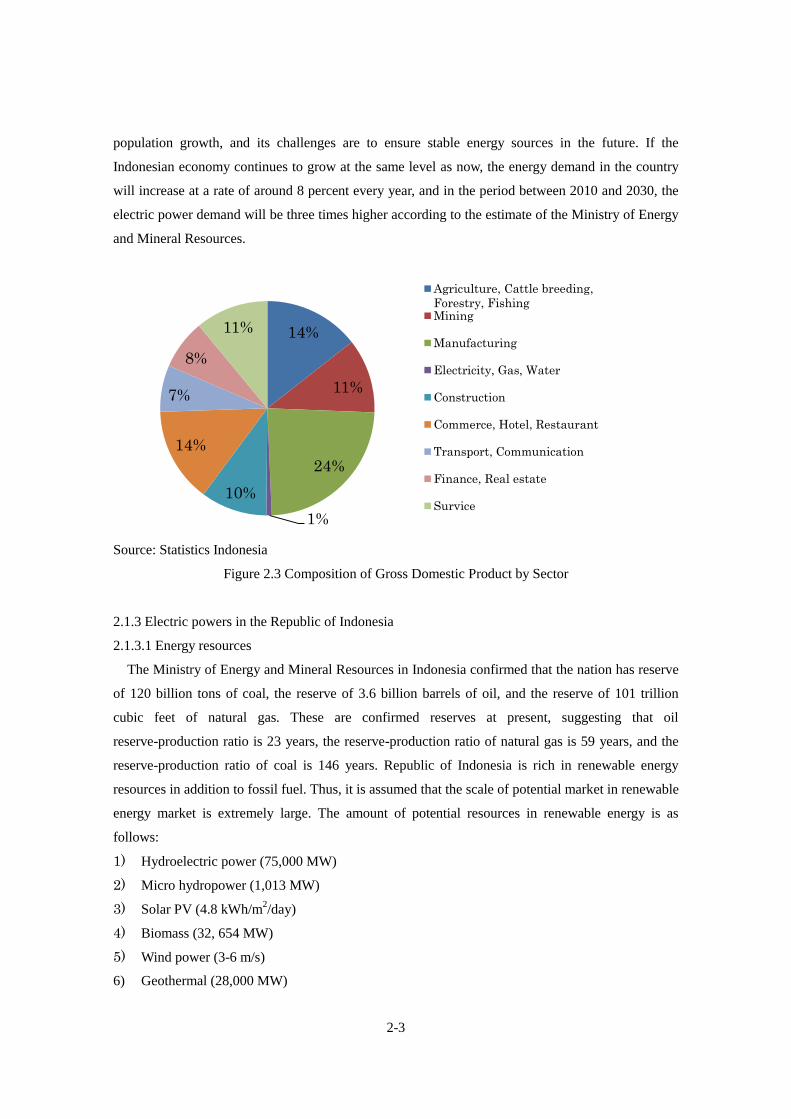
population growth, and its challenges are to ensure stable energy sources in the future. If the
Indonesian economy continues to grow at the same level as now, the energy demand in the country
will increase at a rate of around 8 percent every year, and in the period between 2010 and 2030, the
electric power demand will be three times higher according to the estimate of the Ministry of Energy
and Mineral Resources.
Source: Statistics Indonesia
Figure 2.3 Composition of Gross Domestic Product by Sector
2.1.3 Electric powers in the Republic of Indonesia
2.1.3.1 Energy resources
The Ministry of Energy and Mineral Resources in Indonesia confirmed that the nation has reserve
of 120 billion tons of coal, the reserve of 3.6 billion barrels of oil, and the reserve of 101 trillion
cubic feet of natural gas. These are confirmed reserves at present, suggesting that oil
reserve-production ratio is 23 years, the reserve-production ratio of natural gas is 59 years, and the
reserve-production ratio of coal is 146 years. Republic of Indonesia is rich in renewable energy
resources in addition to fossil fuel. Thus, it is assumed that the scale of potential market in renewable
energy market is extremely large. The amount of potential resources in renewable energy is as
follows:
1) Hydroelectric power (75,000 MW)
2) Micro hydropower (1,013 MW)
3) Solar PV (4.8 kWh/m2/day)
4) Biomass (32, 654 MW)
5) Wind power (3-6 m/s)
6) Geothermal (28,000 MW)
14%
11%
24%
1%
10%
14%
7%
8%
11%
Agriculture, Cattle breeding,
Forestry, FishingMining
Manufacturing
Electricity, Gas, Water
Construction
Commerce, Hotel, Restaurant
Transport, Communication
Finance, Real estate
Survice
2-4
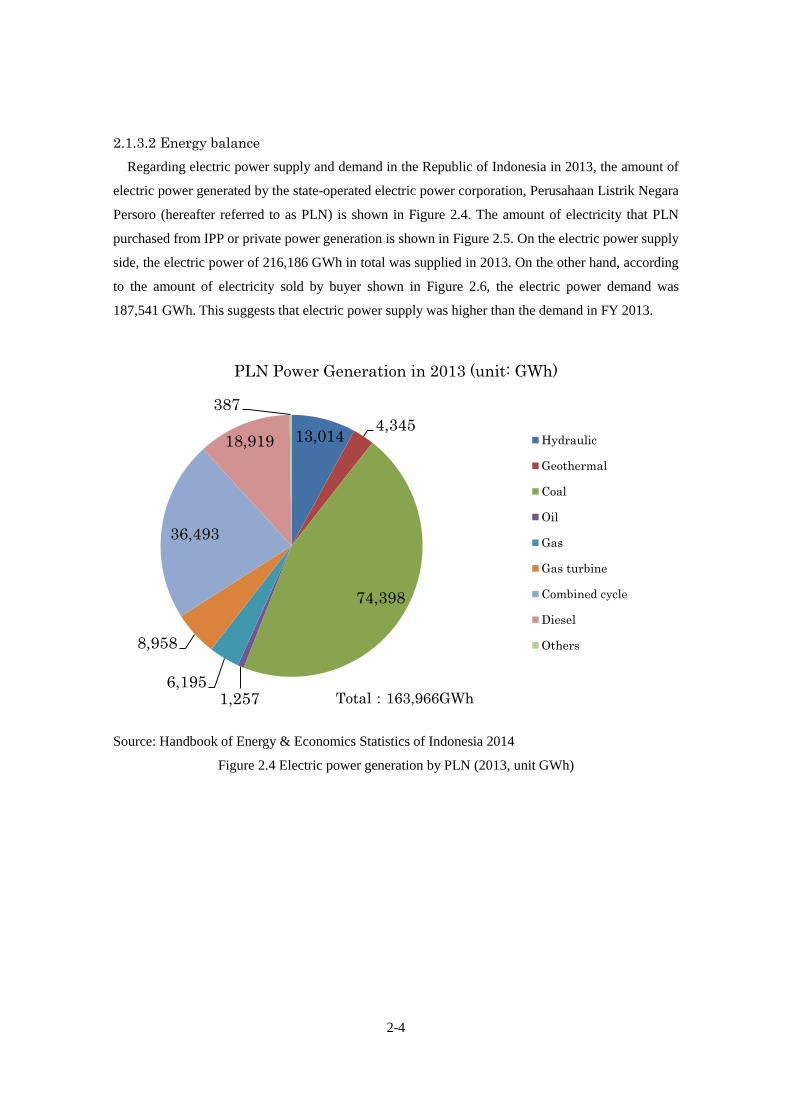
2.1.3.2 Energy balance
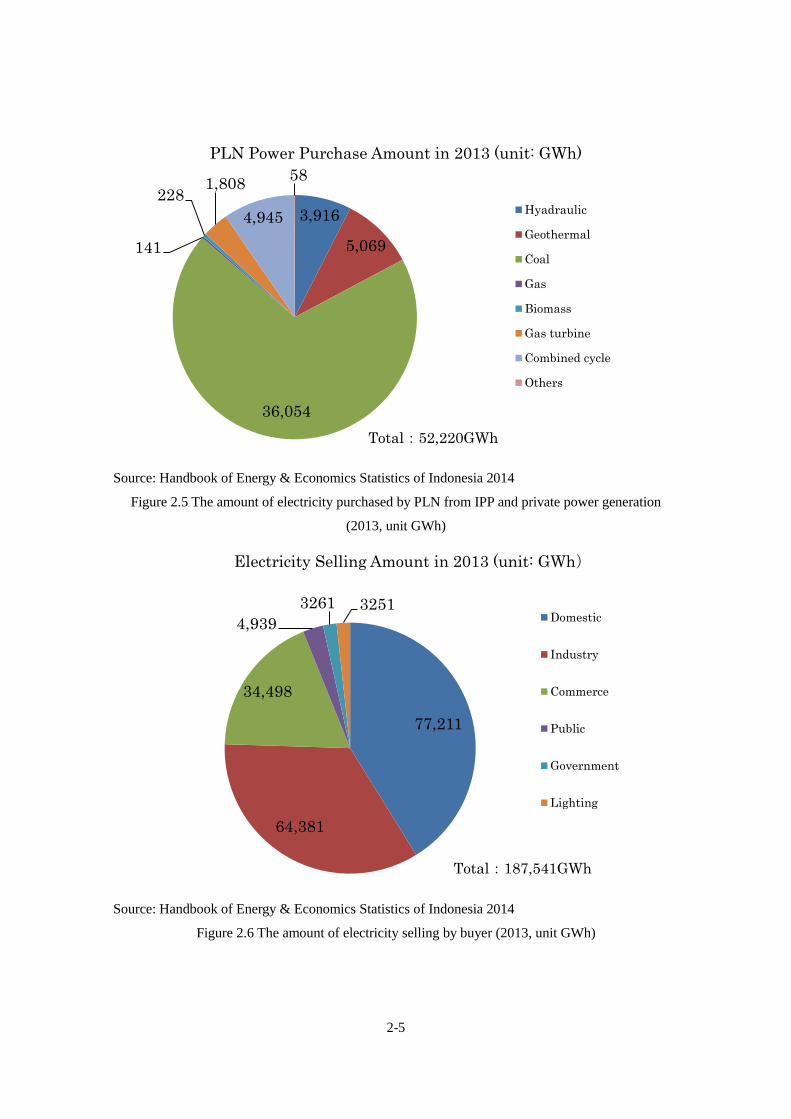
Regarding electric power supply and demand in the Republic of Indonesia in 2013, the amount of
electric power generated by the state-operated electric power corporation, Perusahaan Listrik Negara
Persoro (hereafter referred to as PLN) is shown in Figure 2.4. The amount of electricity that PLN
purchased from IPP or private power generation is shown in Figure 2.5. On the electric power supply
side, the electric power of 216,186 GWh in total was supplied in 2013. On the other hand, according
to the amount of electricity sold by buyer shown in Figure 2.6, the electric power demand was
187,541 GWh. This suggests that electric power supply was higher than the demand in FY 2013.
Source: Handbook of Energy & Economics Statistics of Indonesia 2014
Figure 2.4 Electric power generation by PLN (2013, unit GWh)
13,014 4,345
74,398
1,257 6,195
8,958
36,493
18,919
387
PLN Power Generation in 2013 (unit: GWh)
Hydraulic
Geothermal
Coal
Oil
Gas
Gas turbine
Combined cycle
Diesel
Others
Total:163,966GWh
2-5
Source: Handbook of Energy & Economics Statistics of Indonesia 2014
Figure 2.5 The amount of electricity purchased by PLN from IPP and private power generation
(2013, unit GWh)
Source: Handbook of Energy & Economics Statistics of Indonesia 2014
Figure 2.6 The amount of electricity selling by buyer (2013, unit GWh)
3,916
5,069
36,054
141
228 1,808
4,945
58
PLN Power Purchase Amount in 2013 (unit: GWh)
Hyadraulic
Geothermal
Coal
Gas
Biomass
Gas turbine
Combined cycle
Others
Total:52,220GWh
77,211
64,381
34,498
4,939
3261 3251
Electricity Selling Amount in 2013 (unit: GWh)
Domestic
Industry
Commerce
Public
Government
Lighting
Total:187,541GWh
2-6
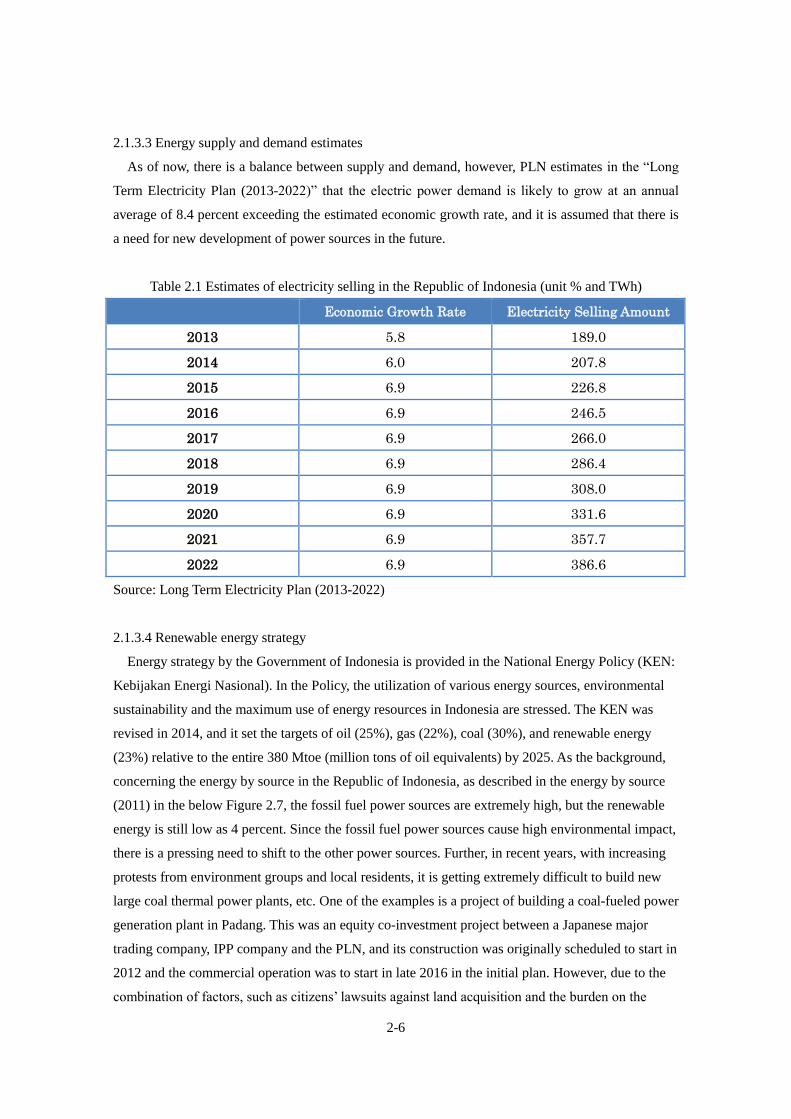
2.1.3.3 Energy supply and demand estimates
As of now, there is a balance between supply and demand, however, PLN estimates in the “Long
Term Electricity Plan (2013-2022)” that the electric power demand is likely to grow at an annual
average of 8.4 percent exceeding the estimated economic growth rate, and it is assumed that there is
a need for new development of power sources in the future.
Table 2.1 Estimates of electricity selling in the Republic of Indonesia (unit % and TWh)
Economic Growth Rate Electricity Selling Amount
2013 5.8 189.0
2014 6.0 207.8
2015 6.9 226.8
2016 6.9 246.5
2017 6.9 266.0
2018 6.9 286.4
2019 6.9 308.0
2020 6.9 331.6
2021 6.9 357.7
2022 6.9 386.6
Source: Long Term Electricity Plan (2013-2022)
2.1.3.4 Renewable energy strategy
Energy strategy by the Government of Indonesia is provided in the National Energy Policy (KEN:
Kebijakan Energi Nasional). In the Policy, the utilization of various energy sources, environmental
sustainability and the maximum use of energy resources in Indonesia are stressed. The KEN was
revised in 2014, and it set the targets of oil (25%), gas (22%), coal (30%), and renewable energy
(23%) relative to the entire 380 Mtoe (million tons of oil equivalents) by 2025. As the background,
concerning the energy by source in the Republic of Indonesia, as described in the energy by source
(2011) in the below Figure 2.7, the fossil fuel power sources are extremely high, but the renewable
energy is still low as 4 percent. Since the fossil fuel power sources cause high environmental impact,
there is a pressing need to shift to the other power sources. Further, in recent years, with increasing
protests from environment groups and local residents, it is getting extremely difficult to build new
large coal thermal power plants, etc. One of the examples is a project of building a coal-fueled power
generation plant in Padang. This was an equity co-investment project between a Japanese major
trading company, IPP company and the PLN, and its construction was originally scheduled to start in
2012 and the commercial operation was to start in late 2016 in the initial plan. However, due to the
combination of factors, such as citizens’ lawsuits against land acquisition and the burden on the

2-7
environment, etc., the project has been delayed significantly.
Figure 2.8 and Figure 2.9 show the current status and the future targets of the energy by source in
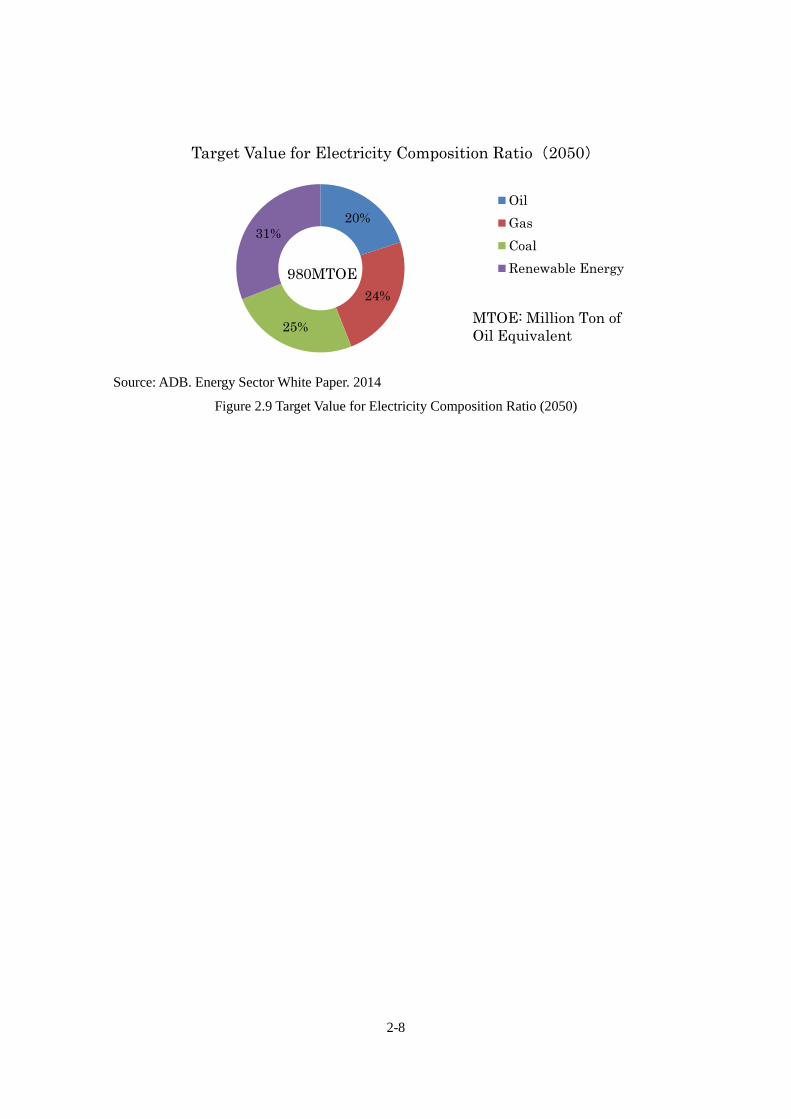
the KEN. In comparison to the energy by source in 2011, the target ratio of renewable energy in
2025 is 23 percent (it was 4 percent in 2011). This suggests that the national energy strategic targets
are to shift from conventional fossil fuel power sources by expanding the use of renewable energy.
Such targets in the KEN will be judgment criteria when the Government sets the energy policy.
The Ministry of Energy and Mineral Resources and the PLN use these targets and are intended to
spread renewal energy. With this, it is expected that this will be a driving force for spreading the
waste-to-energy.
Source: ADB. Energy Sector White Paper. 2014
Figure 2.7 Electricity Composition Ratio (2011)
Source: ADB. Energy Sector White Paper. 2014
Figure 2.8 Target Value for Electricity Composition Ratio (2025)
50%
20%
26%
4%
Electricity Composition Ratio (2011)
Oil
Gas
Coal
Renewable Energy165MTOE
MTOE: Million Ton of
Oil Equivalent
25%
22% 30%
23%
Target Value for Electricity Composition Ratio (2025)
Oil
Gas
Coal
Renewable Energy380MTOE
MTOE: Million Ton of
Oil Equivalent
2-8
Source: ADB. Energy Sector White Paper. 2014
Figure 2.9 Target Value for Electricity Composition Ratio (2050)
20%
24%
25%
31%
Target Value for Electricity Composition Ratio(2050)
Oil
Gas
Coal
Renewable Energy980MTOE
MTOE: Million Ton of
Oil Equivalent

2-9
2.1.4 General aspects of Bali Province
Bali Province is situated between Java Island and Lombok Island. It is facing Bali Sea on the
north side, the Indian Ocean on the south side, Selat Bali on the west side, and Selat Lombok on the
east side. The Province includes the island of Bali, the largest island, with smaller islands of Nusa
Penida, Nusa Ceningan, Nusa Lembongan, Serangan and Menjangan. The total area is 5,632.86 km2.
It consists of 8 Regencies (Jembrana Regency, Tabanan Regency, Badung Regency, Gianya Regency,
Klungkung Regency, Bangli Regency, Karangasem Regency, and Buleleng Regency) and one City
(Denpasar City). The capital of the Province is Denpasar City. As the lower administrative
organization under Regencies and Cities, there are 55 Districts in total in all Bali Provinces. Bali
Province has the population of about 3.89 million in total. The capital of Bali Province, Denpasar,
has the population of about 835, 0001. It is on the increase from 789, 000 in 2010
2. The population
increase rate in the period between 2011 and 2013 in the entire Bali Province is 3.19 percent.
Concerning the density of population, compared to 690 persons/km2 in Bali Province, the
concentration of population is rising in Denpasar city region: 4,170 persons /km2 in Denpasar City,
while 826 persons / km2 in the neighboring Badung Regency.
Figure 2.10 Map of Bali Province in the Republic of Indonesia
1Estimates by the 2012 census by Central Statistics Agency in Bali Province.
2The 2010 census by the Central Statistics Agency in Bali Province.
2-10
2.1.5 Overview of the Bali Province Economy
Gross Regional Domestic Product (GRDP) of Bali Province in FY 2012 was 33 trillion rupiah
(about 280 billion yen) and its economic growth rate has been steady after the Asian currency crisis
with the annual rate of 5.97-6.65% in the period between 2008 and 2012. Also, by the industry, the
tertiary industry accounts for 65 percent, followed by the primary industry of 19 percent and the
secondary industry of 16 percent. GRDP per capita is about 825 dollars, which is 94 percent of the
average in Indonesia.
Tourist industry is the most important industry in Bali Province, and in FY 2011, 7.65 million
foreign travelers visited the place. The number of tourists does not get affected by the seasonal
change, and the highest is in the dry season of July through September. Due to the development of
tourism, there are many lodging facilities and restaurants in the Province. Of about 2.3 million
workforce in Bali Province (2012), the majority of people work in the tertiary industry, which
accounts for 52 percent. Then, it is followed by 26 percent in the primary industry and 22 percent in
the secondary industry. The lowest wage is 967,500 rupiah (they differ depending on the regency),
which is about 60 to 70 percent of the lowest wage in Jakarta City.
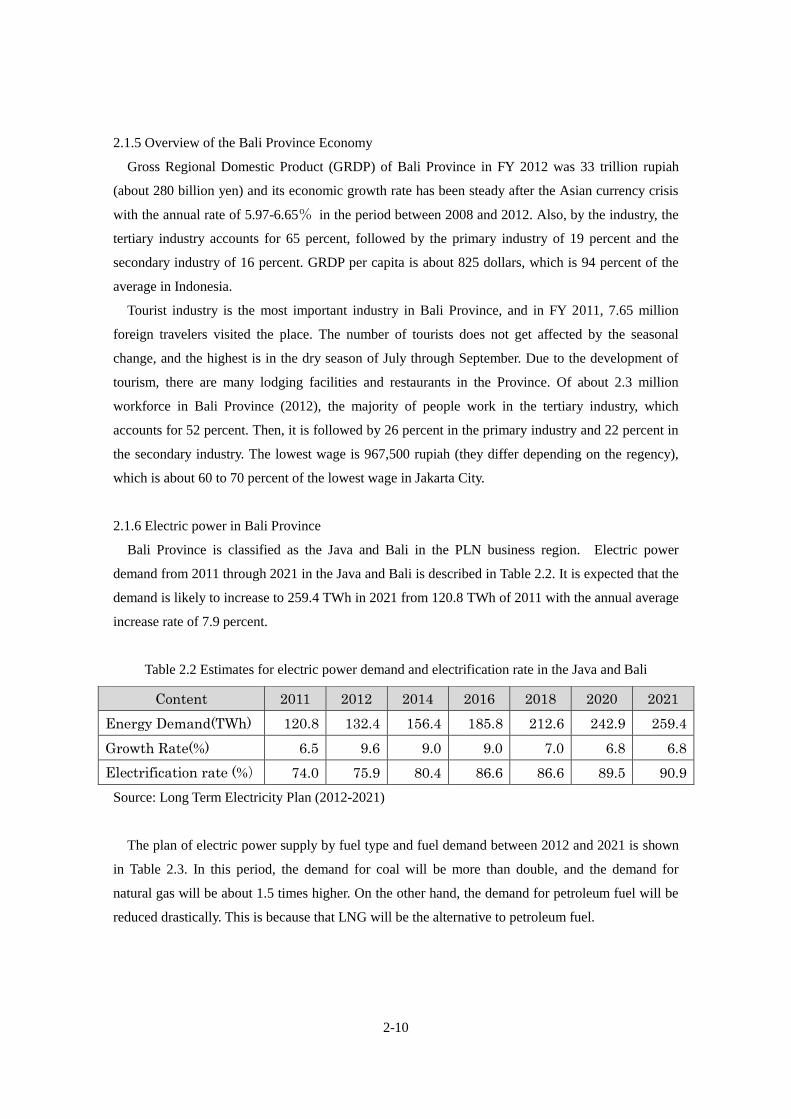
2.1.6 Electric power in Bali Province
Bali Province is classified as the Java and Bali in the PLN business region. Electric power
demand from 2011 through 2021 in the Java and Bali is described in Table 2.2. It is expected that the
demand is likely to increase to 259.4 TWh in 2021 from 120.8 TWh of 2011 with the annual average
increase rate of 7.9 percent.
Table 2.2 Estimates for electric power demand and electrification rate in the Java and Bali
Source: Long Term Electricity Plan (2012-2021)
The plan of electric power supply by fuel type and fuel demand between 2012 and 2021 is shown
in Table 2.3. In this period, the demand for coal will be more than double, and the demand for
natural gas will be about 1.5 times higher. On the other hand, the demand for petroleum fuel will be
reduced drastically. This is because that LNG will be the alternative to petroleum fuel.
Content 2011 2012 2014 2016 2018 2020 2021
Energy Demand(TWh) 120.8 132.4 156.4 185.8 212.6 242.9 259.4
Growth Rate(%) 6.5 9.6 9.0 9.0 7.0 6.8 6.8
Electrification rate (%) 74.0 75.9 80.4 86.6 86.6 89.5 90.9
2-11
Table 2.3 Composition of energy production by fuel in the Java and Bali
Fuel Type 2012 2014 2016 2018 2020 2021
Diesel 7,655 1,828 1,813 428 650 650
Marine
Fuel
1,864 1,482 - - - -
Gas 33,537 48,227 43,843 28,947 27,638 31,901
LNG 5,636 12,929 17,982 26,435 30,442 30,442
Coal 89,601 100,425 130,919 157,044 179,779 193,795
Hydraulic 5,273 5,273 5,807 7,891 8,425 9,162
Geothermal 7,953 8,401 11,651 21,948 30,371 30,371
Total 151,519 178,652 212,102 242,781 277,393 286,408
Source: Long Term Electricity Plan (2012-2021)
2.2 Natural environment
2.2.1 Weather in Bali Province
The Bali has a tropical marine climate. There are two seasons; dry season and rainy season
divided by the transition period. The dry season is between the months of April and October, and the
rainy season is between the months of November and March.
2.2.1.1 Temperature in Bali Province
The annual average temperature of the entire Bali Province in 2012 was 26.8 degC and it recorded
27.3 degC in Denpasar City. The highest temperature in the entire Bali Province was 27.5 degC in
Buleleng Regency, and the minimum temperature was 19.7 degC in Tabanan Regency.
2.2.1.2 The amount of precipitation and humidity in Bali Province
Annual precipitation in 2012 was 1,767 mm. The maximum precipitation recorded throughout the
year was 528.5 mm in March. In recent years, due to the effect of global warming such as the rise in
the atmospheric temperature and the rise in the sea surface temperature, the precipitation pattern is
changing in Bali Province, and the dry season and the rainy season come in a different cycle.
The average humidity of four observation points in Bali Province was 80.5 percent. The maximum
humidity was 96 percent at the Karangasem observation point, and the minimum humidity was
recorded as 27 percent at the Sangra Depasar observation point.
2.2.1.3 The percentage of sunshine in Bali Province
In 2012, the average percentage of sunshine in Bali Island was 69 percent. The lowest percentage
2-12
of sunshine was recorded as 18 percent at the Karangasem observation station in January while the
highest percentage of sunshine was recorded as 95 percent in October at the Sangra Denpasar
observation point.
2.2.2 Topography and geology of Bali Province
2.2.2.1 Topography of Bali Province
In Bali Island, there are a range of mountains in the central part from east to west, with volcanic
groups in between the mountains. The highest mountain in Bali is the Agung Mountain at an altitude
of 3,142 meters. Additionally, there is a range of mountains includingthe Merbuk Mountain (1,356
meters) in Jembrana Regency, the Patas Mountain (1,414 meters) in Buleleng Regency and the
Seraya Mountain (1,058 meters) in Karangasem Regency. Bali is geologically divided by these
ranges of mountains into the northern part with narrow low lands with gentle gradient and the vast
western area with steep gradient. In Bali Province, there are Bratan Lake, Buyan Lake, Tamblingan
Lake and Batur Lake. Unlike the northern part, in the southern part of Bali, rivers are running
through the low land, such as 62,500-meter Ayungtkad River.
2.2.2.2 Geological features in Bali Province
Concerning the geological features in Bali Island, it consists of mainly Regusol and Latasol (red
soil), with slight mixture of the Mediteran and Andasol layers. There is Latasol stratum that is most
subject to erosion across Kalopaks, Petemon, Langikit, and Punpatan in the western part, distributed
across the Punu Mountain, the Pintu Mountain, the Juet Mountain, and the Surya Mountain, and it
accounts for 44.9 percent in the Bali Island. There is a Regusol stratum that is easily subject to
erosion from the eastern part of Amlapura to Tulik, from the Singaraja coast to Suririt, Bubunan,
Kukulkan (near Tamblingan lake, Buyan Lake, and Bratan Lake), Batukal forest, Kusamba village in
the south coast, Sanur, Benoa and a part of Kuta. This stratum accounts for 39.93 percent in Bali.
The Andasol stratum can be found in a part of forest near the mountains of Baturiti, Chandikunin,
Vanitatis, Gobleg, Pupuan, and Batucal. There is Mediteran stratum, which is slightly resistant to
erosion across the hills of Jajiransapunida and the neighboring islands, Kutahill, and Prepattoago.
Additionally, there is alluvium, which is highly resistant to erosion, across Negara, Sumberklampok,
Manggis and Angada.
2-13
2.3 Current status of the waste treatment in the target region
2.3.1 Flow of waste, the amount of production, collection and disposal
Regarding the amount of waste produced in the Republic of Indonesia, it is estimated to be about
80.3 million tons with about 2-3 liters a day per person, 440 million liters a day on the entire land,
and 154 billion liters a year.
As to the details of waste, the percentage of organic waste related to food is higher in bigger cities.
In major cities, such as in Jakarta, Makassar, Surabaya and Bandung, the organic waste accounts for
60 percent or more of the total waste. There are a lot of paper wastes as well, and it accounts for 10
percent or more of the total in most cities. On the other hand, there are a lot of plastic and rubber
waste as well, which accounts for nearly 10 percent. Meanwhile, the percentage of non-organic
waste varies depending on the city, at about 10 percent to 30 percent.
It is expected that the amount of household waste will increase accompanied by population growth.
Providing that the annual population growth rate is 0.9 percent, it is assumed that the total population
will grow to be 262 million in 2020, and the amount of waste generated per person will also go up.
The amount of waste produced per person a day in 1991 was 0.7 kg, however, the amount was
increased to 0.8 kg in 1995. It is assumed that the amount of waste generated will be increased to
0.91 kg in 2020.
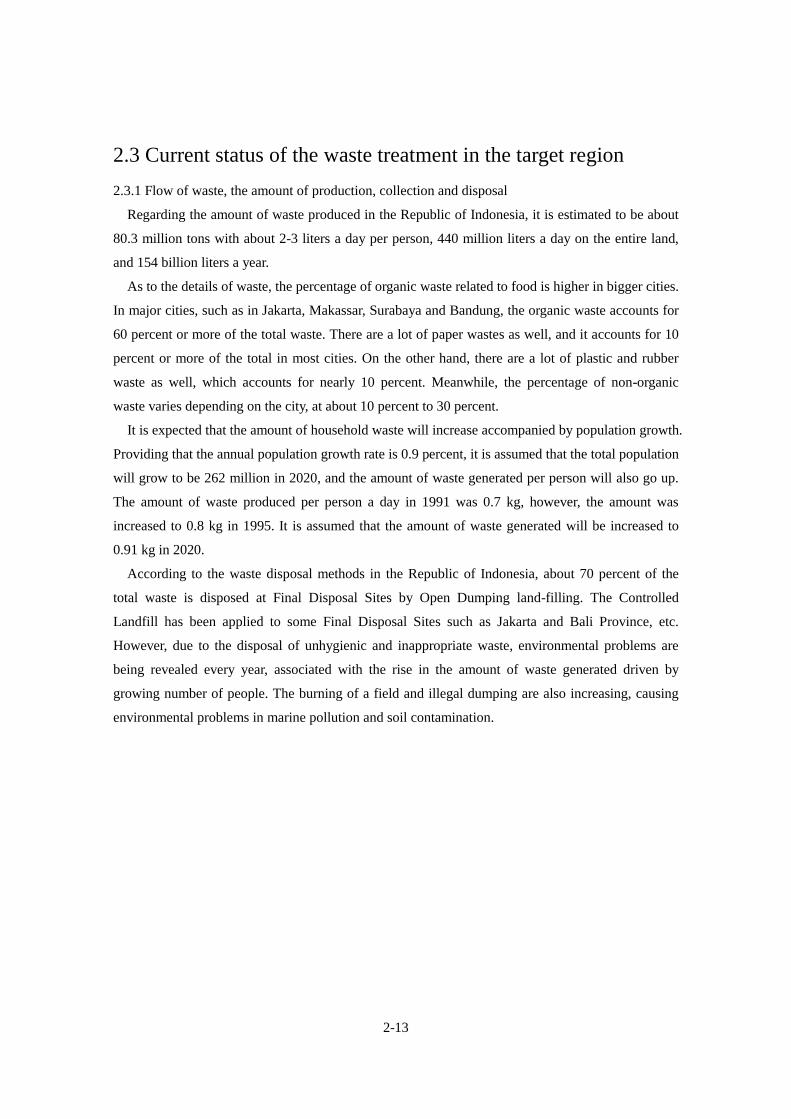
According to the waste disposal methods in the Republic of Indonesia, about 70 percent of the
total waste is disposed at Final Disposal Sites by Open Dumping land-filling. The Controlled
Landfill has been applied to some Final Disposal Sites such as Jakarta and Bali Province, etc.
However, due to the disposal of unhygienic and inappropriate waste, environmental problems are
being revealed every year, associated with the rise in the amount of waste generated driven by
growing number of people. The burning of a field and illegal dumping are also increasing, causing
environmental problems in marine pollution and soil contamination.
2-14
Source: Indonesia Domestic Solid Waste Statistics, MoE, 2008
Figure 2.11 Waste disposal method in the Republic of Indonesia
Regarding the amount of municipal solid waste in SARBAGITA wide area, the amount of waste
received at the Suwung Landfill (TPA: Tempat Pembuangan Akhir meaning Final Disposal Site in
Indonesian language) in 2012 was recorded as about 800 tons a day, and it was about 300 tons a day
in Denpasar City only. As there is no measuring instrument to measure the waste received, such as a
track scale, at Suwung Landfill, the exact amount generated is not known. However, in conducting
this feasibility study, we asked the Denpasar City Environment Bureau to provide data on the
amount of waste received at the Suwung Landfill, and we confirmed the data. According to the
record of the Denpasar City Sanitation Bureau, it is assumed that the amount of waste produced in
Denpasar City in 2013 was 2,700 m3 a day, and the amount of waste carried in by one local resident
was 3.5 – 4 litter a day.
Figure 2.12 shows the amount of waste generated as well as the flow of waste disposal in
Denpasar City based on the interview with the Denpasar City Sanitation Bureau for the
implementation of the feasibility study.
69%
14%
14%
3%
Landfilling
Open Burning
Compost
Illegal Disposal
2-15
Figure 2.12 Flow of waste in Denpasar
Denpasar City Sanitation Bureau said that it was difficult to accurately assess the total amount of
waste produced in Denpasar City because of rampant illegal dumping and the picking of the
valuables at the place where waste was generated. Therefore, in this survey, using the data of
receiving amount of waste provided by the Denpasar City Sanitation Bureau and the numerical
values given through the interviews with the head of Denpasar City Environment Bureau and with
other concerned parties, we calculated backwards from the ratio relative to the amount generated in
each process that is assumed as the amount received at Suwung Landfill in 2012. With this, the total
amount generated was estimated as 840 tons a day. Of the amount produced, it is assumed that 5
percent is illegally dumped. And the remaining 95 percent is brought to the Temporary Disposal Site
(TPS: Tempat Pembuangan Sampah- meaning the waste disposal area in Indonesian language), or
directly brought to the Suwung Landfill. Of the waste carried out, 80 percent is carried into TPS by
residents or the collectors hired by the community in rear-cars or tricycle truck, etc. The remaining
20 percent is collected by private dealers to be received by TPS, and some of which are directly
Recycle 59 tons/day
Suwung Landfill
800 tons/day
59 tons/day
Generation source Collection by government Final disposal
Housing
/Company
840
tons/day
Housing
/Company
840
tons/day
Collection
by the
public
citizen
640
tons/day
Collection
by the
private
sector
160
tons/day
Container
/Temporary
collection
site
Intermediate
treatment
facilities
Illegal
Disposal
42 tons/day Compost
20 m3/day
2-16
transported to Final Disposal Sites. At TPS, the waste pickers pick the valuables.
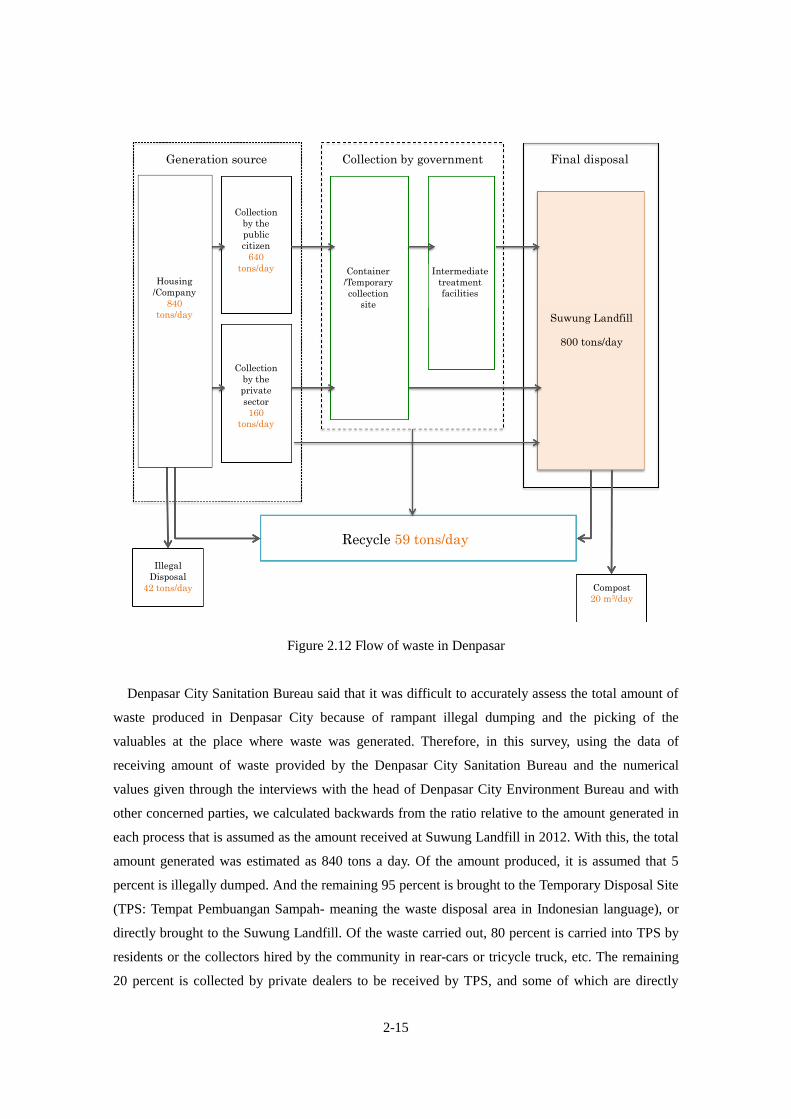
The waste received at the TPS will be transported to Waste Transfer Facility in the 35 vehicles of 6
m3 owned by the Sanitation Bureau. The number of trips is four times a day. Waste transshipped at
the Waste Transfer Facility will be delivered to the Suwung Landfill. Suwung Landfill is operated
under the management of the SARBAGITA Solid Waste Management Agency, and in the site area of
32 ha, there are Open Dumping areas in five zones, and Sanitary Landfill in one zone (the Controlled
Landfill Zone). The use of zones at Suwung Landfill is summarized in the below Figure 2.13. At
present, Open Dumping Sites in Block II through Block V have been closed, and only Block I and
the Controlled Landfill Zone (used only in the rainy season) are currently used.
Figure 2.13 Overview on the zones of Suwung Landfill (as shown on site)
Sanitary Landfill(In Use)
BLOCK II(Closed)
BLOCK V(Closed)
BLOCK IV(Closed)
BLOCK I(in Use)
BLOCK III(Closed)
Facilities of Navigat Energy(Shutdown)
SUWUNG Landfill Map
2-17
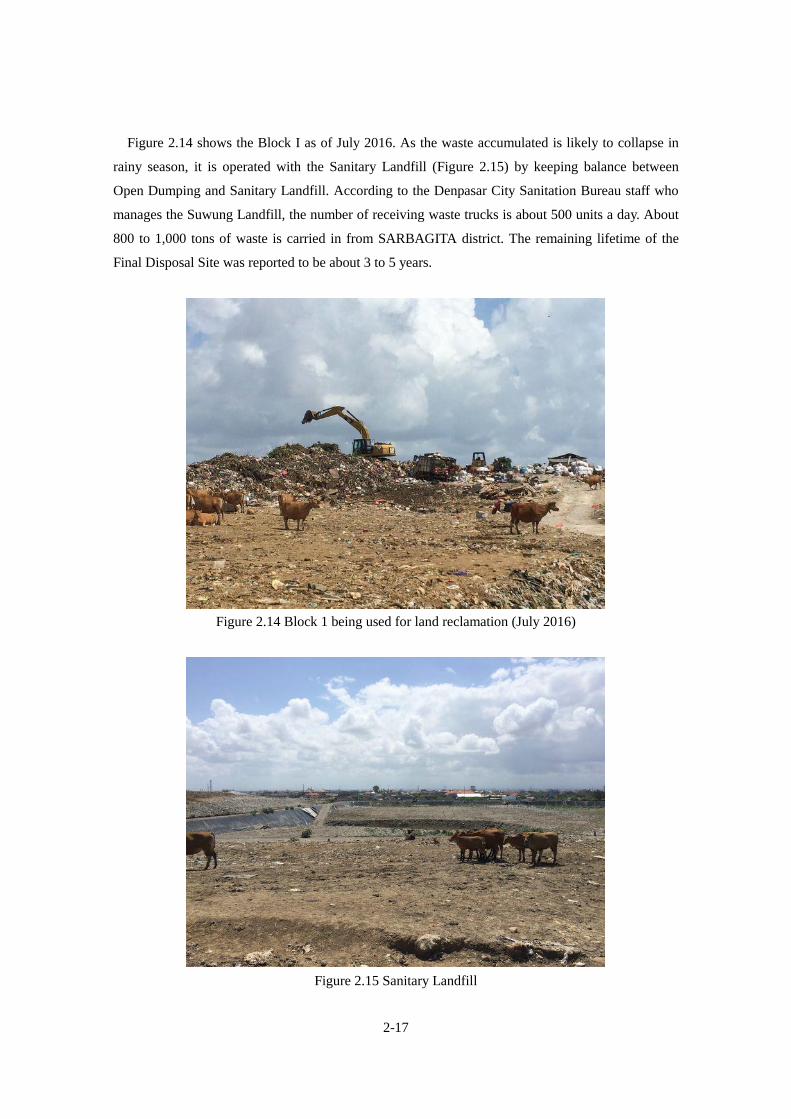
Figure 2.14 shows the Block I as of July 2016. As the waste accumulated is likely to collapse in
rainy season, it is operated with the Sanitary Landfill (Figure 2.15) by keeping balance between
Open Dumping and Sanitary Landfill. According to the Denpasar City Sanitation Bureau staff who
manages the Suwung Landfill, the number of receiving waste trucks is about 500 units a day. About
800 to 1,000 tons of waste is carried in from SARBAGITA district. The remaining lifetime of the
Final Disposal Site was reported to be about 3 to 5 years.
Figure 2.14 Block 1 being used for land reclamation (July 2016)
Figure 2.15 Sanitary Landfill
2-18
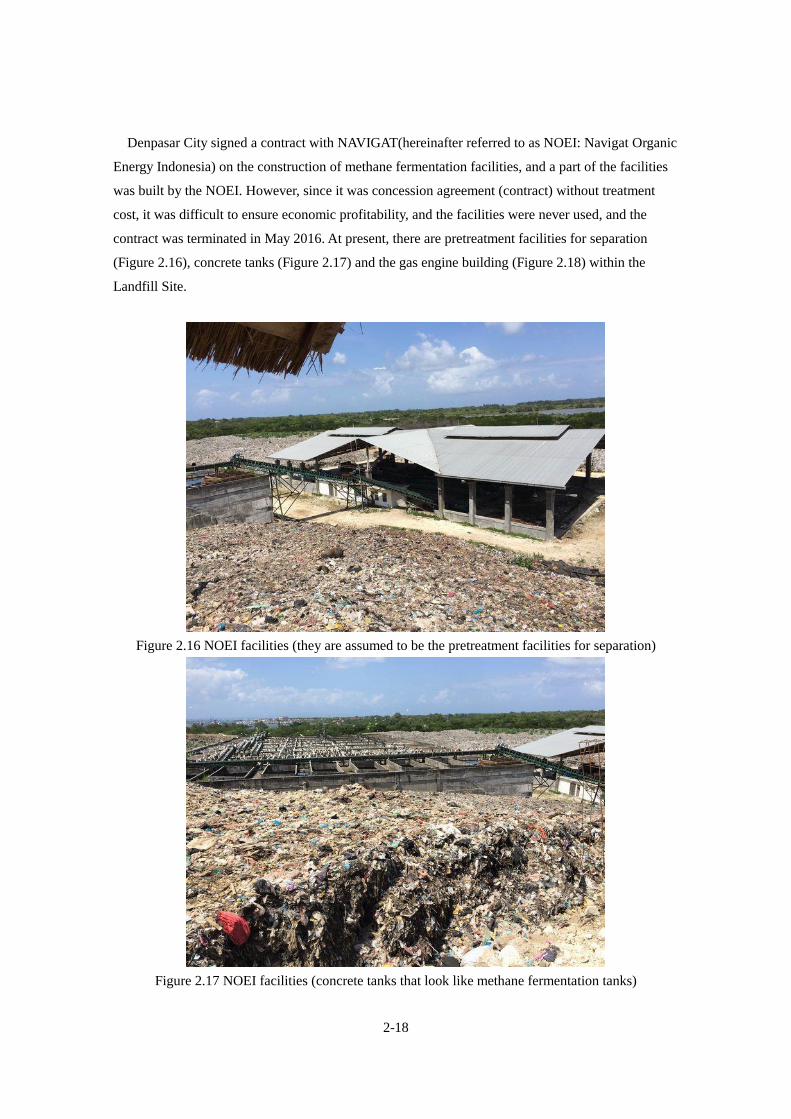
Denpasar City signed a contract with NAVIGAT(hereinafter referred to as NOEI: Navigat Organic
Energy Indonesia) on the construction of methane fermentation facilities, and a part of the facilities
was built by the NOEI. However, since it was concession agreement (contract) without treatment
cost, it was difficult to ensure economic profitability, and the facilities were never used, and the
contract was terminated in May 2016. At present, there are pretreatment facilities for separation
(Figure 2.16), concrete tanks (Figure 2.17) and the gas engine building (Figure 2.18) within the
Landfill Site.
Figure 2.16 NOEI facilities (they are assumed to be the pretreatment facilities for separation)
Figure 2.17 NOEI facilities (concrete tanks that look like methane fermentation tanks)
2-19
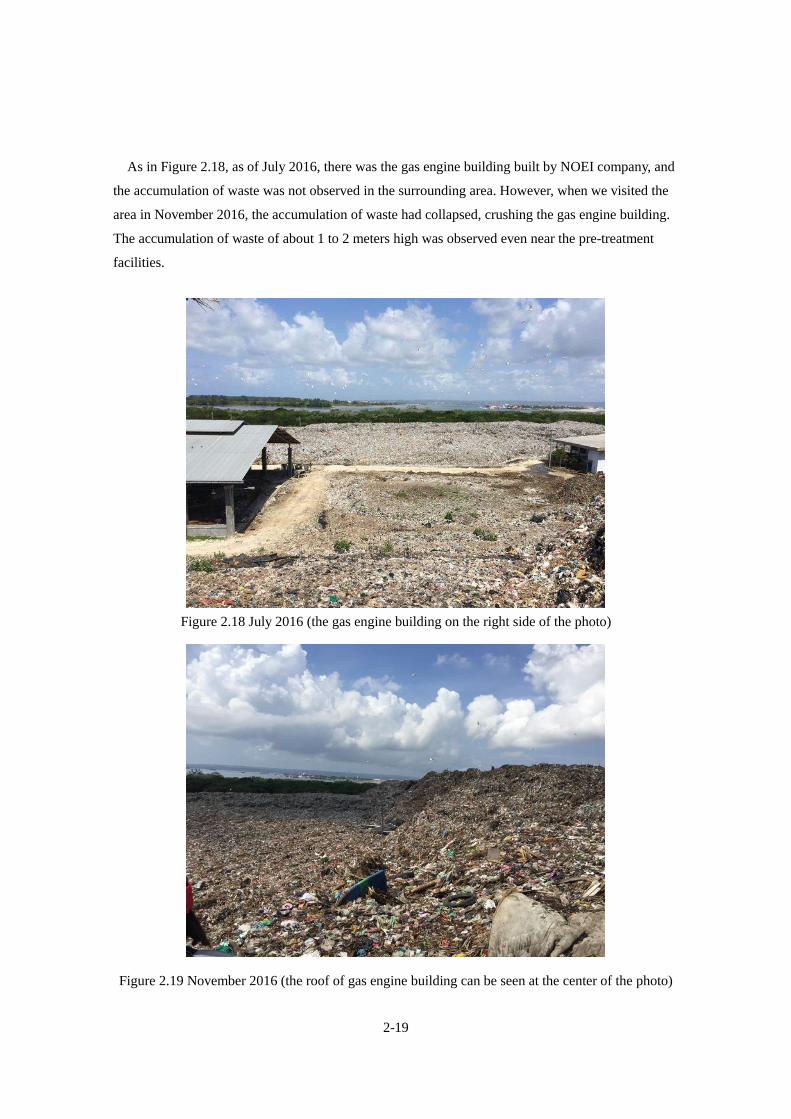
As in Figure 2.18, as of July 2016, there was the gas engine building built by NOEI company, and
the accumulation of waste was not observed in the surrounding area. However, when we visited the
area in November 2016, the accumulation of waste had collapsed, crushing the gas engine building.
The accumulation of waste of about 1 to 2 meters high was observed even near the pre-treatment
facilities.
Figure 2.18 July 2016 (the gas engine building on the right side of the photo)
Figure 2.19 November 2016 (the roof of gas engine building can be seen at the center of the photo)
2-20
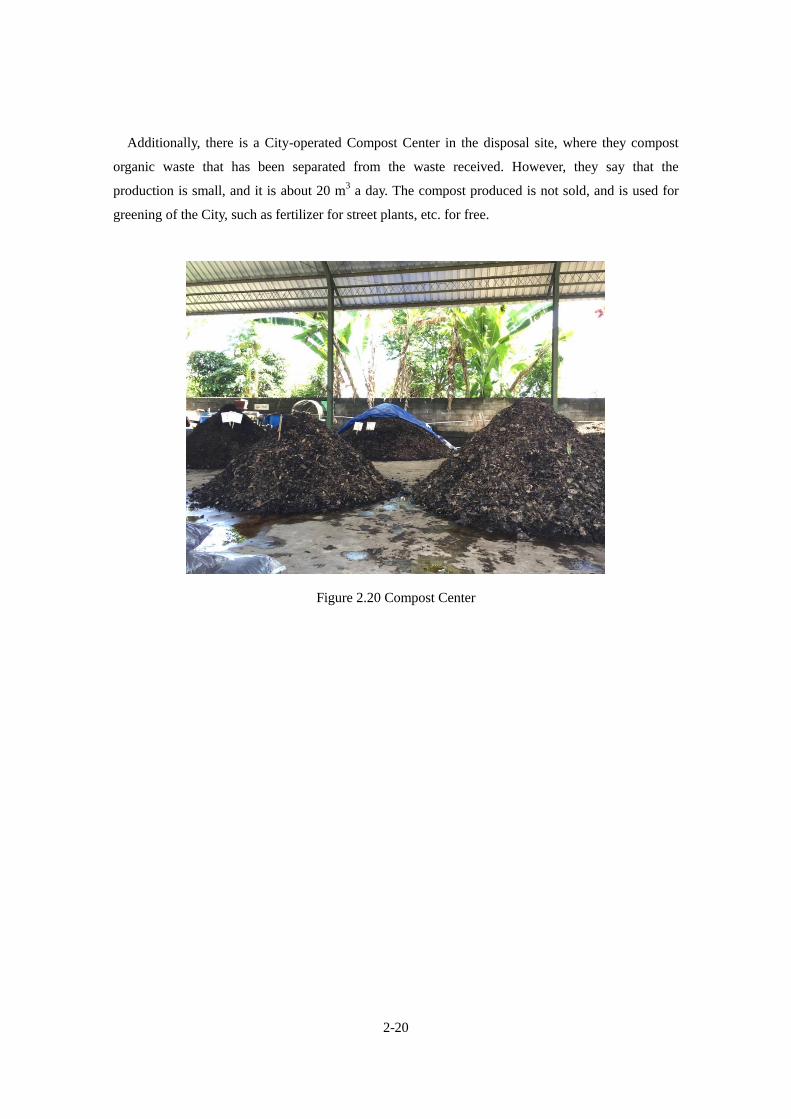
Additionally, there is a City-operated Compost Center in the disposal site, where they compost
organic waste that has been separated from the waste received. However, they say that the
production is small, and it is about 20 m3 a day. The compost produced is not sold, and is used for
greening of the City, such as fertilizer for street plants, etc. for free.
Figure 2.20 Compost Center
2-21
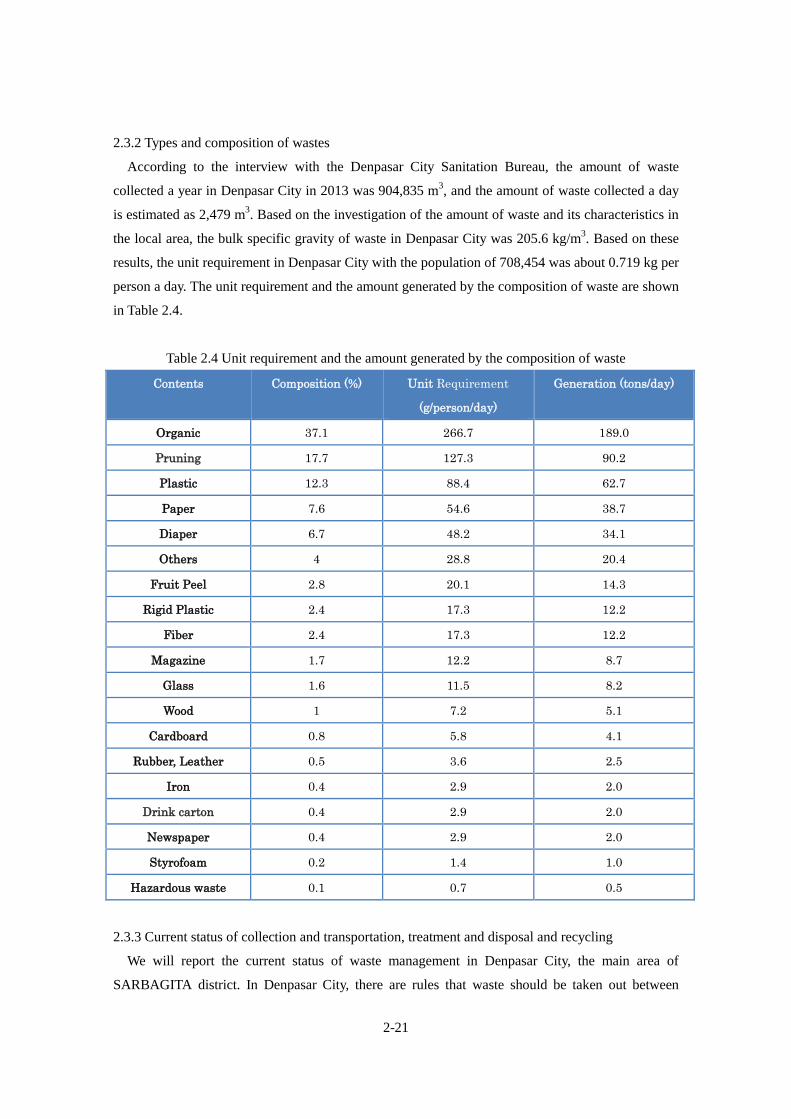
2.3.2 Types and composition of wastes
According to the interview with the Denpasar City Sanitation Bureau, the amount of waste
collected a year in Denpasar City in 2013 was 904,835 m3, and the amount of waste collected a day
is estimated as 2,479 m3. Based on the investigation of the amount of waste and its characteristics in
the local area, the bulk specific gravity of waste in Denpasar City was 205.6 kg/m3. Based on these
results, the unit requirement in Denpasar City with the population of 708,454 was about 0.719 kg per
person a day. The unit requirement and the amount generated by the composition of waste are shown
in Table 2.4.
Table 2.4 Unit requirement and the amount generated by the composition of waste
Contents Composition (%) Unit Requirement
(g/person/day)
Generation (tons/day)
Organic 37.1 266.7 189.0
Pruning 17.7 127.3 90.2
Plastic 12.3 88.4 62.7
Paper 7.6 54.6 38.7
Diaper 6.7 48.2 34.1
Others 4 28.8 20.4
Fruit Peel 2.8 20.1 14.3
Rigid Plastic 2.4 17.3 12.2
Fiber 2.4 17.3 12.2
Magazine 1.7 12.2 8.7
Glass 1.6 11.5 8.2
Wood 1 7.2 5.1
Cardboard 0.8 5.8 4.1
Rubber, Leather 0.5 3.6 2.5
Iron 0.4 2.9 2.0
Drink carton 0.4 2.9 2.0
Newspaper 0.4 2.9 2.0
Styrofoam 0.2 1.4 1.0
Hazardous waste 0.1 0.7 0.5
2.3.3 Current status of collection and transportation, treatment and disposal and recycling
We will report the current status of waste management in Denpasar City, the main area of
SARBAGITA district. In Denpasar City, there are rules that waste should be taken out between
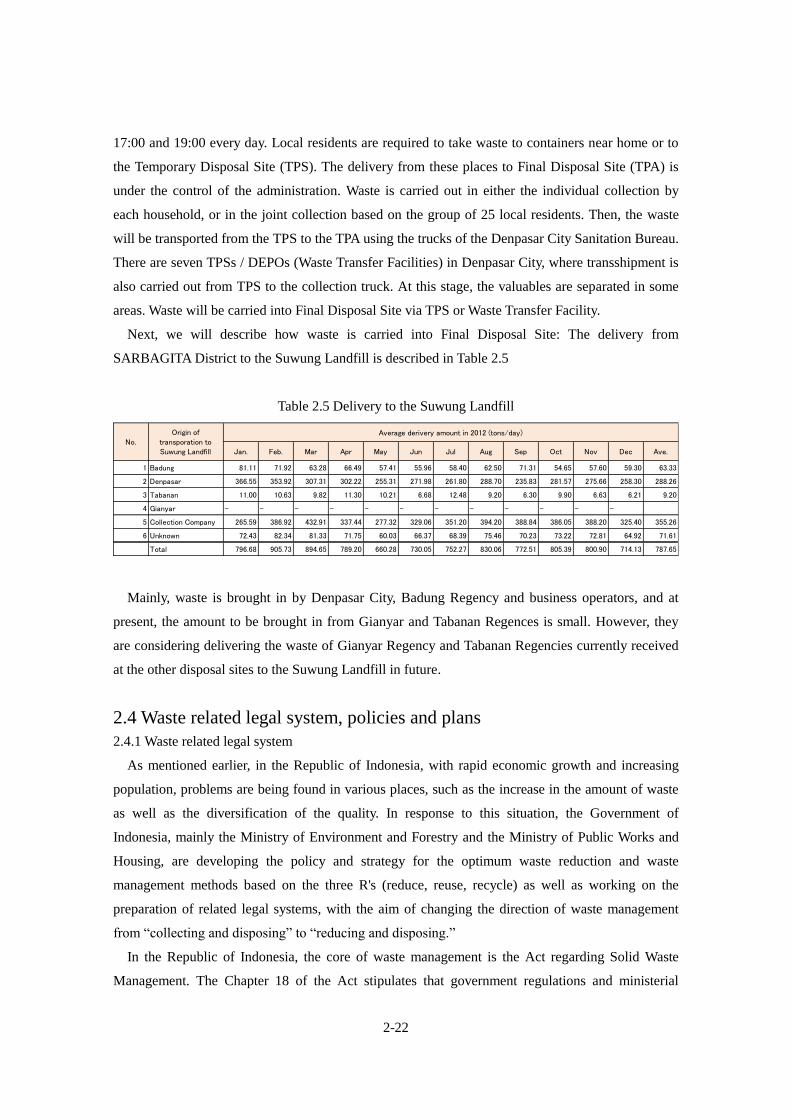
2-22
17:00 and 19:00 every day. Local residents are required to take waste to containers near home or to
the Temporary Disposal Site (TPS). The delivery from these places to Final Disposal Site (TPA) is
under the control of the administration. Waste is carried out in either the individual collection by
each household, or in the joint collection based on the group of 25 local residents. Then, the waste
will be transported from the TPS to the TPA using the trucks of the Denpasar City Sanitation Bureau.
There are seven TPSs / DEPOs (Waste Transfer Facilities) in Denpasar City, where transshipment is
also carried out from TPS to the collection truck. At this stage, the valuables are separated in some
areas. Waste will be carried into Final Disposal Site via TPS or Waste Transfer Facility.
Next, we will describe how waste is carried into Final Disposal Site: The delivery from
SARBAGITA District to the Suwung Landfill is described in Table 2.5
Table 2.5 Delivery to the Suwung Landfill
Mainly, waste is brought in by Denpasar City, Badung Regency and business operators, and at
present, the amount to be brought in from Gianyar and Tabanan Regences is small. However, they
are considering delivering the waste of Gianyar Regency and Tabanan Regencies currently received
at the other disposal sites to the Suwung Landfill in future.
2.4 Waste related legal system, policies and plans
2.4.1 Waste related legal system
As mentioned earlier, in the Republic of Indonesia, with rapid economic growth and increasing
population, problems are being found in various places, such as the increase in the amount of waste
as well as the diversification of the quality. In response to this situation, the Government of
Indonesia, mainly the Ministry of Environment and Forestry and the Ministry of Public Works and
Housing, are developing the policy and strategy for the optimum waste reduction and waste
management methods based on the three R's (reduce, reuse, recycle) as well as working on the
preparation of related legal systems, with the aim of changing the direction of waste management
from “collecting and disposing” to “reducing and disposing.”
In the Republic of Indonesia, the core of waste management is the Act regarding Solid Waste
Management. The Chapter 18 of the Act stipulates that government regulations and ministerial
Jan. Feb. Mar Apr May Jun Jul Aug Sep Oct Nov Dec Ave.
1 Badung 81.11 71.92 63.28 66.49 57.41 55.96 58.40 62.50 71.31 54.65 57.60 59.30 63.33
2 Denpasar 366.55 353.92 307.31 302.22 255.31 271.98 261.80 288.70 235.83 281.57 275.66 258.30 288.26
3 Tabanan 11.00 10.63 9.82 11.30 10.21 6.68 12.48 9.20 6.30 9.90 6.63 6.21 9.20
4 Gianyar - - - - - - - - - - - -
5 Collection Company 265.59 386.92 432.91 337.44 277.32 329.06 351.20 394.20 388.84 386.05 388.20 325.40 355.26
6 Unknown 72.43 82.34 81.33 71.75 60.03 66.37 68.39 75.46 70.23 73.22 72.81 64.92 71.61
Total 796.68 905.73 894.65 789.20 660.28 730.05 752.27 830.06 772.51 805.39 800.90 714.13 787.65
Average derivery amount in 2012 (tons/day)No.
Origin oftransporation toSuwung Landfill
2-23
ordinances shall be set forth within one year from the enforcement of this Act, and the municipal
ordinances shall be set forth within three years, and the details related to waste management shall be
described as well. With this, the local governments responsible for waste management are required
to develop the appropriate ordinances, stipulating the specific methods for reducing the amount of
waste, separation, reuse and recycle for citizens.
The outlines of laws are shown below:
(1) The Act regarding Solid Waste Management (No.18 /2008)
The Act regarding Solid Waste Management is the new comprehensive legal restrictions set for
municipal waste. Based on the Act, wastes are now classified into three types: household waste,
household-like waste and specified waste. The household waste is a waste to be produced by general
household. The household-like waste is a type of waste similar to “household waste” which is
produced from commercial sectors, industrial sectors and public facilities. The specified waste is a
waste that includes hazardous materials and waste during disasters. The Act stipulates that waste
management should be carried out by the waste reduction and the proper treatment, and everyone
must implement the waste reduction and the proper treatment in a way that suits the environment.
The waste reduction is defined as waste minimization, reuse, and recycling, while the proper
treatment is defined as separation, collection, transportation, intermediate treatment and final
disposal.
The Act also requires the managers of the residential area, commercial area, industrial area, public
facilities and social facilities to install the waste separation facilities. Additionally, the Acts provides
the introduction of a licensing system in waste disposal business, requiring manufacturers to dispose
of their products and packages as their responsibilities.
According to the Act, the Final Disposal Sites where open damping is conducted must be closed
down within five years. However, as of February 2017, the shutdown of Final Disposal Sites where
open damping is carried out is not competed, and there is no outlook for abolition.
(2) The Government Regulation regarding Management of House-hold Waste and Household-like
Waste (No.81/2012)
This Government Regulation provides the details on the management of household waste and
household-like waste based on the Act No.18/2008. The Regulation provides the development of
waste management policy and strategy as well as the development of waste management master plan
by local governments. Additionally, it stipulates the development and implementation of the waste
reduction plan in the manufacturing processes and sales activities, the production of containers and
packaging to minimize the amount of waste produced, the implementation of recycling program and
the recommendation of reuse as the responsibility of the manufacturer. The Environmental Bureaus
2-24
in Provinces are required to discuss with producers on the recommended use of decomposable
containers and packaging under the cooperation of the Ministry of Industry.
The Regulations also provide the details on the separate collection of waste, the transportation and
the final disposal, and the local governments’ information on waste reduction for local residents, and
public participation.
(3) The Act regarding Environmental Protection and Management (No.32/2009)
The Act provides environmental protection and environmental management, including provisions
about greenhouse gas emissions reduction, the climate change adaptation and mitigation measures,
and enhancing response skills to cope with the growing number of disasters due to climate change.
In addition, in the Ministerial Ordinance No. 19/2012 developed according to the Act, the “Climate
Change Village” Program (Program Kampung Iklim) is described. Under this Program, pilot project
business are carried out for the collection of greenhouse gas emissions data from regions as well as
for capacity development in order to achieve the greenhouse gas emissions reduction targets in the
Republic of Indonesia.
(4) The Ordinance of the Ministry of Environmental (No.1/2009)
The Ordinance provides the items related to “ADIPURA Program” which is the environmentally
advanced city competitive system. The “ADIPURA Program” was started in 1986 as the
environmentally advanced city competitive system under the Environmental Management Act (NO.
4/1982), and cities with the population of more than 20,000 are participating in the Program. There
are four items to be assessed in the cities under the system: Management aspect, Physical aspect,
Public health aspect, and Open Green Space Amenity aspect. For waste related, waste management
organizations in Management aspect as well as the preparation of waste management facilities in
Physical aspect are also assessment targets.
(5) The Ordinance of the Ministry of Environment(No.13/2012)
The Ordinance provides the implementation of the three R's (reduce, reuse, recycle) through
“Waste Bank.” The “Waste Bank” is a community-based waste reduction program. Under this
Program, with the support of the Ministry of Environment and Forestry, “Waste Bank” facilities are
set up at the levels of RT (i.e. neighborhood unit) and RW (i.e. neighborhood block association
consisting of several neighborhood units) in each district. Local residents voluntarily bring
recyclable waste from each household to these places, which will be separated, measured, and sold
to recycling operators.
In the entire land of the Republic of Indonesia, there are “Waste Bank” related facilities at 1,195
locations as of December 2012.
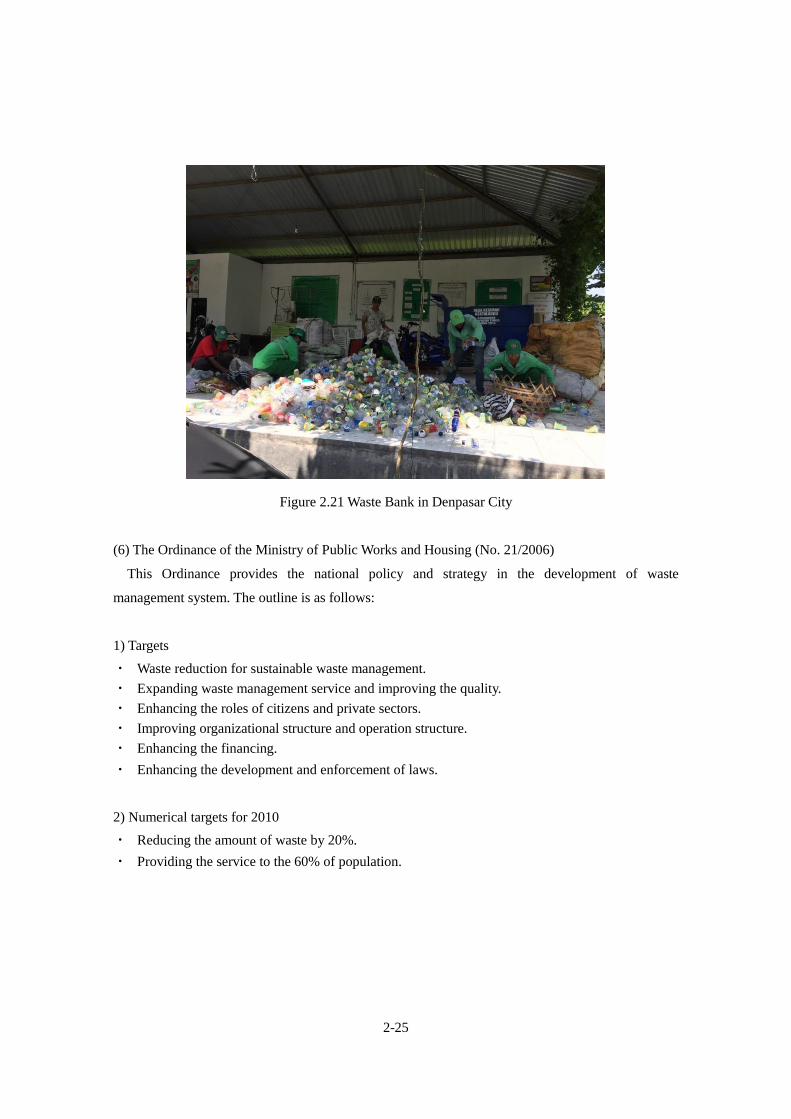
2-25
Figure 2.21 Waste Bank in Denpasar City
(6) The Ordinance of the Ministry of Public Works and Housing (No. 21/2006)
This Ordinance provides the national policy and strategy in the development of waste
management system. The outline is as follows:
1) Targets
・ Waste reduction for sustainable waste management.
・ Expanding waste management service and improving the quality.
・ Enhancing the roles of citizens and private sectors.
・ Improving organizational structure and operation structure.
・ Enhancing the financing.
・ Enhancing the development and enforcement of laws.
2) Numerical targets for 2010
・ Reducing the amount of waste by 20%.
・ Providing the service to the 60% of population.
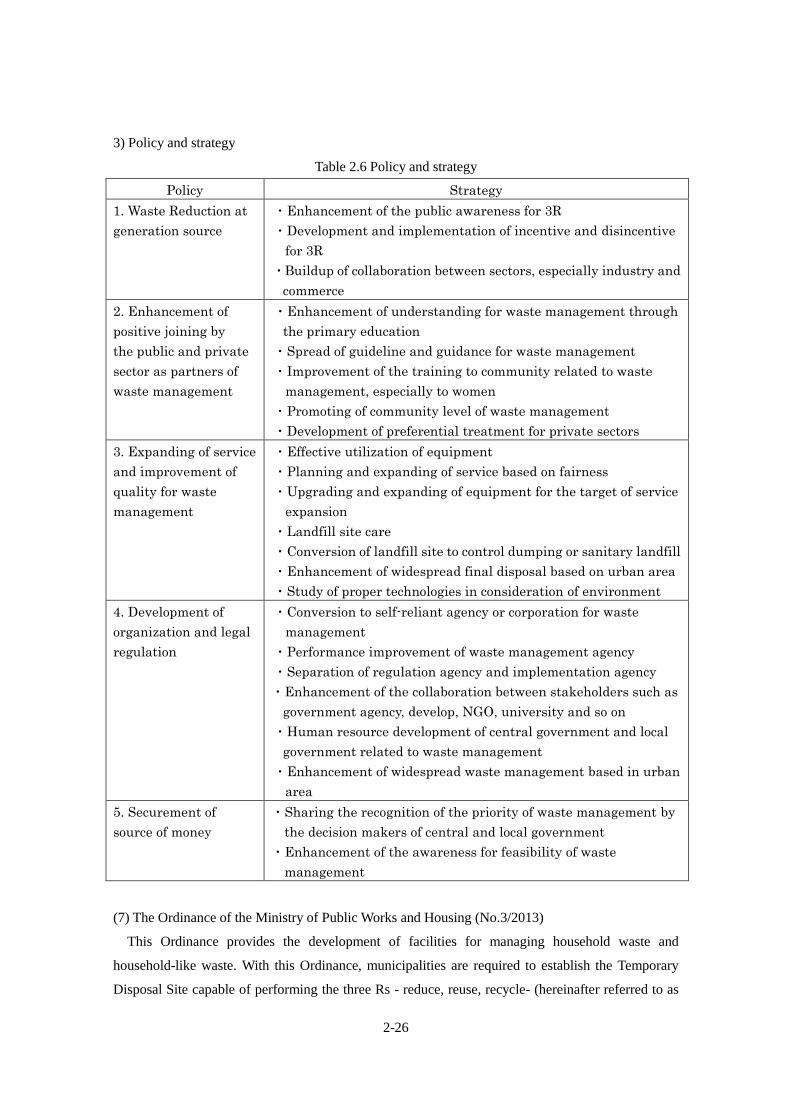
2-26
3) Policy and strategy
Table 2.6 Policy and strategy
Policy Strategy
1. Waste Reduction at
generation source
・Enhancement of the public awareness for 3R
・Development and implementation of incentive and disincentive
for 3R
・Buildup of collaboration between sectors, especially industry and
commerce
2. Enhancement of
positive joining by
the public and private
sector as partners of
waste management
・Enhancement of understanding for waste management through
the primary education
・Spread of guideline and guidance for waste management
・Improvement of the training to community related to waste
management, especially to women
・Promoting of community level of waste management
・Development of preferential treatment for private sectors
3. Expanding of service
and improvement of
quality for waste
management
・Effective utilization of equipment
・Planning and expanding of service based on fairness
・Upgrading and expanding of equipment for the target of service
expansion
・Landfill site care
・Conversion of landfill site to control dumping or sanitary landfill
・Enhancement of widespread final disposal based on urban area
・Study of proper technologies in consideration of environment
4. Development of
organization and legal
regulation
・Conversion to self-reliant agency or corporation for waste
management
・Performance improvement of waste management agency
・Separation of regulation agency and implementation agency
・Enhancement of the collaboration between stakeholders such as
government agency, develop, NGO, university and so on
・Human resource development of central government and local
government related to waste management
・Enhancement of widespread waste management based in urban
area
5. Securement of
source of money
・Sharing the recognition of the priority of waste management by
the decision makers of central and local government
・Enhancement of the awareness for feasibility of waste
management
(7) The Ordinance of the Ministry of Public Works and Housing (No.3/2013)
This Ordinance provides the development of facilities for managing household waste and
household-like waste. With this Ordinance, municipalities are required to establish the Temporary
Disposal Site capable of performing the three Rs - reduce, reuse, recycle- (hereinafter referred to as
2-27
TPST-the 3R) as the facilities for collecting waste from the local community in residential areas,
commercial areas, industrial areas, special areas, public facilities and other facilities.
At the TPST-3R, the separation collection of household waste, composting organic waste,
recycling containers and packages, and the separate collection of hazardous waste (batteries and
fluorescent) are carried out. The Ordinance states that the community based waste reduction activity,
such as “Waste Bank,” can be also integrated into the TPST-3R activity.
(8) The strategy based on the three Rs by the Ministry of Environment
The draft strategy based on the three Rs by the Ministry of Environment is being developed mainly
by the Institut Teknologi Bandung, with the assistance of the UNCRD and the IGES. The overview
is as follows: The strategy based on the three Rs was to be announced officially as the Ordinance of
the Ministry of Environment after its completion, however, as of now, it is not known when the
strategies will be developed or enforced.
(1) Fundamental concepts
- Participation of manufacturers and the awareness of civilians are the keys.
- Municipal waste and industrial waste are resources.
- Those that produce waste shall be responsible.
- Changing the direction and the sense of values in the society from the End of Pipe to the approach
based on the three Rs.
- Recycling is an economic activity.
- The activity based on the three Rs needs to be improved by monitoring and assessment on a
continuous basis.
(2) Strategy
- Establishment of a new organization as advisory panel.
- Development of laws and policies.
- Development of technologies and information system.
- Enhancing the roles of stakeholders (the Central Government, the Government of Province, the
Government of Regency and City, waste pickers, corporations, communities, and research institutes)
and the alliance.
- Finance measures (based on the principle that the central and local governments are responsible for
the three Rs of municipal waste, and those who carry out the waste are responsible for the
implementation of the three Rs in the industrial sector).
- Promotion of international cooperation
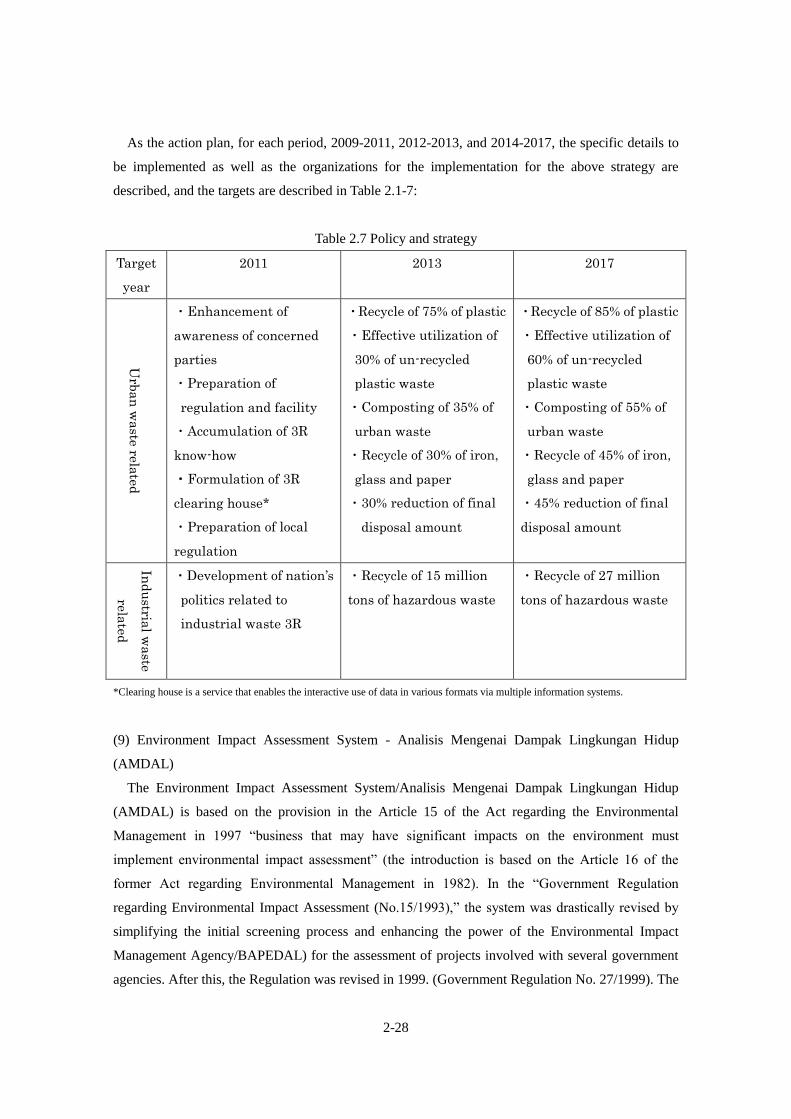
2-28
As the action plan, for each period, 2009-2011, 2012-2013, and 2014-2017, the specific details to
be implemented as well as the organizations for the implementation for the above strategy are
described, and the targets are described in Table 2.1-7:
Table 2.7 Policy and strategy
Target
year
2011 2013 2017
Urb
an
waste
rela
ted
・Enhancement of
awareness of concerned
parties
・Preparation of
regulation and facility
・Accumulation of 3R
know-how
・Formulation of 3R
clearing house*
・Preparation of local
regulation
・Recycle of 75% of plastic
・Effective utilization of
30% of un-recycled
plastic waste
・Composting of 35% of
urban waste
・Recycle of 30% of iron,
glass and paper
・30% reduction of final
disposal amount
・Recycle of 85% of plastic
・Effective utilization of
60% of un-recycled
plastic waste
・Composting of 55% of
urban waste
・Recycle of 45% of iron,
glass and paper
・45% reduction of final
disposal amount
Ind
ustria
l waste
rela
ted
・Development of nation’s
politics related to
industrial waste 3R
・Recycle of 15 million
tons of hazardous waste
・Recycle of 27 million
tons of hazardous waste
*Clearing house is a service that enables the interactive use of data in various formats via multiple information systems.
(9) Environment Impact Assessment System - Analisis Mengenai Dampak Lingkungan Hidup
(AMDAL)
The Environment Impact Assessment System/Analisis Mengenai Dampak Lingkungan Hidup
(AMDAL) is based on the provision in the Article 15 of the Act regarding the Environmental
Management in 1997 “business that may have significant impacts on the environment must
implement environmental impact assessment” (the introduction is based on the Article 16 of the
former Act regarding Environmental Management in 1982). In the “Government Regulation
regarding Environmental Impact Assessment (No.15/1993),” the system was drastically revised by
simplifying the initial screening process and enhancing the power of the Environmental Impact
Management Agency/BAPEDAL) for the assessment of projects involved with several government
agencies. After this, the Regulation was revised in 1999. (Government Regulation No. 27/1999). The
2-29
Government Regulation provides a list of target projects, AMDAL Assessment Committee procedure
guidelines, the establishment of AMDAL Assessment Committee and Regional Committee, technical
assessment guidelines and the procedure of public participation. Further, the type and scale of target
projects or activities are stipulated in “the Ministerial Decree by the Ministry of Environment (No.
17/2011) regarding the type and scale of the projects or activities that require the implementation of
environmental impact assessment.” At the stage of developing the method documents, business
operators are required to discuss with residents, disclose the residents’ proposals, opinions and
comments, disclose the details of the study by Assessment Committee to government agencies, and
disclose information. On the other hand, residents have the right to obtain information and submit
proposals, opinions, and comments.
(10) Presidential Decree (No.18/2016)
The Presidential Decree is intended to promote the construction of the municipal waste-to-energy
facility in seven designated cities (Special Provincial District of Capital of Jakarta, Bandung City,
Tangerang City, Semarang City, Surabaja City, Surakarta City and Makassar City) and the overview
is as follows:
To improve the quality of environment through the municipal waste-to-energy, and enhance the
roles of new energy and renewal energy in the state-owned electricity supply, under the
responsibilities of the local governments of 7 cities in the nation, the construction of the
municipal waste-to-energy facility (the facility where municipal waste will be converted to
electric power energy by gasification, incineration or thermal treatment technology by thermal
fusion.) will be promoted from 2016 through 2018.
Heads of seven cities may appoint a local government owned company or a private enterprise
for building the municipal waste-to-energy facility.
In the process of appointing a local government-owned company or a private enterprise, the
seven cities shall ensure the implementation of the following:
① The use of municipal waste of at least 1,000 tons a day
② The use of location of the municipal waste-to-energy facility in the land allocation plan of
Provinces and City.
③ Feasibility study from the perspectives of laws and regulations, organizations, financing,
socio-culture, technologies, etc.
Further, consultants can be hired for conducting the feasibility study.
A local government-owned company or a private enterprise appointed, etc. (hereinafter referred
to as “Companies Appointed, etc.”) shall need to satisfy the license for electric power business
procurement. Companies Appointed, etc. will be granted with the license for construction
2-30
direction investment. The heads of relevant ministries and agencies, the relevant groups and
the relevant local governments will support the license procedure for Companies Appointed, etc.
and its simplification.
The Minister of Energy and Mineral Resources will appoint the state-controlled electric power
company, Perusahaan Listrik Negara - (PLN) as the one to buy electricity from Companies
Appointed, etc..
The sources of funds required for building the municipal waste-to-energy facility will be the
national budget, the budget of local government and the other legal fund sources.
The central government may provide subsidies to local governments for waste management
cost. The provision of cost is regulated by the provisions to be stipulated after the coordination
between the Minister of Home Affairs coordinating, the Minister of Finance and the related
Ministers.
Procedures for the procurement of land necessary for building the municipal waste-to-energy
facility by the central government, local governments and Companies Appointed, etc. will be
based on the regulations concerning the procurement of land for constructing public facilities.
In building the municipal waste-to-energy facility, domestic products shall be used with
priority.
The heads of the relevant ministries and agencies, the relevant groups, and the relevant local
governments will cooperate with each other through the control and supervision to promote the
construction of the municipal waste-to-energy facility.
The Team of Coordination will be established to support the construction of the municipal
waste-to-energy facility. The Team of Coordination will play the role of coordination,
supervision and support necessary for enhancing the smooth construction of the municipal
waste-to-energy facility. The Team of Coordination consists of relevant ministries and agencies,
with the Coordinating Minister for Maritime Affairs as Chairperson and the Coordinating
Minister for Economic Affairs as Vice Chairperson. The details of the Team of Coordination
will be stipulated by the Coordinating Minister for Maritime Affairs.
The Team of Coordination will report to the President on the status of coordination regarding
the construction of the municipal waste-to-energy facility every six months as well as when
necessary.
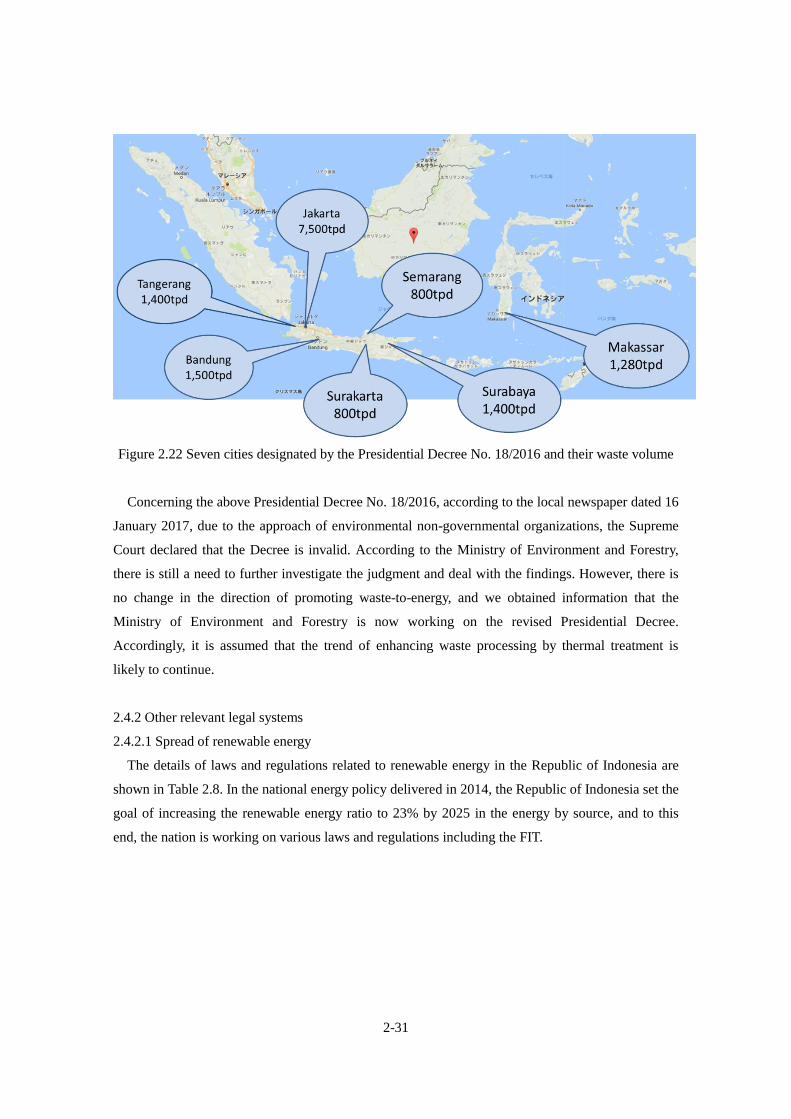
2-31
Figure 2.22 Seven cities designated by the Presidential Decree No. 18/2016 and their waste volume
Concerning the above Presidential Decree No. 18/2016, according to the local newspaper dated 16
January 2017, due to the approach of environmental non-governmental organizations, the Supreme
Court declared that the Decree is invalid. According to the Ministry of Environment and Forestry,
there is still a need to further investigate the judgment and deal with the findings. However, there is
no change in the direction of promoting waste-to-energy, and we obtained information that the
Ministry of Environment and Forestry is now working on the revised Presidential Decree.
Accordingly, it is assumed that the trend of enhancing waste processing by thermal treatment is
likely to continue.
2.4.2 Other relevant legal systems
2.4.2.1 Spread of renewable energy
The details of laws and regulations related to renewable energy in the Republic of Indonesia are
shown in Table 2.8. In the national energy policy delivered in 2014, the Republic of Indonesia set the
goal of increasing the renewable energy ratio to 23% by 2025 in the energy by source, and to this
end, the nation is working on various laws and regulations including the FIT.
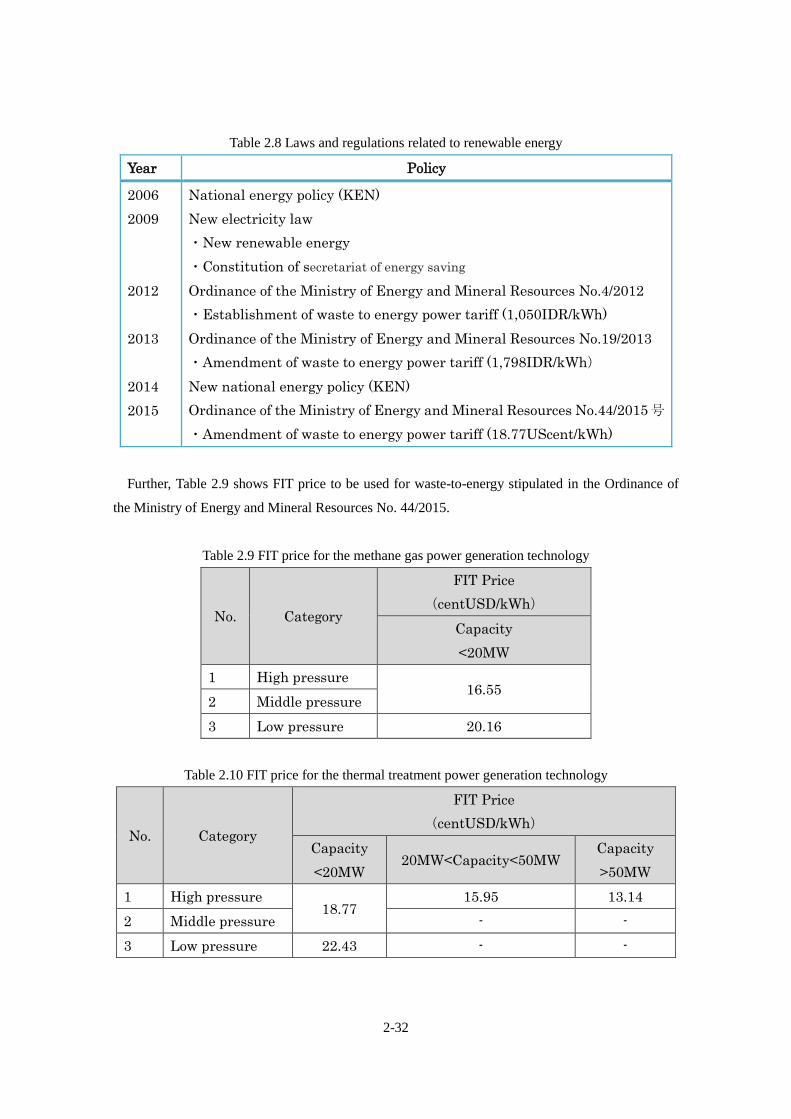
2-32
Table 2.8 Laws and regulations related to renewable energy
Year Policy
2006
2009
2012
2013
2014
2015
National energy policy (KEN)
New electricity law
・New renewable energy
・Constitution of secretariat of energy saving
Ordinance of the Ministry of Energy and Mineral Resources No.4/2012
・Establishment of waste to energy power tariff (1,050IDR/kWh)
Ordinance of the Ministry of Energy and Mineral Resources No.19/2013
・Amendment of waste to energy power tariff (1,798IDR/kWh)
New national energy policy (KEN)
Ordinance of the Ministry of Energy and Mineral Resources No.44/2015号
・Amendment of waste to energy power tariff (18.77UScent/kWh)
Further, Table 2.9 shows FIT price to be used for waste-to-energy stipulated in the Ordinance of
the Ministry of Energy and Mineral Resources No. 44/2015.
Table 2.9 FIT price for the methane gas power generation technology
No. Category
FIT Price
(centUSD/kWh)
Capacity
<20MW
1 High pressure 16.55
2 Middle pressure
3 Low pressure 20.16
Table 2.10 FIT price for the thermal treatment power generation technology
No. Category
FIT Price
(centUSD/kWh)
Capacity
<20MW 20MW<Capacity<50MW
Capacity
>50MW
1 High pressure 18.77
15.95 13.14
2 Middle pressure - -
3 Low pressure 22.43 - -
2-33
The main issues and problems of the above current FIT systems in the Indonesia can be summarized
as the two following points:
1) Regulations regarding the period of selling of electricity to a power company:
The Regulations do not provide the PPA (Power Purchase Agreement) period in the PPA (Power
Purchase Agreement) with PLN, and according to the interview in the local area, the PPA
(Power Purchase Agreement) period can change depending on the individual agreement with
PLN. Normally, in nations such as Japan, Kingdom of Thailand, Singapore, where IPP business
in waste-to-energy has been established, the waste-to-energy business period is usually around
20 to 25 years. For IPP business units, unless the period of selling of electricity to a power
company is not secured at FIT price, it is difficult to decide business cash flow. Accordingly, it is
not possible to establish IPP business.
2) Inadequacies in the central government’s finance support for FIT
At present, there is no subsidiary system by the central government for the FIT system in the
Republic of Indonesia, and the differential premium with other power sources is the
responsibility of PLN. Accordingly, there is no incentive for PLN to purchase renewal energy at
FIT price. When compared to cheaper power sources such as a coal-fueled power generation, the
production cost of renewable energy is expensive. When compared to other fossil fuels power
sources, the purchase price is comparatively high. This can deteriorate the PLN’s financial
situation. Under such circumstances, they are rejecting the purchase of electricity at FIT price. In
addition, since there are no punitive provisions for PLN rejecting the purchase, it has been
difficult to negotiate with PLN on purchase in many renewable energy projects as well as the
waste-to-energy projects. To overcome this current status and develop renewable energy
according to the national energy strategy as mentioned above, the incentive for PLN by the
central government, such as financial assistance, is indispensable. With this, the development of
the laws and regulations for finance assistance is expected.
As described in the Chapter 6, to establish waste-to-energy business in the Republic of Indonesia,
if a private enterprise conducts the waste-to-energy business in PFI/BOT scheme on behalf of the
local government as investors, more specific FIT system should be developed. In addition, it is
necessary to ensure the fulfillment of a contract signed in the PPA. With this, it is assumed that there
would be a case where the application of IIGF that corresponds to sovereign guarantee in the
Republic of Indonesia to be detailed later in the section 2.4.2.3 may be necessary in forming Project
Finance.
2-34
2.4.2.2 Outline of the Public Private Partnership (PPP) laws in the Republic of Indonesia
PPP system in the Republic of Indonesia is prepared mainly based on the Presidential Decree No.
67/2005. Content of the PPP Presidential Decree have been revised three times since the
enforcement. (the Presidential Decree No. 13/2010, Presidential Decree No.56/2011 and Presidential
Decree No.66/2013). Through these revisions, the government support framework was clarified, and
with the Presidential Decree No. 38/2015 promulgated in March 2015 (hereinafter referred to as the
“New PPP Presidential Decree”), the content of PPP system was drastically changed. Overview of
PPP system in the Republic of Indonesia reflecting the changes are summarized in Table 2.11.
Table 2.11 Overview of PPP system
Category Outline Remarks
Sector Transportation(airport, port, train
etc.), road, irrigation, water and
sewerage, waste water and waste
material, information and
communication, electricity and oil
and gas related facilities,
education facilities, social
facilities such as hospital and
public housing
Selection of PPP
business
・Solicited and unsolicited
・Verification and determination
through the public hearing
・There are few unsolicited
businesses.
Selection of
developer
Selection of developer based on
bidding process for both solicited
and unsolicited. However, in the
case of the followings, developer
can be appointed directly.
① In case that the developer has
already carried out the
develop and management of
the infrastructure
② In case that only the developer
can introduce the new
technology
③ In case that the developer has
2-35
Category Outline Remarks
acquired the all or most of
land space at site.
Implementation of
the business
Concession agreement with
contract owner of public side or
providing business license by
contract owner of public side
Financial closing shall be
completed within 6 months
from contract. However,
extension of a deadline is to
be provided to the owner as
needed and the limitation
of the number of extension
of a deadline is not
regulated clearly.
Contract owner of
public side
・Central or local government,
state-owned company (In case of
contract owner of public side)
・Interregional business; Central
government
・Specified stat-owned company by
the sectors
Main government
support
・IIGF (government guarantee)
・VGF (government support for
CAPEX)
・Appropriation of land based on
the law
・Tax preference
The followings are the main laws and regulations for PPP system in the Republic of Indonesia:
- The Presidential Decree No. 78/2010 on Infrastructure Guarantee in Public Private Partnership
Provided Through Infrastructure Guarantee Fund (hereinafter referred to as “IIGF”) as well as the
Finance Minister Decree No. 260/2010 on the Implementing Guideline for Infrastructure
Guarantees in Public Private Partnership;(the content of systems can be found in the section
2.4.2.3).
- The Finance Minister Decree No. 223/2012 for Viability Gap Funding (VGF) framework for PPP
projects (see the section 2.4.2.4 for the details of the system).
2-36
- Law No.2/2012 concerning land acquisition for PPP projects and the related enforcement
regulations.
By the development of this Law stipulating the framework of the expropriation of land by the
government organizations, it is expected that the issue of acquiring land for projects, which is the
major bottleneck in infrastructure business in the Republic of Indonesia, will be mitigated.
- Presidential Decree Number 75 of 2014 concerning the Acceleration of Infrastructure Priorities
Development (hereinafter referred to as the Presidential Decree for Enhancing Priorities”).
The Decree provides the checking of the land expropriation right of the government agencies who
control the priorities stipulated in this Presidential Decree.
In addition, the Republic of Indonesia has established the following organizations with the
purpose of promoting infrastructure business.
・IIGF(Indonesia Infrastructure Guarantee Fund)
The IIGF is an independent state owned enterprise 100% owned by the Government of Indonesia.
It was established in 2009 to provide guarantees for PPP projects.
・PT SMI(Sarana Multi Infrastruktur)
The PT SMI is an independent state owned enterprise 100% owned by the Government of
Indonesia. It was established in 2009 to finance infrastructure projects.
The main services of SMI are as follows:
① Investments and loans for infrastructure projects (including the mezzanine).
② Advisory service consulting (Advice on finance, transaction advisory).
・PT IIF(Indonesia Infrastructure Finance)
The IIF, a financial institution, was established with the principal shareholders including the SMI,
the IFC (International Finance Corporation), the ADB (Asian Development Bank) and the DEG
(Deutsche Investitions-und Entwicklungsgesellschaft GmbH). The institution intends to provide a
long term fund in the Indonesia rupiah mainly for infrastructure projects in the Republic of
Indonesia (airport, ports, railroads, highways, irrigation, water supply and drainage,
communications, electric power, oil and gas, etc,.).
The IIF provides the following main services:
① Provision of funds and guarantees, such as the long-term loans for infrastructure projects.
② Advisory service

2-37
・KPPIP(Komite Percepatan Penyediaan Infrastruktur Prioritas)
The KPPIP is the Committee of Infrastructure Priorities Development Acceleration. The members
include the key cabinet members and the Director of the Ministry of National Development
Planning. The establishment of the Committee is based on the Presidential Decree for Enhancing
Priorities.
The series of steps from the establishment of PPP project to the completion are as follows:
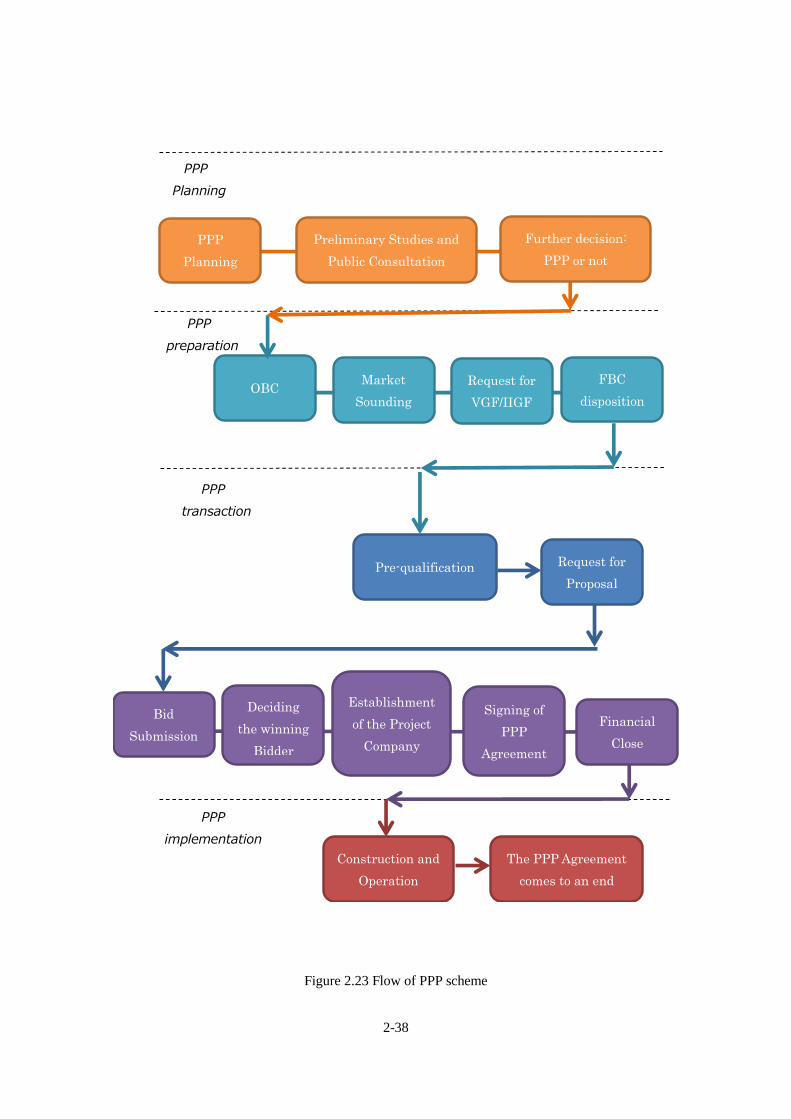
2-38
Figure 2.23 Flow of PPP scheme
PPP
Planning
PPP
preparation
PPP
Planning
Preliminary Studies and
Public Consultation
Further decision:
PPP or not
OBC
Financial
Close
Signing of
PPP
Agreement
Market
Sounding
Request for
VGF/IIGF
FBC
disposition
Request for
Proposal
Pre-qualification
Bid
Submission
Deciding
the winning
Bidder
Establishment
of the Project
Company
The PPP Agreement
comes to an end
Construction and
Operation
PPP
implementation
PPP
transaction
2-39
2.4.2.3 IIGF
The Indonesia Infrastructure Guarantee Fund (IIGF), the state owned enterprise 100% owned by the
Government of Indonesia, guarantees the fulfillment of a contract by Government Contracting
Agency in PPP projects, reducing the risks of Private Developer.
- Agreement scheme in the IIGF guarantees
In PPP projects for which the IIGF Guarantee Agreement is concluded, three parties of Private
Developer, Government Contracting Agency, and IIGF will enter into three agreements. (①PPP
Agreement, ②Guarantee Agreement and ③Recourse Agreement)
① PPP Agreement: Private Developer and Government Contracting Agency enter into PPP
Agreement that provides the claims and obligations regarding the PPP project.
② Guarantee Agreement: IIGF and private operators enter into Guaranty Agreement on PPP
Agreement. This Guarantee Agreement ensures the fulfillment of the PPP Agreement by
Government Contracting Agency.
③ Recourse Agreement: IIGF and Government Contracting Agency enter into Recourse Agreement.
IIGF will pay Private Developer on behalf of Government Contracting Agency based on the
written payment request from Private Developer if certain requirements are met, however, based
on this Recourse Agreement, Government Contracting Agency will make payment to IIGF.
If Government Contracting Agency does not agree to the IIGF’s claim for reimbursement, in the
end, it is expected that the Ministry of Finance will assist the Government Contracting Agency’s
payment to IIGF through the government budget system. There is a possibility that the budget or
subsidies for Government Contracting Agency may be cut off by the Ministry of Finance, and we
can say that this agreement scheme works as a strong restraining influence on Government
Contracting Agency for the fulfillment of the contract.
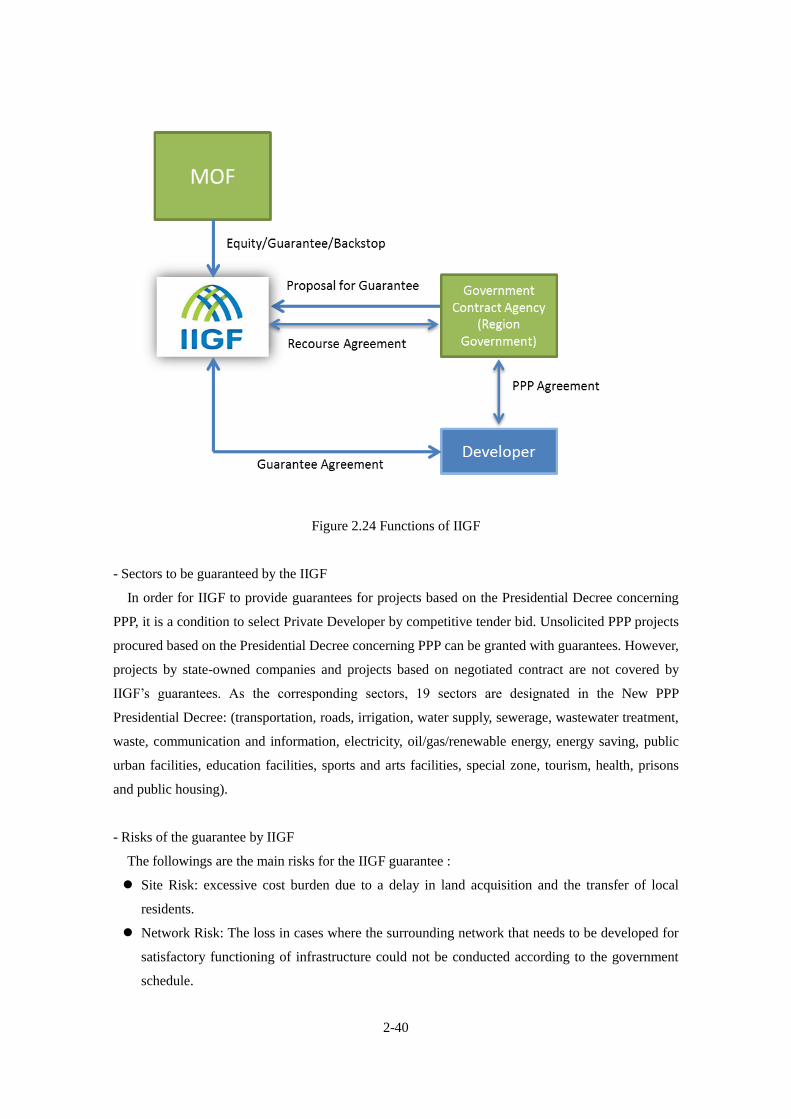
2-40
Figure 2.24 Functions of IIGF
- Sectors to be guaranteed by the IIGF
In order for IIGF to provide guarantees for projects based on the Presidential Decree concerning
PPP, it is a condition to select Private Developer by competitive tender bid. Unsolicited PPP projects
procured based on the Presidential Decree concerning PPP can be granted with guarantees. However,
projects by state-owned companies and projects based on negotiated contract are not covered by
IIGF’s guarantees. As the corresponding sectors, 19 sectors are designated in the New PPP
Presidential Decree: (transportation, roads, irrigation, water supply, sewerage, wastewater treatment,
waste, communication and information, electricity, oil/gas/renewable energy, energy saving, public
urban facilities, education facilities, sports and arts facilities, special zone, tourism, health, prisons
and public housing).
- Risks of the guarantee by IIGF
The followings are the main risks for the IIGF guarantee :
Site Risk: excessive cost burden due to a delay in land acquisition and the transfer of local
residents.
Network Risk: The loss in cases where the surrounding network that needs to be developed for
satisfactory functioning of infrastructure could not be conducted according to the government
schedule.
2-41
Political Risk: Changes in laws and regulations that may directly damage projects. Loss due to
political elements that cannot be controlled by private sectors, such as a delay in permits and
license rights.
Off-taker Payment Risk: Loss in cases where the off-taker fails to agree to mandatory payment
in PPP project plan.
2.4.2.4 VGF(Viability Gap Funding)
VGF is a financial support for PPP projects to be provided by the Ministry of Finance, and it
assists a part of construction cost (up to 49%). VGF is intended to improve the profitability of
projects and supports the establishment of a economically beneficial project with low profitability.
VGF is a program to be operated by the Ministry of Finance, and it is operated according to the
Finance Minister Decree. Accordingly, the VGF is not applied to all PPP projects, and projects need
to be in compliance with criteria described in the Finance Minister Decree. The specific operation
policy based on the Finance Minister Decree regarding VGF (No. 223/2012) are as follows:
Requirements related to the amount of VGF (the Article 5 in the Finance Minister Decree regarding
VGF):
The amount of VGF is determined by the ratio of VGF in construction cost. VGF should be a
level at which it is not a large percentage of the total construction cost in the corresponding
project.
VGF will be provided in cash within the above amount range.
Construction Cost includes construction cost, equipment cost, installation expense, interest cost
during construction, and the other construction related expenses.
However, it does not cover the expenses required for land acquisition or the expenses related to
tax incentives.
Requirements for projects to which VGF is applicable. (the Article 8 in the Finance Minister Decree
regarding VGF):
A project that is economically viable but financially not viable.
A project with a scale of more than one billion yen.
A project that went through a bidding process stipulated in the Presidential Decree concerning
PPP (the Presidential Decree concerning PPP stipulates that the negotiated contract and the
project proposed by private group are not covered by the government finance support.
Accordingly, it is assumed that the negotiated contract and the project proposed by private
group will not be covered by VGF).
A project in which the ownership will be transferred from Private Developer to Government
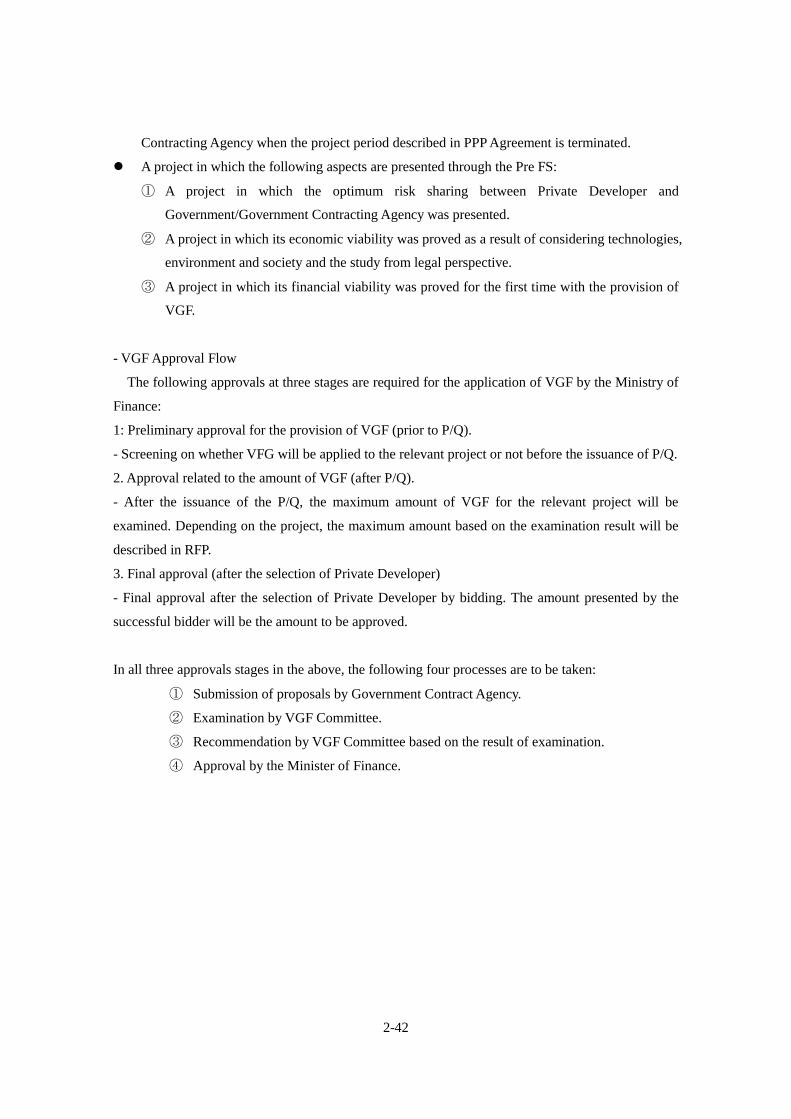
2-42
Contracting Agency when the project period described in PPP Agreement is terminated.
A project in which the following aspects are presented through the Pre FS:
① A project in which the optimum risk sharing between Private Developer and
Government/Government Contracting Agency was presented.
② A project in which its economic viability was proved as a result of considering technologies,
environment and society and the study from legal perspective.
③ A project in which its financial viability was proved for the first time with the provision of
VGF.
- VGF Approval Flow
The following approvals at three stages are required for the application of VGF by the Ministry of
Finance:
1: Preliminary approval for the provision of VGF (prior to P/Q).
- Screening on whether VFG will be applied to the relevant project or not before the issuance of P/Q.
2. Approval related to the amount of VGF (after P/Q).
- After the issuance of the P/Q, the maximum amount of VGF for the relevant project will be
examined. Depending on the project, the maximum amount based on the examination result will be
described in RFP.
3. Final approval (after the selection of Private Developer)
- Final approval after the selection of Private Developer by bidding. The amount presented by the
successful bidder will be the amount to be approved.
In all three approvals stages in the above, the following four processes are to be taken:
① Submission of proposals by Government Contract Agency.
② Examination by VGF Committee.
③ Recommendation by VGF Committee based on the result of examination.
④ Approval by the Minister of Finance.
2-43
Source: “Republic of Indonesia PPP Handbook” by the JICA
Figure 2.25 VGF application flow
- Selection of Private Developer in projects to which VGF is applicable.
In the bidding for a project to which VGF can be applied, the amount of VGF approved by VGV
Committee at the second approval stage will be the maximum amount, and depending on the project,
the maximum amount will be described in RFP. The amount of VFG will be the only parameter for
the evaluation of price during bidding.
2.5 Meeting with local stakeholders
2.5.1 JCM feasibility study kickoff meeting based on the city-to-city collaboration
We had a meeting with the local government on 25th November (Friday) in 2016 for the
implementation of the feasibility study. In the meeting, we explained the scheme assumed, the risk
allocation (risk sharing) if a private business unit receives a contract for waste-to-energy business in
PFI/BOT method, the introduction of failures of the waste-to-energy projects in countries in the
world, and the superiority of stoker furnace. Additionally, our partner for this feasibility study, the
Clean Authority of TOKYO, explained the safety of stoker furnace, the selection methods of
operators, and the importance of Tipping Fee. Table 2.12 describes the outline of kickoff meeting.
Submission of
proposal
1: Advance Approval2: Approval of VGF
price
Evaluation by
VGF
committee
Recommendation
Approval by
finance
minister
①Proposal preparation for
advance approval by
government contract authority
(Incl. FS submission)
②Evaluation by VGF
committee
based on submitted proposal
③Recommendation to finance
minister by VGF committee
④Advance approval by
finance minister
Before issuing P/Q After issuing P/Q to RFP
①VGF Price proposal
submission by government
contract authority
②VGF price evaluation by
VGF committee
based on submitted proposal
③Recommendation of VGF
price to finance minister by
VGF committee
④Approval of VGF price by
finance minister
Selection of
contractor
After selection of contractor
2: VGF
price
determin
ation by
bidding
process
3: Final approval
Limit
price to
be
written
in RFP
Determ
ination
of
Limit
VGF
price
①Final approved proposal
submission by government
contract authority
②Final evaluation by VGF
committee
based on submitted proposal
③Recommendation to finance
minister by VGF committee
④Final Approval by finance
minister
Dete
rmin
ati
on
of
VG
F
ap
pli
cati
on
Issu
ing o
f V
GF
lett
er
(*) VGF limit price of a project is expected to determine individually
2-44
Table 2.12 Kick-off meeting outline
1. Date 25th November, 2016
9:30-12:00
2. Location Meeting room in Denpasar city government office
3. Attendee (Denpasar city)
Denpasar city, deputy mayor, Mr. IG. N. Jaya
Negara
Denpasar city, director of cleansing department, Mr.
I Ketut Wisada
SARBAGITA solid waste management agency,
Director, Mr. I. Made Sudarma
4. Attendee (Japan)
Clean Authority of Tokyo
JFE Engineering Corporation
PT. JFE Engineering Indonesia
5. Agenda
1. Explanation of meeting purpose
2. Greeting message by deputy mayor
3. Presentation about expected business scheme,
risk allocation
4. Presentation about worldwide example of failure,
technology comparison
5. Presentation about contractors selection method,
importance of tipping fee
6. Q&A
7. Closing
8. Photographing
2.5.2 Project Scheme assumed
As to the Project Scheme assumed for this project, based on the fact that Denpasar City wishes to
outsource waste processing project in BOT scheme, if a project is conducted in BOT scheme, it
would be indispensable to make the project as BOT based on the laws related to the PPP in the
Republic of Indonesia from the below perspectives. Based on this, we explained to Denpasar City on
the advantage of making it as BOT according to the PPP laws.
① The adaptation of IIGF that corresponds to sovereign guarantee by the Republic of
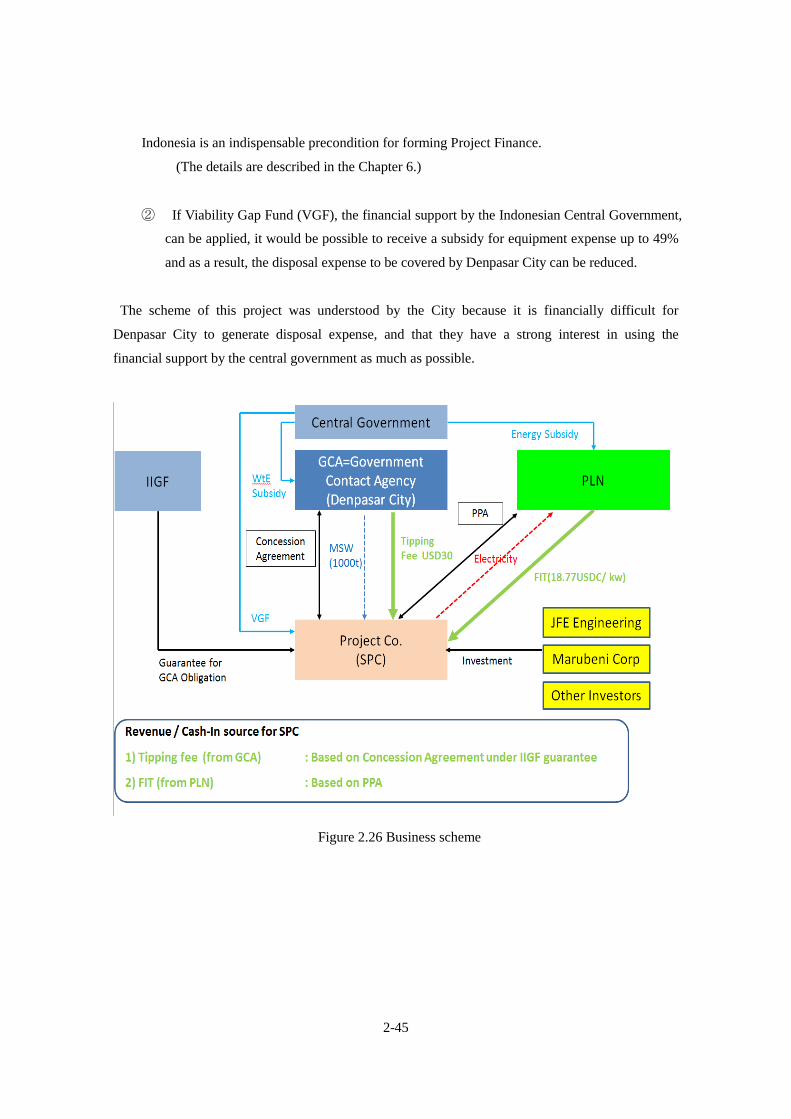
2-45
Indonesia is an indispensable precondition for forming Project Finance.
(The details are described in the Chapter 6.)
② If Viability Gap Fund (VGF), the financial support by the Indonesian Central Government,
can be applied, it would be possible to receive a subsidy for equipment expense up to 49%
and as a result, the disposal expense to be covered by Denpasar City can be reduced.
The scheme of this project was understood by the City because it is financially difficult for
Denpasar City to generate disposal expense, and that they have a strong interest in using the
financial support by the central government as much as possible.
Figure 2.26 Business scheme
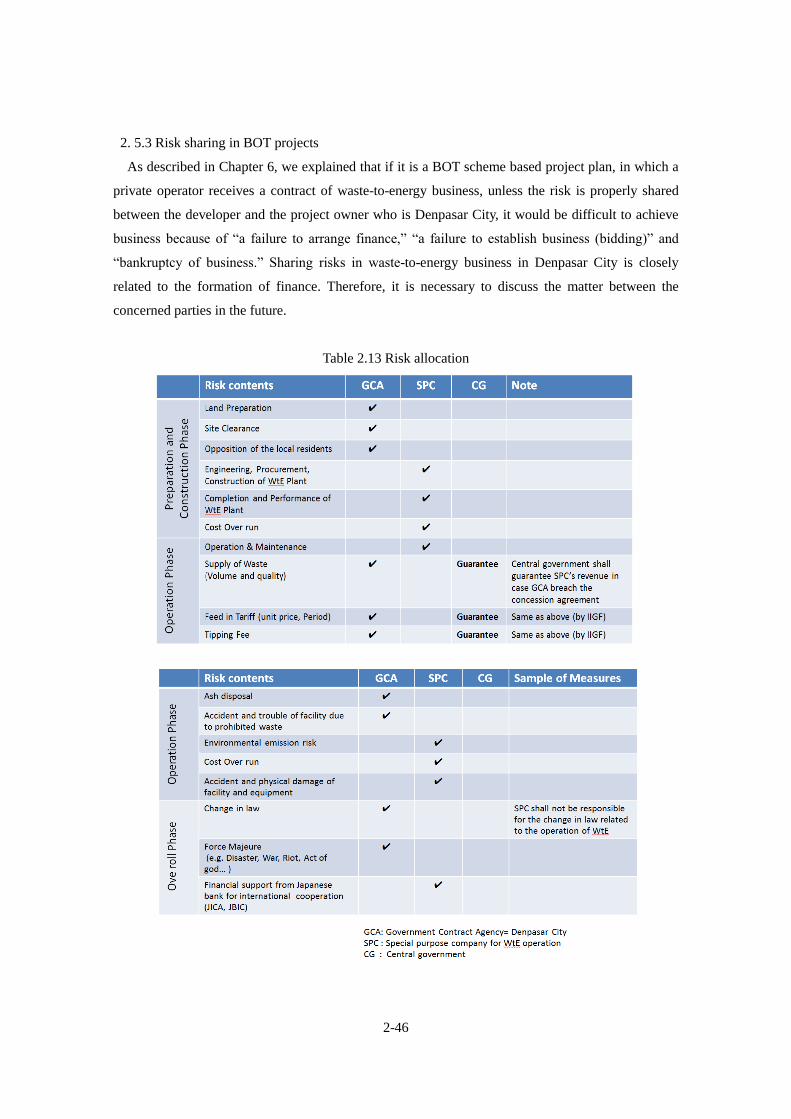
2-46
2. 5.3 Risk sharing in BOT projects
As described in Chapter 6, we explained that if it is a BOT scheme based project plan, in which a
private operator receives a contract of waste-to-energy business, unless the risk is properly shared
between the developer and the project owner who is Denpasar City, it would be difficult to achieve
business because of “a failure to arrange finance,” “a failure to establish business (bidding)” and
“bankruptcy of business.” Sharing risks in waste-to-energy business in Denpasar City is closely
related to the formation of finance. Therefore, it is necessary to discuss the matter between the
concerned parties in the future.
Table 2.13 Risk allocation
2-47
2.5.4 Introduction of the failures in waste-to-energy projects and the explanation of proper
technologies
We talked about the failure cases of incineration power generation project, which used unfit
technologies in the world, mainly in Southeast Asian Nations. As result of interviewing the Denpasar
City Government, at present, about 50 investment companies are approaching Denpasar City, and
some of which are proposing a technology with no track record. With this, we explained the loss of
economic and human resources resulting from the application of inappropriate technologies that
emphasize the disposal cost that appears to be cheap on the surface. We also told them that it would
be most desirable to adopt a mechanical stoker type incinerator for the intermediate treatment of
municipal solid waste.
Denpasar City and SARBAGITA Sanitation Union are aware of the risk of adopting inappropriate
technologies, and they seemed to be quite interested in applying the stoker furnace which is a
technology with proven results for the Waste to Energy project in Denpasar City.
2.5.5 Importance of the selection methods of operators and the disposal cost in the Tokyo’s 23 wards
The international business division of the Clean Authority of TOKYO, who is the partner of this
feasibility study, explained the following:
① The management and operation method of the waste-to-energy facility.
② Safety of waste processing.
③ Process of selecting waste operators
④ Importance of tipping fee.
Denpasar City and the SARBAGITA Sanitation Union showed a strong interest in the presentation
by the Clean Authority of TOKYO, who is the Tokyo’s wide area union similarly to the
SARBAGITA Sanitation Union and actually operates and maintains the waste-to-energy facilities. It
is assumed that the capacity building through municipalities as this one is highly effective for
exporting Japan’s high quality infrastructure and we believe it is necessary to continue this initiative
in the future.
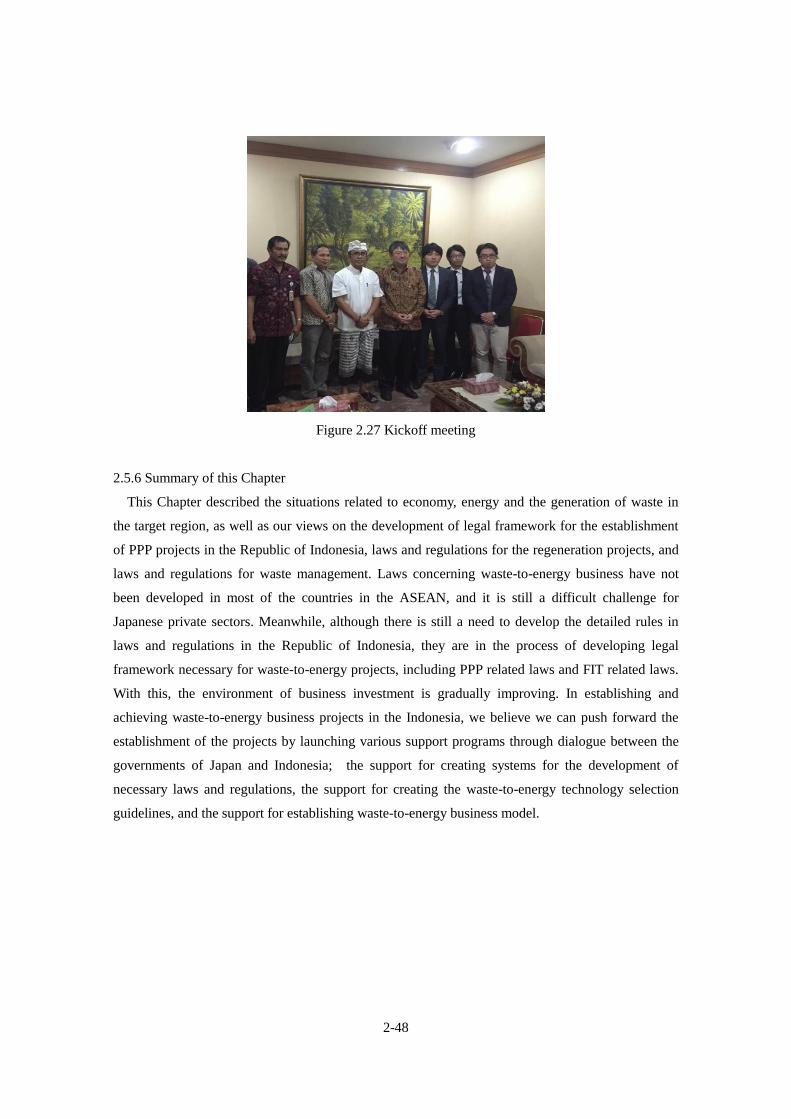
2-48
Figure 2.27 Kickoff meeting
2.5.6 Summary of this Chapter
This Chapter described the situations related to economy, energy and the generation of waste in
the target region, as well as our views on the development of legal framework for the establishment
of PPP projects in the Republic of Indonesia, laws and regulations for the regeneration projects, and
laws and regulations for waste management. Laws concerning waste-to-energy business have not
been developed in most of the countries in the ASEAN, and it is still a difficult challenge for
Japanese private sectors. Meanwhile, although there is still a need to develop the detailed rules in
laws and regulations in the Republic of Indonesia, they are in the process of developing legal
framework necessary for waste-to-energy projects, including PPP related laws and FIT related laws.
With this, the environment of business investment is gradually improving. In establishing and
achieving waste-to-energy business projects in the Indonesia, we believe we can push forward the
establishment of the projects by launching various support programs through dialogue between the
governments of Japan and Indonesia; the support for creating systems for the development of
necessary laws and regulations, the support for creating the waste-to-energy technology selection
guidelines, and the support for establishing waste-to-energy business model.
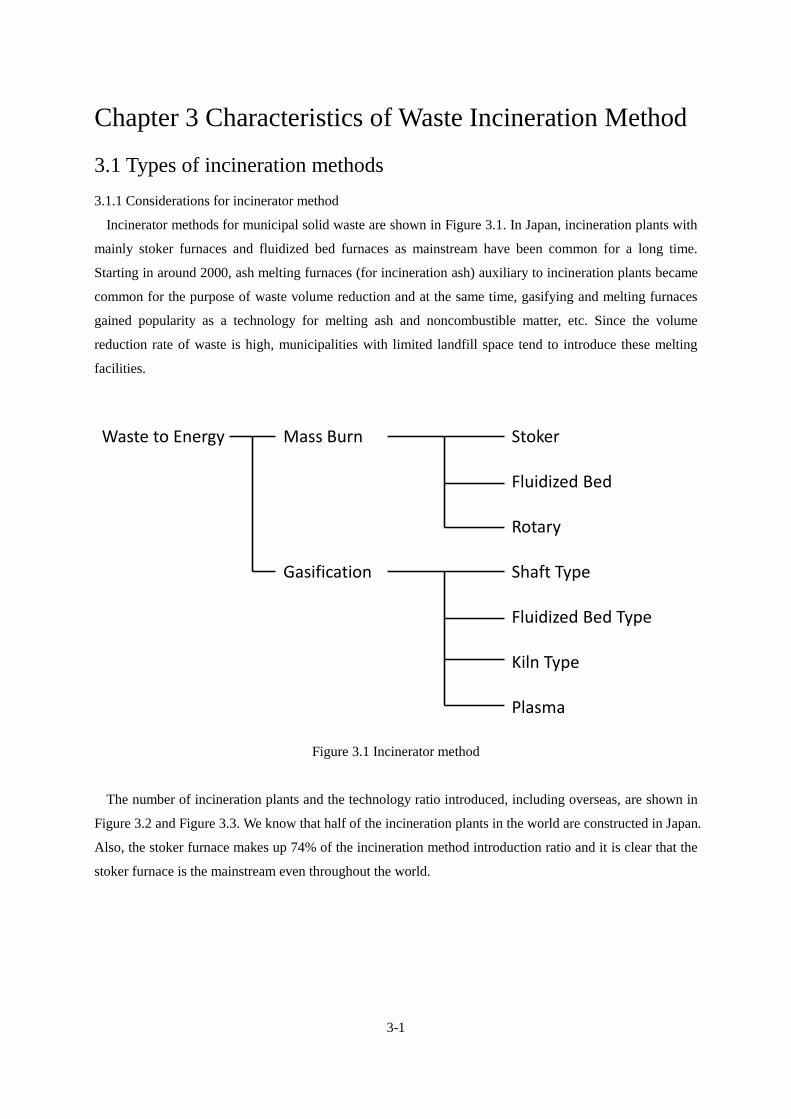
3-1
Chapter 3 Characteristics of Waste Incineration Method
3.1 Types of incineration methods
3.1.1 Considerations for incinerator method
Incinerator methods for municipal solid waste are shown in Figure 3.1. In Japan, incineration plants with
mainly stoker furnaces and fluidized bed furnaces as mainstream have been common for a long time.
Starting in around 2000, ash melting furnaces (for incineration ash) auxiliary to incineration plants became
common for the purpose of waste volume reduction and at the same time, gasifying and melting furnaces
gained popularity as a technology for melting ash and noncombustible matter, etc. Since the volume
reduction rate of waste is high, municipalities with limited landfill space tend to introduce these melting
facilities.
Figure 3.1 Incinerator method
The number of incineration plants and the technology ratio introduced, including overseas, are shown in
Figure 3.2 and Figure 3.3. We know that half of the incineration plants in the world are constructed in Japan.
Also, the stoker furnace makes up 74% of the incineration method introduction ratio and it is clear that the
stoker furnace is the mainstream even throughout the world.
Waste to Energy Mass Burn Stoker
Fluidized Bed
Rotary
Gasification Shaft Type
Fluidized Bed Type
Kiln Type
Plasma
3-2
Figure 3.2 Number of waste incinerators introduced throughout the world1
Figure 3.3 Ratio of incineration methods introduced throughout the world1
1 Mark Döing and others, 2015. Waste to Energy 2015/2016, 8th edition, Germany: ecoprog GmbH
Japan, 1172
Korea, 192
China, 190
France, 129
Germany, 105
America, 87
Italia, 54
UK, 40
Sweden, 37
Denmark, 33
Switzerland, 30
Taiwan, 24
Belgium, 17Norway, 16
Others, 96
Stoker
74%
Fluidized Bed
Gasification and Others
21%
5%
3-3
3.1.2 Overview of incinerator type
An overview of incinerator method types is summarized in Table 3.1.
Table 3.1 Overview of Incinerator types
Type Stoker Fluidized Bed Rotary
(kiln Stoker)
Figure
2
Outline Waste is combusted on the
moving grate with air
injected from the lower
part of the furnace. After
combusting the waste in
drying, combustion and
post-combustion zone, ash
is discharged from the
furnace. Ash and
incombustible waste are
mostly discharged from
the end of the grate. A
part of ash is flying in the
flue gas and collected in
bag filter as fly ash.
Waste is charged to the
hopper by waste crane and
crushed finely by waste
feeder. Fine waste charged
into furnace is rapidly
combusted in fluid hot
sand with
high-pressurized
combustion air. Metal and
incombustible wastes are
discharged from the
bottom of the furnace with
fluid sand, and ash is
flying in the flue gas and
collected in bag filter.
Fluid sand discharged to
outside is recovered to
return to the furnace after
separating from
incombustible waste.
Stoker (grate) is installed in
back of cylindrical kiln.
Waste is thermally
decomposed in the kiln with
a small volume of air and
combustible gas is
generated. The waste
contains carbon is charged to
the stoker to burn in
sufficient air. Incineration
ash is discharged by ash
conveyor set at the bottom of
the furnace. Combustible gas
is completely combusted in
the stoker furnace and the
secondary combustion
chamber. A part of ash is
flying in the flue gas and
collected in bag filter as fly
ash.
2 M Shigaki, 2000, Etoki Haikibutsu no nensho gijyutsu kaitei 3 han、ohmsha
3-4
Next, a comparison chart by incinerator type is shown.
Table 3.2 Comparison between Incinerator types
Type Stoker Fluidized Bed Rotary
(kiln Stoker)
Waste Type - There are many
records for combustion
of municipal solid
waste and industrial
waste.
- It is suitable for sludge
incineration
- The size of waste
should be less than 50
mm.
- Bulky waste and high
calorific value waste
such as waste plastic
and oil sludge can be
treated.
Final
Production
- Bottom ash
- Fly ash
- Incombustible waste
(including metal)
- Fly ash
- Bottom ash
- Fly ash
Advantage - Various types of waste
are acceptable.
- Large capacity of a
furnace is widespread.
- The most conventional
and proven technology.
- It is suitable for sludge
incineration.
- Start-up and
shut-down operations
can be carried out
easily in a short time.
- There are many
records
- Various types of waste
are acceptable using
the function of kiln
and stoker.
Disadvantage - High calorific value
waste (3,000kcal/kg or
more) is not preferable.
- Pretreatment (waste
crushing) is required
for stable combustion.
- There are no records of
large scaled furnace.
- The operational control
is difficult to meet
waste fluctuation due
to rapid combustion.
- Auxiliary fuel is
necessary for low
calorific value waste.
- There are no records of
large scaled furnace.
3-5
3.1.3 Overview of gasifying and melting furnace types
An overview of three types of gasifying and melting furnace method, shaft type, fluidized bed type and
plasma type is summarized in Table 3.3.
Table 3.3 Overview of gasifying and melting furnace types
Type Shaft Type Fluidized Bed type Plasma Type
Figure
3
Outline The waste charged from
the top of the furnace with
coke is dried and gasified
in the furnace. Ash
content of waste is melted
in high temperature
atmosphere caused by the
reaction between fixed
carbon in coke and waste
and supplied oxygen. The
slag and metal converted
from ash is discharged
from slag outlet. Slag is
utilized for various ways
such as asphalt aggregate
etc. In addition, metal is
recycled for counterweight
and copper recovery. The
feature is that the various
types of waste such as
sludge and medical waste
can be treated.
Fluidized bed furnace as a
gasifying facility and ash
melting furnace are
separately installed. Metal
and incombustible wastes
are discharged from the
bottom of the furnace with
fluid sand, and fly ash is
sent to the melting furnace.
Fly ash is melted under high
temperature by combustion
of pyrolysis gas.
Plasma torches are
installed on the side of
cylindrical furnace. The
heat generated by plasma
can melt the ash content of
waste, however the high
electrical consumption is
disadvantage for this
technology. The
temperature in the furnace
achieves to 3,000 degC or
more, thus the synthesis
gas does not include tar.
Synthesis gas can be
utilized as fuel gas.
However, this technology is
not commercialized in the
world.
3 Alter NRG Web Page
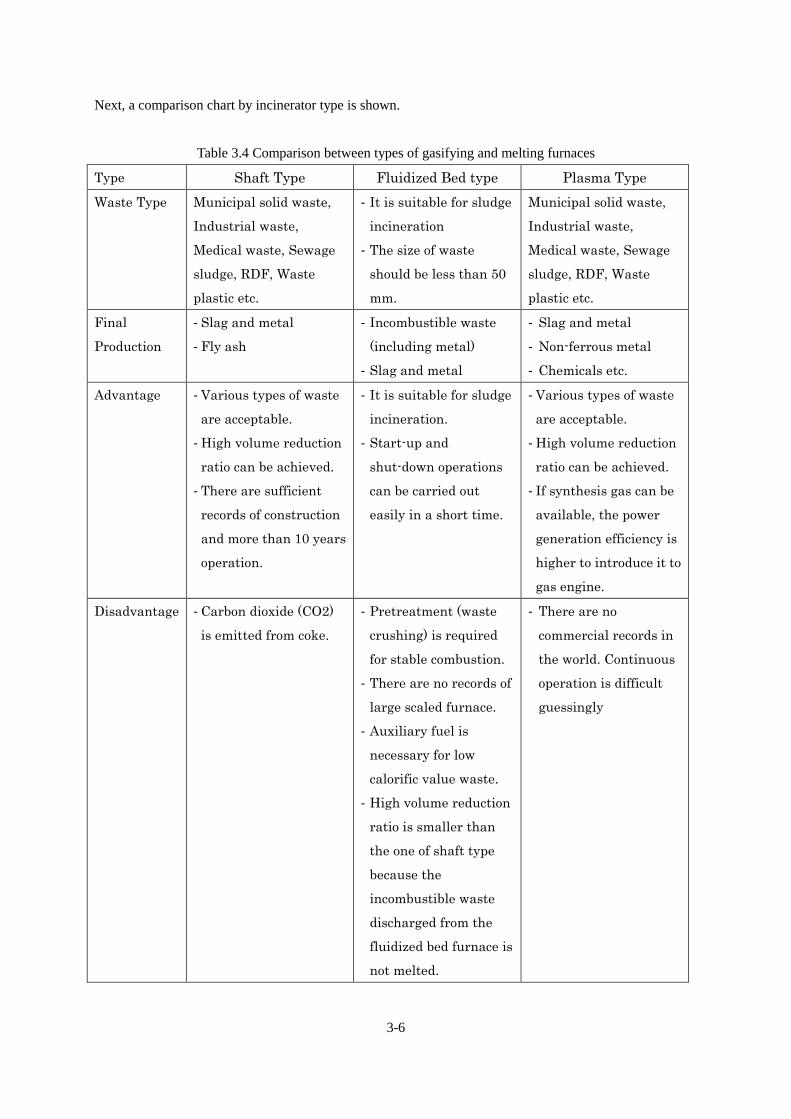
3-6
Next, a comparison chart by incinerator type is shown.
Table 3.4 Comparison between types of gasifying and melting furnaces
Type Shaft Type Fluidized Bed type Plasma Type
Waste Type Municipal solid waste,
Industrial waste,
Medical waste, Sewage
sludge, RDF, Waste
plastic etc.
- It is suitable for sludge
incineration
- The size of waste
should be less than 50
mm.
Municipal solid waste,
Industrial waste,
Medical waste, Sewage
sludge, RDF, Waste
plastic etc.
Final
Production
- Slag and metal
- Fly ash
- Incombustible waste
(including metal)
- Slag and metal
- Slag and metal
- Non-ferrous metal
- Chemicals etc.
Advantage - Various types of waste
are acceptable.
- High volume reduction
ratio can be achieved.
- There are sufficient
records of construction
and more than 10 years
operation.
- It is suitable for sludge
incineration.
- Start-up and
shut-down operations
can be carried out
easily in a short time.
- Various types of waste
are acceptable.
- High volume reduction
ratio can be achieved.
- If synthesis gas can be
available, the power
generation efficiency is
higher to introduce it to
gas engine.
Disadvantage - Carbon dioxide (CO2)
is emitted from coke.
- Pretreatment (waste
crushing) is required
for stable combustion.
- There are no records of
large scaled furnace.
- Auxiliary fuel is
necessary for low
calorific value waste.
- High volume reduction
ratio is smaller than
the one of shaft type
because the
incombustible waste
discharged from the
fluidized bed furnace is
not melted.
- There are no
commercial records in
the world. Continuous
operation is difficult
guessingly
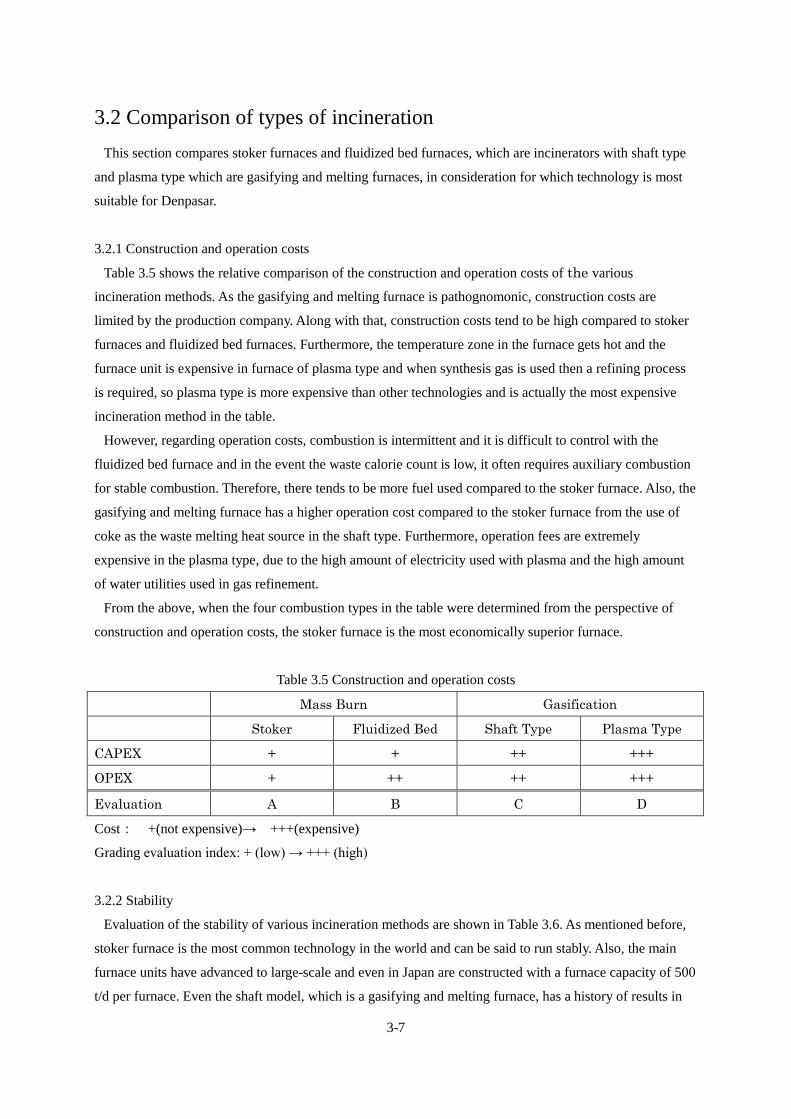
3-7
3.2 Comparison of types of incineration
This section compares stoker furnaces and fluidized bed furnaces, which are incinerators with shaft type
and plasma type which are gasifying and melting furnaces, in consideration for which technology is most
suitable for Denpasar.
3.2.1 Construction and operation costs
Table 3.5 shows the relative comparison of the construction and operation costs of the various
incineration methods. As the gasifying and melting furnace is pathognomonic, construction costs are
limited by the production company. Along with that, construction costs tend to be high compared to stoker
furnaces and fluidized bed furnaces. Furthermore, the temperature zone in the furnace gets hot and the
furnace unit is expensive in furnace of plasma type and when synthesis gas is used then a refining process
is required, so plasma type is more expensive than other technologies and is actually the most expensive
incineration method in the table.
However, regarding operation costs, combustion is intermittent and it is difficult to control with the
fluidized bed furnace and in the event the waste calorie count is low, it often requires auxiliary combustion
for stable combustion. Therefore, there tends to be more fuel used compared to the stoker furnace. Also, the
gasifying and melting furnace has a higher operation cost compared to the stoker furnace from the use of
coke as the waste melting heat source in the shaft type. Furthermore, operation fees are extremely
expensive in the plasma type, due to the high amount of electricity used with plasma and the high amount
of water utilities used in gas refinement.
From the above, when the four combustion types in the table were determined from the perspective of
construction and operation costs, the stoker furnace is the most economically superior furnace.
Table 3.5 Construction and operation costs
Mass Burn Gasification
Stoker Fluidized Bed Shaft Type Plasma Type
CAPEX + + ++ +++
OPEX + ++ ++ +++
Evaluation A B C D
Cost: +(not expensive)→ +++(expensive)
Grading evaluation index: + (low) → +++ (high)
3.2.2 Stability
Evaluation of the stability of various incineration methods are shown in Table 3.6. As mentioned before,
stoker furnace is the most common technology in the world and can be said to run stably. Also, the main
furnace units have advanced to large-scale and even in Japan are constructed with a furnace capacity of 500
t/d per furnace. Even the shaft model, which is a gasifying and melting furnace, has a history of results in
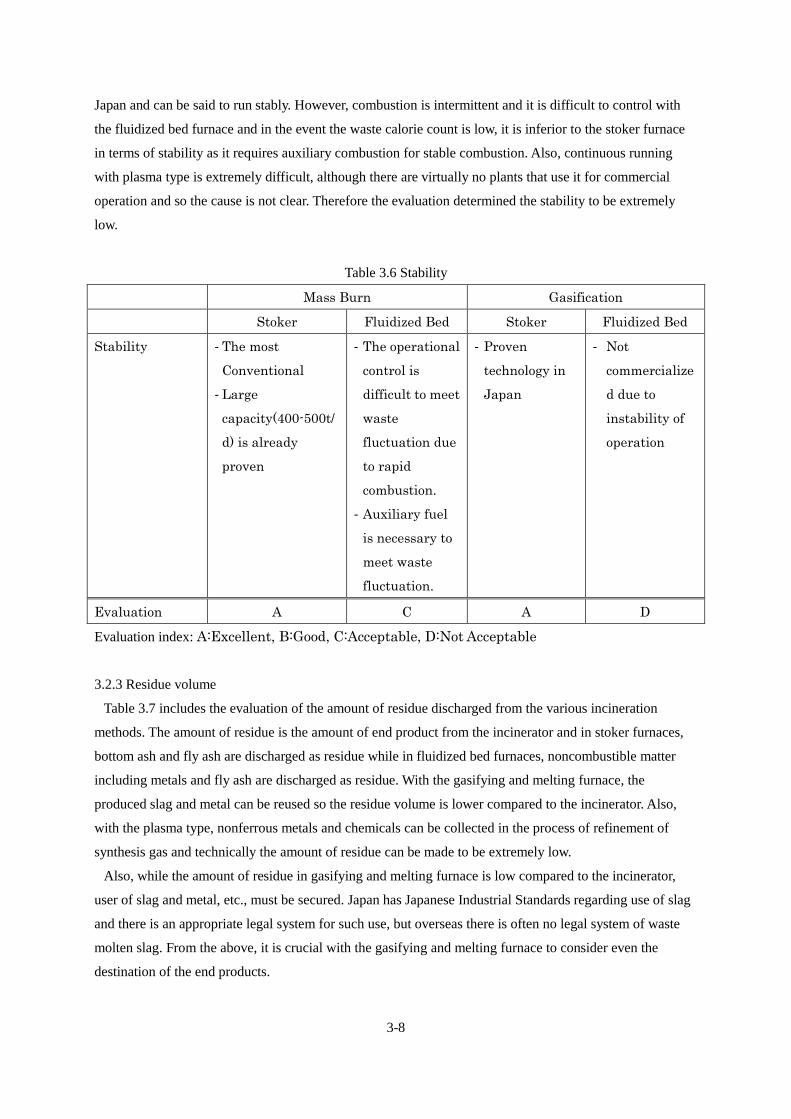
3-8
Japan and can be said to run stably. However, combustion is intermittent and it is difficult to control with
the fluidized bed furnace and in the event the waste calorie count is low, it is inferior to the stoker furnace
in terms of stability as it requires auxiliary combustion for stable combustion. Also, continuous running
with plasma type is extremely difficult, although there are virtually no plants that use it for commercial
operation and so the cause is not clear. Therefore the evaluation determined the stability to be extremely
low.
Table 3.6 Stability
Mass Burn Gasification
Stoker Fluidized Bed Stoker Fluidized Bed
Stability - The most
Conventional
- Large
capacity(400-500t/
d) is already
proven
- The operational
control is
difficult to meet
waste
fluctuation due
to rapid
combustion.
- Auxiliary fuel
is necessary to
meet waste
fluctuation.
- Proven
technology in
Japan
- Not
commercialize
d due to
instability of
operation
Evaluation A C A D
Evaluation index: A:Excellent, B:Good, C:Acceptable, D:Not Acceptable
3.2.3 Residue volume
Table 3.7 includes the evaluation of the amount of residue discharged from the various incineration
methods. The amount of residue is the amount of end product from the incinerator and in stoker furnaces,
bottom ash and fly ash are discharged as residue while in fluidized bed furnaces, noncombustible matter
including metals and fly ash are discharged as residue. With the gasifying and melting furnace, the
produced slag and metal can be reused so the residue volume is lower compared to the incinerator. Also,
with the plasma type, nonferrous metals and chemicals can be collected in the process of refinement of
synthesis gas and technically the amount of residue can be made to be extremely low.
Also, while the amount of residue in gasifying and melting furnace is low compared to the incinerator,
user of slag and metal, etc., must be secured. Japan has Japanese Industrial Standards regarding use of slag
and there is an appropriate legal system for such use, but overseas there is often no legal system of waste
molten slag. From the above, it is crucial with the gasifying and melting furnace to consider even the
destination of the end products.
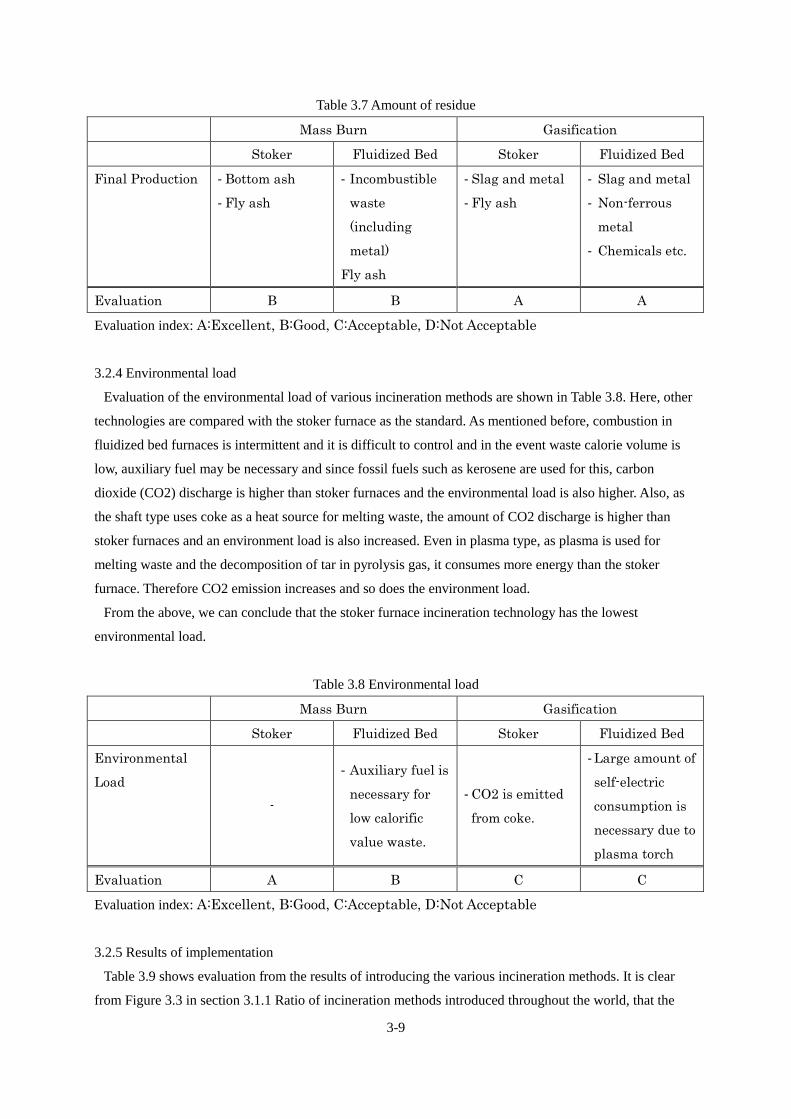
3-9
Table 3.7 Amount of residue
Mass Burn Gasification
Stoker Fluidized Bed Stoker Fluidized Bed
Final Production - Bottom ash
- Fly ash
- Incombustible
waste
(including
metal)
Fly ash
- Slag and metal
- Fly ash
- Slag and metal
- Non-ferrous
metal
- Chemicals etc.
Evaluation B B A A
Evaluation index: A:Excellent, B:Good, C:Acceptable, D:Not Acceptable
3.2.4 Environmental load
Evaluation of the environmental load of various incineration methods are shown in Table 3.8. Here, other
technologies are compared with the stoker furnace as the standard. As mentioned before, combustion in
fluidized bed furnaces is intermittent and it is difficult to control and in the event waste calorie volume is
low, auxiliary fuel may be necessary and since fossil fuels such as kerosene are used for this, carbon
dioxide (CO2) discharge is higher than stoker furnaces and the environmental load is also higher. Also, as
the shaft type uses coke as a heat source for melting waste, the amount of CO2 discharge is higher than
stoker furnaces and an environment load is also increased. Even in plasma type, as plasma is used for
melting waste and the decomposition of tar in pyrolysis gas, it consumes more energy than the stoker
furnace. Therefore CO2 emission increases and so does the environment load.
From the above, we can conclude that the stoker furnace incineration technology has the lowest
environmental load.
Table 3.8 Environmental load
Mass Burn Gasification
Stoker Fluidized Bed Stoker Fluidized Bed
Environmental
Load
-
- Auxiliary fuel is
necessary for
low calorific
value waste.
- CO2 is emitted
from coke.
- Large amount of
self-electric
consumption is
necessary due to
plasma torch
Evaluation A B C C
Evaluation index: A:Excellent, B:Good, C:Acceptable, D:Not Acceptable
3.2.5 Results of implementation
Table 3.9 shows evaluation from the results of introducing the various incineration methods. It is clear
from Figure 3.3 in section 3.1.1 Ratio of incineration methods introduced throughout the world, that the
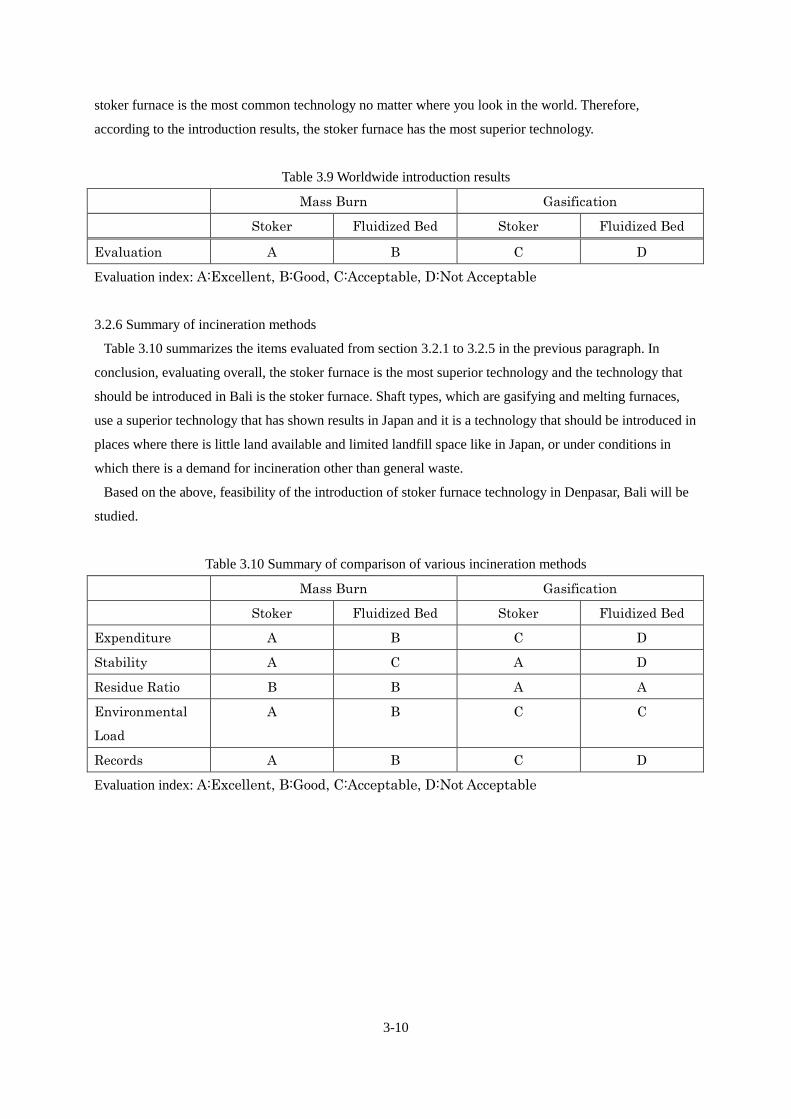
3-10
stoker furnace is the most common technology no matter where you look in the world. Therefore,
according to the introduction results, the stoker furnace has the most superior technology.
Table 3.9 Worldwide introduction results
Mass Burn Gasification
Stoker Fluidized Bed Stoker Fluidized Bed
Evaluation A B C D
Evaluation index: A:Excellent, B:Good, C:Acceptable, D:Not Acceptable
3.2.6 Summary of incineration methods
Table 3.10 summarizes the items evaluated from section 3.2.1 to 3.2.5 in the previous paragraph. In
conclusion, evaluating overall, the stoker furnace is the most superior technology and the technology that
should be introduced in Bali is the stoker furnace. Shaft types, which are gasifying and melting furnaces,
use a superior technology that has shown results in Japan and it is a technology that should be introduced in
places where there is little land available and limited landfill space like in Japan, or under conditions in
which there is a demand for incineration other than general waste.
Based on the above, feasibility of the introduction of stoker furnace technology in Denpasar, Bali will be
studied.
Table 3.10 Summary of comparison of various incineration methods
Mass Burn Gasification
Stoker Fluidized Bed Stoker Fluidized Bed
Expenditure A B C D
Stability A C A D
Residue Ratio B B A A
Environmental
Load
A B C C
Records A B C D
Evaluation index: A:Excellent, B:Good, C:Acceptable, D:Not Acceptable
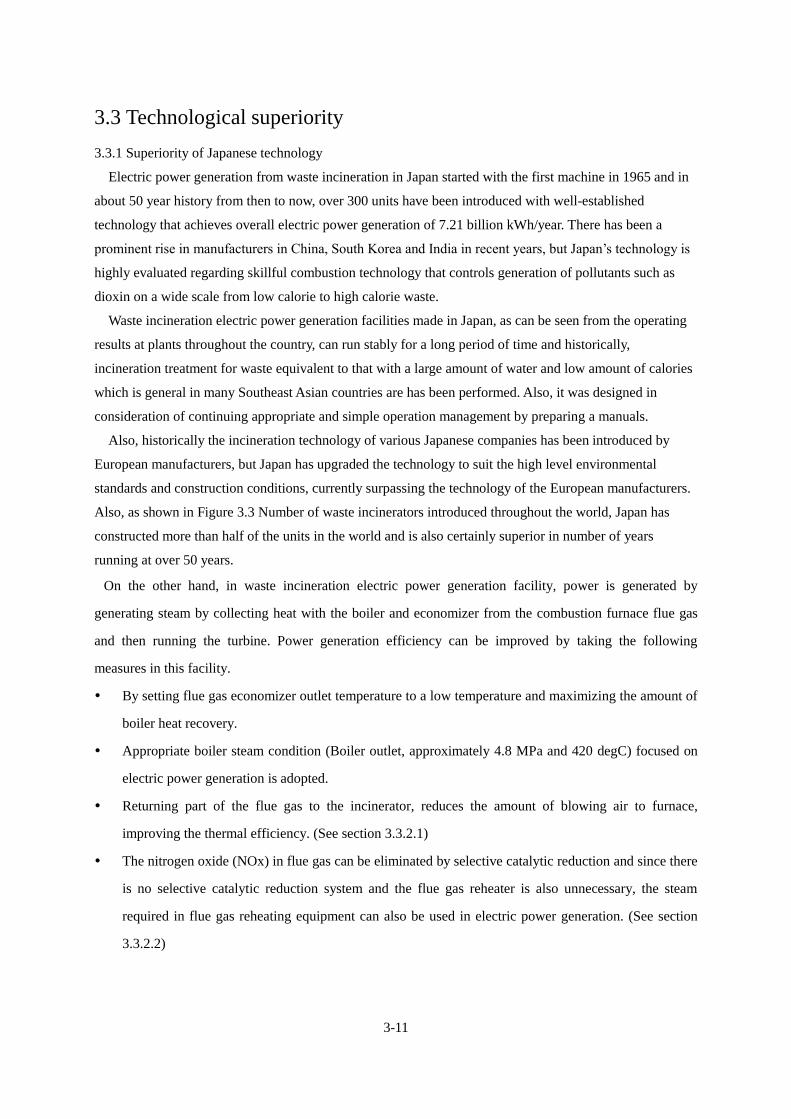
3-11
3.3 Technological superiority
3.3.1 Superiority of Japanese technology
Electric power generation from waste incineration in Japan started with the first machine in 1965 and in
about 50 year history from then to now, over 300 units have been introduced with well-established
technology that achieves overall electric power generation of 7.21 billion kWh/year. There has been a
prominent rise in manufacturers in China, South Korea and India in recent years, but Japan’s technology is
highly evaluated regarding skillful combustion technology that controls generation of pollutants such as
dioxin on a wide scale from low calorie to high calorie waste.
Waste incineration electric power generation facilities made in Japan, as can be seen from the operating
results at plants throughout the country, can run stably for a long period of time and historically,
incineration treatment for waste equivalent to that with a large amount of water and low amount of calories
which is general in many Southeast Asian countries are has been performed. Also, it was designed in
consideration of continuing appropriate and simple operation management by preparing a manuals.
Also, historically the incineration technology of various Japanese companies has been introduced by
European manufacturers, but Japan has upgraded the technology to suit the high level environmental
standards and construction conditions, currently surpassing the technology of the European manufacturers.
Also, as shown in Figure 3.3 Number of waste incinerators introduced throughout the world, Japan has
constructed more than half of the units in the world and is also certainly superior in number of years
running at over 50 years.
On the other hand, in waste incineration electric power generation facility, power is generated by
generating steam by collecting heat with the boiler and economizer from the combustion furnace flue gas
and then running the turbine. Power generation efficiency can be improved by taking the following
measures in this facility.
By setting flue gas economizer outlet temperature to a low temperature and maximizing the amount of
boiler heat recovery.
Appropriate boiler steam condition (Boiler outlet, approximately 4.8 MPa and 420 degC) focused on
electric power generation is adopted.
Returning part of the flue gas to the incinerator, reduces the amount of blowing air to furnace,
improving the thermal efficiency. (See section 3.3.2.1)
The nitrogen oxide (NOx) in flue gas can be eliminated by selective catalytic reduction and since there
is no selective catalytic reduction system and the flue gas reheater is also unnecessary, the steam
required in flue gas reheating equipment can also be used in electric power generation. (See section
3.3.2.2)
3-12
3.3.2 Technology of JFE Engineering’s stoker furnace
3.3.2.1 Hot air combustion system which achieves low air ratio combustion
With normal stoker furnaces, the gas flow and temperature field in the furnace are heterogeneous, so the
more air than the theoretical value must be provided for combustion stabilization.
Japan’s high-temperature air combustion system forms a stable combustion zone in the upper waste layer
and promotes the thermal decomposition of waste by blowing a gaseous mixture of high-temperature air
and combustion flue gas into the upper waste layer in the combustion chamber. Therefore, stable
combustion is possible even with a low air ratio (closer air volume to the theoretical air volume). As a
result, generation of nitrogen oxide (NOx), carbon monoxide (CO) and dioxins is controlled and heat loss is
significantly reduced due to reduced amount of flue gas, improving generated output (see Figure 3.4 to 3.7).
Considering that the performance of competitors in other countries is at about the same level as JFE
Engineering’s past results, we can say that Japan’s technology is superior.
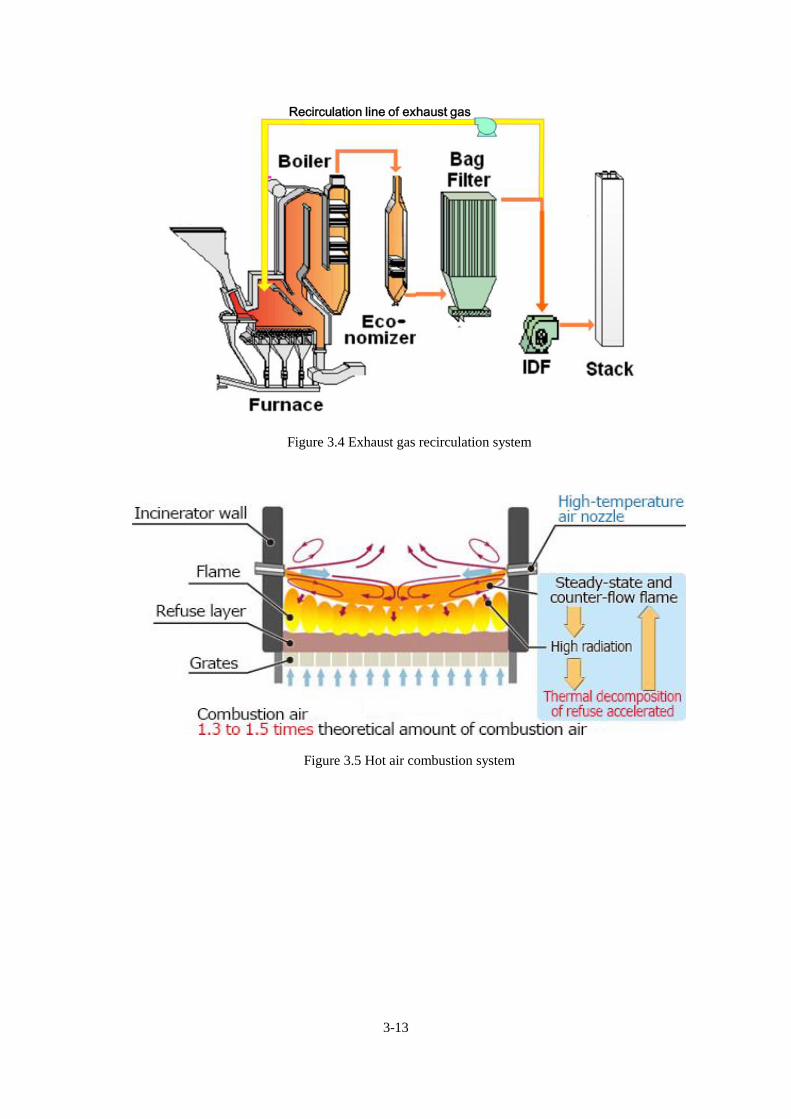
3-13
Figure 3.4 Exhaust gas recirculation system
Figure 3.5 Hot air combustion system
Recirculation line of exhaust gas
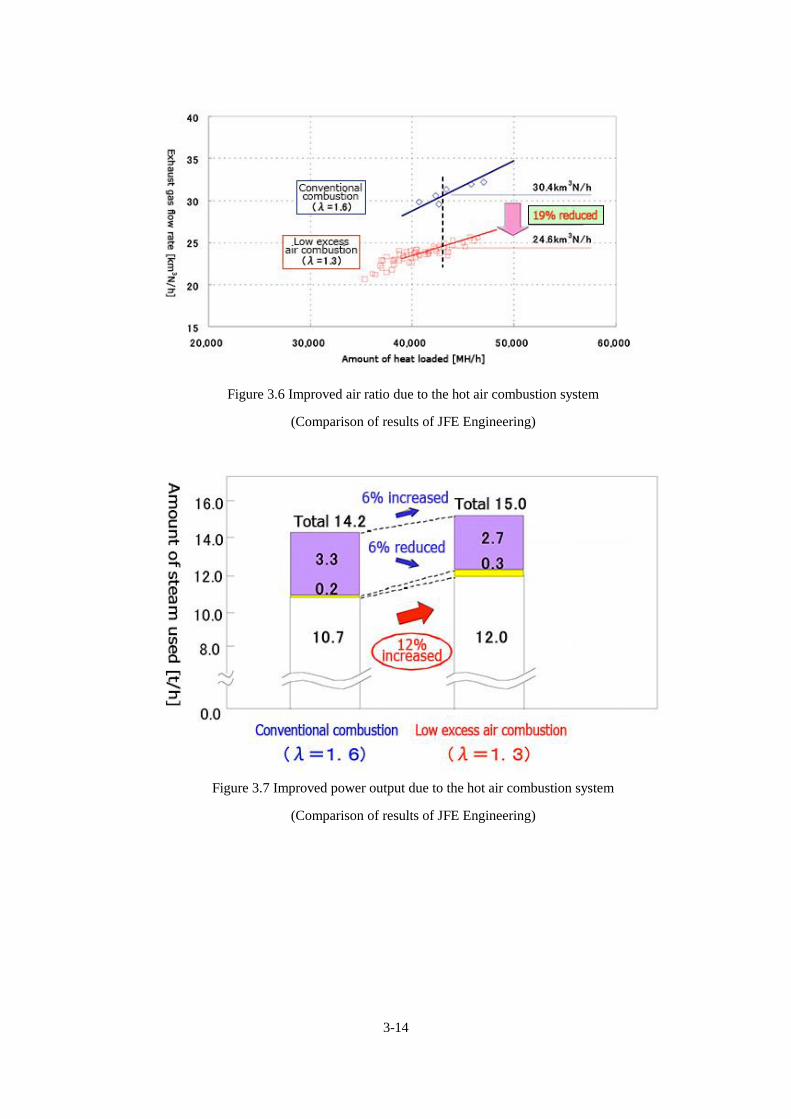
3-14
Figure 3.6 Improved air ratio due to the hot air combustion system
(Comparison of results of JFE Engineering)
Figure 3.7 Improved power output due to the hot air combustion system
(Comparison of results of JFE Engineering)
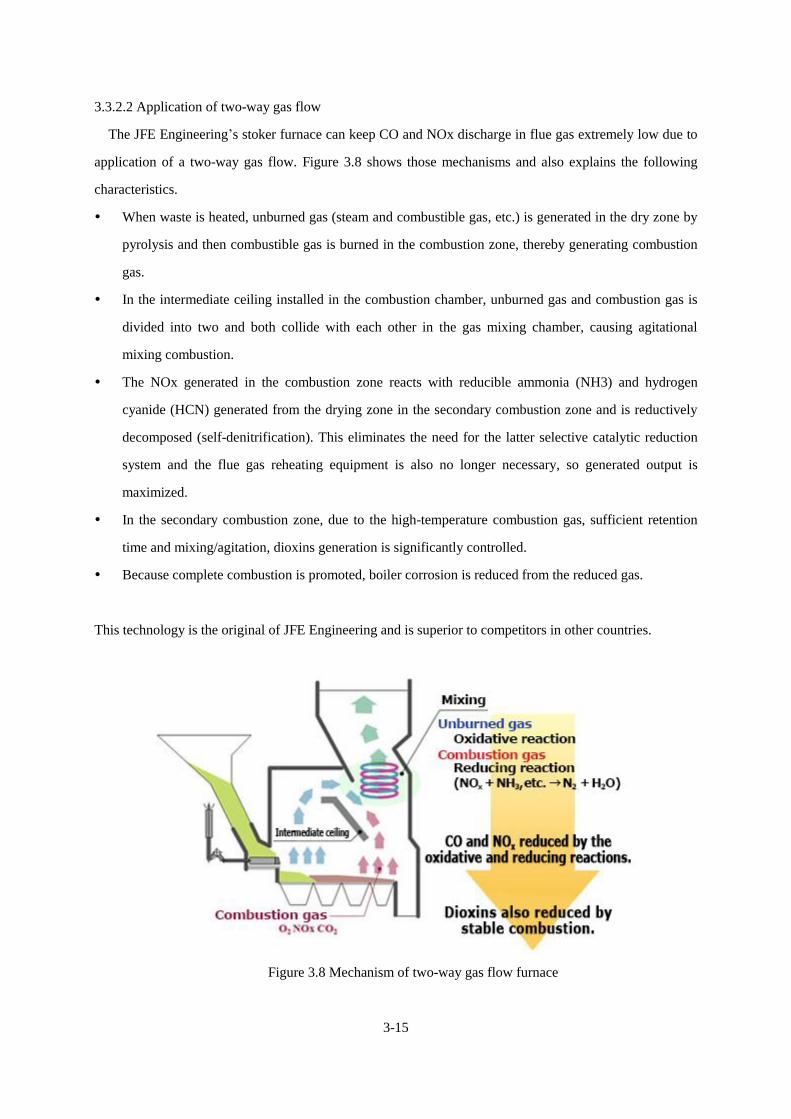
3-15
3.3.2.2 Application of two-way gas flow
The JFE Engineering’s stoker furnace can keep CO and NOx discharge in flue gas extremely low due to
application of a two-way gas flow. Figure 3.8 shows those mechanisms and also explains the following
characteristics.
When waste is heated, unburned gas (steam and combustible gas, etc.) is generated in the dry zone by
pyrolysis and then combustible gas is burned in the combustion zone, thereby generating combustion
gas.
In the intermediate ceiling installed in the combustion chamber, unburned gas and combustion gas is
divided into two and both collide with each other in the gas mixing chamber, causing agitational
mixing combustion.
The NOx generated in the combustion zone reacts with reducible ammonia (NH3) and hydrogen
cyanide (HCN) generated from the drying zone in the secondary combustion zone and is reductively
decomposed (self-denitrification). This eliminates the need for the latter selective catalytic reduction
system and the flue gas reheating equipment is also no longer necessary, so generated output is
maximized.
In the secondary combustion zone, due to the high-temperature combustion gas, sufficient retention
time and mixing/agitation, dioxins generation is significantly controlled.
Because complete combustion is promoted, boiler corrosion is reduced from the reduced gas.
This technology is the original of JFE Engineering and is superior to competitors in other countries.
Figure 3.8 Mechanism of two-way gas flow furnace
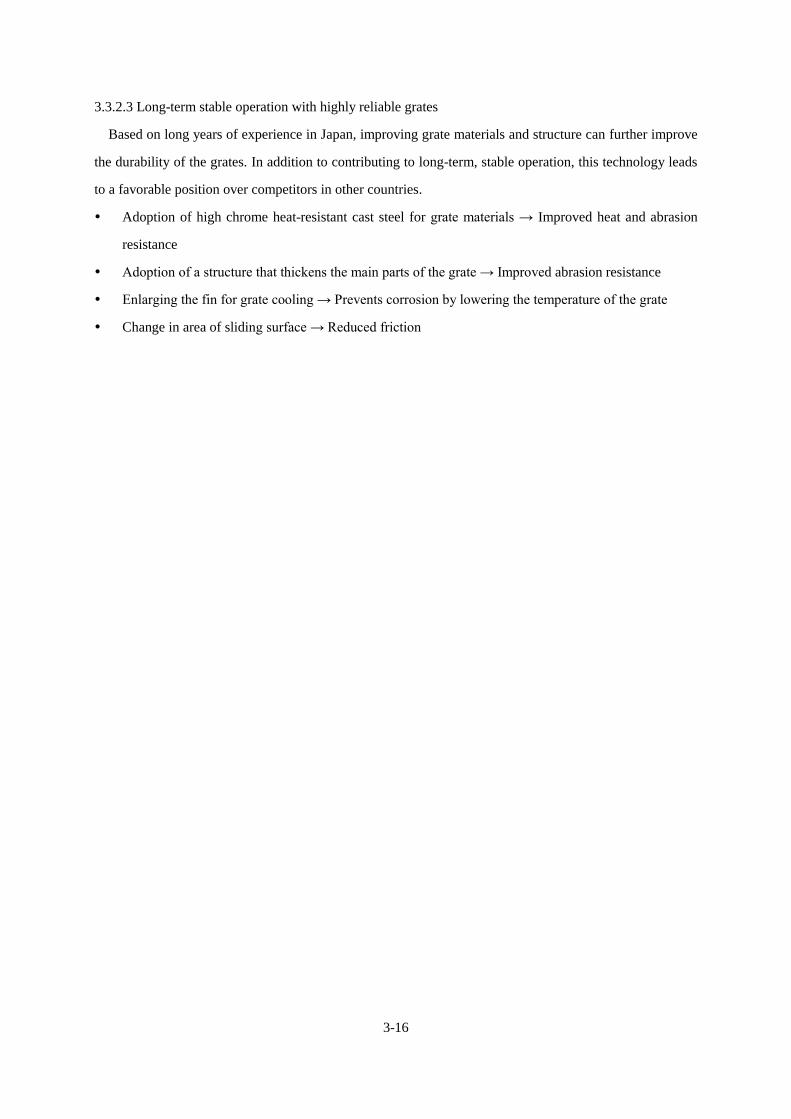
3-16
3.3.2.3 Long-term stable operation with highly reliable grates
Based on long years of experience in Japan, improving grate materials and structure can further improve
the durability of the grates. In addition to contributing to long-term, stable operation, this technology leads
to a favorable position over competitors in other countries.
Adoption of high chrome heat-resistant cast steel for grate materials → Improved heat and abrasion
resistance
Adoption of a structure that thickens the main parts of the grate → Improved abrasion resistance
Enlarging the fin for grate cooling → Prevents corrosion by lowering the temperature of the grate
Change in area of sliding surface → Reduced friction
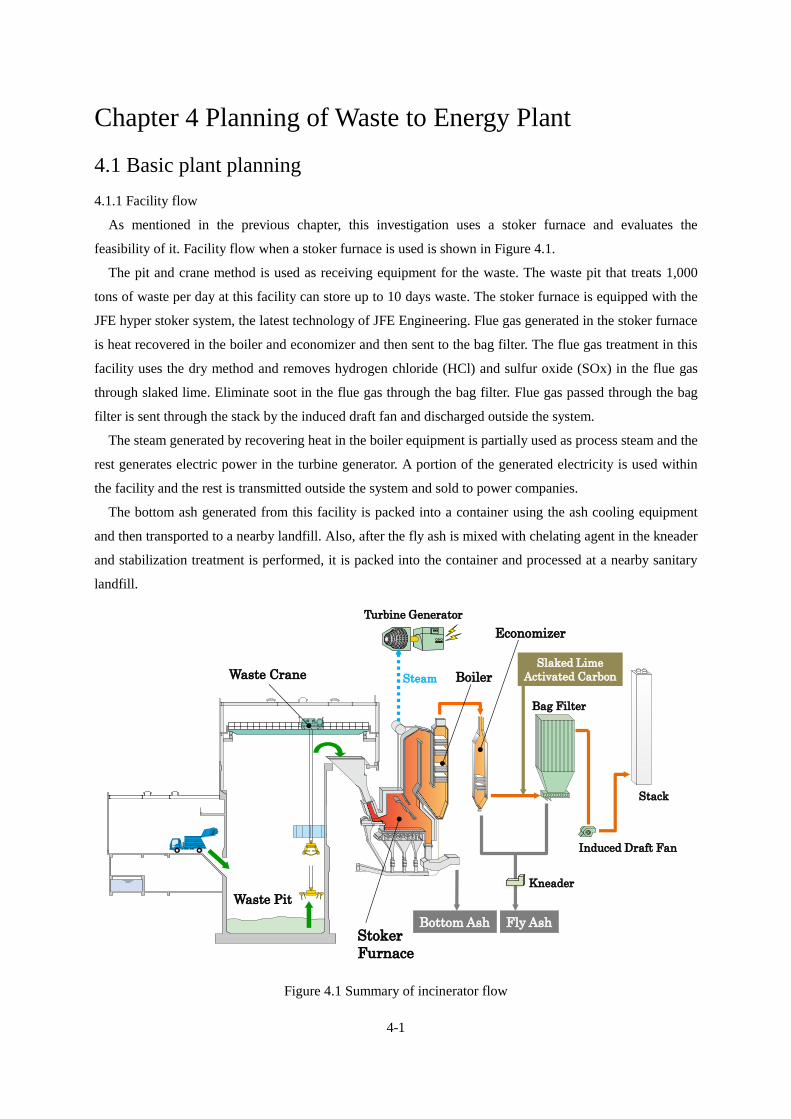
4-1
Chapter 4 Planning of Waste to Energy Plant
4.1 Basic plant planning
4.1.1 Facility flow
As mentioned in the previous chapter, this investigation uses a stoker furnace and evaluates the
feasibility of it. Facility flow when a stoker furnace is used is shown in Figure 4.1.
The pit and crane method is used as receiving equipment for the waste. The waste pit that treats 1,000
tons of waste per day at this facility can store up to 10 days waste. The stoker furnace is equipped with the
JFE hyper stoker system, the latest technology of JFE Engineering. Flue gas generated in the stoker furnace
is heat recovered in the boiler and economizer and then sent to the bag filter. The flue gas treatment in this
facility uses the dry method and removes hydrogen chloride (HCl) and sulfur oxide (SOx) in the flue gas
through slaked lime. Eliminate soot in the flue gas through the bag filter. Flue gas passed through the bag
filter is sent through the stack by the induced draft fan and discharged outside the system.
The steam generated by recovering heat in the boiler equipment is partially used as process steam and the
rest generates electric power in the turbine generator. A portion of the generated electricity is used within
the facility and the rest is transmitted outside the system and sold to power companies.
The bottom ash generated from this facility is packed into a container using the ash cooling equipment
and then transported to a nearby landfill. Also, after the fly ash is mixed with chelating agent in the kneader
and stabilization treatment is performed, it is packed into the container and processed at a nearby sanitary
landfill.
Figure 4.1 Summary of incinerator flow
Induced Draft Fan
Bag Filter
Boiler
Stoker
Furnace
Steam
Bottom Ash Fly Ash
Economizer
Turbine Generator
Waste Pit
Waste Crane
Stack
Kneader
Slaked Lime
Activated Carbon
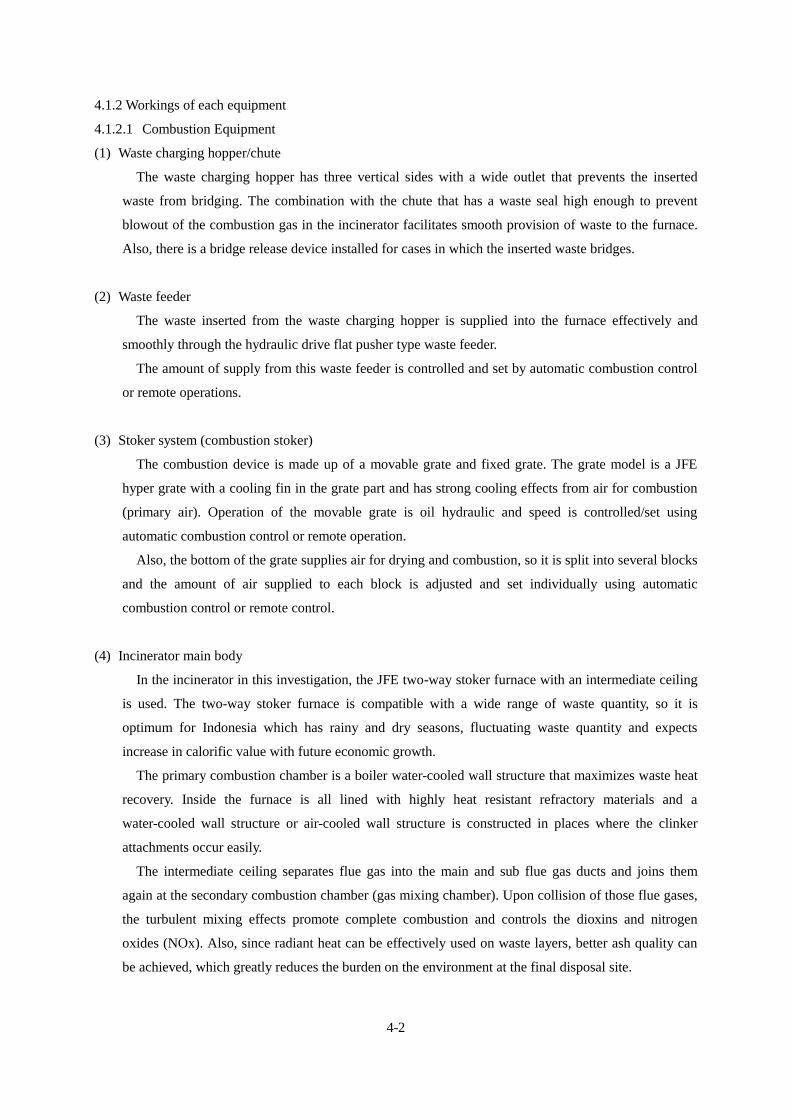
4-2
4.1.2 Workings of each equipment
4.1.2.1 Combustion Equipment
(1) Waste charging hopper/chute
The waste charging hopper has three vertical sides with a wide outlet that prevents the inserted
waste from bridging. The combination with the chute that has a waste seal high enough to prevent
blowout of the combustion gas in the incinerator facilitates smooth provision of waste to the furnace.
Also, there is a bridge release device installed for cases in which the inserted waste bridges.
(2) Waste feeder
The waste inserted from the waste charging hopper is supplied into the furnace effectively and
smoothly through the hydraulic drive flat pusher type waste feeder.
The amount of supply from this waste feeder is controlled and set by automatic combustion control
or remote operations.
(3) Stoker system (combustion stoker)
The combustion device is made up of a movable grate and fixed grate. The grate model is a JFE
hyper grate with a cooling fin in the grate part and has strong cooling effects from air for combustion
(primary air). Operation of the movable grate is oil hydraulic and speed is controlled/set using
automatic combustion control or remote operation.
Also, the bottom of the grate supplies air for drying and combustion, so it is split into several blocks
and the amount of air supplied to each block is adjusted and set individually using automatic
combustion control or remote control.
(4) Incinerator main body
In the incinerator in this investigation, the JFE two-way stoker furnace with an intermediate ceiling
is used. The two-way stoker furnace is compatible with a wide range of waste quantity, so it is
optimum for Indonesia which has rainy and dry seasons, fluctuating waste quantity and expects
increase in calorific value with future economic growth.
The primary combustion chamber is a boiler water-cooled wall structure that maximizes waste heat
recovery. Inside the furnace is all lined with highly heat resistant refractory materials and a
water-cooled wall structure or air-cooled wall structure is constructed in places where the clinker
attachments occur easily.
The intermediate ceiling separates flue gas into the main and sub flue gas ducts and joins them
again at the secondary combustion chamber (gas mixing chamber). Upon collision of those flue gases,
the turbulent mixing effects promote complete combustion and controls the dioxins and nitrogen
oxides (NOx). Also, since radiant heat can be effectively used on waste layers, better ash quality can
be achieved, which greatly reduces the burden on the environment at the final disposal site.
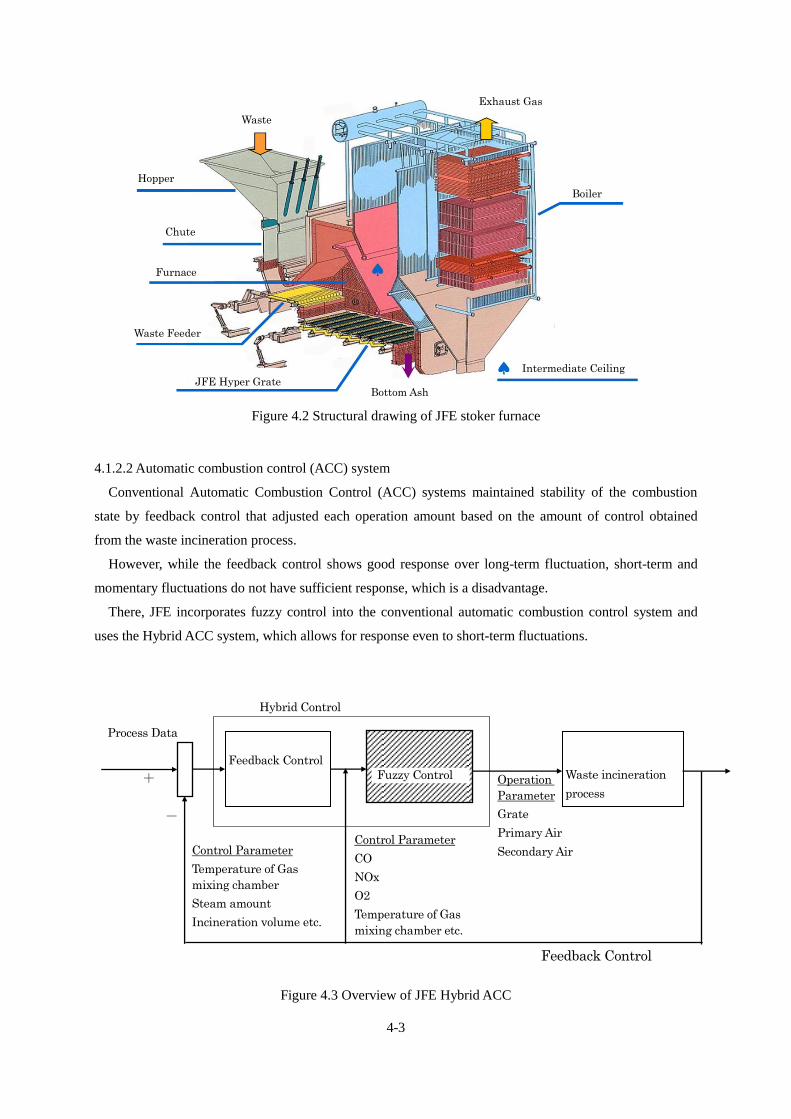
4-3
Figure 4.2 Structural drawing of JFE stoker furnace
4.1.2.2 Automatic combustion control (ACC) system
Conventional Automatic Combustion Control (ACC) systems maintained stability of the combustion
state by feedback control that adjusted each operation amount based on the amount of control obtained
from the waste incineration process.
However, while the feedback control shows good response over long-term fluctuation, short-term and
momentary fluctuations do not have sufficient response, which is a disadvantage.
There, JFE incorporates fuzzy control into the conventional automatic combustion control system and
uses the Hybrid ACC system, which allows for response even to short-term fluctuations.
Figure 4.3 Overview of JFE Hybrid ACC
Control Parameter
Temperature of Gas
mixing chamber
Steam amount
Incineration volume etc.
Control Parameter
CO
NOx
O2
Temperature of Gas
mixing chamber etc.
Operation
Parameter
Grate
Primary Air
Secondary Air
Hybrid Control
-
+
Process Data
Feedback Control
Waste incineration
process
Feedback Control
Fuzzy Control
Waste
Hopper
Chute
Furnace
Waste Feeder
JFE Hyper Grate Bottom Ash
Intermediate Ceiling
Boiler
Exhaust Gas
4-4
4.1.2.3 Combustion Gas Cooling Facilities
The purpose of the boiler is to cool down flue gas from waste combustion and to convert the collected
calories to steam to make use of waste heat effectively. A single drum gravity circulation boiler is used in
this plan.
Hot water that is deaerated in a deaerator and preheated by an economizer is supplied to the boiler drum.
The boiler water then flows down by natural circulation through the flowing down tube and is transferred to
the distribution tube, then to the heating tube, where it is heated and rises due to the difference in the
gravity. It is returned to the drum again and steam is separated from water content.
After being heated by the superheater, the high-pressure saturated steam from the boiler drum is sent to
the established steam turbine and used in electric power generation.
Three element control method is adopted for this boiler: feedwater amount, drum level and steam
generation amount. This is an optimal method for controlling incineration boiler and the condition of which
changes greatly depending on the waste quantity. These controls are automatically performed by setting the
steam generation volume.
In the location of the boiler heat transfer pipe (superheater/economizer), there is a soot blower installed
to remove dust, etc., from the transfer pipe. Boiler peripheral equipment and accessories include deaerator,
demineralizer, boiler chemical injection system, continuous blow unit and boiler water monitoring unit.
4.1.2.4 Flue gas treatment facilities
(1) Temperature reducing device
With the waste incineration plant, it is normal to install the gas cooling tower as a gas cooling
device. The gas cooling tower is equipment that cools combustion gas flowing from the boiler or
economizer outlet using latent heat from water steam. Cooling the gas temperature quickly using the
gas cooling tower prevents de novo synthesis of dioxins.
As this facility plays the important role of securing feasibility from revenue from selling electricity,
it is designed for the boiler outlet temperature to remain around 160 degC and there is no gas cooling
tower, in order to maximize generated output.
(2) Acid gas (HCl: hydrogen chloride, SOx: sulfur oxides, HF: hydrogen fluoride) eliminator device
In this investigation, the dry procedure of transferring or shooting powder slaked lime in the flue
gas duct in front of the filter dust collector is used and is constructed of the slaked lime silo, slaked
lime volumetric feeding equipment and shooting blower, etc.
Reaction product calcium chloride (CaCl2) and calcium sulfuric acid (CaSO4) are collected in
granulated form from the filter dust collector.
(3) Device that removes dioxins
In this investigation, drying treatment is used to transfer/shoot the powdered slaked lime for
removing the aforementioned acid gas and powdered activated carbon through the flue gas duct in
4-5
front of the filter dust collector.
Powdered activated carbon shot out adsorbs gas dioxins in the flue gas. This powdered activated
carbon and granulated dioxins are collected and removed by filter dust collection equipment.
Also, the JFE incinerator can control dioxins generation just by managing the combustion control
appropriately with the effects of the aforementioned two-way structure, which contributes greatly to
reducing the powder activated carbon volume.
(4) Device that removes dust and soot
In this investigation, the filter dust collector (bag filter) is used to remove fly ash from the flue gas
generated from the incinerator, the aforementioned reactive materials to powdered agents and
granulated dioxins from the flue gas.
The method of casting dust away from the filter dust collector is the pulse jet type and the collected
dust is cast away using compressed air shot out from the nozzle at regular intervals.
The casted off dust is discharged from the lower hopper via the dust collector conveyor and carried
to the fly ash silo on the fly ash conveyor.
(5) Nitrogen oxides (NOx) defibrillator
In the JFE stoker furnace used in this investigation, furnace is strongly affected by the
aforementioned two-way effect, so the current emission standards can be complied with if there is
appropriate combustion control. Therefore, in this plan, these device settings are not planned.
4.1.2.5 Heat recovery device
① Steam turbine
Waste heat (flue gas) that is generated during waste incineration is collected as steam by the boiler and
the steam turbine/generator from that steam is run to generate electric power. In this plan, condensing
extraction turbines are used and the extraction is used as steam for the deaerator process.
② Low-pressure steam condenser
This equipment is a system to cool down, condensate and liquefy all of steam used at the steam turbine.
In this plan, an air condenser that doesn’t require a lot of cooling water is used.
4.1.2.6 Ash handling equipment
(1) Bottom ash (incineration ash)
Ash that has been completely incinerated is dropped into the ash cooling equipment through the
bottom ash chute and after extinguishing fire and humidifying, it is held temporarily in the ash
container and regularly transported to the final disposal site by truck. In this plan, semi wet ash
cooling equipment is used for the ash cooling equipment.
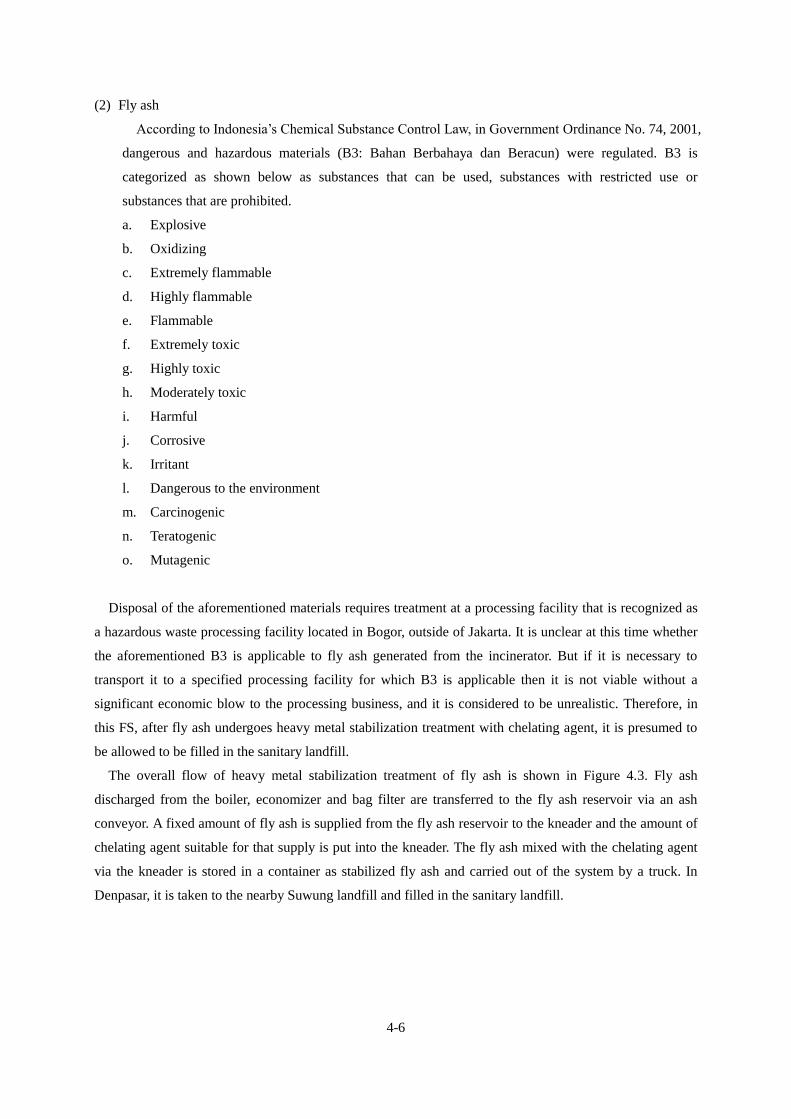
4-6
(2) Fly ash
According to Indonesia’s Chemical Substance Control Law, in Government Ordinance No. 74, 2001,
dangerous and hazardous materials (B3: Bahan Berbahaya dan Beracun) were regulated. B3 is
categorized as shown below as substances that can be used, substances with restricted use or
substances that are prohibited.
a. Explosive
b. Oxidizing
c. Extremely flammable
d. Highly flammable
e. Flammable
f. Extremely toxic
g. Highly toxic
h. Moderately toxic
i. Harmful
j. Corrosive
k. Irritant
l. Dangerous to the environment
m. Carcinogenic
n. Teratogenic
o. Mutagenic
Disposal of the aforementioned materials requires treatment at a processing facility that is recognized as
a hazardous waste processing facility located in Bogor, outside of Jakarta. It is unclear at this time whether
the aforementioned B3 is applicable to fly ash generated from the incinerator. But if it is necessary to
transport it to a specified processing facility for which B3 is applicable then it is not viable without a
significant economic blow to the processing business, and it is considered to be unrealistic. Therefore, in
this FS, after fly ash undergoes heavy metal stabilization treatment with chelating agent, it is presumed to
be allowed to be filled in the sanitary landfill.
The overall flow of heavy metal stabilization treatment of fly ash is shown in Figure 4.3. Fly ash
discharged from the boiler, economizer and bag filter are transferred to the fly ash reservoir via an ash
conveyor. A fixed amount of fly ash is supplied from the fly ash reservoir to the kneader and the amount of
chelating agent suitable for that supply is put into the kneader. The fly ash mixed with the chelating agent
via the kneader is stored in a container as stabilized fly ash and carried out of the system by a truck. In
Denpasar, it is taken to the nearby Suwung landfill and filled in the sanitary landfill.
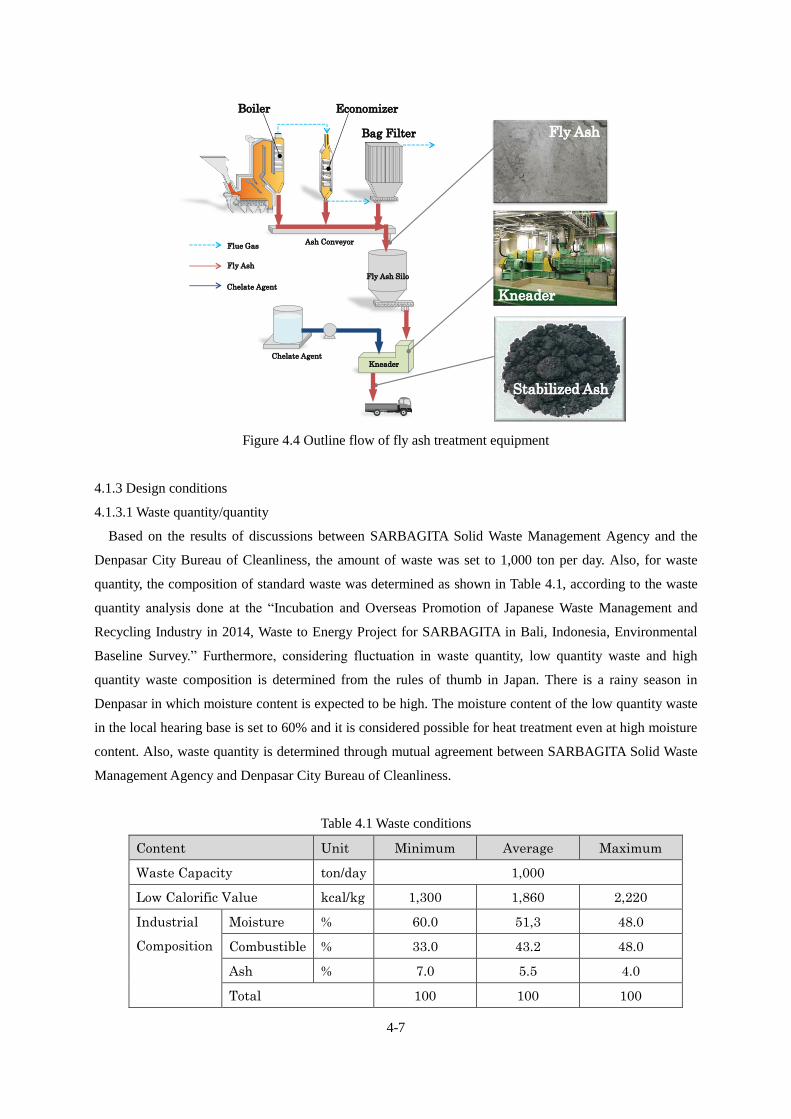
4-7
Figure 4.4 Outline flow of fly ash treatment equipment
4.1.3 Design conditions
4.1.3.1 Waste quantity/quantity
Based on the results of discussions between SARBAGITA Solid Waste Management Agency and the
Denpasar City Bureau of Cleanliness, the amount of waste was set to 1,000 ton per day. Also, for waste
quantity, the composition of standard waste was determined as shown in Table 4.1, according to the waste
quantity analysis done at the “Incubation and Overseas Promotion of Japanese Waste Management and
Recycling Industry in 2014, Waste to Energy Project for SARBAGITA in Bali, Indonesia, Environmental
Baseline Survey.” Furthermore, considering fluctuation in waste quantity, low quantity waste and high
quantity waste composition is determined from the rules of thumb in Japan. There is a rainy season in
Denpasar in which moisture content is expected to be high. The moisture content of the low quantity waste
in the local hearing base is set to 60% and it is considered possible for heat treatment even at high moisture
content. Also, waste quantity is determined through mutual agreement between SARBAGITA Solid Waste
Management Agency and Denpasar City Bureau of Cleanliness.
Table 4.1 Waste conditions
Content Unit Minimum Average Maximum
Waste Capacity ton/day 1,000
Low Calorific Value kcal/kg 1,300 1,860 2,220
Industrial
Composition
Moisture % 60.0 51,3 48.0
Combustible % 33.0 43.2 48.0
Ash % 7.0 5.5 4.0
Total 100 100 100
Chelate Agent
Fly Ash Silo
Kneader
Ash Conveyor
Fly Ash
Kneader
Stabilized Ash
Flue Gas
Boiler Economizer
Fly Ash
Chelate Agent
Bag Filter
4-8
Elemental
Composition
of
Combustible
Component
C 16.65 21.80 24.22
H 2.29 3.00 3.33
N 0.50 0.66 0.73
S 0.03 0.04 0.04
Cl 0.13 0.17 0.19
O 13.40 17.53 19.49
Total 33.0 43.2 48.0
4.1.3.2 Flue gas emission standards
In August 2016, the Ministry of Environment and Forestry defined a ministerial ordinance1 regarding
the flue gas emission standards. The following regulation values are set in this plant based on those
ministerial ordinances. However, guarantee value is to be discussed with Denpasar city for the project.
Table 4.2 Emission standards
Content Standard Value
O211%, 25℃1atm
Conversion Value
O212%, 0℃1atm
Dust 120 mg/Nm3 98.9 mg/Nm3
SO2 210 mg/Nm3 60.7 ppm
NOx (as NO2) 470 mg/Nm3 188.9 ppm
HCl 10 mg/Nm3 5.1 ppm
CO 625 mg/Nm3 412.6 ppm
Hg 3 mg/Nm3 2.47 mg/Nm3
HF 2 mg/Nm3 1.65 mg/Nm3
Dioxin and furans 0.1 ngTEQ/Nm3 0.08 ngTEQ/Nm3
4.1.3.3 Specifications of major facilities
Table 4.3 shows specifications of major equipment.
Table 4.3 Specifications of major equipment
Facility Content Unit Specification
Furnace Type JFE Hyper Stoker
Capacity tons/day/furnace 500
Number of line Line 2
Gas cooling facility Type Boiler
Normal Steam Pressure MPa(G) 4.8
1 PERATURAN MENTERI LINGKUNGAN HIDUP DAN KEHUTANA REPUBLIC INDONESIA
NOMOR: P.70/Menlhk/Setjen/Kum.1/8/2016 TENTANG BAKU MUTU EMISI USAHA DAN/ATAU
KEGIATAN PENGOLAHAN SAMPAH SECARA TERMAL
4-9
Facility Content Unit Specification
(Outlet of superheater)
Normal Steam Temperature
(Outlet of superheater) deg.C 420
Steam amount/furnace
(based on average LHV waste) t/h 54
Flue gas treatment
system Acid gas removal - Dry type
(Slaked lime injection)
Dioxin removal -
Dry type
(Activated carbon injection)
Dust removal - Bag filter
Nitrogen Oxide - Combustion Control
Power Generation
Type
Condensing extraction
turbine
+ Generator
Number 1
Normal Steam Pressure
(Inlet of turbine) MPa(G) 4.6
Normal Steam Temperature
(Inlet of turbine) degC 415
Exhaust pressure kPa(A) 25
Steam amount
(based on average LHV
waste)
t/h 107
Power Output
(based on average LHV waste) MW 20.0
4.1.4 Layout plan
In this investigation, the waste to energy plant is expected to be built in the space available in the
existing Suwung landfill, but no specific location has been determined for construction.
The plant block planning needs to be determined in entirety with consideration for the geological
surveying of the building site, utility facilities, vehicle traffic line operations and simplicity of operation
and maintenance. The equipment inspections in this investigation consider the general block plans focusing
on profitability and the actual block planning/engineering will be done at the detailed investigation stage
when implementing the project.
Configuration overview
(1) Waste receipt is done using the ramp way method and by reducing the waste pit excavation volume,
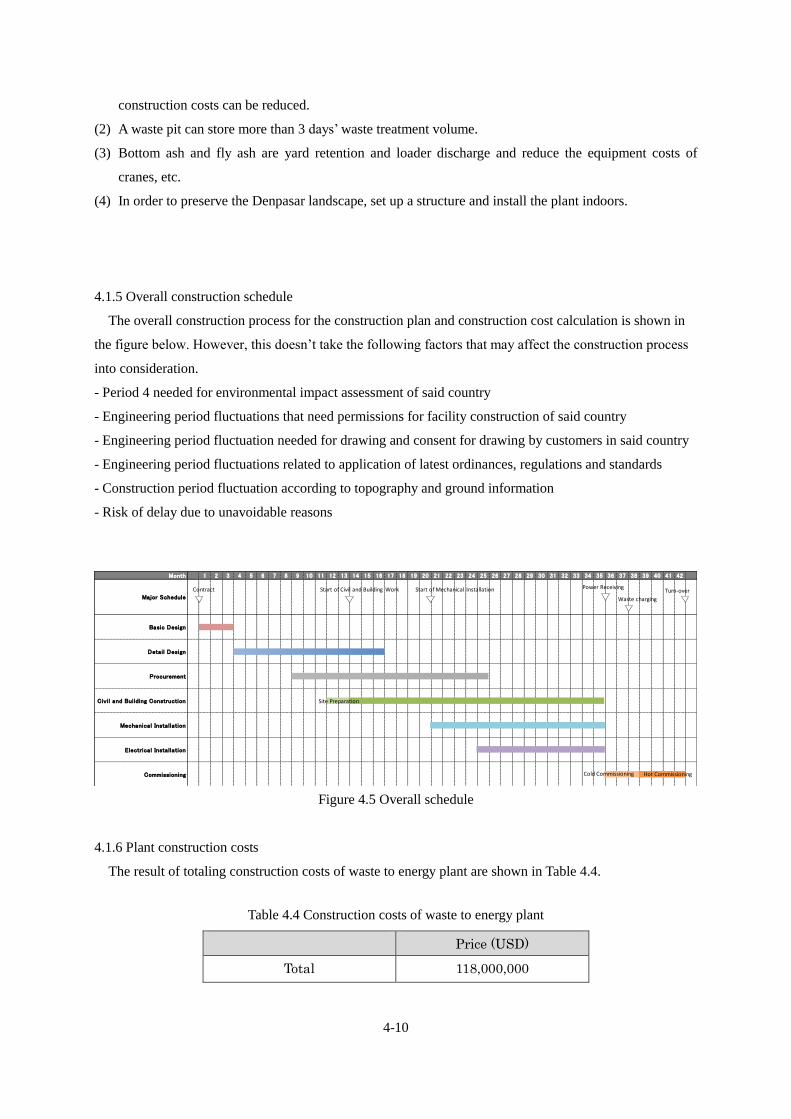
4-10
construction costs can be reduced.
(2) A waste pit can store more than 3 days’ waste treatment volume.
(3) Bottom ash and fly ash are yard retention and loader discharge and reduce the equipment costs of
cranes, etc.
(4) In order to preserve the Denpasar landscape, set up a structure and install the plant indoors.
4.1.5 Overall construction schedule
The overall construction process for the construction plan and construction cost calculation is shown in
the figure below. However, this doesn’t take the following factors that may affect the construction process
into consideration.
- Period 4 needed for environmental impact assessment of said country
- Engineering period fluctuations that need permissions for facility construction of said country
- Engineering period fluctuation needed for drawing and consent for drawing by customers in said country
- Engineering period fluctuations related to application of latest ordinances, regulations and standards
- Construction period fluctuation according to topography and ground information
- Risk of delay due to unavoidable reasons
Figure 4.5 Overall schedule
4.1.6 Plant construction costs
The result of totaling construction costs of waste to energy plant are shown in Table 4.4.
Table 4.4 Construction costs of waste to energy plant
Price (USD)
Total 118,000,000
Month 1 2 3 4 5 6 7 8 9 10 11 12 13 14 15 16 17 18 19 20 21 22 23 24 25 26 27 28 29 30 31 32 33 34 35 36 37 38 39 40 41 42
Major Schedule
Basic Design
Detail Design
Procurement
Civil and Building Construction
Mechanical Installation
Electrical Installation
Commissioning
Contract Start of Civil and Building Work Start of Mechanical Installation Power Receiving
Waste charging
Turn-over
Cold Commissioning
Site Preparation
Hot Commissioning
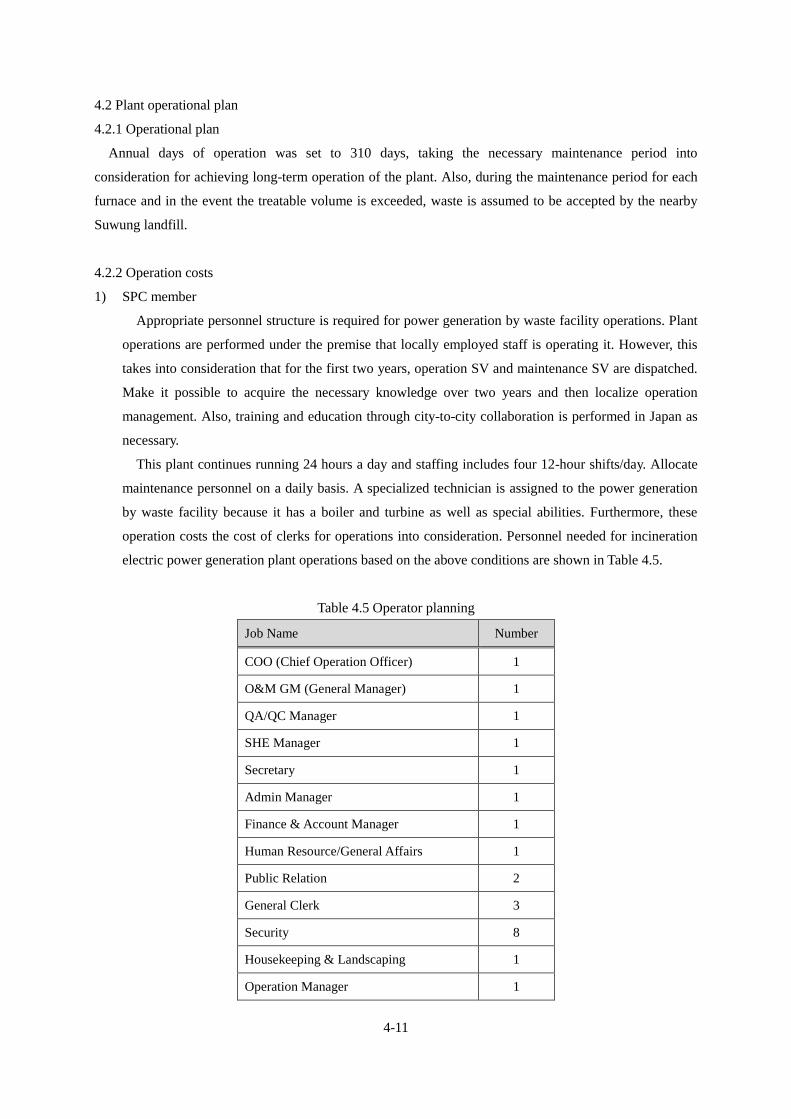
4-11
4.2 Plant operational plan
4.2.1 Operational plan
Annual days of operation was set to 310 days, taking the necessary maintenance period into
consideration for achieving long-term operation of the plant. Also, during the maintenance period for each
furnace and in the event the treatable volume is exceeded, waste is assumed to be accepted by the nearby
Suwung landfill.
4.2.2 Operation costs
1) SPC member
Appropriate personnel structure is required for power generation by waste facility operations. Plant
operations are performed under the premise that locally employed staff is operating it. However, this
takes into consideration that for the first two years, operation SV and maintenance SV are dispatched.
Make it possible to acquire the necessary knowledge over two years and then localize operation
management. Also, training and education through city-to-city collaboration is performed in Japan as
necessary.
This plant continues running 24 hours a day and staffing includes four 12-hour shifts/day. Allocate
maintenance personnel on a daily basis. A specialized technician is assigned to the power generation
by waste facility because it has a boiler and turbine as well as special abilities. Furthermore, these
operation costs the cost of clerks for operations into consideration. Personnel needed for incineration
electric power generation plant operations based on the above conditions are shown in Table 4.5.
Table 4.5 Operator planning
Job Name Number
COO (Chief Operation Officer) 1
O&M GM (General Manager) 1
QA/QC Manager 1
SHE Manager 1
Secretary 1
Admin Manager 1
Finance & Account Manager 1
Human Resource/General Affairs 1
Public Relation 2
General Clerk 3
Security 8
Housekeeping & Landscaping 1
Operation Manager 1
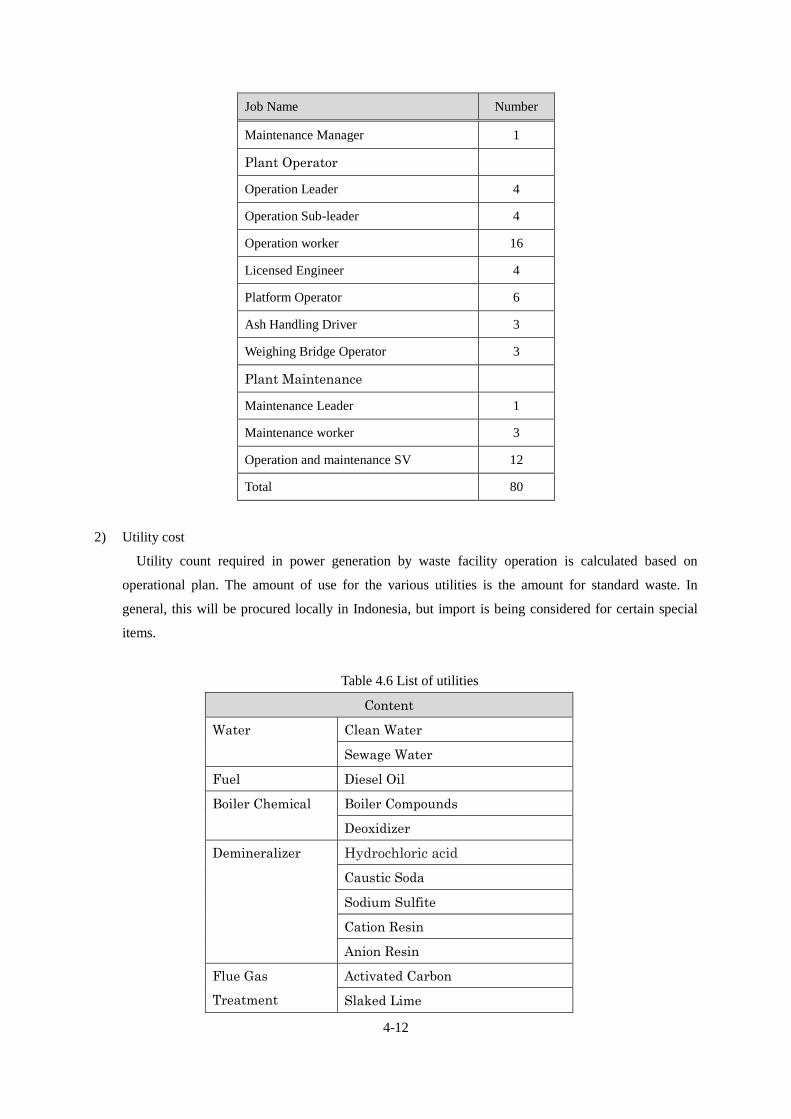
4-12
Job Name Number
Maintenance Manager 1
Plant Operator
Operation Leader 4
Operation Sub-leader 4
Operation worker 16
Licensed Engineer 4
Platform Operator 6
Ash Handling Driver 3
Weighing Bridge Operator 3
Plant Maintenance
Maintenance Leader 1
Maintenance worker 3
Operation and maintenance SV 12
Total 80
2) Utility cost
Utility count required in power generation by waste facility operation is calculated based on
operational plan. The amount of use for the various utilities is the amount for standard waste. In
general, this will be procured locally in Indonesia, but import is being considered for certain special
items.
Table 4.6 List of utilities
Content
Water Clean Water
Sewage Water
Fuel Diesel Oil
Boiler Chemical Boiler Compounds
Deoxidizer
Demineralizer Hydrochloric acid
Caustic Soda
Sodium Sulfite
Cation Resin
Anion Resin
Flue Gas
Treatment
Activated Carbon
Slaked Lime
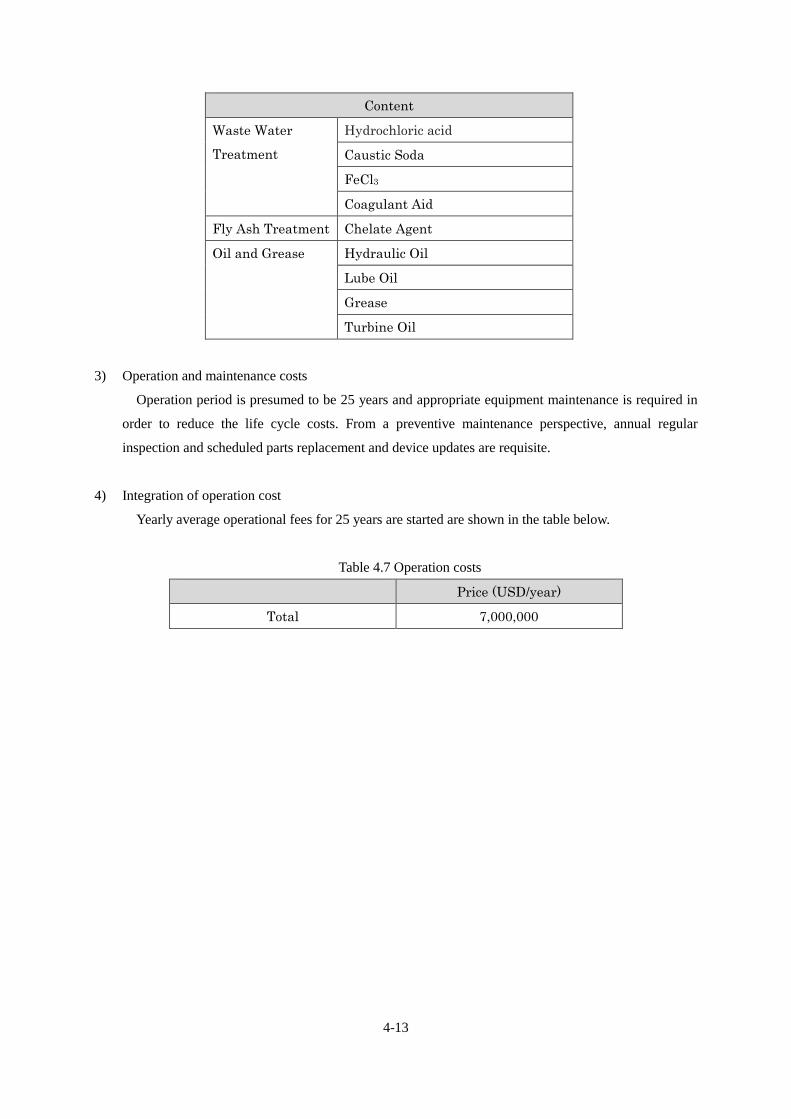
4-13
Content
Waste Water
Treatment
Hydrochloric acid
Caustic Soda
FeCl3
Coagulant Aid
Fly Ash Treatment Chelate Agent
Oil and Grease Hydraulic Oil
Lube Oil
Grease
Turbine Oil
3) Operation and maintenance costs
Operation period is presumed to be 25 years and appropriate equipment maintenance is required in
order to reduce the life cycle costs. From a preventive maintenance perspective, annual regular
inspection and scheduled parts replacement and device updates are requisite.
4) Integration of operation cost
Yearly average operational fees for 25 years are started are shown in the table below.
Table 4.7 Operation costs
Price (USD/year)
Total 7,000,000
4-14
4.2.3 Power generation plan
For electric power generation by waste incineration business, tipping fee and revenue from selling
electricity are huge pillars of revenue for ensuring feasibility and this revenue is an absolutely necessary
element for establishing the business. In this investigation, the heat recovery equipment is a
high-temperature, high-pressure boiler at 4.2 MPa and 480 degC and the power generation equipment is a
condensing extraction turbine, planning to improve heat recovery efficiency. Power revenue and
expenditure table in this business plan is laid out below.
Table 4.8 Electric power revenue and expenditure
Content Unit Value
Operation days day/year 310
Power Generation MWh 20.0
Power Self Consumption MWh 3.5
Power Selling MWh 16.5
MWh/year 122,760
5-1
Chapter 5 Stakeholders and Interested Parties
5.1 Various types of stakeholders and interested parties
This chapter organizes the stakeholders related to this examination.
5.1.1 Indonesian government central ministries and agencies
The organizational chart of the Indonesian government central ministries and agencies is shown in Figure
5.1. There are 34 central ministries and agencies in Indonesia as shown below. In Indonesia, in order to
coordinate between various ministries and agencies, various agencies are organized under higher
controlling agencies.
Figure 5.1 Organizational chart of central ministries and agencies in Indonesia
The agencies that are important in implementing power generation by waste business are described below.
1) Coordinating Ministry for Maritime Affairs
Coordination between various ministries and agencies
Management of ministries and agencies under the Coordinating Ministry for Maritime Affairs
Implementation of developing guidelines as the ministry in charge of power generation by waste
business
2) Ministry of Environment and Forestry
presidentvice president
Ministry of Finance
Ministry of Industry
Ministry of Trade
Ministry of Agriculture
Ministry of Environment and Forestry
Ministry of Manpower
Ministry of Public Works and Housing
Ministry of Land and Spatial Planning
Ministry of State Own Enterprises
Ministry of State Secretariat BAPPENAS
Ministry of National Development Planning
Ministry of Administration and Bureaucratic Reform
Ministry of Communication and Informatics
Ministry of Defence
Ministry of Education and Culture
Ministry of Foreign affairs Ministry of Health
Ministry of Law and Human Rights
Ministry of Home affairs
Ministry of Energy and Mineral Resources
Ministry of Cooperatives and Small and Middle Enterprises
Ministry of Villages, Disadvantaged Regions and Transmigration
Ministry of Research and Technology
Ministry of Social Affairs
Ministry of Religious Affairs
Ministry of Tourism
Ministry of Female Empowerment and Child Protection
Ministry of Youth and Sports Affairs
Ministry of Transportation
Ministry of Maritime Affairs and Fisheries
Coordinating Ministry for Economic AffairsCoordinating Ministry for Political, Legal,
and Security Affairs Coordinating Ministry for Maritime AffairsCoordinating Ministry of Human Development and Cultural Affairs
5-2
Policy planning, coordination and implementation of waste control (abstract side for laws, etc.)
Authority and implementation of duties for EIA
Policy planning, coordination and implementation of hazardous waste control
3) Ministry of Public Works and Housing
Policy and strategy planning for drainage and waste control (tangible side for facilities, etc.)
Facilitation of collection and disposal business (municipal solid waste)
4) Ministry of Finance
Major institution related to PPP (Public Private Partnerships)
Promotion of government assistance or government guarantee for businesses
5) BAPPENAS: Badan Perencanaan Pembangunan Nasional (National Development Planning Office)
Major institution related to PPP (Public Private Partnerships)
Compile plans and support project formation for PPP
Issue PPP BOOK
Integration of PPP plans and national development plan
Strengthen the ability of related subjects
5.1.2 Stakeholders in Bali
1.1) Overview of SARBAGITA Solid Waste Management Agency
A cleaning organization from Denpasar, Badung, Gianyar and Tabanan that manages the Suwung landfill
in Denpasar. Regional population is approximately 2,200,000. The organization will be the counterpart of
project forming in the future.
Currently, the amount of waste conveyed to the Suwung landfill is 800 to 1,000 tons per day as listed in
Chapter 2. Currently, waste in Denpasar and Badung is conveyed to the Suwung landfill. Regarding other
regions, waste is disposed in final disposal sites located in each of the regions, not the Suwung landfill and
when those sites are filled to capacity, the waste is carried to the Suwung landfill, which in combination
with the current amount of waste is expected to exceed 1,000 tons per day.
The result of the survey with the SARBAGITA union president was that it is SARBAGITA Solid Waste
Management Agency who advances waste incineration plant planning and at the SARBAGITA Solid Waste
Management Agency, approval of the representatives of each organization of SARBAGITA of each region
is required for important decisions such as forming projects.
1.2) Administrative positioning of SARBAGITA Solid Waste Management Agency
The administrative wide area unions in Japan are defined as the organizations which are established by
multiple normal local public agencies or special regions for the purpose of jointly running some of the
administrative services and are defined as special local public entities in the Local Government Act. In
Japan, the work to be done as group treatment with the establishment of special local public entities is
excluded from the authority of related local public entities and is picked up by wide area union, so we can
say that in Japan, wide area unions are public groups that hold the executive power and contractual rights of
5-3
related business for group treatment issues. In contrast, SARBAGITA Solid Waste Management Agency is
not a public group with executive rights regarding group treatment issues in Denpasar, Bali, Indonesia or
related municipals.
In other words, in the event that a concession agreement was executed for building power generation by
waste equipment at the Suwung landfill located in Denpasar and granting project rights to the private sector,
the SARBAGITA Solid Waste Management Agency cannot become a party of such a contract because it
does not fulfill the role of a Government Contract Agency as defined in Indonesia’s PPP law. The party of
the contract must be a state or municipality with legal contract function. In the future, when constructing
business schemes and seriously considering formation of a PPP project, these points must be considered
thoroughly and arrangements must be made for a party of the concession agreement.
2) Denpasar city, Bali
Suwung landfill is located in the city of Denpasar. After investigating the Denpasar Bureau of Public
Cleansing, most of the waste carried to the Suwung landfill is from Denpasar and the operation rights of the
Suwung landfill are held by the Denpasar Bureau of Public Cleansing, excluding some of the wastewater
treatment equipment, etc., and the Denpasar Bureau of Public Cleansing is deeply involved in the
operations. When planning waste incineration plant in the Suwung landfill, understanding and approval of
the top decision maker for operation of the landfill site, the mayor and the vice mayor of Denpasar, is
required. Because the offensive odor and accidental fires, etc., from the Denpasar Suwung landfill have had
a severe effect on the tourism industry and also affect the local residents directly, Denpasar has positive
intention for introduction of the intermediate treatment plant and has sufficient desire to resolve waste
treatment problems by executing a concession agreement with NOEI for landfill gas electric power
generation (including accepting waste and final treatment management) in the past. Also, as mentioned
before, the SARBAGITA Solid Waste Management Agency is not a Government Contract Agency as
stipulated by the PPP law, so they have a possible site for construction in the Suwung landfill and since the
city of Denpasar controls the majority of waste conveyed to this landfill site, there is a strong possibility
that they will be the contracted party in the power generation by waste business for Denpasar. It is likely
they will work with an SPC (Special Purpose Company) for incineration of waste at Suwung landfill as a
Government Contract Agency stipulated in Indonesia’s PPP law.
5.1.3 Stakeholders required in project formation
Through this investigation, we were able to confirm the stakeholders as mentioned above, but the main
stakeholders required in forming future projects are listed below.
(1) Local influential construction corporations
In order to complete construction without delay in the planned construction site, it is absolutely
necessary to involve local influential construction corporations with sufficient ability and experience in
Indonesia. Through this investigation, JFE Engineering Corporation contacted multiple local influential
5-4
construction corporations. Among those was Company B, the largest construction company in Indonesia,
with plenty of results in engineering, procurement, construction and commissioning (EPCC) in
petrochemistry and energy fields and sufficient financial strength, which was selected as the consortium
partner for the construction and is currently at the stage of continued detailed negotiations.
(2) Developer
In this investigation, the SARBAGITA Solid Waste Management Agency and Denpasar want a project
formulated in PPP (BOT scheme) and in the future, while continuing discussions as a PPP (BOT scheme)
project, it will become difficult to operate the business with a single corporate investment. Even from the
perspective of the foreign investor legal regulations in Indonesia, as with the BOT business in other fields
in Indonesia, equity co-investment from multiple developers is absolutely necessary and it is necessary to
establish an SPC related to waste processing and construct a system to jointly operate the business. When
selecting equity co-investors, it is also heavily involved in project financing as described in detail in
Chapter 6, so it is necessary to select developers carefully. It is absolutely necessary for the committed
investment to be fulfilled quickly and possible candidates include developers who are actually investing in
and operating incineration electric power generation IPP business such as thermal electric power generation
in Indonesia, and Japanese general trade companies who are experienced in the investment of the IPP field
and have sufficient financial strength. Currently JFE Engineering Corporation is selecting major local
companies with Japan’s General Trade Company C and developer selection negotiations are expected to
continue negotiations.
(3) Selection of financial institution
Financial arrangement is explained in detail in Chapter 6, but as project financing formulation is the most
important issue for achieving this business, project financing formulation by governmental banks like Japan
International Cooperation Agency (JICA) and Japan Bank for International Cooperation (JBIC) are
necessary and it is also necessary to organize the problems for financing problems before negotiating with
financial institutions.
6-1
Chapter 6 Project Finance Application
This chapter considers and examines financial arrangement method and accompanying problems
while taking financial scheme of Denpasar power generation by waste into consideration.
6.1 About project finance application
Project finance is a financial method that generally uses cash flow created from a project as the
source of revenue for returning loan. Therefore, unlike corporate finance, which is financing based
on a corporation’s credit, project finance is generally a non-recourse form of funding that does not
allow for claims to the developer even in the case of said project going bankrupt, or a case-limited
recourse form of funding for which the developer bears part of the risk. Also, the organization
responsible for project finance is usually SPC, and financing is performed by operating the project
itself as an independent company. An SPC is normally established to execute the target project and in
many cases the capital for it is limited. Therefore, since financial institutions may only have the
business property (operating facility) and rights of the project as the security for providing the
financing, they will examine the profitability and continuity of the target business extremely severely
(due diligence) as laid out below before starting project financing.
1) Profitability
In the event that the business of the lender becomes no longer profitable and is impossible to
return the funds, the financial institution providing the financing has a risk of irrecoverable debts
as the project finance is non-recourse financing. Therefore, the project cash flow is the most
important security for the lender and sufficient examination as to whether enough profit to
ensure repayment can be secured or not is an important element in project financing. Also, as the
project activities are performed during the validity period, close inspections as to whether
repayments can be made within the project period or not are performed.
2) Continuity
Project finance assumes project continuity during the repayment period. While more details will
be provided later, how the SPC secures going concern assumed in project continuity in
concession agreement (contract) as its duty is very important.
3) Risk
Risk assessments related to continuity is properly analyzed and BCP (Business Continuity
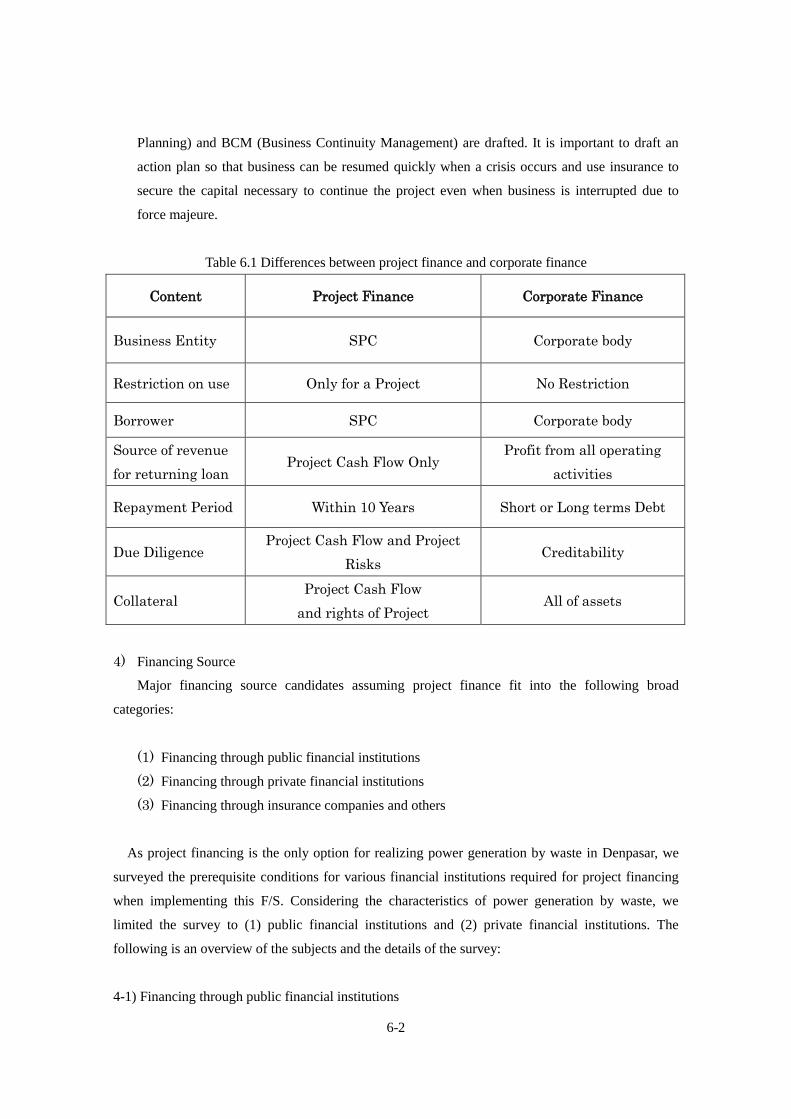
6-2
Planning) and BCM (Business Continuity Management) are drafted. It is important to draft an
action plan so that business can be resumed quickly when a crisis occurs and use insurance to
secure the capital necessary to continue the project even when business is interrupted due to
force majeure.
Table 6.1 Differences between project finance and corporate finance
Content Project Finance Corporate Finance
Business Entity SPC Corporate body
Restriction on use Only for a Project No Restriction
Borrower SPC Corporate body
Source of revenue
for returning loan Project Cash Flow Only
Profit from all operating
activities
Repayment Period Within 10 Years Short or Long terms Debt
Due Diligence Project Cash Flow and Project
Risks Creditability
Collateral Project Cash Flow
and rights of Project All of assets
4) Financing Source
Major financing source candidates assuming project finance fit into the following broad
categories:
(1) Financing through public financial institutions
(2) Financing through private financial institutions
(3) Financing through insurance companies and others
As project financing is the only option for realizing power generation by waste in Denpasar, we
surveyed the prerequisite conditions for various financial institutions required for project financing
when implementing this F/S. Considering the characteristics of power generation by waste, we
limited the survey to (1) public financial institutions and (2) private financial institutions. The
following is an overview of the subjects and the details of the survey:
4-1) Financing through public financial institutions
6-3
Major public financial institutions for the financial support in exporting infrastructure may be
JICA (Japan International Cooperation Agency), JBIC (Japan Bank for International Cooperation)
and NEXI (Nippon Export and Investment Insurance). As project formation support by a government
financial institution, the JBIC is planning a 30% increase for the next five years for Partnership for
Quality Infrastructure as referenced in the Japan Revitalization Strategy 2015 for a total of
approximately USD $110 billion in infrastructure investment in Asia. Therefore, since a policy to
establish a new system of supplying risk capital and actively invest in high-risk projects has been
announced in an attempt to strengthen JBIC function, application of public financial institutions such
as JBIC and JICA is considered absolutely necessary even in project financing for the business of
power generation by waste in Denpasar. As laid out below, we surveyed appropriateness of project
financing for the JICA Private Sector Investment Finance Division with the implementation of this
F/S.
(1) Date: October, 2016
(2) Location: JICA HQ
(3) Topic: Project finance application in Indonesia
(4) Interviewee: Private Sector Investment Finance Division
(5) Details: Necessary prerequisites and important matters for project financing
a) Credit limit risk taking is normally very difficult for municipalities in Indonesia. A
sovereign guarantee (IIGF, etc.) is necessary when a material breach (unpaid disposal
costs) related to business continuity is caused by Denpasar.
b) Business investment agreements, PPA (Power Purchase Agreement) and business
schemes are bankable contents.
c) Hazardous waste such as fly ash (B3 (see section 4.1.2.6)) is disposed of appropriately
and there are no problems in the environmental impact assessment of this project.
We came to the conclusion that if the above conditions are provided for, there is a reasonable
possibility of achieving non-recourse funding.
4-2) Financing through private financial institutions
The method of applying private financial institutions includes using Japan domestic mega banks,
regional banks, trust and banking corporations or overseas banks. Regarding private financial
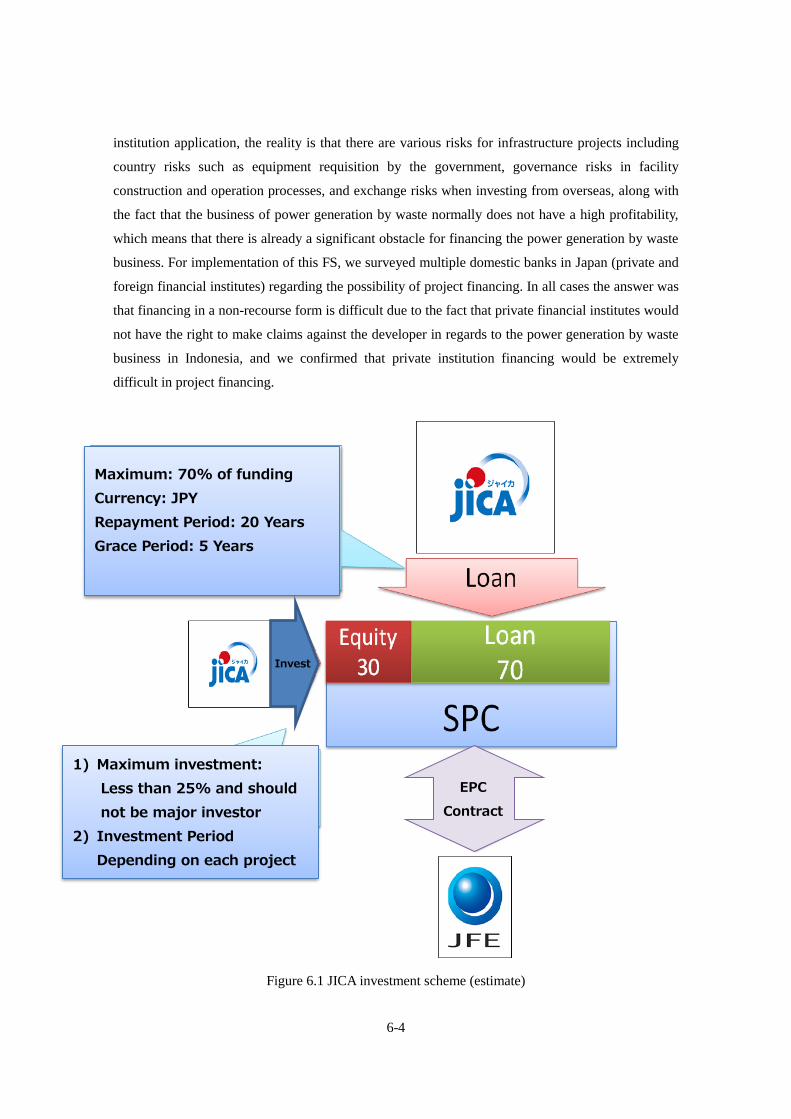
6-4
institution application, the reality is that there are various risks for infrastructure projects including
country risks such as equipment requisition by the government, governance risks in facility
construction and operation processes, and exchange risks when investing from overseas, along with
the fact that the business of power generation by waste normally does not have a high profitability,
which means that there is already a significant obstacle for financing the power generation by waste
business. For implementation of this FS, we surveyed multiple domestic banks in Japan (private and
foreign financial institutes) regarding the possibility of project financing. In all cases the answer was
that financing in a non-recourse form is difficult due to the fact that private financial institutes would
not have the right to make claims against the developer in regards to the power generation by waste
business in Indonesia, and we confirmed that private institution financing would be extremely
difficult in project financing.
Figure 6.1 JICA investment scheme (estimate)
Maximum: 70% of funding
Currency: JPY
Repayment Period: 20 Years
Grace Period: 5 Years
1) Maximum investment:
Less than 25% and should
not be major investor
2) Investment Period
Depending on each project
Invest
EPC
Contract
6-5
6.2 Advantages to project finance application
Advantages for borrower and lender in project finance application are laid out below:
1) Advantages for borrower
1.1 ) Dispersion of risk
Financing in the form of project finance, as a rule, does not put the burden of fulfillment of an
obligation (repayment) due to unprofitability of the project on the developer. Therefore, there are
many cases in which private sector business organizers may participate in projects such as the power
generation by waste project, for which corporate finance is normally not possible. Also, by breaking
up said project risks and then distributing them equally among contributors, it is possible to disperse
and reduce developer risk.
1.2 ) Reduced financial burden
When financing using the corporate finance method, there is a risk of increase in debt-equity ratio
on the balance sheet leading to decreased financial strength and obstacles occurring in new corporate
financing. However, the SPC investment corporation can have the advantage of reducing various
financial burdens by applying project finance. Also normally project finance is not calculated as a
debt on the balance sheet so there are many cases in which it is not a new financing obstacle.
2) Advantages for lender
2.1 ) High profitability
The high interest rate level of the project finance compensates for the fact that the risk-taking
element is stronger compared to corporate finance, so the lender can expect a high return.
2.2 ) Competitiveness
Financial institutions with a goal of improving international competitiveness can take advantages
of participating project financing because those that take initiative in arranging project finance in the
infrastructure sector are rated extremely highly.
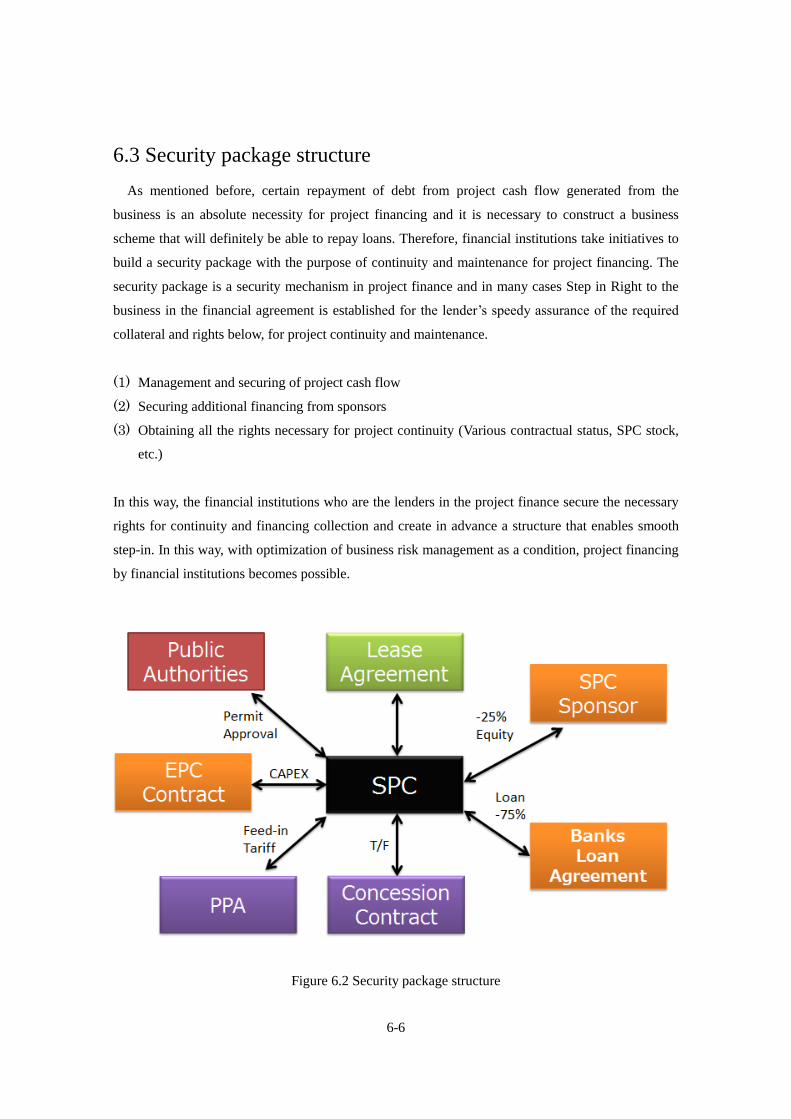
6-6
6.3 Security package structure
As mentioned before, certain repayment of debt from project cash flow generated from the
business is an absolute necessity for project financing and it is necessary to construct a business
scheme that will definitely be able to repay loans. Therefore, financial institutions take initiatives to
build a security package with the purpose of continuity and maintenance for project financing. The
security package is a security mechanism in project finance and in many cases Step in Right to the
business in the financial agreement is established for the lender’s speedy assurance of the required
collateral and rights below, for project continuity and maintenance.
(1) Management and securing of project cash flow
(2) Securing additional financing from sponsors
(3) Obtaining all the rights necessary for project continuity (Various contractual status, SPC stock,
etc.)
In this way, the financial institutions who are the lenders in the project finance secure the necessary
rights for continuity and financing collection and create in advance a structure that enables smooth
step-in. In this way, with optimization of business risk management as a condition, project financing
by financial institutions becomes possible.
Figure 6.2 Security package structure
6-7
6.4 Possibility to apply project finance
In order to realize the power generation by waste project for Denpasar, BOT commercialization in
a private finance initiative form that complies with the Indonesia PPP law is necessary, which is
described in Chapter 2, project financing is absolutely necessary for BOT commercialization. In this
section, the possibility of project financing in the Denpasar power generation by waste project is
considered.
1) Risk analysis in project financing
As described above, construction of a security package by the financial institution is absolutely
necessary in project financing and the importance of the risk and agreement to project financing is
immeasurable. In general, risk should be assigned to those who can process it the most appropriately
and a detailed awareness of risk is required for that. Therefore, first we will extract the risk items in
the power generation by waste project in Denpasar and then consider any agreements as protection
for those risks.
1.1) Risks from the project planning stages to completion/running of the project
Since the revenue and expenditure plan of the project assumes that this project will run with the
planned performance within the planned period within the planned project budget, in the event of a
delay in completion due to interruption, there will be a deep influence on the cash flow which raises
serious doubts regarding the continuity of the project. The power generation by waste business
requires starting commercial operation within the determined time frame with the determined level
of performance, just like other electric power generation/production plants. The followings are the
risk factors in completion of the project and start of commercial operation in Denpasar power
generation by waste project.
(1) Risk attributable to developer
a) Investment and credit risk
(2) Risk attributable to the project owner and off taker (power purchaser)
a) Risk related to the ability to carry out plans
b) Risk of nonfulfillment of financial obligations
(3) Risk attributable to EPC contractor
a) Project Management
b) Other issues attributable to adaptive technology
6-8
(4) Other external factors that lead to risk after project completion (country risk)
a) Risks attributable to the country and government
b) Force majeure incidents
c) Other business environment changes
(5) Facility management risk
2) Risk reduction measures
Consider the following risk reduction measures for the risks extracted in the previous paragraph
from the project planning stage to completion.
2.1) Risk attributable to developer
Consider the overview of risk attributable to the project developer and risk reduction measures as
follows:
2.1.1) Investment and credit risk
Investment risk is the risk of whether each developer will execute the funding obligation based on
the prior consent to the establishment of SPC and since preparing investment is absolutely necessary
when starting the project, it is important to reduce any risks with the investment from developers.
2.1.2) Risk reduction measures (investment and credit risk)
In order to reduce investment and credit risk, it is absolutely necessary to run a prior inspection of
the investor at the stage of selecting the developer and perform thorough due diligence of the
investing firm through an external private sector investigator such as Duns & Bradstreet or COFACE
for the (1) financial strength and (2) the project implementation system of the developer. Also, in the
event there is an unavoidable problem with the credit of the SPC developer corporation, there will
likely be cases that require building of a scheme to compensate for financial risks of the investing
corporation in ways like requesting guarantee of an financial institution (B/G = Bank Guarantee,
Stand by L/C) for the contribution performance in prior consent of SPC establishment.
2.2) Risk attributable to project owner
This section considers the overview of risks attributable to the project owner and risk reduction
measures as follows:
2.2.1) Risk related to the ability to carry out plans
6-9
Risk related to the ability to carry out plans attributable to the project owner is categorized as
follows:
(1) Risk related to the bidding process structure
(2) Risk related to bidding evaluation system structure
A basic concept in PPP projects is that in order for country/regional municipalities to provide high
quality services to the private sector at low cost, it is necessary in public purchases to somehow
procure high quality goods and services based on the basic concept of Value for Money (VFM),
which is “(regarding fixed cost) procuring items with the most value,” and it is important to secure
as much competitiveness as possible to achieve this. It is necessary to engage in bidding in order to
secure competitiveness, but in normal PPP projects, the processes described in Figure 6.3, executing
feasibility studies, selecting advisers and determining the details of the business scheme and contract,
need to be followed before bidding. Advisers and consultants are selected for financial, legal and
technical decisions, the contents of the business scheme and contract are determined, technical
specifications are set and finally the bidding conditions and contract details are considered.
Therefore, it is important to select a consultant or adviser with sufficient specialized knowledge in
the aforementioned fields and construct a bidding system. In addition, in order to form PPP projects
in Indonesia, as mentioned in Chapter 2, it is necessary to go through the process in compliance with
ordinances and a close partnership with the central ministries and agencies of Indonesia is required.
Therefore, if a municipality with no knowledge or experience starts bidding while the bidding
system is still unstructured, it is difficult to eliminate inferior and unqualified vendors with a high
possibility that the bid may end unfavorably. There are many cases of unsuccessful PPP project
bidding in Indonesia and with the power generation by waste project, a bid was made in 2014
initiated by the city of Batam for a PPP project BOT scheme of the power generation by waste
project (1,000 tons/day), but it ended poorly for multiple reasons such as insufficient considerations
for the bidding conditions, the central sovereign guarantee (IIGF) being inapplicable and site
obstacles. In the event projects are promoted without the proper bidding system structure, including
in the Denpasar power generation by waste project, there is a high possibility of unsuccessful
bidding and risk of selecting unqualified vendors.
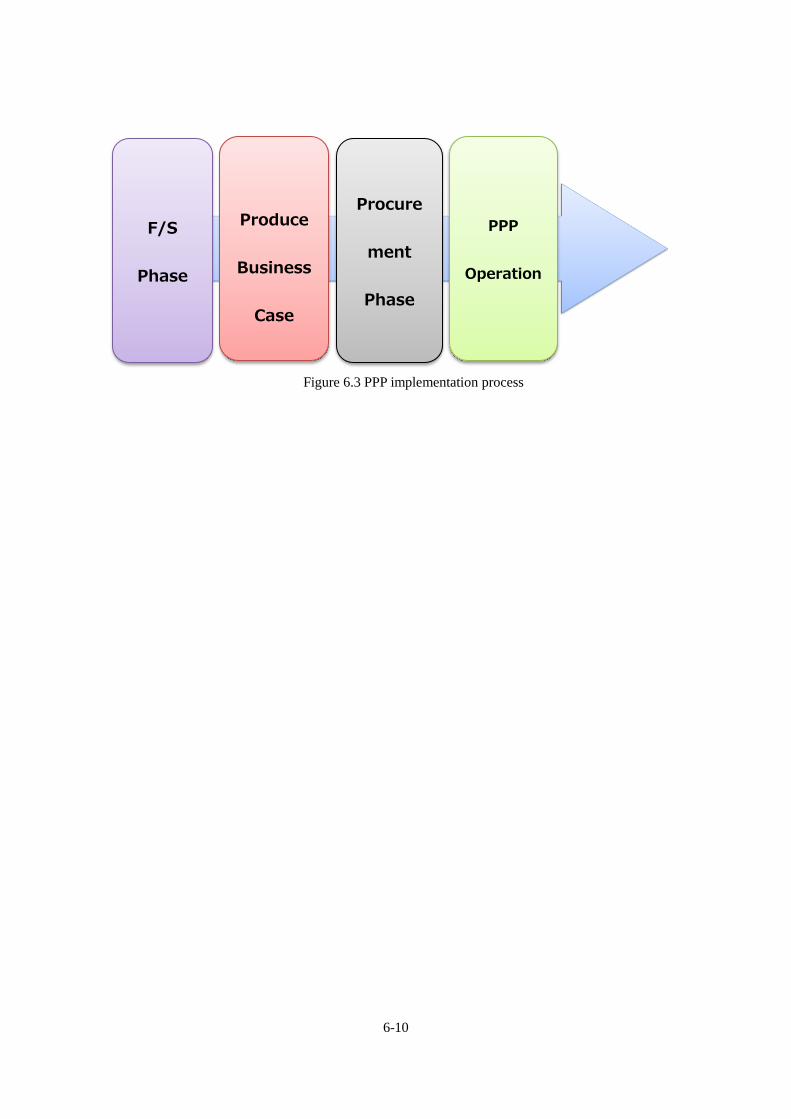
6-10
Figure 6.3 PPP implementation process
F/S
Phase
Procure
ment
Phase
Produce
Business
Case
PPP
Operation
6-11
2.2.2) Risk reduction measures (risk related to the ability to carry out plans)
In order to eliminate as much risk as possible in the bidding process structure and bidding value
system, it is important to keep in mind that it is absolutely necessary to understand the correct
bidding process in accordance with PPP law and necessary to take the following measures:
(1) External consultant application for PPP planning/bidding
Sufficient prior considerations for the process described in Chapter 2 are absolutely
necessary for formation of PPP project. Before the bid announcement, it is necessary to
implement Outline Business Case (OBC), in OBC consider the business scheme, business
range, city’s financial margin and ability to pay and clarify the total costs that Denpasar, the
project owner, will cover, such as disposal costs. If it is difficult to secure financial resources
then it is necessary to apply for supplements from the central government. Using external
consultants with years of experience in project formation in the PPP field in Indonesia such
as P.T. SMI and IFC (International Financial Corporation) would be effective as an OBC
measure or a method to proceed with PPP projects appropriately according to Indonesia law.
Therefore, it is considered necessary to propose the use of such external consultants to the
city of Denpasar in the power generation by waste project as well.
(2) Application of technical consultants
A current major matter of concern shared among the power generation by waste business
projects in Indonesia is that, while heat treatment of household general waste (MSW) is also
referenced in Presidential Decree No. 18 which is described in detail in Chapter 2,
guidelines for selection of adaptive technology are undeveloped. Currently in Denpasar,
various technologies, such as composting waste or plasma gasifying and melting furnace,
are being proposed by private corporations from around the world and many of those
proposals likely include technologies that are inappropriate or with no previous results. In
PPP projects as well, before the bidding announcement the evaluation and selection of
adaptive technology should be performed. If a prior qualification investigation and bid are
executed without proper selection of the target technology, appropriate evaluation will not
be performed and there is a risk that an incompetent technology will be selected. In order to
select competent technology, it is absolutely necessary to have technical knowledge of heat
treatment of waste, so it is necessary for Denpasar to use a technical consultant with
sufficient technical knowledge.
2.2.3) Risk of nonfulfillment of financial obligations
In Denpasar power generation by waste business, a concession agreement for the intermediate
6-12
treatment of waste using the power generation by waste plant will be concluded between Denpasar,
the project owner, and SPC. In the unlikely event that Denpasar, the project owner, causes a material
breach in the concession agreement, there is a very high possibility that this will affect SPC business
cash flow (business continuity/maintenance). The following is one example of material breach
related to SPC continuity.
(1) Interrupted and insufficient trash supply
Providing the amount of waste stipulated in the power generation by waste concession
agreement between the project owner and SPC is the responsibility of Denpasar, the project
owner. In the event of interruption of supply of waste or a situation in which the supply does
not satisfy the capacity of the plant, SPC will suffer loss of profit (electricity sale loss),
which will have a severe effect on cash flow and may hinder business continuity.
(2) Delayed or outstanding payment of disposal costs
SPC comes up with costs for plant operations through selling of electricity to a power
company and tipping fees, and that revenue is the repayment source for the financing
(project finance), so in the event disposal costs are not paid appropriately, there is a high
possibility that it will have a severe effect on cash flow and is expected to affect the business
continuity.
(3) Removal of inappropriate waste
In the event waste other than the one listed on the concession agreement is brought in,
causing breakdown or malfunction at the plant that generates additional costs and hinders
operations, there is a high possibility that it will have a severe effect on cash flow and is
expected to affect the business continuity.
2.2.4) Risk reducing measures (risk of nonfulfillment of financial obligation)
(1) Arranging risk sharing
Regarding reducing business risks resulting from the project owner, in order to stabilize
business, it is first important to extract and categorize the details of the risks in the entire
period of PFI business and share the risks appropriately between the party and the project
owner, following the PFI business principle, “the party that can manage that risk most
appropriately shall bear it”. As laid out below, implement arrangements for the risk sharing
plan when implementing Denpasar power generation by waste business using private
finance initiative business (BOT scheme).
6-13
Table 6.2 Risk sharing in waste to energy business
Phase Items Contents Risk Allocation
Owner SPC
Common
Risks
Escalation Escalation Risks for Utility, Labor,
Fuel costs ○
Increasing
interest rate Risk for Increasing interest rate ○
Change in Law
The additional costs arising from
Extension of time., Change of
specification, Suspension of project
due to change in law
○
Authority
Approval
The additional cost arising from delay
of obtaining of required authority
approval to be obtained by Owner
○
The additional cost arising from delay
of obtaining of required authority
approval to be obtained by SPC
○
Local
inhabitants Opposition by local inhabitants ○
Force Majeure The additional cost due to Force
Majeure ○ △
Construction
Phase
EIA
The cost arising from suspension of
project
as a result of EIA
○
Reconnaissance
survey
The additional cost due to inadequacy
of the survey to be carried out by SPC ○
Engineering The additional cost arising from defect
of Engineering of Plant ○
Change of
design
The additional cost due to change of
the design by the Owners convenience ○
The additional cost due to change of
the design by the SPC’s convenience ○
Extension of
time
The additional cost due to extension of
time by the Owner’s convenience ○
The additional cost due to extension of
time by the SPC’s convenience ○
6-14
Phase Items Contents Risk Allocation
Owner SPC
Delay on time
for completion
The additional cost due to delay on
time for completion by the Owner’s
default
○
The additional cost due to delay on
time for completion by the SPC’s
default
○
The additional cost due to delay on
time for completion by Force Majeure ○ △
Operation
Phase
Change of
operating
condition
The additional cost due to change of
operating condition by the Owner’s
default or convenience
○
Delay on
payment Delay on payment of T/F ○
Performance of
the Plant Failure of performance guarantee ○
Waste volume The loss arising from insufficient
volume of waste ○
Waste condition The additional cost arising from
change of contract waste condition ○
Inapplicable
waste
The additional cost arising from
inapplicable waste ○
Maintenance
The additional cost arising from
Operation and Maintenance to be
done by SPC
○
Damage from
deterioration
The additional cost arising from
deterioration ○
Third party
Liability
Third party liability arising from
Noise and Odor from plant ○
Fire accident Damage from fire accident △ △
Transfer of
Ownership
The cost of
transfer of
ownership
The cost arising from transfer of
ownership of plant after concession
period
○
6-15
Phase Items Contents Risk Allocation
Owner SPC
Repair fee The cost of repair due to transfer of
ownership △ △
Notes: Defrayer ○: Main, △: Sub
(2) Conclusion of concession agreement based on risk sharing plan
In general PFI business requires estimating all risks that may occur during the business
period and allocating such business risks according to management ability of each
stakeholder, then each stakeholder taking responsibility for managing their risks. This is
based on the idea that overall business risk costs may be reduced if “the party that can
manage that risk most appropriately shall bear it” as mentioned above. Having an SPC
bear risks that it does not have the capacity for (or that it should not be bearing) leads to
increase in business costs, resulting in hindrance to bankable project status and it is one of
the major factors that make project financing difficult. Even in Denpasar power generation
by waste concession agreement, it is necessary to appropriately share business risks and it
is absolutely necessary that the securing prerequisites and all required conditions
necessary for SPC business continuity are comprehended in the concession agreement for
project financing.
(3) Concession agreements and sovereign guarantee
In order to reduce business risk attributable to the project owner, it is important to
execute a concession agreement based on appropriate risk sharing after arranging business
risks as shown in Table 6.2 as well as to secure provisions required for SPC continuity in
the agreement. However, even if these rights are ensured in the concession agreement, if
the project owner fails to quickly fulfill liabilities due to financial credit limit problems,
difficulties in SPC business continuity are expected. Therefore it is expected to have a
massive effect on SPC business continuity such as delayed or impossible payment of
disposal costs or insufficient or impossible supply of waste. In order to reduce such risks,
in addition to ensuring rights in the agreement as mentioned above, it is absolutely
necessary to construct a scheme that the central government, which is in a higher position,
guarantees fulfillment of liabilities in the concession agreement in place of Denpasar in the
event the incidents occur. This application of the guarantee system applicable to sovereign
guarantee, which is an IIGF that can be applied in Indonesia PPP projects, as mentioned in
Chapter 2, is absolutely necessary for solid securing of SPC business continuity for project
6-16
financing.
2.3.) Risk attributable to EPC contractor
This section includes an overview of risk attributable to EPC contractors and the risk reduction
measures related to construction of the power generation by waste plant as follows:
2.3.1) Risk of delay in completion or insufficient performance
The project construction agreement is called the EPC contract and it includes engineering,
procurement of materials and construction. By building project structure into the EPC agreement, it
is possible for the developer to transfer risks related to construction to the EPC contractor. At a
power generation by waste plant, generally a single contractor takes responsibility for the entire EPC
and completes the project, passing it on to the SPC side (Taking Over) at the stage when it is
possible to start commercial production after commissioning.
Also, normally the EPC contractor is selected using the lump sum contract method in full turnkey,
which is a contract method with a total cost of EPC confirmed in construction contract, in the
electric power generation plant field. In the event construction is delayed or cannot be completed and
the issue is attributable to the contractor, it affects operations of the plant and also severely affects
the cash flow. However, contract damages in EPC due to delayed or inability of the EPC contractor
to execute construction are normally limited and loss of profit due to plant unable to run is exempt.
Also, since the limitation of liability is definitely set in the EPC agreement, in the event a risk occurs
that construction is no longer possible when building the plant, this will have a negative impact on
SPC cash flow and there is a high possibility that it will severely affect business continuity.
2.3.2) Risk reduction measures (risk of delay in completion or insufficient performance)
In order to reduce the risk of delayed construction or insufficient performance caused by the EPC
contractor, it is extremely important to select established technology and perform sufficient due
diligence regarding the target technology and most of all, to carefully examine whether the EPC
contractor has sufficient experience and results. In the power generation by waste field, which burns
MSW, the most widely used technology worldwide with the most operational results that allows
stable intermediate treatment of household refuse is the stoker system combustion furnace as
described in Chapter 3. And in Denpasar power generation by waste business as well, MSW is
expected for the waste to be processed, so it can be asserted that the optimum technology is stoker
system combustion furnace. In the past in Denpasar, NOEI installed Kompogas power generation
equipment at the Suwung landfill, but it was abolished without running even once. Also, due to the
high number of failed cases of waste processing business by inappropriate technology and
unqualified waste processing corporations throughout the world, in terms of SPC cash flow, it is
6-17
important to select an EPC contractor with appropriate technology and sufficient construction ability
and execute an EPC agreement that prevents construction costs from exceeding the initial budget
(cost overruns).
2.3.3) Construction agreement formation for Denpasar power generation by waste business
In the Denpasar power generation by waste construction agreement, the plan is to install the new
refuse treatment system independently developed by JFE Engineering, Hyper 21 Stoker System,
which achieves highly efficient/low public nuisance incineration treatment, as mentioned in Chapter
2. In the past 50 years, JFE Engineering has established about 500 power generation by waste plants
all over the world. The company’s business is well-established with highly reliable technology and
plenty of experience. Also, as mentioned in Chapter 5, JFE Engineering Corporation has constructed
a relationship with the biggest Indonesian construction corporation, Company B, to promote plant
construction work for Denpasar power generation by waste business smoothly without delay.
Company B is the largest EPC contractor in Indonesia and has a plethora of construction success in
full turnkey in Indonesia including large coal-fired power plants and petroleum refining equipment.
In addition to construction, Company B also has sufficient financial credit and is able to manage
construction investment with its own capital, which is proved in the financial statements included in
external credit bureau reports. This means that the risk of nonfulfillment of financial obligations or
bankruptcy during construction of Company B is extremely low. Also, the construction formation is
expected to be joint order acceptance in EPC consortium according to Joint and Several Liability as
described in Figure 6.4.2.
6-18
Figure 6.4 Plant construction formation estimate chart
2.4) Other, risk attributable to external factors after completion of power generation by waste plant
This section includes an overview of risk attributable to external factors after completion of the
power generation by waste plant and considers the risk reduction measures as follows:
2.4.1) Country risk
Country risk is risk related to the country where the project is implemented and in developing
countries in Southeast Asia, country risk is a large problem for SPC. Sometimes in projects in
developing countries, there is a possibility of risks that are uncontrollable by SPC and such risks can
be categorized as laid out below.
(1) Political risk
Political risk is categorized as issues due to political changes such as forced abolition of
business, requisition or nationalization, and extreme danger such as war, revolution or civil
war.
EPC
Contract
EPC
Contract
“B“
Company
6-19
(2) Economic risk
Economic risk is represented by inflation and exchange risk. There is also a risk of
worsened SPC profitability due to crashed currency rates and increased operation costs
caused by sudden inflation from unstable economic situations.
(3) Legal risk
Legal risk is a risk of worsened profitability due to changes in ordinances or accounting tax
system.
2.4.2) Risk reduction measures (country risk)
Regarding risks that cannot be controlled by SPC, as described in Appendix Table 6.4-2, when it is
difficult to secure SPC profit due to such risks, it is necessary to construct a scheme with
compensation for loss for business continuity. First, when loss is incurred due to such risks, clarify
whether the issue is covered by insurance or not and then check in advance if the risk can be covered
through Nippon Export and Investment Insurance (NEXI), a private insurance company, an
international financial company, or any other entity that handles insurance products for overseas
loans and investments. For risks that are not covered by insurance companies it is necessary to
conclude a concession agreement that allow quick compensation for losses suffered by SPC by the
project owner or central government. In addition, in the event risks that cannot be controlled by SPC
are treated as its responsibility in the concession agreement, it means that the business continuity is
questionable and it might be difficult to formulate project finance.
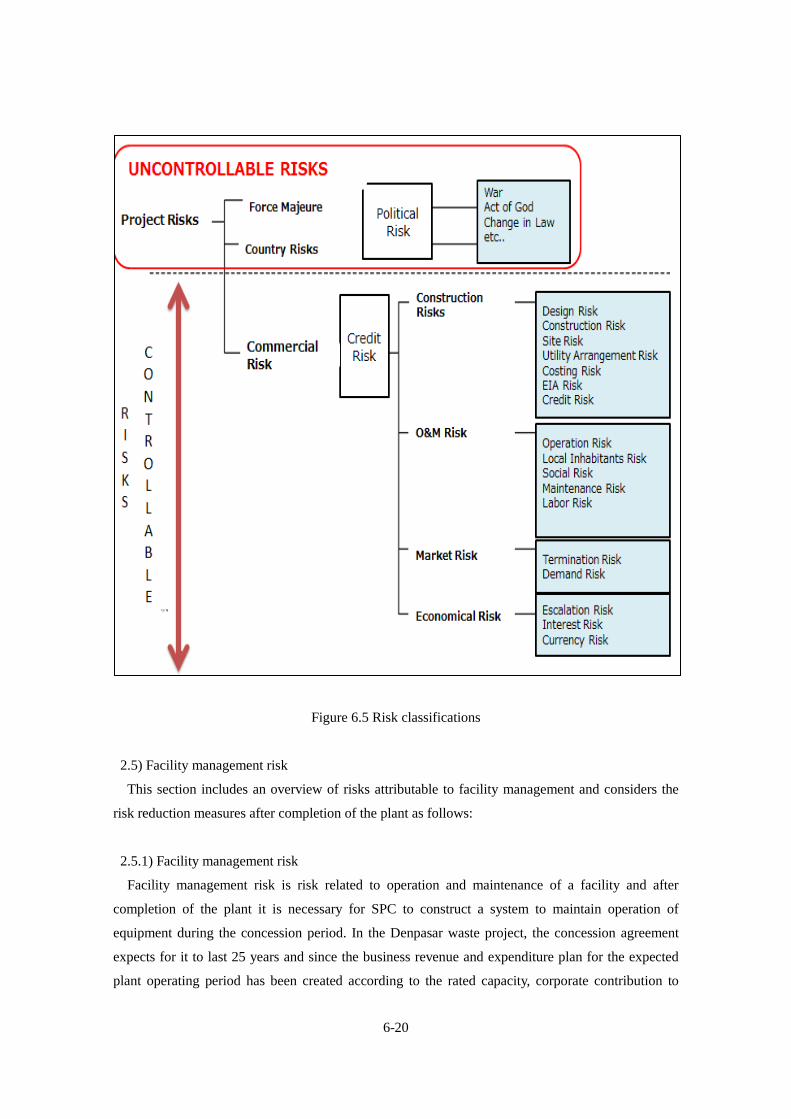
6-20
Figure 6.5 Risk classifications
2.5) Facility management risk
This section includes an overview of risks attributable to facility management and considers the
risk reduction measures after completion of the plant as follows:
2.5.1) Facility management risk
Facility management risk is risk related to operation and maintenance of a facility and after
completion of the plant it is necessary for SPC to construct a system to maintain operation of
equipment during the concession period. In the Denpasar waste project, the concession agreement
expects for it to last 25 years and since the business revenue and expenditure plan for the expected
plant operating period has been created according to the rated capacity, corporate contribution to
6-21
plant maintenance and operational technology is absolutely necessary. In developing nations, plants
are not operated and maintained appropriately after the installation so that plant equipment breaks or
has reduced lifespan, which causes a large number of problems leading bad operation ratio. There
are many cases of sudden accidental suspension of operations in power generation by waste plants as
well in developing countries. Also, while the normal lifespan for a power generation by waste plant
in Japan is 25 years or so, in Southeast Asian countries such as Malaysia and Thailand, there are
many cases that the plants experience low operation ratio or suspended operations due to
breakdowns in the plant as well as complete stop of operations due to abandoned operations by
unqualified operators, within 10 years after starting the operations; the economic loss and
environmental pollution caused by such short-term suspension of plant operations are big problems.
For the Denpasar power generation by waste project, there is a fear of significant damage to the
tourism industry after such incidents occur. The biggest cause of risks related to plant operations is
attributable to breakdowns and malfunctions of equipment caused by lack of knowledge or skill of
the plant operators in terms of operation and maintenance management. In the event such a situation
occurs, considering loss of revenue related to disposal costs and selling of electricity to a power
company due to decreased operation ratio and additional costs due to plant breakdown, there is a
high possibility that this significantly worsens SPC cash flow.
2.5.2) Risk reduction measures (facility management risk)
As the Denpasar power generation by waste business expects operations in BOT scheme, it is
extremely important to prevent reduced operation ratio and maintain operations according to the
business plan during the concession period in order to maintain cash flow of the power generation by
waste plant. In order to do that, it is absolutely necessary to construct a power generation by waste
plant operation and maintenance system. JFE Engineering is a corporation with sufficient knowledge,
technology and results in operation and maintenance of power generation by waste plants and has
achieved operation and maintenance of over 50 projects in Japan. By applying the preventive
maintenance technology of JFE Engineering, which has produced results in operation and
maintenance of many power generation by waste plants, to the power generation by waste business
in Denpasar, it will be possible to ensure reliability and extended lifespan of the plant as well as it
will be possible to estimate the remaining life of plant components with a high level of accuracy.
Therefore, it will be possible to repair and replace plant equipment and components at the
appropriate timing and prevent sudden accidents due to equipment malfunction or breakdown,
allowing the plant to operate efficiently and greatly contributing to improvement in maintenance of
SPC cash flow. Also, constructing a scheme for efficient and stable plant operation in the Denpasar
power generation by waste business, by actively considering the application of Veolia and Suez,
which are major French corporations related to water treatment and environment in Europe that have
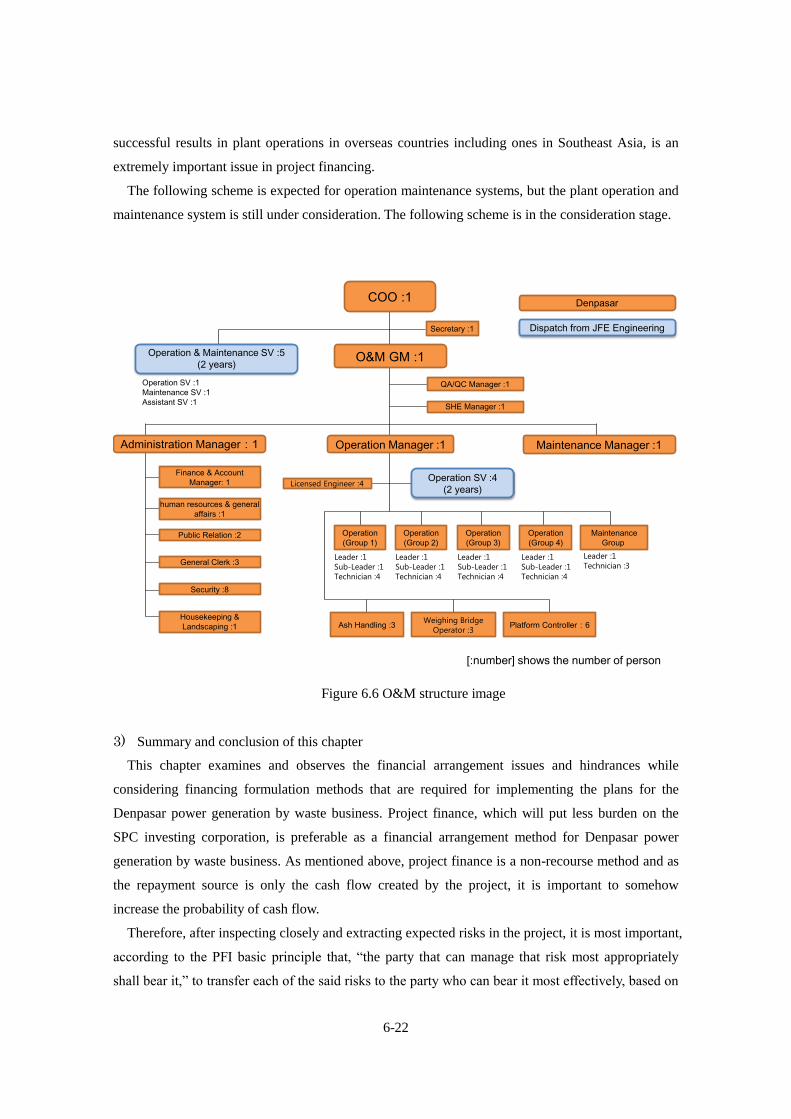
6-22
successful results in plant operations in overseas countries including ones in Southeast Asia, is an
extremely important issue in project financing.
The following scheme is expected for operation maintenance systems, but the plant operation and
maintenance system is still under consideration. The following scheme is in the consideration stage.
Figure 6.6 O&M structure image
3) Summary and conclusion of this chapter
This chapter examines and observes the financial arrangement issues and hindrances while
considering financing formulation methods that are required for implementing the plans for the
Denpasar power generation by waste business. Project finance, which will put less burden on the
SPC investing corporation, is preferable as a financial arrangement method for Denpasar power
generation by waste business. As mentioned above, project finance is a non-recourse method and as
the repayment source is only the cash flow created by the project, it is important to somehow
increase the probability of cash flow.
Therefore, after inspecting closely and extracting expected risks in the project, it is most important,
according to the PFI basic principle that, “the party that can manage that risk most appropriately
shall bear it,” to transfer each of the said risks to the party who can bear it most effectively, based on
Denpasar
Administration Manager:1
COO :1
O&M GM :1
Maintenance Manager :1
Secretary :1
Operation SV :4
(2 years)Licensed Engineer :4
Operation Manager :1
Finance & Account
Manager: 1
Public Relation :2
Housekeeping &
Landscaping :1
human resources & general
affairs :1
General Clerk :3
Security :8
Maintenance
Group
Operation
(Group 1)
Operation
(Group 2)
Operation
(Group 3)
Operation
(Group 4)
Operation SV :1
Maintenance SV :1
Assistant SV :1
QA/QC Manager :1
SHE Manager :1
Operation & Maintenance SV :5
(2 years)
Dispatch from JFE Engineering
[:number] shows the number of person
Leader :1
Technician :3Leader :1
Sub-Leader :1
Technician :4
Leader :1
Sub-Leader :1
Technician :4
Leader :1
Sub-Leader :1
Technician :4
Leader :1
Sub-Leader :1
Technician :4
Platform Controller:6Ash Handling :3Weighing Bridge
Operator :3
6-23
the appropriate risk sharing plan, in the form of a contract between the parties, who are SPC and the
project owner. Also, it is absolutely necessary to construct an agreement scheme that ensures
implementation of the most important rights in the concession agreement, required for SPC to
continue business, “Payment of tipping fees” and “Payment of electric fees at the FIT price” over the
concession period.
Therefore, it is extremely important to formulate this project as BOT business as a PPP project
based on the Indonesia PPP law, and promote formation of a joint project with Denpasar, in
accordance with the processes stipulated in the Indonesia PPP law, to apply IIGF, the sovereign
guarantee in Indonesia, to this project. Even for formulating a project with the bankable conditions
required to formulate project finance, it is required to fulfill the conditions above and it is an
important issue that must be resolved to realize this project.
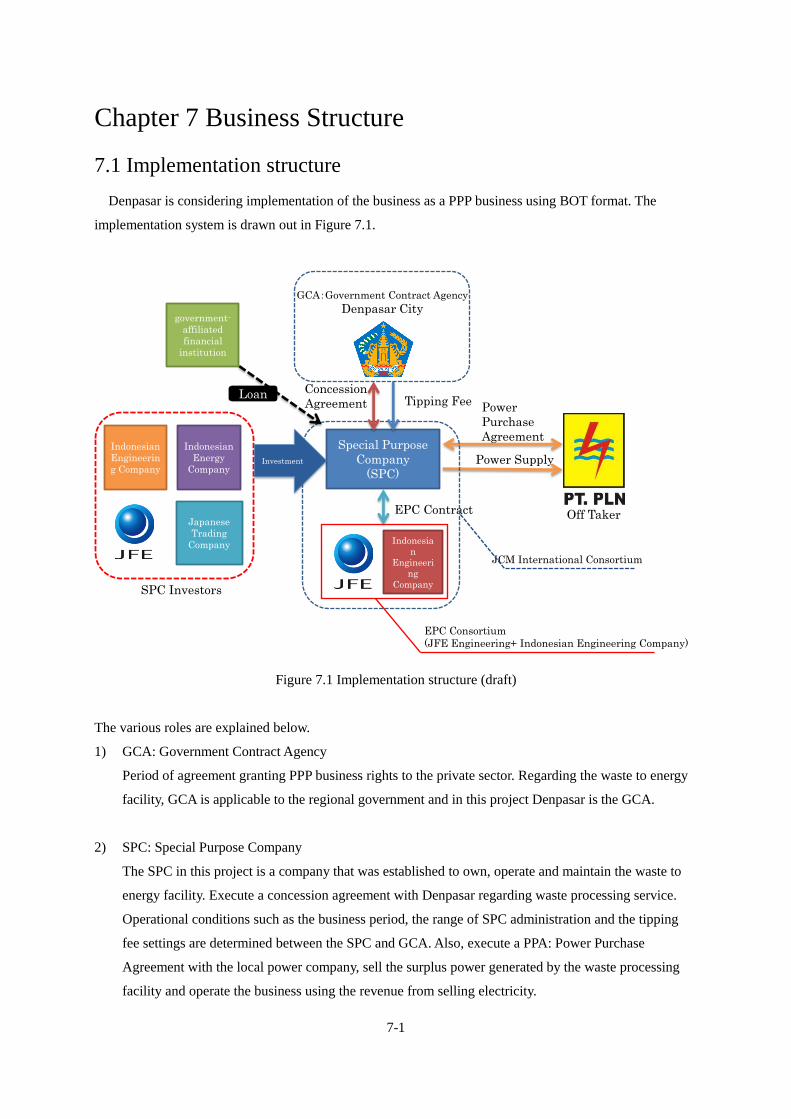
7-1
Chapter 7 Business Structure
7.1 Implementation structure
Denpasar is considering implementation of the business as a PPP business using BOT format. The
implementation system is drawn out in Figure 7.1.
Figure 7.1 Implementation structure (draft)
The various roles are explained below.
1) GCA: Government Contract Agency
Period of agreement granting PPP business rights to the private sector. Regarding the waste to energy
facility, GCA is applicable to the regional government and in this project Denpasar is the GCA.
2) SPC: Special Purpose Company
The SPC in this project is a company that was established to own, operate and maintain the waste to
energy facility. Execute a concession agreement with Denpasar regarding waste processing service.
Operational conditions such as the business period, the range of SPC administration and the tipping
fee settings are determined between the SPC and GCA. Also, execute a PPA: Power Purchase
Agreement with the local power company, sell the surplus power generated by the waste processing
facility and operate the business using the revenue from selling electricity.
Special Purpose
Company
(SPC)
Concession
Agreement Tipping Fee
Off Taker
Power Supply
Power
Purchase
Agreement
EPC Contract
EPC Consortium
(JFE Engineering+ Indonesian Engineering Company)
JCM International Consortium
Japanese
Trading
Company
Investment
SPC Investors
Loan
Indonesian
Engineerin
g Company
Indonesian
Energy
Company
government-
affiliated
financial
institution
Indonesia
n
Engineeri
ng
Company
GCA:Government Contract Agency
Denpasar City
7-2
3) EPC consortium
Waste to energy plant construction duties are ordered by SPC and for this project JFE Engineering
accepts the order. Also, create a partnership with an Indonesian major engineering company who is
well-versed in local law and construction industry and start local construction.
4) JCM international consortium
In the event a waste to energy plant construction is implemented as the project of JCM subsidy project
for equipment of plant, it is requested to form a JCM international consortium as the JCM subsidy
project for equipment of plant. The operator in Japan and the operator in said country form an
international consortium. In this case, the operator in Japan is JFE Engineering Corporation and the
operator in said country is SPC. In the JCM subsidy project for equipment of plant, there is an
obligation for plant operation for statutory service lifetime period of equipment and MRV
(Measurement, Reporting and Verification) that reports GHG reduction. GHG reduction calculations
are described in the JCM methodology in Chapter 9.
5) PT PLN
PT PLN is Indonesian national electric power company. A PPA is concluded between SPC and PT
PLN and electric power is purchased and sold. The electric power pricing is as described in Chapter 2,
section 2.4.2.
6) SPC developer
The following four companies are assumed as developers for the SPC.
(1) Major Japanese trading house
A major Japanese trading house with a lot of experience in PPP and EPC businesses overseas.
They are cooperating partners in this business interested in waste to energy business in Indonesia.
(2) Major Indonesian engineering company
A major Indonesian engineering company which has a business relationship with JFE
Engineering. It is extremely interested in waste to energy business in Indonesia and is showing
intention to invest.
(3) Major Indonesian energy company
A major Indonesian energy company showing intention to participate in waste to energy project
in Indonesia with intent to invest.
(4) JFE Engineering
In order to run business without delay, participation of a corporation with business know-how is
desired. JFE Engineering not only builds plants, but also has experience in operating and
maintaining plants. That know-how seems to play a role in SPC operation and it is considering
investment.
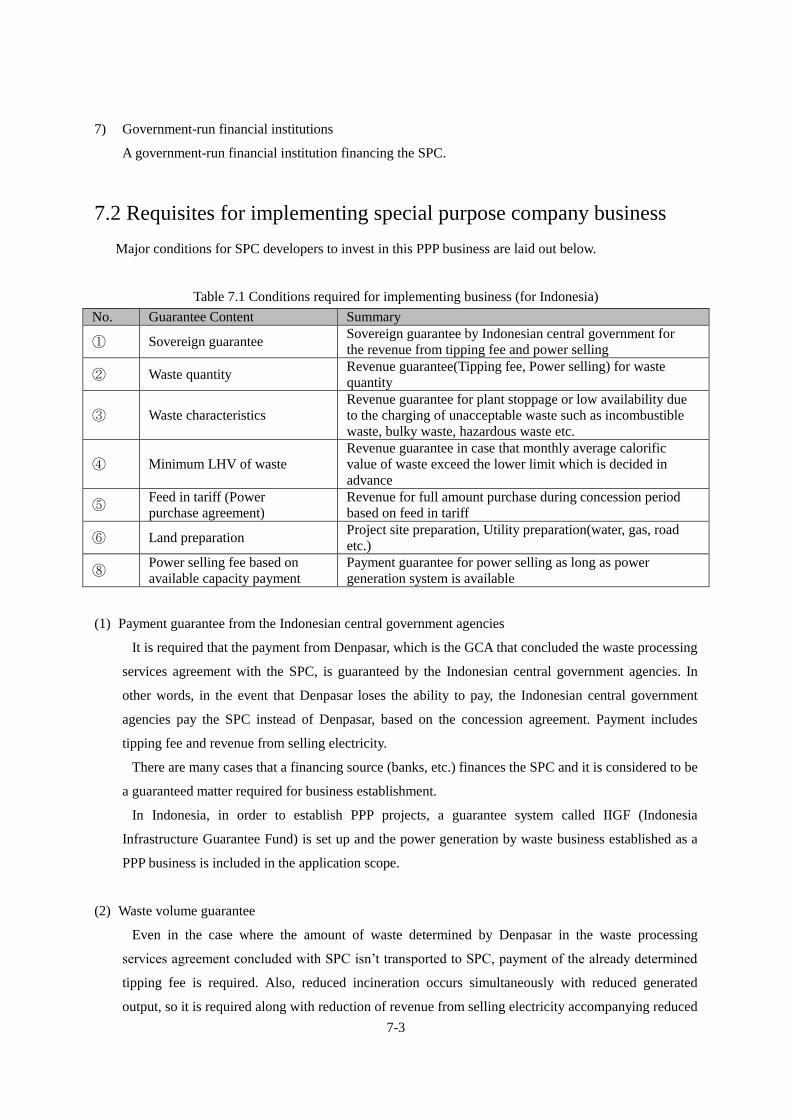
7-3
7) Government-run financial institutions
A government-run financial institution financing the SPC.
7.2 Requisites for implementing special purpose company business
Major conditions for SPC developers to invest in this PPP business are laid out below.
Table 7.1 Conditions required for implementing business (for Indonesia)
No. Guarantee Content Summary
① Sovereign guarantee Sovereign guarantee by Indonesian central government for
the revenue from tipping fee and power selling
② Waste quantity Revenue guarantee(Tipping fee, Power selling) for waste
quantity
③ Waste characteristics
Revenue guarantee for plant stoppage or low availability due
to the charging of unacceptable waste such as incombustible
waste, bulky waste, hazardous waste etc.
④ Minimum LHV of waste
Revenue guarantee in case that monthly average calorific
value of waste exceed the lower limit which is decided in
advance
⑤ Feed in tariff (Power
purchase agreement)
Revenue for full amount purchase during concession period
based on feed in tariff
⑥ Land preparation Project site preparation, Utility preparation(water, gas, road
etc.)
⑧ Power selling fee based on
available capacity payment
Payment guarantee for power selling as long as power
generation system is available
(1) Payment guarantee from the Indonesian central government agencies
It is required that the payment from Denpasar, which is the GCA that concluded the waste processing
services agreement with the SPC, is guaranteed by the Indonesian central government agencies. In
other words, in the event that Denpasar loses the ability to pay, the Indonesian central government
agencies pay the SPC instead of Denpasar, based on the concession agreement. Payment includes
tipping fee and revenue from selling electricity.
There are many cases that a financing source (banks, etc.) finances the SPC and it is considered to be
a guaranteed matter required for business establishment.
In Indonesia, in order to establish PPP projects, a guarantee system called IIGF (Indonesia
Infrastructure Guarantee Fund) is set up and the power generation by waste business established as a
PPP business is included in the application scope.
(2) Waste volume guarantee
Even in the case where the amount of waste determined by Denpasar in the waste processing
services agreement concluded with SPC isn’t transported to SPC, payment of the already determined
tipping fee is required. Also, reduced incineration occurs simultaneously with reduced generated
output, so it is required along with reduction of revenue from selling electricity accompanying reduced
7-4
waste.
Since SPC revenue depends on tipping fee and revenue from selling electricity, this is an absolutely
necessary guarantee for continuing business.
(3) Waste quality guarantee
Defines waste that cannot be conveyed in the concession agreement. Representative examples of
waste that cannot be conveyed would be waste that is larger than a certain size or dangerous goods.
Guarantee for facility operation suspension occurring from this kind of conveyance of waste that
cannot be conveyed and reduced revenue due to lowered operation ratio is required.
(4) Minimum guaranteed calorific value of conveyed waste
The calorific value of waste mostly depends on the generated output so it is an extremely important
factor. A guarantee is required for reduced revenue from selling electricity in the event that the
monthly (or determined period) average of waste calorific value calculated in waste to energy plant
drops below the minimum calorific value determined in advance. This guarantee request is an
absolutely necessary guarantee for continuing business.
(5) Application of feed-in tariff of electric power
It is just as described in Chapter 2, section 2.4.2, but there is a purchase guarantee for the entire
amount of electric power throughout the entire business period based on application of the feed-in
tariff of electric power.
(6) Ensured project site
Provision of ensured project site and basic infrastructure preparations (water supply and sewage
systems, gas, electric power, roads, etc.) are required. Since the Denpasar bureau of public cleansing is
managing appropriately at the Suwung landfill, which is the current planned construction site, there
are no apparent illegal aliens working as waste pickers, but in case of opposition, Denpasar will be
required to withdraw. For basic integrated network infrastructure, connection point, scope of
construction as well as transmission line need to be considered in future investigations.
(7) Payment of fees from selling electricity to a power company based on available capacity payment
Fees from selling electricity to a power company payments must be made as long as the power
generation equipment capacity can be operated. In other words, guarantee for revenue from selling
electricity for the entire capacity of the power generation equipment that can be operated is required as
long as the waste to energy plant can transmit power, then even if it is due to the electric power
company and power cannot be transmitted.
The above contents must be negotiated between GCA and SPC and it is necessary for both parties to

7-5
consent as appropriate risk allocation. For the SPC developer, risk of unrecognized required matters is
evaluated quantitatively and reflected as the cost of business, so in order to ensure appropriate profitability,
a higher tipping fee or selling price is required. Appropriate risk allotment leads to smooth business
operation at appropriate costs.
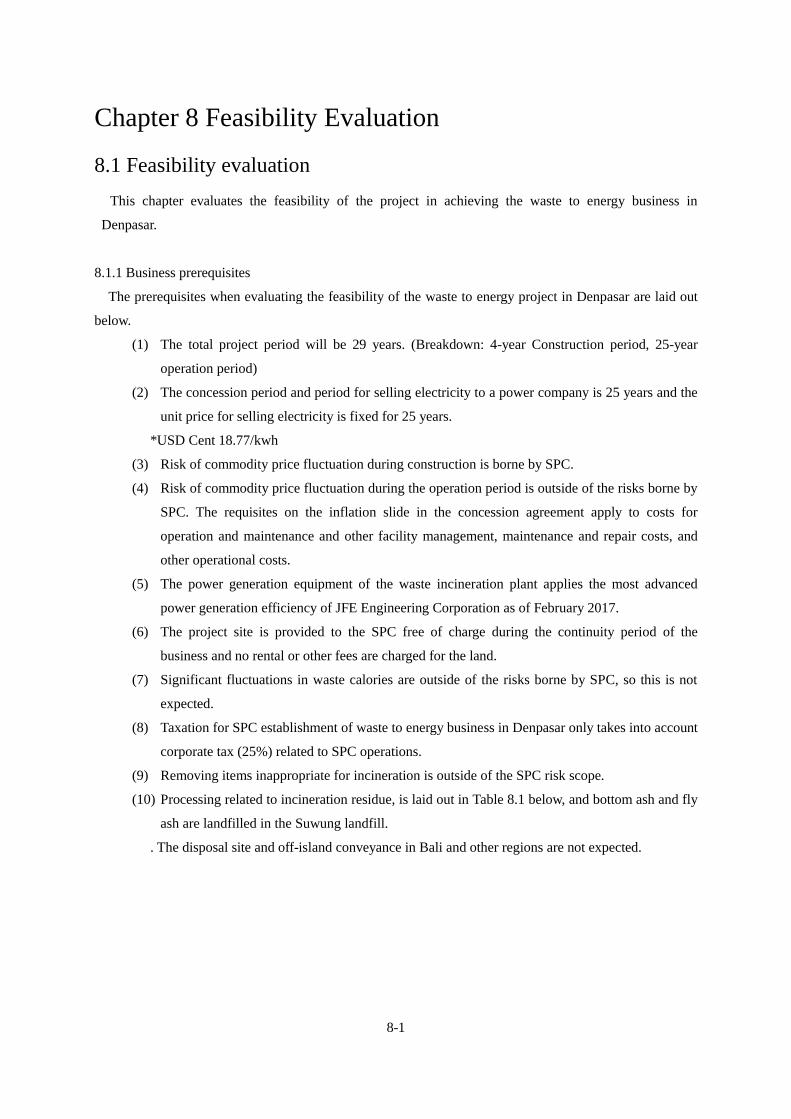
8-1
Chapter 8 Feasibility Evaluation
8.1 Feasibility evaluation
This chapter evaluates the feasibility of the project in achieving the waste to energy business in
Denpasar.
8.1.1 Business prerequisites
The prerequisites when evaluating the feasibility of the waste to energy project in Denpasar are laid out
below.
(1) The total project period will be 29 years. (Breakdown: 4-year Construction period, 25-year
operation period)
(2) The concession period and period for selling electricity to a power company is 25 years and the
unit price for selling electricity is fixed for 25 years.
*USD Cent 18.77/kwh
(3) Risk of commodity price fluctuation during construction is borne by SPC.
(4) Risk of commodity price fluctuation during the operation period is outside of the risks borne by
SPC. The requisites on the inflation slide in the concession agreement apply to costs for
operation and maintenance and other facility management, maintenance and repair costs, and
other operational costs.
(5) The power generation equipment of the waste incineration plant applies the most advanced
power generation efficiency of JFE Engineering Corporation as of February 2017.
(6) The project site is provided to the SPC free of charge during the continuity period of the
business and no rental or other fees are charged for the land.
(7) Significant fluctuations in waste calories are outside of the risks borne by SPC, so this is not
expected.
(8) Taxation for SPC establishment of waste to energy business in Denpasar only takes into account
corporate tax (25%) related to SPC operations.
(9) Removing items inappropriate for incineration is outside of the SPC risk scope.
(10) Processing related to incineration residue, is laid out in Table 8.1 below, and bottom ash and fly
ash are landfilled in the Suwung landfill.
. The disposal site and off-island conveyance in Bali and other regions are not expected.
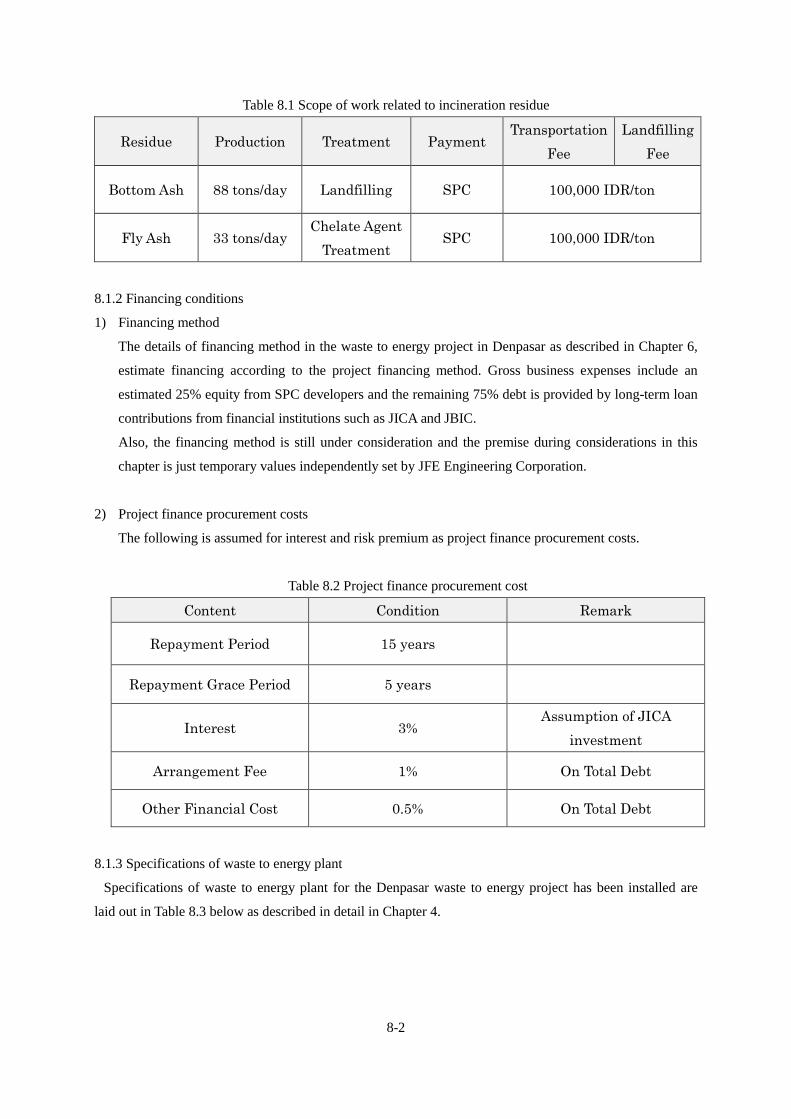
8-2
Table 8.1 Scope of work related to incineration residue
Residue Production Treatment Payment Transportation
Fee
Landfilling
Fee
Bottom Ash 88 tons/day Landfilling SPC 100,000 IDR/ton
Fly Ash 33 tons/day Chelate Agent
Treatment SPC 100,000 IDR/ton
8.1.2 Financing conditions
1) Financing method
The details of financing method in the waste to energy project in Denpasar as described in Chapter 6,
estimate financing according to the project financing method. Gross business expenses include an
estimated 25% equity from SPC developers and the remaining 75% debt is provided by long-term loan
contributions from financial institutions such as JICA and JBIC.
Also, the financing method is still under consideration and the premise during considerations in this
chapter is just temporary values independently set by JFE Engineering Corporation.
2) Project finance procurement costs
The following is assumed for interest and risk premium as project finance procurement costs.
Table 8.2 Project finance procurement cost
Content Condition Remark
Repayment Period 15 years
Repayment Grace Period 5 years
Interest 3% Assumption of JICA
investment
Arrangement Fee 1% On Total Debt
Other Financial Cost 0.5% On Total Debt
8.1.3 Specifications of waste to energy plant
Specifications of waste to energy plant for the Denpasar waste to energy project has been installed are
laid out in Table 8.3 below as described in detail in Chapter 4.
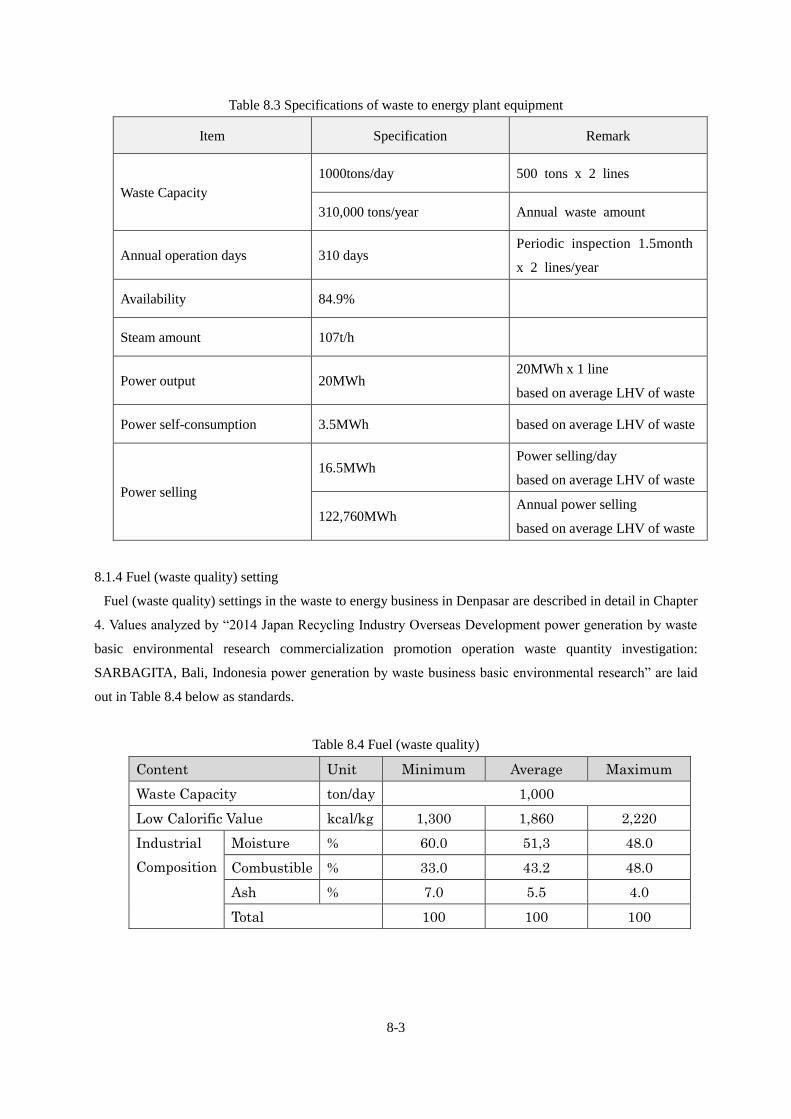
8-3
Table 8.3 Specifications of waste to energy plant equipment
Item Specification Remark
Waste Capacity
1000tons/day 500 tons x 2 lines
310,000 tons/year Annual waste amount
Annual operation days 310 days Periodic inspection 1.5month
x 2 lines/year
Availability 84.9%
Steam amount 107t/h
Power output 20MWh 20MWh x 1 line
based on average LHV of waste
Power self-consumption 3.5MWh based on average LHV of waste
Power selling
16.5MWh Power selling/day
based on average LHV of waste
122,760MWh Annual power selling
based on average LHV of waste
8.1.4 Fuel (waste quality) setting
Fuel (waste quality) settings in the waste to energy business in Denpasar are described in detail in Chapter
4. Values analyzed by “2014 Japan Recycling Industry Overseas Development power generation by waste
basic environmental research commercialization promotion operation waste quantity investigation:
SARBAGITA, Bali, Indonesia power generation by waste business basic environmental research” are laid
out in Table 8.4 below as standards.
Table 8.4 Fuel (waste quality)
Content Unit Minimum Average Maximum
Waste Capacity ton/day 1,000
Low Calorific Value kcal/kg 1,300 1,860 2,220
Industrial
Composition
Moisture % 60.0 51,3 48.0
Combustible % 33.0 43.2 48.0
Ash % 7.0 5.5 4.0
Total 100 100 100
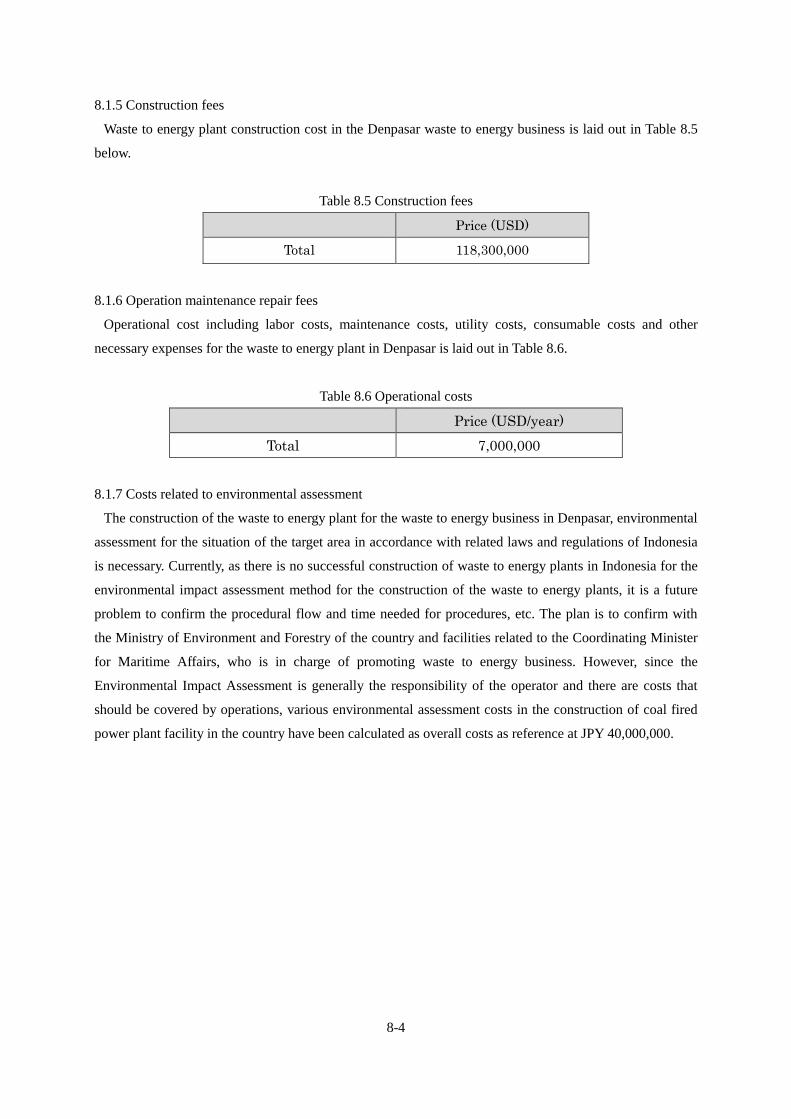
8-4
8.1.5 Construction fees
Waste to energy plant construction cost in the Denpasar waste to energy business is laid out in Table 8.5
below.
Table 8.5 Construction fees
Price (USD)
Total 118,300,000
8.1.6 Operation maintenance repair fees
Operational cost including labor costs, maintenance costs, utility costs, consumable costs and other
necessary expenses for the waste to energy plant in Denpasar is laid out in Table 8.6.
Table 8.6 Operational costs
Price (USD/year)
Total 7,000,000
8.1.7 Costs related to environmental assessment
The construction of the waste to energy plant for the waste to energy business in Denpasar, environmental
assessment for the situation of the target area in accordance with related laws and regulations of Indonesia
is necessary. Currently, as there is no successful construction of waste to energy plants in Indonesia for the
environmental impact assessment method for the construction of the waste to energy plants, it is a future
problem to confirm the procedural flow and time needed for procedures, etc. The plan is to confirm with
the Ministry of Environment and Forestry of the country and facilities related to the Coordinating Minister
for Maritime Affairs, who is in charge of promoting waste to energy business. However, since the
Environmental Impact Assessment is generally the responsibility of the operator and there are costs that
should be covered by operations, various environmental assessment costs in the construction of coal fired
power plant facility in the country have been calculated as overall costs as reference at JPY 40,000,000.
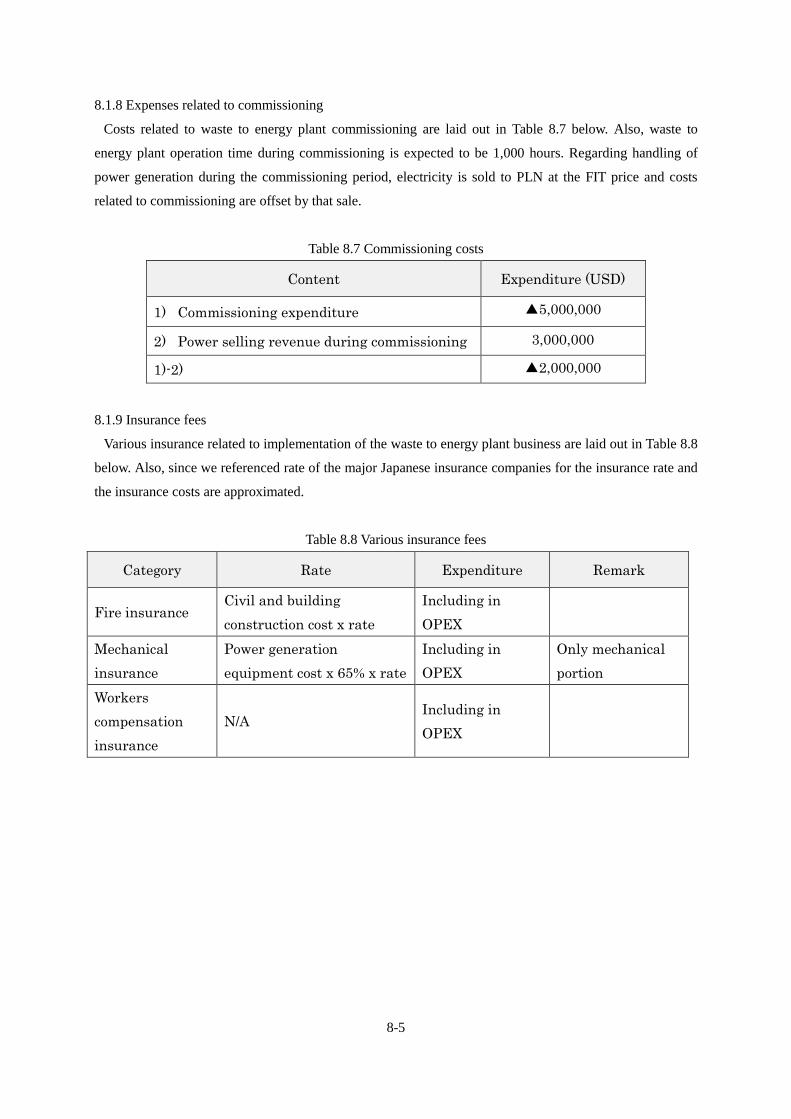
8-5
8.1.8 Expenses related to commissioning
Costs related to waste to energy plant commissioning are laid out in Table 8.7 below. Also, waste to
energy plant operation time during commissioning is expected to be 1,000 hours. Regarding handling of
power generation during the commissioning period, electricity is sold to PLN at the FIT price and costs
related to commissioning are offset by that sale.
Table 8.7 Commissioning costs
Content Expenditure (USD)
1) Commissioning expenditure ▲5,000,000
2) Power selling revenue during commissioning 3,000,000
1)-2) ▲2,000,000
8.1.9 Insurance fees
Various insurance related to implementation of the waste to energy plant business are laid out in Table 8.8
below. Also, since we referenced rate of the major Japanese insurance companies for the insurance rate and
the insurance costs are approximated.
Table 8.8 Various insurance fees
Category Rate Expenditure Remark
Fire insurance Civil and building
construction cost x rate
Including in
OPEX
Mechanical
insurance
Power generation
equipment cost x 65% x rate
Including in
OPEX
Only mechanical
portion
Workers
compensation
insurance
N/A Including in
OPEX
8-6
8.1.10 Public charges
Regarding taxes related to waste to energy plant business, only the taxes listed in Table 8.9 below are
taken into consideration and business tax, fixed property tax or other taxes are not taken into consideration
in this F/S. Close investigation of tax matter costs is one of the matters under consideration going forward.
Table 8.9 Corporate tax
Category Rate Expenditure
Corporate tax 25% N/A
8.2 Profitability evaluation
8.2.1 Prerequisites for profitability evaluation
Important prerequisites for profitability evaluation described in the previous paragraph are as shown in
Table 8.10.
Table 8.10 Prerequisites for profitability evaluation
Content Condition Remark
Concession period 25 years
Owned capital 25%
Borrowed capital 75%
Financing method Project finance
Repayment period 15 years Grace period : 5 years
Repayment method Level-line repayment
Borrowing rate 3%
Interest rate N/A Deposit interest rate for
retained earnings
Corporate tax 30%
Escalation N/A
Land rental fee N/A
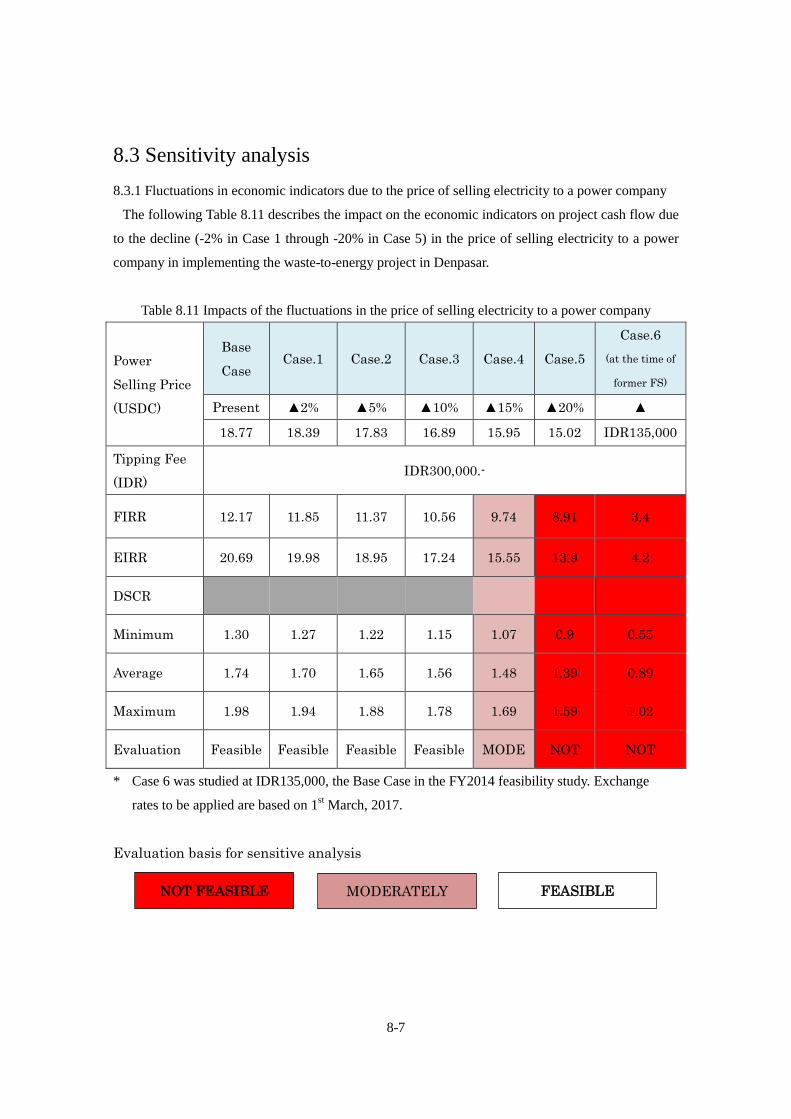
8-7
8.3 Sensitivity analysis
8.3.1 Fluctuations in economic indicators due to the price of selling electricity to a power company
The following Table 8.11 describes the impact on the economic indicators on project cash flow due
to the decline (-2% in Case 1 through -20% in Case 5) in the price of selling electricity to a power
company in implementing the waste-to-energy project in Denpasar.
Table 8.11 Impacts of the fluctuations in the price of selling electricity to a power company
Power
Selling Price
(USDC)
Base
Case Case.1 Case.2 Case.3 Case.4 Case.5
Case.6
(at the time of
former FS)
Present ▲2% ▲5% ▲10% ▲15% ▲20% ▲
18.77 18.39 17.83 16.89 15.95 15.02 IDR135,000
Tipping Fee
(IDR) IDR300,000.-
FIRR 12.17 11.85 11.37 10.56 9.74 8.91 3.4
EIRR 20.69 19.98 18.95 17.24 15.55 13.9 4.2
DSCR
Minimum 1.30 1.27 1.22 1.15 1.07 0.9 0.55
Average 1.74 1.70 1.65 1.56 1.48 1.39 0.89
Maximum 1.98 1.94 1.88 1.78 1.69 1.59 1.02
Evaluation Feasible Feasible Feasible Feasible MODE NOT NOT
* Case 6 was studied at IDR135,000, the Base Case in the FY2014 feasibility study. Exchange
rates to be applied are based on 1st March, 2017.
Evaluation basis for sensitive analysis
NOT FEASIBLE MODERATELY FEASIBLE
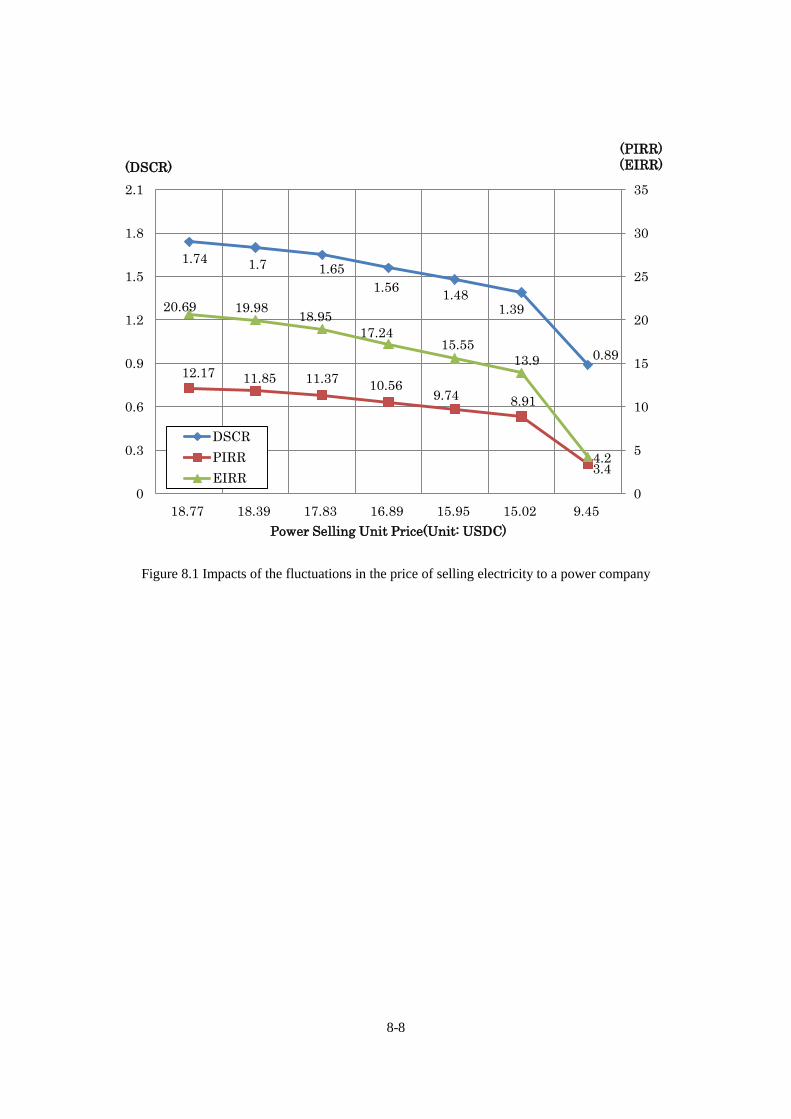
8-8
Figure 8.1 Impacts of the fluctuations in the price of selling electricity to a power company
1.74 1.7 1.65
1.56 1.48
1.39
0.89
12.17 11.85 11.37 10.56
9.74 8.91
3.4
20.69 19.98 18.95
17.24 15.55
13.9
4.2
0
5
10
15
20
25
30
35
0
0.3
0.6
0.9
1.2
1.5
1.8
2.1
18.77 18.39 17.83 16.89 15.95 15.02 9.45
(PIRR)
(EIRR) (DSCR)
Power Selling Unit Price(Unit: USDC)
DSCR
PIRR
EIRR
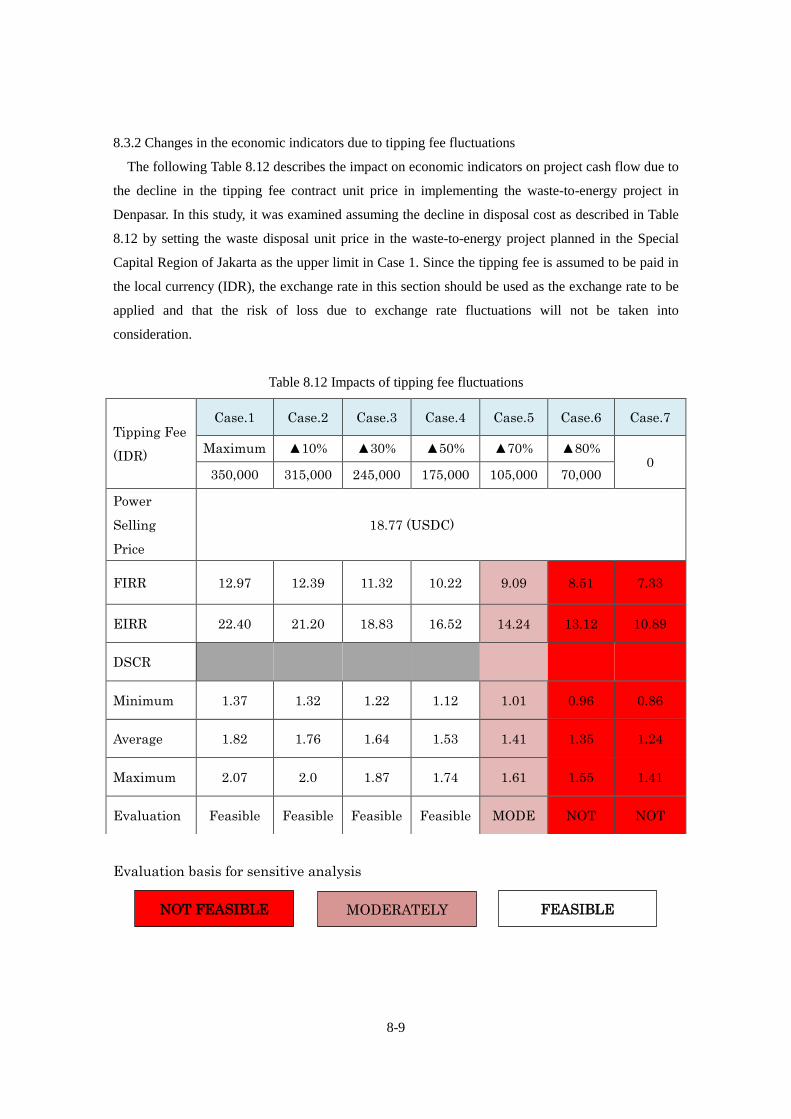
8-9
8.3.2 Changes in the economic indicators due to tipping fee fluctuations
The following Table 8.12 describes the impact on economic indicators on project cash flow due to
the decline in the tipping fee contract unit price in implementing the waste-to-energy project in
Denpasar. In this study, it was examined assuming the decline in disposal cost as described in Table
8.12 by setting the waste disposal unit price in the waste-to-energy project planned in the Special
Capital Region of Jakarta as the upper limit in Case 1. Since the tipping fee is assumed to be paid in
the local currency (IDR), the exchange rate in this section should be used as the exchange rate to be
applied and that the risk of loss due to exchange rate fluctuations will not be taken into
consideration.
Table 8.12 Impacts of tipping fee fluctuations
Evaluation basis for sensitive analysis
Tipping Fee
(IDR)
Case.1 Case.2 Case.3 Case.4 Case.5 Case.6 Case.7
Maximum ▲10% ▲30% ▲50% ▲70% ▲80% 0
350,000 315,000 245,000 175,000 105,000 70,000
Power
Selling
Price
18.77 (USDC)
FIRR 12.97 12.39 11.32 10.22 9.09 8.51 7.33
EIRR 22.40 21.20 18.83 16.52 14.24 13.12 10.89
DSCR
Minimum 1.37 1.32 1.22 1.12 1.01 0.96 0.86
Average 1.82 1.76 1.64 1.53 1.41 1.35 1.24
Maximum 2.07 2.0 1.87 1.74 1.61 1.55 1.41
Evaluation Feasible Feasible Feasible Feasible MODE NOT NOT
NOT FEASIBLE MODERATELY FEASIBLE
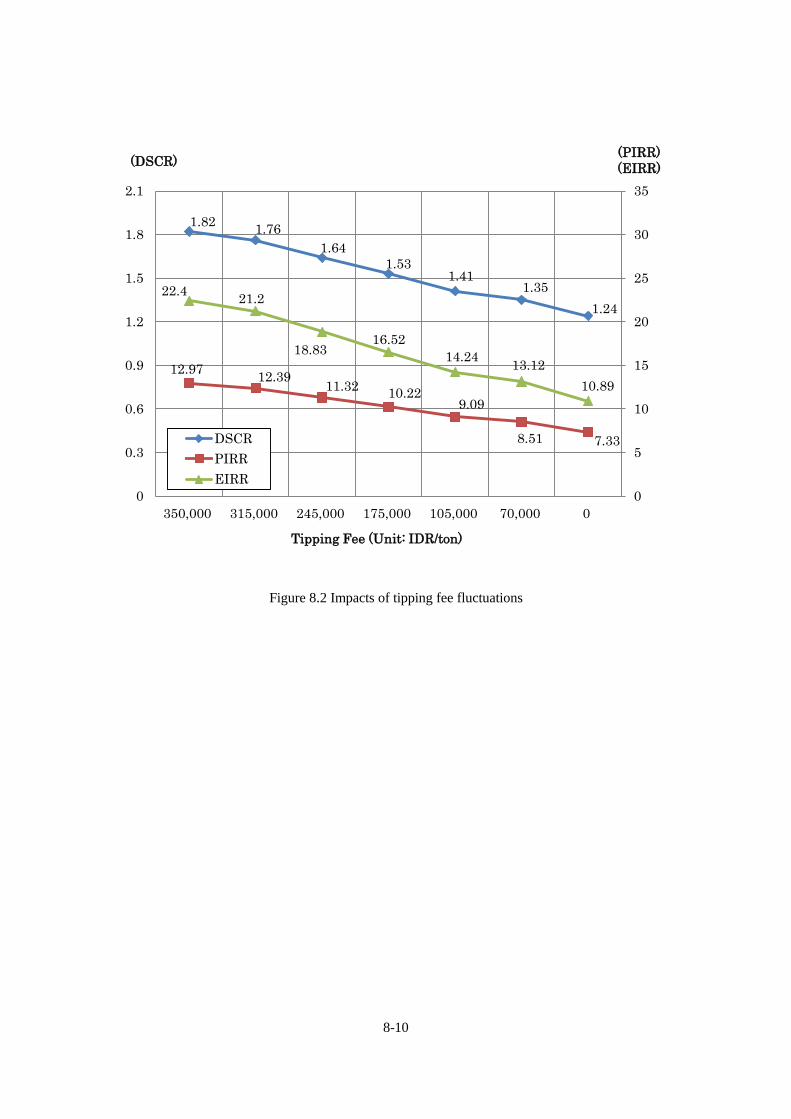
8-10
Figure 8.2 Impacts of tipping fee fluctuations
1.82 1.76
1.64
1.53 1.41
1.35
1.24
12.97 12.39
11.32 10.22
9.09
8.51 7.33
22.4 21.2
18.83 16.52
14.24 13.12
10.89
0
5
10
15
20
25
30
35
0
0.3
0.6
0.9
1.2
1.5
1.8
2.1
350,000 315,000 245,000 175,000 105,000 70,000 0
(PIRR)
(EIRR) (DSCR)
Tipping Fee (Unit: IDR/ton)
DSCR
PIRR
EIRR
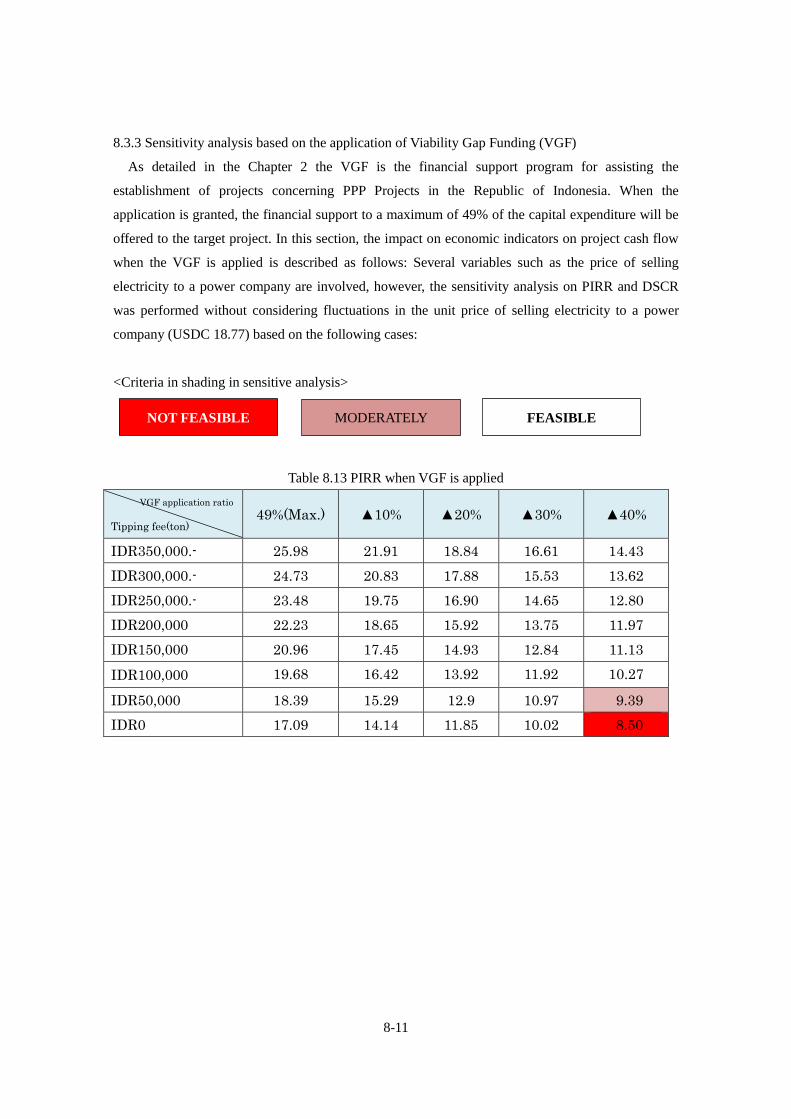
8-11
8.3.3 Sensitivity analysis based on the application of Viability Gap Funding (VGF)
As detailed in the Chapter 2 the VGF is the financial support program for assisting the
establishment of projects concerning PPP Projects in the Republic of Indonesia. When the
application is granted, the financial support to a maximum of 49% of the capital expenditure will be
offered to the target project. In this section, the impact on economic indicators on project cash flow
when the VGF is applied is described as follows: Several variables such as the price of selling
electricity to a power company are involved, however, the sensitivity analysis on PIRR and DSCR
was performed without considering fluctuations in the unit price of selling electricity to a power
company (USDC 18.77) based on the following cases:
<Criteria in shading in sensitive analysis>
Table 8.13 PIRR when VGF is applied
VGF application ratio
Tipping fee(ton) 49%(Max.) ▲10% ▲20% ▲30% ▲40%
IDR350,000.- 25.98 21.91 18.84 16.61 14.43
IDR300,000.- 24.73 20.83 17.88 15.53 13.62
IDR250,000.- 23.48 19.75 16.90 14.65 12.80
IDR200,000 22.23 18.65 15.92 13.75 11.97
IDR150,000 20.96 17.45 14.93 12.84 11.13
IDR100,000 19.68 16.42 13.92 11.92 10.27
IDR50,000 18.39 15.29 12.9 10.97 9.39
IDR0 17.09 14.14 11.85 10.02 8.50
NOT FEASIBLE MODERATELY FEASIBLE
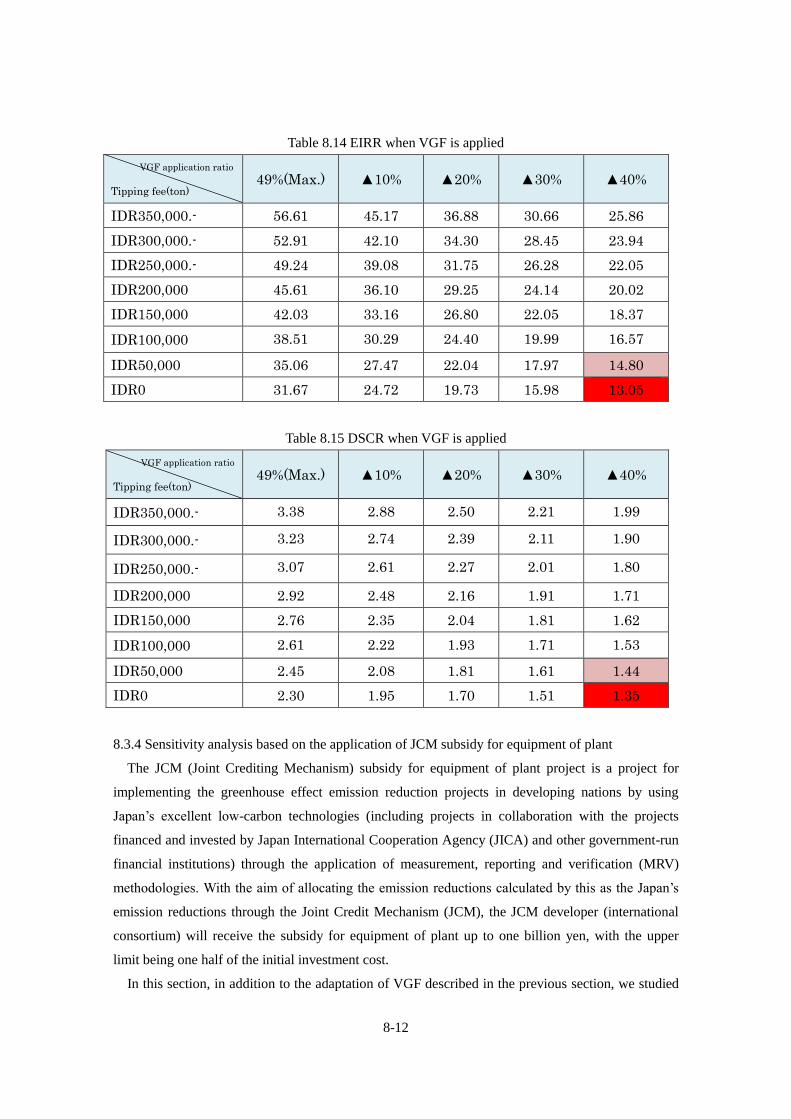
8-12
Table 8.14 EIRR when VGF is applied
VGF application ratio
Tipping fee(ton) 49%(Max.) ▲10% ▲20% ▲30% ▲40%
IDR350,000.- 56.61 45.17 36.88 30.66 25.86
IDR300,000.- 52.91 42.10 34.30 28.45 23.94
IDR250,000.- 49.24 39.08 31.75 26.28 22.05
IDR200,000 45.61 36.10 29.25 24.14 20.02
IDR150,000 42.03 33.16 26.80 22.05 18.37
IDR100,000 38.51 30.29 24.40 19.99 16.57
IDR50,000 35.06 27.47 22.04 17.97 14.80
IDR0 31.67 24.72 19.73 15.98 13.05
Table 8.15 DSCR when VGF is applied
VGF application ratio
Tipping fee(ton) 49%(Max.) ▲10% ▲20% ▲30% ▲40%
IDR350,000.- 3.38 2.88 2.50 2.21 1.99
IDR300,000.- 3.23 2.74 2.39 2.11 1.90
IDR250,000.- 3.07 2.61 2.27 2.01 1.80
IDR200,000 2.92 2.48 2.16 1.91 1.71
IDR150,000 2.76 2.35 2.04 1.81 1.62
IDR100,000 2.61 2.22 1.93 1.71 1.53
IDR50,000 2.45 2.08 1.81 1.61 1.44
IDR0 2.30 1.95 1.70 1.51 1.35
8.3.4 Sensitivity analysis based on the application of JCM subsidy for equipment of plant
The JCM (Joint Crediting Mechanism) subsidy for equipment of plant project is a project for
implementing the greenhouse effect emission reduction projects in developing nations by using
Japan’s excellent low-carbon technologies (including projects in collaboration with the projects
financed and invested by Japan International Cooperation Agency (JICA) and other government-run
financial institutions) through the application of measurement, reporting and verification (MRV)
methodologies. With the aim of allocating the emission reductions calculated by this as the Japan’s
emission reductions through the Joint Credit Mechanism (JCM), the JCM developer (international
consortium) will receive the subsidy for equipment of plant up to one billion yen, with the upper
limit being one half of the initial investment cost.
In this section, in addition to the adaptation of VGF described in the previous section, we studied
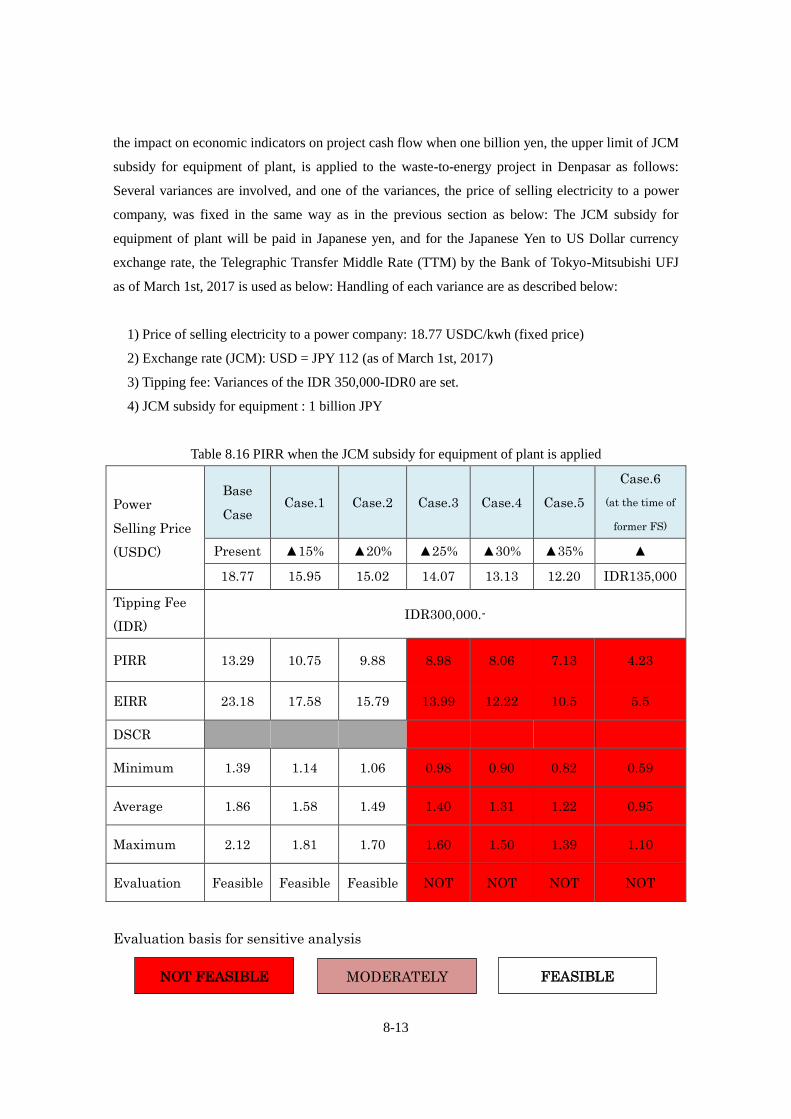
8-13
the impact on economic indicators on project cash flow when one billion yen, the upper limit of JCM
subsidy for equipment of plant, is applied to the waste-to-energy project in Denpasar as follows:
Several variances are involved, and one of the variances, the price of selling electricity to a power
company, was fixed in the same way as in the previous section as below: The JCM subsidy for
equipment of plant will be paid in Japanese yen, and for the Japanese Yen to US Dollar currency
exchange rate, the Telegraphic Transfer Middle Rate (TTM) by the Bank of Tokyo-Mitsubishi UFJ
as of March 1st, 2017 is used as below: Handling of each variance are as described below:
1) Price of selling electricity to a power company: 18.77 USDC/kwh (fixed price)
2) Exchange rate (JCM): USD = JPY 112 (as of March 1st, 2017)
3) Tipping fee: Variances of the IDR 350,000-IDR0 are set.
4) JCM subsidy for equipment : 1 billion JPY
Table 8.16 PIRR when the JCM subsidy for equipment of plant is applied
Power
Selling Price
(USDC)
Base
Case Case.1 Case.2 Case.3 Case.4 Case.5
Case.6
(at the time of
former FS)
Present ▲15% ▲20% ▲25% ▲30% ▲35% ▲
18.77 15.95 15.02 14.07 13.13 12.20 IDR135,000
Tipping Fee
(IDR) IDR300,000.-
PIRR 13.29 10.75 9.88 8.98 8.06 7.13 4.23
EIRR 23.18 17.58 15.79 13.99 12.22 10.5 5.5
DSCR
Minimum 1.39 1.14 1.06 0.98 0.90 0.82 0.59
Average 1.86 1.58 1.49 1.40 1.31 1.22 0.95
Maximum 2.12 1.81 1.70 1.60 1.50 1.39 1.10
Evaluation Feasible Feasible Feasible NOT NOT NOT NOT
Evaluation basis for sensitive analysis
NOT FEASIBLE MODERATELY FEASIBLE
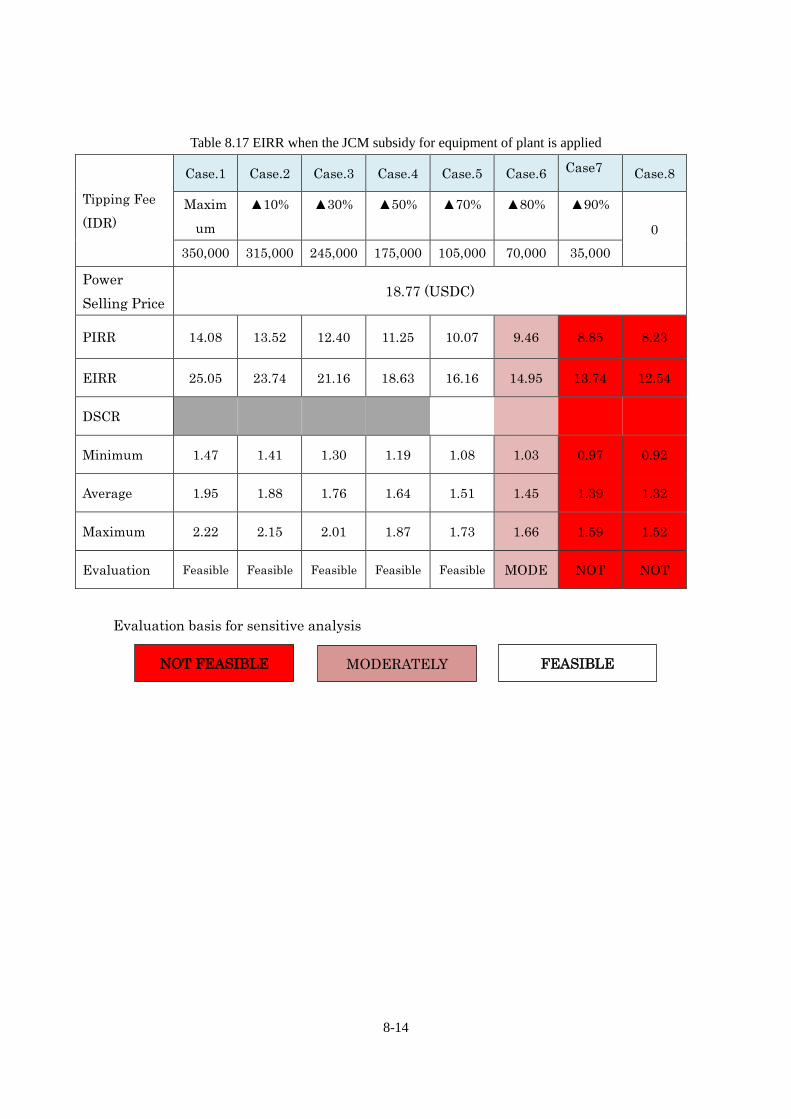
8-14
Table 8.17 EIRR when the JCM subsidy for equipment of plant is applied
Evaluation basis for sensitive analysis
Tipping Fee
(IDR)
Case.1 Case.2 Case.3 Case.4 Case.5 Case.6 Case7 Case.8
Maxim
um
▲10% ▲30% ▲50% ▲70% ▲80% ▲90%
0
350,000 315,000 245,000 175,000 105,000 70,000 35,000
Power
Selling Price 18.77 (USDC)
PIRR 14.08 13.52 12.40 11.25 10.07 9.46 8.85 8.23
EIRR 25.05 23.74 21.16 18.63 16.16 14.95 13.74 12.54
DSCR
Minimum 1.47 1.41 1.30 1.19 1.08 1.03 0.97 0.92
Average 1.95 1.88 1.76 1.64 1.51 1.45 1.39 1.32
Maximum 2.22 2.15 2.01 1.87 1.73 1.66 1.59 1.52
Evaluation Feasible Feasible Feasible Feasible Feasible MODE NOT NOT
NOT FEASIBLE MODERATELY FEASIBLE
JCM_ID_F_PM_ver01.0
9-1
Chapter 9 JCM Proposed Methodology
9.1 JCM Proposed Methodology Form
JCM Proposed Methodology Form
Cover sheet of the Proposed Methodology Form
Form for submitting the proposed methodology
Host Country Republic of Indonesia
Name of the methodology proponents
submitting this form
JFE Engineering Corporation
Sectoral scope(s) to which the Proposed
Methodology applies
1. Energy industries (renewable - /
non-renewable sources)
13. Waste handling and disposal
Title of the proposed methodology, and
version number
Power generation and avoidance of landfill gas
emissions through combustion of municipal solid
waste (MSW), ver. 01.0
List of documents to be attached to this form
(please check):
The attached draft JCM-PDD:
Additional information
Date of completion dd/mm/yyyy
History of the proposed methodology
Version Date Contents revised
01.0 dd/mm/yyyy First edition
JCM_ID_F_PM_ver01.0
9-2
A. Title of the methodology
Power generation and avoidance of landfill gas emissions through combustion of municipal
solid waste (MSW), ver. 01.0
B. Terms and definitions
Terms Definitions
Municipal solid waste (MSW) A heterogeneous mix of different solid waste types, usually
collected by municipalities or other local authorities. MSW
includes household waste, garden/park waste and
commercial/institutional waste.
Solid waste disposal site
(SWDS)
Designated areas intended as the final storage place for solid
waste.
Fresh waste Solid waste that intended for disposal in a SWDS but has not
yet been disposed.
C. Summary of the methodology
Items Summary
GHG emission reduction
measures
Installation of MSW incinerators avoids emissions of methane
associated with disposed organic waste in a SWDS, and
electricity generated by the project facility displaces electricity
from a grid or captive power generator which is generated using
fossil fuels resulting in GHG emission reductions.
Calculation of reference
emissions
Reference emissions are calculated as a sum of the following
emissions:
CH4 emissions from SWDS: Calculated from the amount of
MSW and fraction of each waste type incinerated in the
incinerator using the first order decay (FOD) model; and
CO2 emissions from a grid or captive power generator:
Electricity generated by the project facility multiplied by the
emission factor of displaced electricity.
Calculation of project Project emissions are calculated as a sum of the following
JCM_ID_F_PM_ver01.0
9-3
emissions emissions:
CO2 emissions from combustion of fossil carbon contained
in MSW: The amount of MSW multiplied by the fraction of
fossil carbon content and the conversion factor of carbon;
N2O emissions from combustion of waste: The amount of
MSW multiplied by the N2O emission factor associated with
incineration;
CO2 emissions from electricity used to operate the project
facility: Electricity used to operate the project facility
multiplied by the emission factor of electricity; and
CO2 emissions from auxiliary fossil fuel consumption
associated with incineration: The amount of fossil fuel
consumption associated with incineration multiplied by the
emission factor of the fossil fuel.
Monitoring parameters Amount of waste (wet basis);
Quantity of electricity generated by the project facility;
Quantity of electricity consumed by the project facility; and
Quantity of auxiliary fossil fuel consumption.
D. Eligibility criteria
This methodology is applicable to projects that satisfy all of the following criteria.
Criterion 1 The project newly installs an incinerator, waste heat recovery boiler, exhaust gas
treatment equipment and turbine generator.
Criterion 2 The project incinerates fresh municipal solid waste (MSW) and generates
electricity from steam produced in a waste heat recovery boiler.
Criterion 3 Emissions of NO2 and CO at the stack of incinerator are designed to be less than
or equal to the following levels:
- NO2: 470mg/Nm3@11%O2, and
- CO: 625mg/Nm3@11%O2
Criterion 4 There is a plan to operate the project facility for more than 5 years.
E. Emission Sources and GHG types
Reference emissions
JCM_ID_F_PM_ver01.0
9-4
Emission sources GHG types
Decomposition of waste at SWDS CH4
Electricity generation CO2
Project emissions
Emission sources GHG types
Combustion of fossil carbon contained in waste CO2
Incineration of waste N2O
Electricity use by the project facility CO2
Consumption of auxiliary fossil fuels needed to be added into
incinerator
CO2
F. Establishment and calculation of reference emissions
F.1. Establishment of reference emissions
A project which applies this methodology incinerates MSW and generates electricity. In
Indonesia, MSW is usually disposed in open dump sites without recovering landfill gas.
Therefore, BaU for MSW treatment is open dumping and BaU emissions are CH4 emissions
from open dumping of MSW and CO2 emissions from fossil fuels combusted to generate
electricity which would be displaced by the project.
To assure net emission reductions, the model correction factor which accounts for uncertainty of
the model to calculate emissions from decomposition of MSW is set conservatively.
F.2. Calculation of reference emissions
𝑅𝐸𝑝 = 𝑅𝐸𝐶𝐻4,𝑝 + 𝑅𝐸𝑒𝑙𝑒𝑐,𝑝
Where:
𝑅𝐸𝑝 = Reference emissions during the period p [tCO2e/p]
𝑅𝐸𝐶𝐻4,𝑝 = Reference emissions from decomposition of MSW at the SWDS during the
period p [tCO2e/p]
𝑅𝐸𝑒𝑙𝑒𝑐,𝑝 = Reference emissions from electricity generation during the period p [tCO2e/p]
Reference emissions from decomposition of MSW at the SWDS during the period p (RECH4,p) is
accounted only from the next calendar year after its disposal at the SWDS (or incineration) due
to delay in generation of CH4 from the time of disposal at the SWDS.
JCM_ID_F_PM_ver01.0
9-5
𝑅𝐸𝐶𝐻4,𝑝 = ∑ [𝜑 × (1 − 𝑓) × 𝐺𝑊𝑃𝐶𝐻4 × (1 − 𝑂𝑋) ×16
12× 𝐹 × 𝐷𝑂𝐶𝑓 × 𝑀𝐶𝐹
𝑝_𝑒𝑛𝑑
𝑦=𝑝_𝑠𝑡𝑎𝑟𝑡
× ∑ ∑{𝑊𝑖 × 𝑝𝑗 × 𝐷𝑂𝐶𝑗 × 𝑒−𝑘𝑗(𝑦−1−𝑖) × (1 − 𝑒−𝑘𝑗)}
𝑗
𝑦−1
𝑖=1
]
Where:
𝑅𝐸𝐶𝐻4,𝑝 = Reference emissions from decomposition of MSW at the SWDS during the
period p [tCO2e/p]
𝑦 = The Nth year from the first disposal (or incineration), extending from the first
year of the period p (y=p_start) to the last year of the period p (y=p_end). If y is
equal to 1, methane generation cannot be accounted.
𝑝_𝑠𝑡𝑎𝑟𝑡 = The Nth year from the first disposal (or incineration), which is the first year of
the period p
𝑝_𝑒𝑛𝑑 = The Nth year from the first disposal (or incineration), which is the last year of
the period p
𝜑 = Model correction factor to account for model uncertainties
𝑓 = Fraction of methane captured at the SWDS and flared, combusted or used in
another manner that prevents the emissions of methane to the atmosphere
𝐺𝑊𝑃𝐶𝐻4 = Global Warming Potential of methane [tCO2e/tCH4]
𝑂𝑋 = Oxidation factor (reflecting the amount of methane from SWDS that is oxidized
in the soil or other material covering the waste)
𝐹 = Fraction of methane in the SWDS gas [volume fraction]
𝐷𝑂𝐶𝑓 = Fraction of degradable organic carbon (DOC) that decomposes under the
specific conditions occurring in the SWDS [weight fraction]
𝑀𝐶𝐹 = Methane correction factor
𝑖 = The Nth year from the first disposal (or incineration), extending from the first
year in the time period in which MSW is disposed at the SWDS (i = 1) to year y
(i = y)
𝑊𝑖 = Quantity of MSW fed into incinerator in the year i [t]
𝑝𝑗 = Fraction of the waste type j [weight fraction]
𝐷𝑂𝐶𝑗 = Fraction of degradable organic carbon in the waste type j [weight fraction]
𝑘𝑗 = Decay rate for the waste type j [1/yr]
𝑗 = Type of waste
𝑅𝐸𝑒𝑙𝑒𝑐,𝑝 = 𝐸𝐺𝑒𝑙𝑒𝑐,𝑝 × 𝐸𝐹𝑒𝑙𝑒𝑐
Where:
JCM_ID_F_PM_ver01.0
9-6
𝑅𝐸𝑒𝑙𝑒𝑐,𝑝 = Reference emissions from electricity generation during the period p [tCO2e/p]
𝐸𝐺𝑒𝑙𝑒𝑐,𝑝 = Quantity of electricity generated by the project facility during the period p
[MWh/p]
𝐸𝐹𝑒𝑙𝑒𝑐 = Emission factor for electricity generation [tCO2e/MWh]
G. Calculation of project emissions
𝑃𝐸𝑝 = 𝑃𝐸𝐶𝑂𝑀_𝐶𝑂2,𝑝 + 𝑃𝐸𝐶𝑂𝑀_𝑁2𝑂,𝑝 + 𝑃𝐸𝐸𝐶,𝑝 + 𝑃𝐸𝐹𝐶,𝑝
Where:
𝑃𝐸𝑝 = Project emissions during the period p [tCO2e/p]
𝑃𝐸𝐶𝑂𝑀_𝐶𝑂2,𝑝 = Project emissions of CO2 from combustion of fossil carbon contained in waste
associated with incineration during the period p [tCO2e/p]
𝑃𝐸𝐶𝑂𝑀_𝑁2𝑂,𝑝 = Project emissions of N2O from combustion of waste associated with
incineration during the period p [tCO2e/p]
𝑃𝐸𝐸𝐶,𝑝 = Project emissions from electricity consumption by the project facility during the
period p [tCO2e/p]
𝑃𝐸𝐹𝐶,𝑝 = Project emissions from auxiliary fossil fuel consumption associated with
incineration during the period p [tCO2e/p]
𝑃𝐸𝐶𝑂𝑀_𝐶𝑂2,𝑝 = 𝐸𝐹𝐹𝐶𝑂𝑀 ×44
12× ∑ ∑ (𝑊𝑖 × 𝑝𝑗 × 𝐷𝐶 × 𝐹𝐶𝐶𝑗 × 𝐹𝐹𝐶𝑗)
𝑝_𝑒𝑛𝑑
𝑖=𝑝_𝑠𝑡𝑎𝑟𝑡𝑗
Where:
𝑃𝐸𝐶𝑂𝑀_𝐶𝑂2,𝑝 = Project emissions of CO2 from combustion of fossil carbon contained in waste
associated with incineration during the period p [tCO2e/p]
𝐸𝐹𝐹𝐶𝑂𝑀 = Combustion efficiency of incinerator [fraction]
44
12 = Conversion factor [tCO2/tC]
𝑖 = The Nth year from the first incineration
𝑝_𝑠𝑡𝑎𝑟𝑡 = The Nth year from the first incineration, which is the first year of the period p
𝑝_𝑒𝑛𝑑 = The Nth year from the first incineration, which is the last year of the period p
𝑊𝑖 = Quantity of MSW fed into incinerator in the year i [t]
𝑝𝑗 = Fraction of the waste type j [weight fraction]
𝐷𝐶 = Dry matter content of MSW [%]
𝐹𝐶𝐶𝑗 = Fraction of total carbon content in waste type j [tC/t]
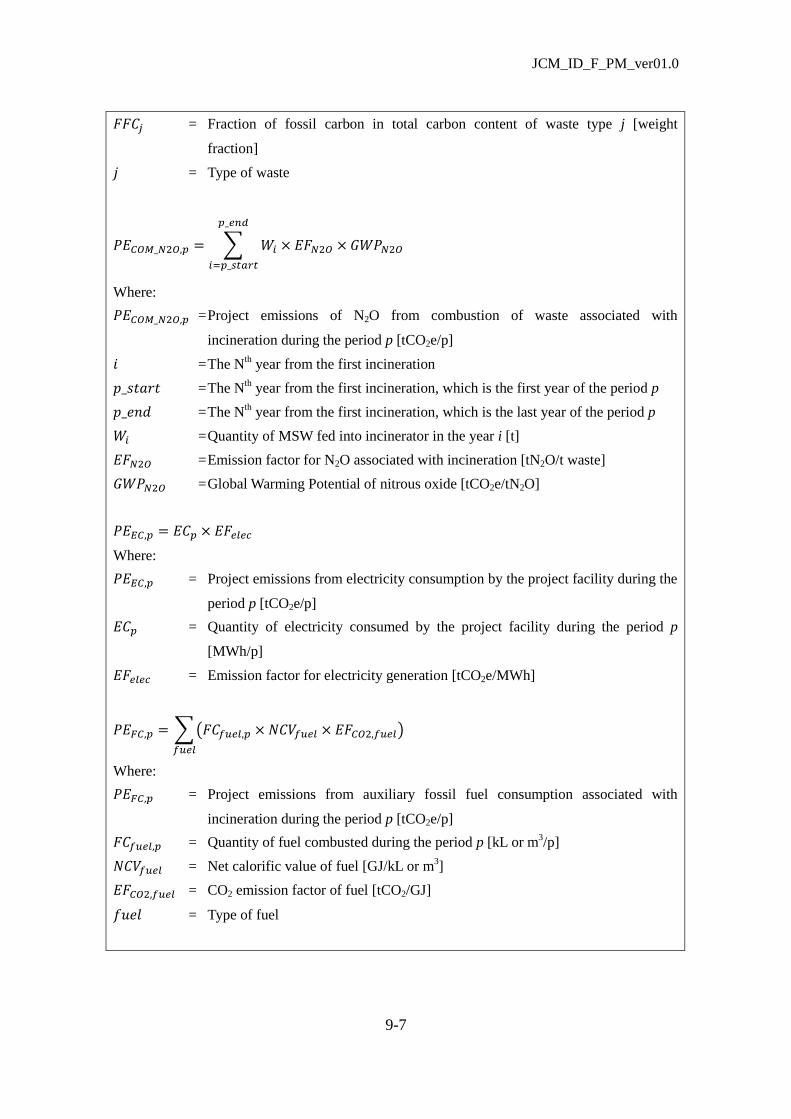
JCM_ID_F_PM_ver01.0
9-7
𝐹𝐹𝐶𝑗 = Fraction of fossil carbon in total carbon content of waste type j [weight
fraction]
𝑗 = Type of waste
𝑃𝐸𝐶𝑂𝑀_𝑁2𝑂,𝑝 = ∑ 𝑊𝑖 × 𝐸𝐹𝑁2𝑂 × 𝐺𝑊𝑃𝑁2𝑂
𝑝_𝑒𝑛𝑑
𝑖=𝑝_𝑠𝑡𝑎𝑟𝑡
Where:
𝑃𝐸𝐶𝑂𝑀_𝑁2𝑂,𝑝 = Project emissions of N2O from combustion of waste associated with
incineration during the period p [tCO2e/p]
𝑖 = The Nth year from the first incineration
𝑝_𝑠𝑡𝑎𝑟𝑡 = The Nth year from the first incineration, which is the first year of the period p
𝑝_𝑒𝑛𝑑 = The Nth year from the first incineration, which is the last year of the period p
𝑊𝑖 = Quantity of MSW fed into incinerator in the year i [t]
𝐸𝐹𝑁2𝑂 = Emission factor for N2O associated with incineration [tN2O/t waste]
𝐺𝑊𝑃𝑁2𝑂 = Global Warming Potential of nitrous oxide [tCO2e/tN2O]
𝑃𝐸𝐸𝐶,𝑝 = 𝐸𝐶𝑝 × 𝐸𝐹𝑒𝑙𝑒𝑐
Where:
𝑃𝐸𝐸𝐶,𝑝 = Project emissions from electricity consumption by the project facility during the
period p [tCO2e/p]
𝐸𝐶𝑝 = Quantity of electricity consumed by the project facility during the period p
[MWh/p]
𝐸𝐹𝑒𝑙𝑒𝑐 = Emission factor for electricity generation [tCO2e/MWh]
𝑃𝐸𝐹𝐶,𝑝 = ∑ (𝐹𝐶𝑓𝑢𝑒𝑙,𝑝 × 𝑁𝐶𝑉𝑓𝑢𝑒𝑙 × 𝐸𝐹𝐶𝑂2,𝑓𝑢𝑒𝑙)
𝑓𝑢𝑒𝑙
Where:
𝑃𝐸𝐹𝐶,𝑝 = Project emissions from auxiliary fossil fuel consumption associated with
incineration during the period p [tCO2e/p]
𝐹𝐶𝑓𝑢𝑒𝑙,𝑝 = Quantity of fuel combusted during the period p [kL or m3/p]
𝑁𝐶𝑉𝑓𝑢𝑒𝑙 = Net calorific value of fuel [GJ/kL or m3]
𝐸𝐹𝐶𝑂2,𝑓𝑢𝑒𝑙 = CO2 emission factor of fuel [tCO2/GJ]
𝑓𝑢𝑒𝑙 = Type of fuel
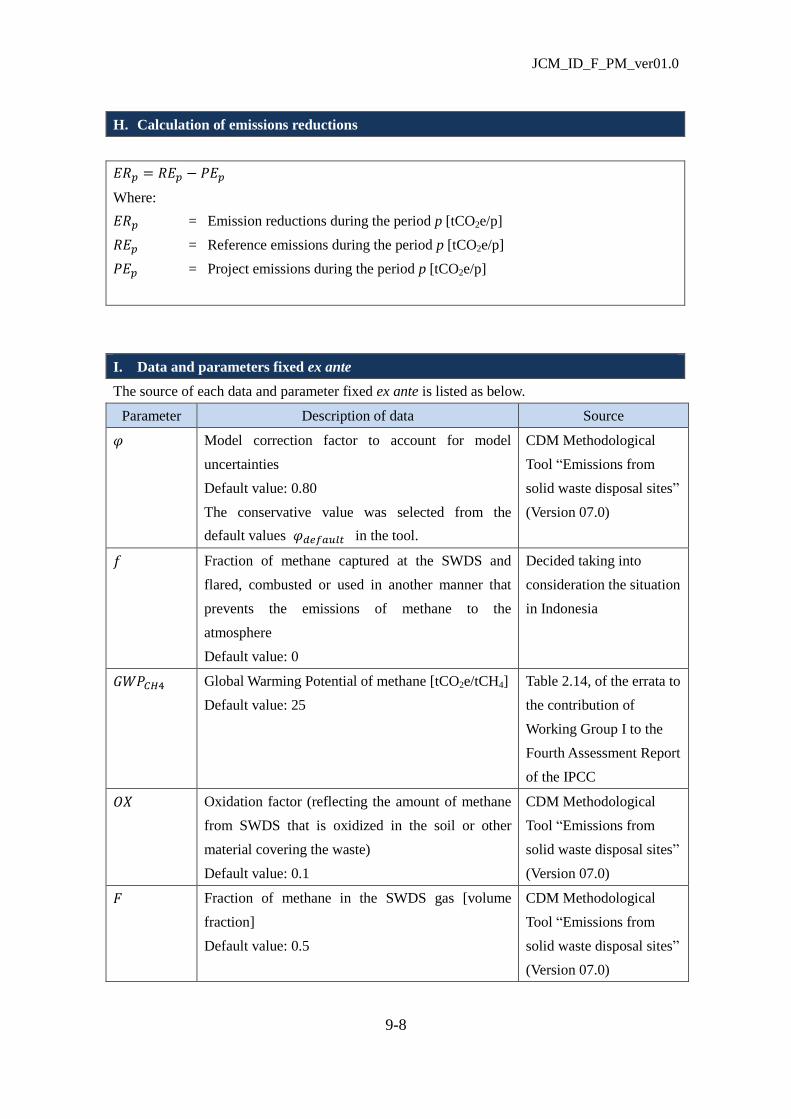
JCM_ID_F_PM_ver01.0
9-8
H. Calculation of emissions reductions
𝐸𝑅𝑝 = 𝑅𝐸𝑝 − 𝑃𝐸𝑝
Where:
𝐸𝑅𝑝 = Emission reductions during the period p [tCO2e/p]
𝑅𝐸𝑝 = Reference emissions during the period p [tCO2e/p]
𝑃𝐸𝑝 = Project emissions during the period p [tCO2e/p]
I. Data and parameters fixed ex ante
The source of each data and parameter fixed ex ante is listed as below.
Parameter Description of data Source
𝜑 Model correction factor to account for model
uncertainties
Default value: 0.80
The conservative value was selected from the
default values 𝜑𝑑𝑒𝑓𝑎𝑢𝑙𝑡 in the tool.
CDM Methodological
Tool “Emissions from
solid waste disposal sites”
(Version 07.0)
𝑓 Fraction of methane captured at the SWDS and
flared, combusted or used in another manner that
prevents the emissions of methane to the
atmosphere
Default value: 0
Decided taking into
consideration the situation
in Indonesia
𝐺𝑊𝑃𝐶𝐻4 Global Warming Potential of methane [tCO2e/tCH4]
Default value: 25
Table 2.14, of the errata to
the contribution of
Working Group I to the
Fourth Assessment Report
of the IPCC
𝑂𝑋 Oxidation factor (reflecting the amount of methane
from SWDS that is oxidized in the soil or other
material covering the waste)
Default value: 0.1
CDM Methodological
Tool “Emissions from
solid waste disposal sites”
(Version 07.0)
𝐹 Fraction of methane in the SWDS gas [volume
fraction]
Default value: 0.5
CDM Methodological
Tool “Emissions from
solid waste disposal sites”
(Version 07.0)
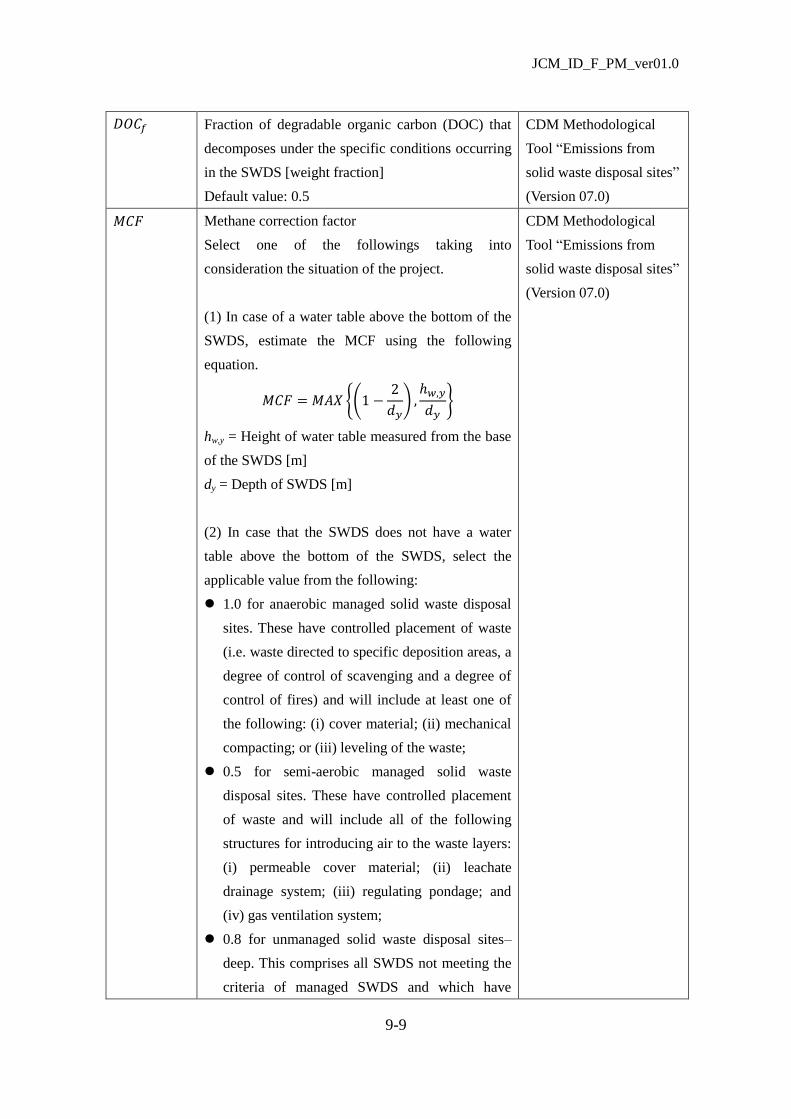
JCM_ID_F_PM_ver01.0
9-9
𝐷𝑂𝐶𝑓 Fraction of degradable organic carbon (DOC) that
decomposes under the specific conditions occurring
in the SWDS [weight fraction]
Default value: 0.5
CDM Methodological
Tool “Emissions from
solid waste disposal sites”
(Version 07.0)
𝑀𝐶𝐹 Methane correction factor
Select one of the followings taking into
consideration the situation of the project.
(1) In case of a water table above the bottom of the
SWDS, estimate the MCF using the following
equation.
𝑀𝐶𝐹 = 𝑀𝐴𝑋 {(1 −2
𝑑𝑦) ,
ℎ𝑤,𝑦
𝑑𝑦}
hw,y = Height of water table measured from the base
of the SWDS [m]
dy = Depth of SWDS [m]
(2) In case that the SWDS does not have a water
table above the bottom of the SWDS, select the
applicable value from the following:
1.0 for anaerobic managed solid waste disposal
sites. These have controlled placement of waste
(i.e. waste directed to specific deposition areas, a
degree of control of scavenging and a degree of
control of fires) and will include at least one of
the following: (i) cover material; (ii) mechanical
compacting; or (iii) leveling of the waste;
0.5 for semi-aerobic managed solid waste
disposal sites. These have controlled placement
of waste and will include all of the following
structures for introducing air to the waste layers:
(i) permeable cover material; (ii) leachate
drainage system; (iii) regulating pondage; and
(iv) gas ventilation system;
0.8 for unmanaged solid waste disposal sites–
deep. This comprises all SWDS not meeting the
criteria of managed SWDS and which have
CDM Methodological
Tool “Emissions from
solid waste disposal sites”
(Version 07.0)
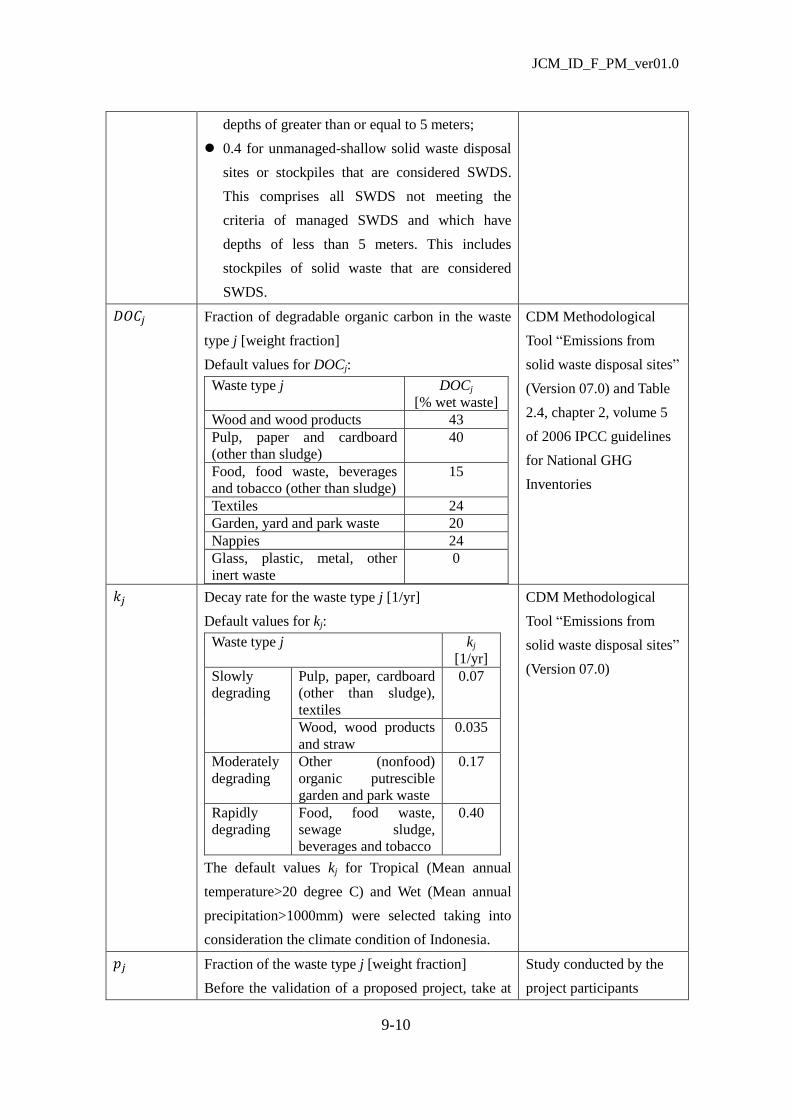
JCM_ID_F_PM_ver01.0
9-10
depths of greater than or equal to 5 meters;
0.4 for unmanaged-shallow solid waste disposal
sites or stockpiles that are considered SWDS.
This comprises all SWDS not meeting the
criteria of managed SWDS and which have
depths of less than 5 meters. This includes
stockpiles of solid waste that are considered
SWDS.
𝐷𝑂𝐶𝑗 Fraction of degradable organic carbon in the waste
type j [weight fraction]
Default values for DOCj:
Waste type j DOCj
[% wet waste]
Wood and wood products 43
Pulp, paper and cardboard
(other than sludge)
40
Food, food waste, beverages
and tobacco (other than sludge)
15
Textiles 24
Garden, yard and park waste 20
Nappies 24
Glass, plastic, metal, other
inert waste
0
CDM Methodological
Tool “Emissions from
solid waste disposal sites”
(Version 07.0) and Table
2.4, chapter 2, volume 5
of 2006 IPCC guidelines
for National GHG
Inventories
𝑘𝑗 Decay rate for the waste type j [1/yr]
Default values for kj:
Waste type j kj
[1/yr]
Slowly
degrading
Pulp, paper, cardboard
(other than sludge),
textiles
0.07
Wood, wood products
and straw
0.035
Moderately
degrading
Other (nonfood)
organic putrescible
garden and park waste
0.17
Rapidly
degrading
Food, food waste,
sewage sludge,
beverages and tobacco
0.40
The default values kj for Tropical (Mean annual
temperature>20 degree C) and Wet (Mean annual
precipitation>1000mm) were selected taking into
consideration the climate condition of Indonesia.
CDM Methodological
Tool “Emissions from
solid waste disposal sites”
(Version 07.0)
𝑝𝑗 Fraction of the waste type j [weight fraction]
Before the validation of a proposed project, take at
Study conducted by the
project participants
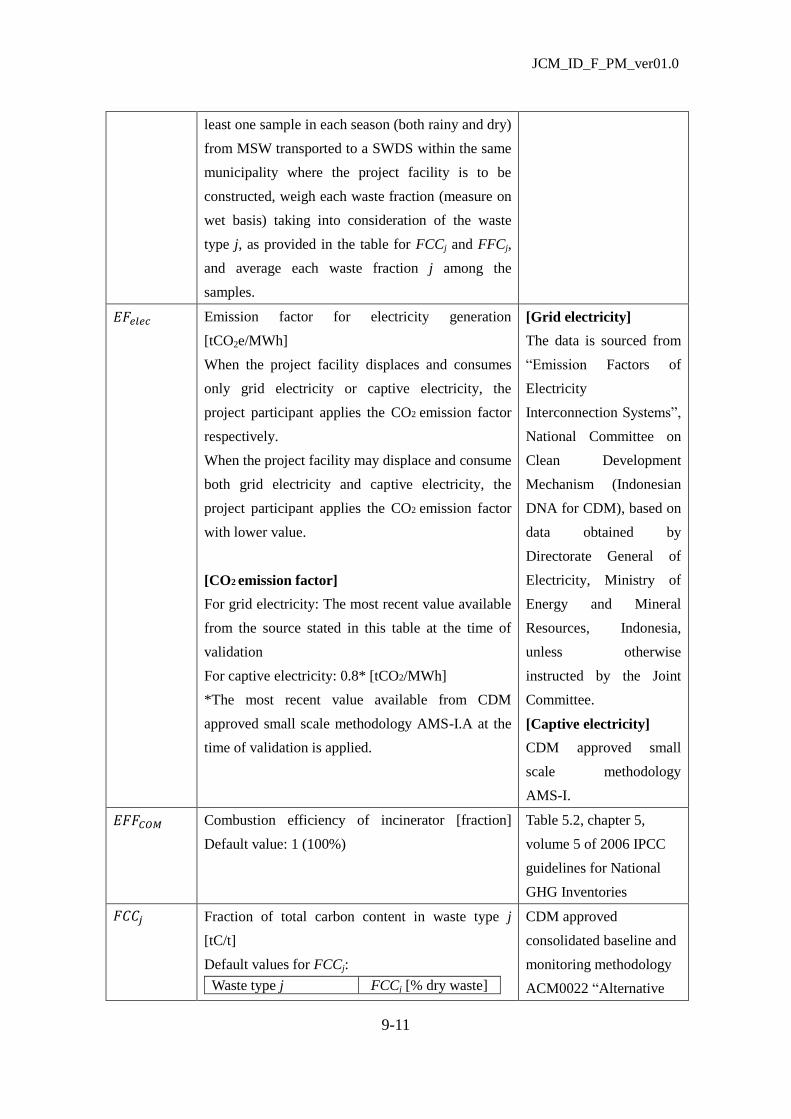
JCM_ID_F_PM_ver01.0
9-11
least one sample in each season (both rainy and dry)
from MSW transported to a SWDS within the same
municipality where the project facility is to be
constructed, weigh each waste fraction (measure on
wet basis) taking into consideration of the waste
type j, as provided in the table for FCCj and FFCj,
and average each waste fraction j among the
samples.
𝐸𝐹𝑒𝑙𝑒𝑐 Emission factor for electricity generation
[tCO2e/MWh]
When the project facility displaces and consumes
only grid electricity or captive electricity, the
project participant applies the CO2 emission factor
respectively.
When the project facility may displace and consume
both grid electricity and captive electricity, the
project participant applies the CO2 emission factor
with lower value.
[CO2 emission factor]
For grid electricity: The most recent value available
from the source stated in this table at the time of
validation
For captive electricity: 0.8* [tCO2/MWh]
*The most recent value available from CDM
approved small scale methodology AMS-I.A at the
time of validation is applied.
[Grid electricity]
The data is sourced from
“Emission Factors of
Electricity
Interconnection Systems”,
National Committee on
Clean Development
Mechanism (Indonesian
DNA for CDM), based on
data obtained by
Directorate General of
Electricity, Ministry of
Energy and Mineral
Resources, Indonesia,
unless otherwise
instructed by the Joint
Committee.
[Captive electricity]
CDM approved small
scale methodology
AMS-I.
𝐸𝐹𝐹𝐶𝑂𝑀 Combustion efficiency of incinerator [fraction]
Default value: 1 (100%)
Table 5.2, chapter 5,
volume 5 of 2006 IPCC
guidelines for National
GHG Inventories
𝐹𝐶𝐶𝑗 Fraction of total carbon content in waste type j
[tC/t]
Default values for FCCj:
Waste type j FCCj [% dry waste]
CDM approved
consolidated baseline and
monitoring methodology
ACM0022 “Alternative
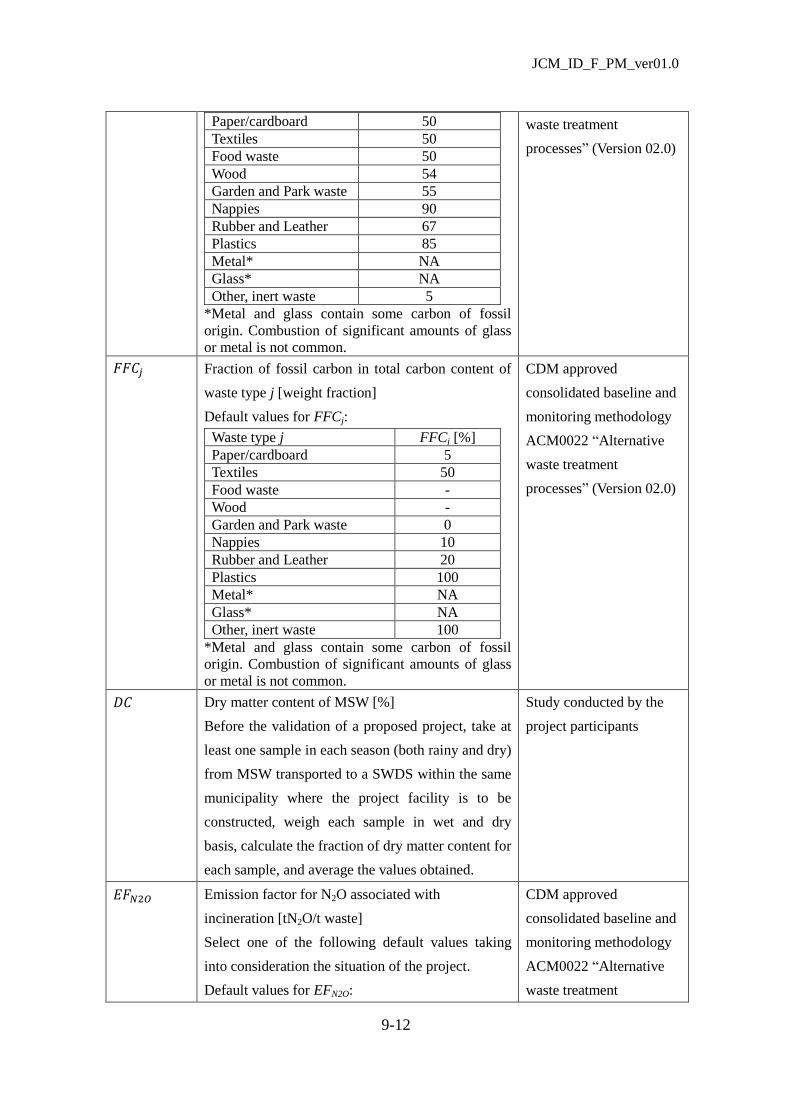
JCM_ID_F_PM_ver01.0
9-12
Paper/cardboard 50
Textiles 50
Food waste 50
Wood 54
Garden and Park waste 55
Nappies 90
Rubber and Leather 67
Plastics 85
Metal* NA
Glass* NA
Other, inert waste 5
*Metal and glass contain some carbon of fossil
origin. Combustion of significant amounts of glass
or metal is not common.
waste treatment
processes” (Version 02.0)
𝐹𝐹𝐶𝑗 Fraction of fossil carbon in total carbon content of
waste type j [weight fraction]
Default values for FFCj:
Waste type j FFCj [%]
Paper/cardboard 5
Textiles 50
Food waste -
Wood -
Garden and Park waste 0
Nappies 10
Rubber and Leather 20
Plastics 100
Metal* NA
Glass* NA
Other, inert waste 100
*Metal and glass contain some carbon of fossil
origin. Combustion of significant amounts of glass
or metal is not common.
CDM approved
consolidated baseline and
monitoring methodology
ACM0022 “Alternative
waste treatment
processes” (Version 02.0)
𝐷𝐶 Dry matter content of MSW [%]
Before the validation of a proposed project, take at
least one sample in each season (both rainy and dry)
from MSW transported to a SWDS within the same
municipality where the project facility is to be
constructed, weigh each sample in wet and dry
basis, calculate the fraction of dry matter content for
each sample, and average the values obtained.
Study conducted by the
project participants
𝐸𝐹𝑁2𝑂 Emission factor for N2O associated with
incineration [tN2O/t waste]
Select one of the following default values taking
into consideration the situation of the project.
Default values for EFN2O:
CDM approved
consolidated baseline and
monitoring methodology
ACM0022 “Alternative
waste treatment
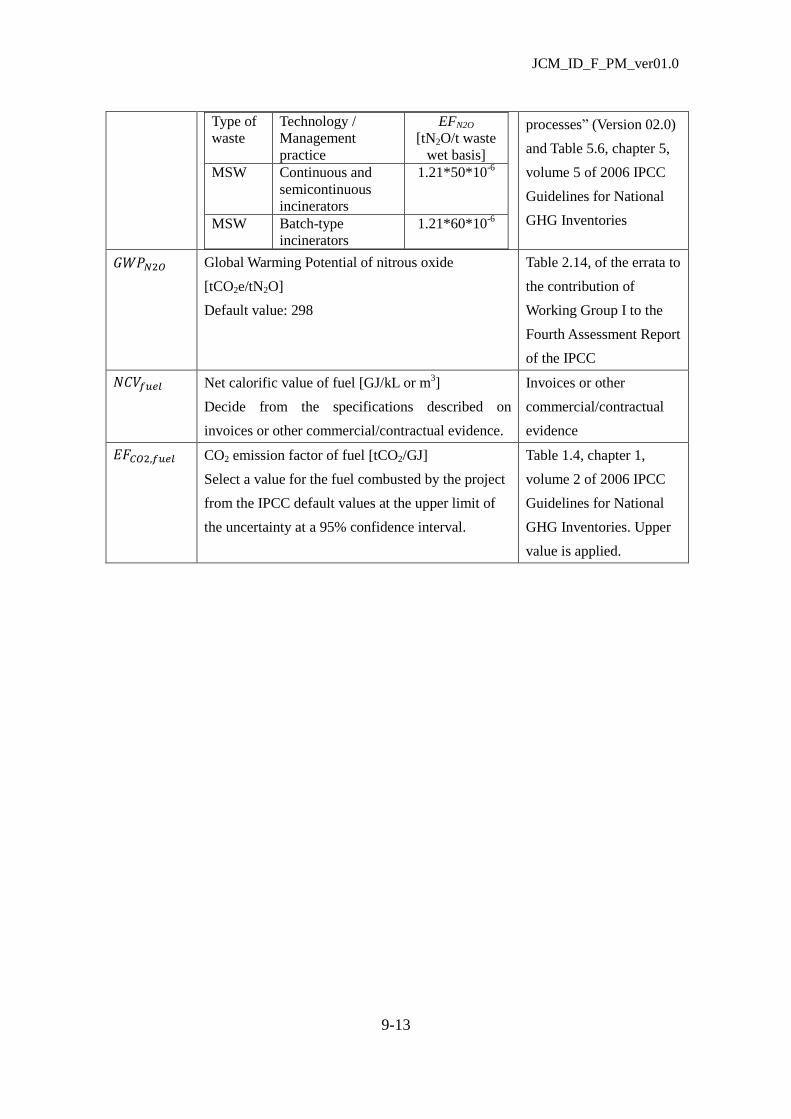
JCM_ID_F_PM_ver01.0
9-13
Type of
waste
Technology /
Management
practice
EFN2O
[tN2O/t waste
wet basis]
MSW Continuous and
semicontinuous
incinerators
1.21*50*10-6
MSW Batch-type
incinerators
1.21*60*10-6
processes” (Version 02.0)
and Table 5.6, chapter 5,
volume 5 of 2006 IPCC
Guidelines for National
GHG Inventories
𝐺𝑊𝑃𝑁2𝑂 Global Warming Potential of nitrous oxide
[tCO2e/tN2O]
Default value: 298
Table 2.14, of the errata to
the contribution of
Working Group I to the
Fourth Assessment Report
of the IPCC
𝑁𝐶𝑉𝑓𝑢𝑒𝑙 Net calorific value of fuel [GJ/kL or m3]
Decide from the specifications described on
invoices or other commercial/contractual evidence.
Invoices or other
commercial/contractual
evidence
𝐸𝐹𝐶𝑂2,𝑓𝑢𝑒𝑙 CO2 emission factor of fuel [tCO2/GJ]
Select a value for the fuel combusted by the project
from the IPCC default values at the upper limit of
the uncertainty at a 95% confidence interval.
Table 1.4, chapter 1,
volume 2 of 2006 IPCC
Guidelines for National
GHG Inventories. Upper
value is applied.

JCM_ID_F_PM_ver01.0
9-14
9.2 JCM Proposed Methodology Spreadsheet
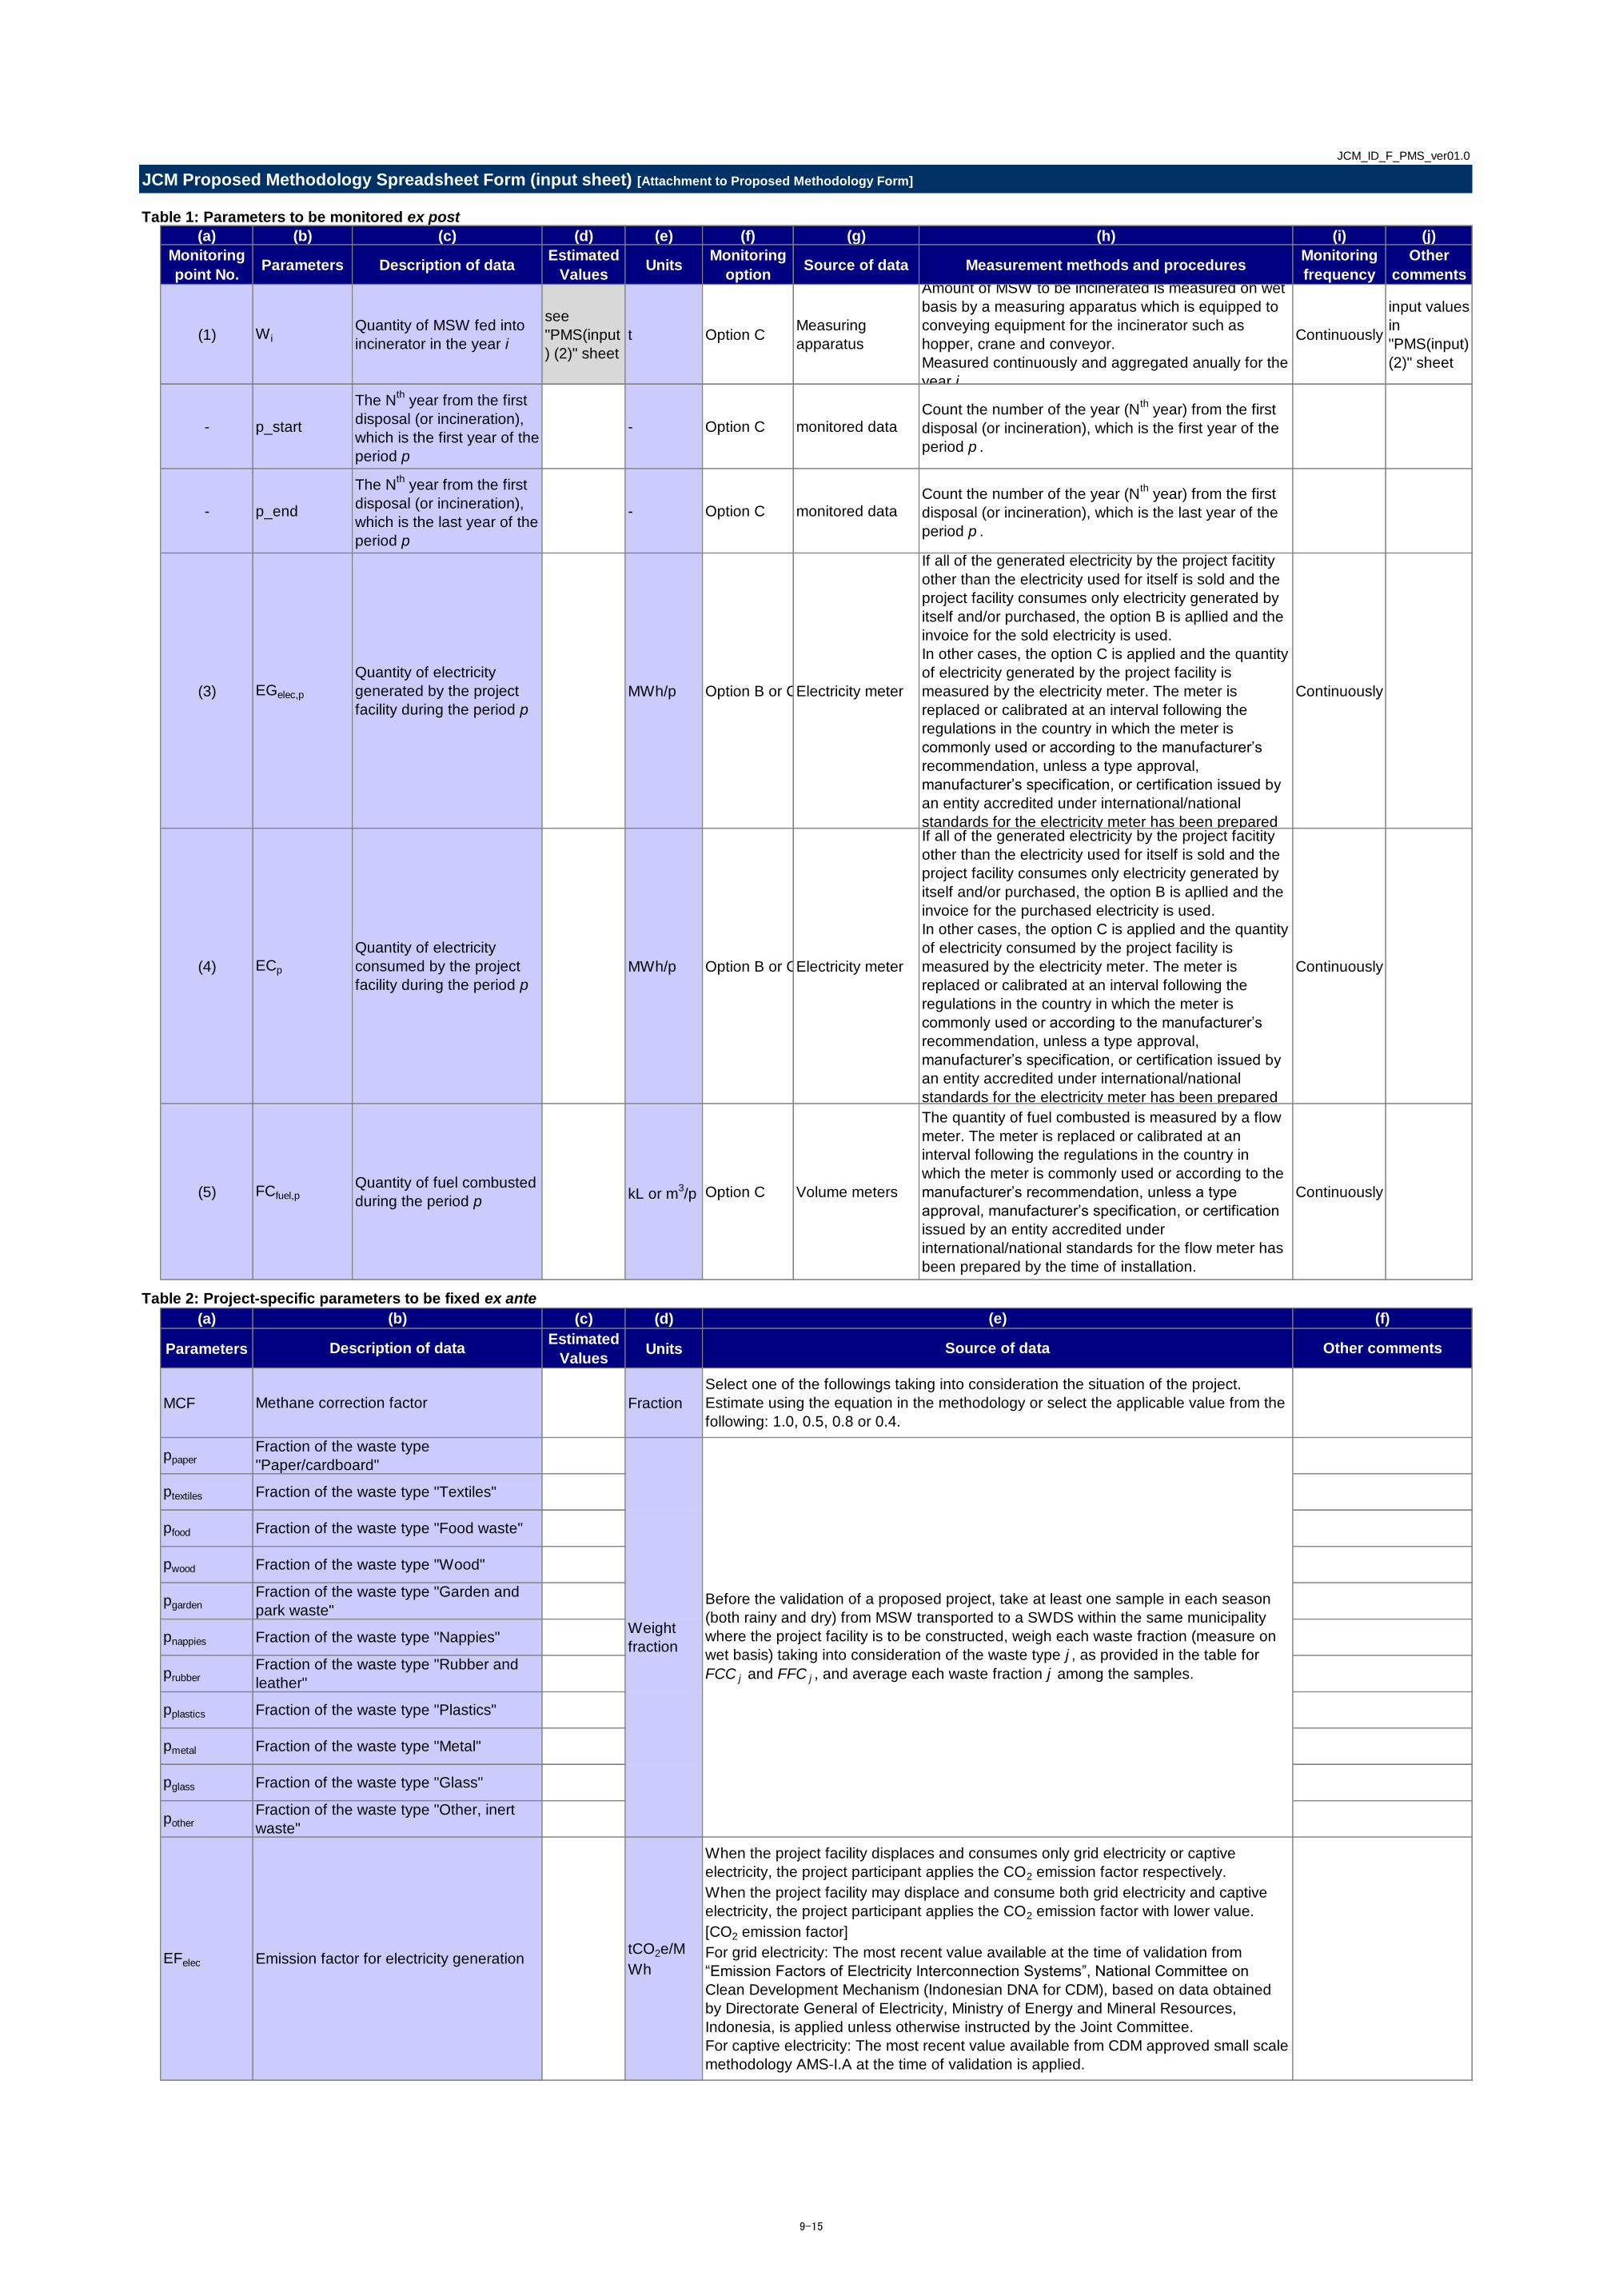
JCM_ID_F_PMS_ver01.0
JCM Proposed Methodology Spreadsheet Form (input sheet) [Attachment to Proposed Methodology Form]
Table 1: Parameters to be monitored ex post
(a) (b) (c) (d) (e) (f) (g) (h) (i) (j)
Monitoring
point No.Parameters Description of data
Estimated
ValuesUnits
Monitoring
optionSource of data Measurement methods and procedures
Monitoring
frequency
Other
comments
(1) W iQuantity of MSW fed into
incinerator in the year i
see
"PMS(input
) (2)" sheet
t Option CMeasuring
apparatus
Amount of MSW to be incinerated is measured on wet
basis by a measuring apparatus which is equipped to
conveying equipment for the incinerator such as
hopper, crane and conveyor.
Measured continuously and aggregated anually for the
year i .
Continuously
input values
in
"PMS(input)
(2)" sheet
- p_start
The Nth
year from the first
disposal (or incineration),
which is the first year of the
period p
- Option C monitored dataCount the number of the year (N
th year) from the first
disposal (or incineration), which is the first year of the
period p .
- p_end
The Nth
year from the first
disposal (or incineration),
which is the last year of the
period p
- Option C monitored dataCount the number of the year (N
th year) from the first
disposal (or incineration), which is the last year of the
period p .
(3) EGelec,p
Quantity of electricity
generated by the project
facility during the period p
MWh/p Option B or CElectricity meter
If all of the generated electricity by the project facitity
other than the electricity used for itself is sold and the
project facility consumes only electricity generated by
itself and/or purchased, the option B is apllied and the
invoice for the sold electricity is used.
In other cases, the option C is applied and the quantity
of electricity generated by the project facility is
measured by the electricity meter. The meter is
replaced or calibrated at an interval following the
regulations in the country in which the meter is
commonly used or according to the manufacturer’s
recommendation, unless a type approval,
manufacturer’s specification, or certification issued by
an entity accredited under international/national
standards for the electricity meter has been prepared
Continuously
(4) ECp
Quantity of electricity
consumed by the project
facility during the period p
MWh/p Option B or CElectricity meter
If all of the generated electricity by the project facitity
other than the electricity used for itself is sold and the
project facility consumes only electricity generated by
itself and/or purchased, the option B is apllied and the
invoice for the purchased electricity is used.
In other cases, the option C is applied and the quantity
of electricity consumed by the project facility is
measured by the electricity meter. The meter is
replaced or calibrated at an interval following the
regulations in the country in which the meter is
commonly used or according to the manufacturer’s
recommendation, unless a type approval,
manufacturer’s specification, or certification issued by
an entity accredited under international/national
standards for the electricity meter has been prepared
Continuously
(5) FCfuel,pQuantity of fuel combusted
during the period pkL or m
3/p Option C Volume meters
The quantity of fuel combusted is measured by a flow
meter. The meter is replaced or calibrated at an
interval following the regulations in the country in
which the meter is commonly used or according to the
manufacturer’s recommendation, unless a type
approval, manufacturer’s specification, or certification
issued by an entity accredited under
international/national standards for the flow meter has
been prepared by the time of installation.
Continuously
Table 2: Project-specific parameters to be fixed ex ante
(a) (c) (d)
ParametersEstimated
ValuesUnits
MCF Fraction
ppaper
ptextiles
pfood
pwood
pgarden
pnappies
prubber
pplastics
pmetal
pglass
pother
EFelec
tCO2e/M
Wh
(b)
Description of data
Fraction of the waste type "Rubber and
leather"
Fraction of the waste type "Metal"
Methane correction factor
Emission factor for electricity generation
When the project facility displaces and consumes only grid electricity or captive
electricity, the project participant applies the CO2 emission factor respectively.
When the project facility may displace and consume both grid electricity and captive
electricity, the project participant applies the CO2 emission factor with lower value.
[CO2 emission factor]
For grid electricity: The most recent value available at the time of validation from
“Emission Factors of Electricity Interconnection Systems”, National Committee on
Clean Development Mechanism (Indonesian DNA for CDM), based on data obtained
by Directorate General of Electricity, Ministry of Energy and Mineral Resources,
Indonesia, is applied unless otherwise instructed by the Joint Committee.
For captive electricity: The most recent value available from CDM approved small scale
methodology AMS-I.A at the time of validation is applied.
Fraction of the waste type "Nappies"
Fraction of the waste type "Wood"
Fraction of the waste type
"Paper/cardboard"
(f)
Other comments
(e)
Source of data
Select one of the followings taking into consideration the situation of the project.
Estimate using the equation in the methodology or select the applicable value from the
following: 1.0, 0.5, 0.8 or 0.4.
Fraction of the waste type "Garden and
park waste"
Fraction of the waste type "Other, inert
waste"
Fraction of the waste type "Glass"
Fraction of the waste type "Plastics"
Fraction of the waste type "Textiles"
Weight
fraction
Before the validation of a proposed project, take at least one sample in each season
(both rainy and dry) from MSW transported to a SWDS within the same municipality
where the project facility is to be constructed, weigh each waste fraction (measure on
wet basis) taking into consideration of the waste type j , as provided in the table for
FCC j and FFC j , and average each waste fraction j among the samples.
Fraction of the waste type "Food waste"
9-15

DC %
EFN2O
tN2O/t
waste wet
basis
NCVfuel GJ/kL or m3
EFCO2,fuel tCO2/GJ
Table3: Ex-ante estimation of CO2 emission reductions
Units
tCO2/p
[Monitoring option]
Option A
Option B
Option C
CO2 emission reductions
0
Based on public data which is measured by entities other than the project participants (Data used: publicly recognized data such as statistical data and specifications)
Dry matter content of MSW
Emission factor for N2O associated with
incineration
Select one from the following default values taking into consideration the situation of
the project.
Default values for EFN2O:
Type of waste/ Technology/Management practice/ EFN2O [tN2O/t waste wet basis]
MSW/ Continuous and semicontinuous incinerators/ 1.21*50*10-6
MSW/ Batch-type incinerators/ 1.21*60*10-6
Based on the amount of transaction which is measured directly using measuring equipments (Data used: commercial evidence such as invoices)
CO2 emission factor of fuelSelect a value for the fuel combusted by the project from the IPCC default values at
the upper limit of the uncertainty at a 95% confidence interval.
Based on the actual measurement using measuring equipments (Data used: measured values)
Net calorific value of fuel
Before the validation of a proposed project, take at least one sample in each season
(both rainy and dry) from MSW transported to a SWDS within the same municipality
where the project facility is to be constructed, weigh each sample in wet and dry basis,
calculate the fraction of dry matter content for each sample, and average the values
obtained.
Decide from the specifications described on invoices or other commercial/contractual
evidence.
9-16
JCM_ID_F_PMS_ver01.0
JCM Proposed Methodology Spreadsheet Form (Input Sheet) [Attachment to Proposed Methodology Form]
Table 1: Parameters to be monitored ex post
(a)Monitoring point
No.(1)
(b) Parameters W i
(c) Description of data Quantity of MSW fed into incinerator in the year i
(e) Units t
(f) Monitoring option Option C
(g) Source of data Measuring apparatus
(h)
Measurement
methods and
procedures
Amount of MSW to be incinerated is measured on wet basis by a measuring
apparatus which is equipped to conveying equipment for the incinerator such as
hopper, crane and conveyor.
Measured continuously and aggregated anually for the year i .
(i)Monitoring
frequencyContinuously
(j) Other comments
(d) Estimated Values
Year 1
Year 2
Year 3
Year 4
Year 5
Year 6
Year 7
Year 8
Year 9
Year 10
Year 11
Year 12
Year 13
Year 14
Year 15
Year 16
Year 17
Year 18
9-17
JCM_ID_F_PMS_ver01.0
1. Calculations for emission reductions Fuel type Value Units Parameter
Emission reductions during the period p 0.0 tCO2/p ERp
2. Selected default values, etc.
Methane correction factor 0 Fraction MCF
Emission factor for N2O associated with incineration 0 tN2O/t waste wet basis EFN2O
3. Calculations for reference emissions
Reference emissions during the period p 0.0 tCO2/p REp
- 0.0 tCO2e/p RECH4,p
Electricity 0.0 tCO2e/p REelec,p
4. Calculations of the project emissions
Project emissions during the period p 0.0 tCO2/p PEp
- 0.0 tCO2e/p PECOM_CO2,p
- 0.0 tCO2e/p PECOM_N2O,p
Electricity 0.0 tCO2e/p PEEC,p
- 0.0 tCO2e/p PEFC,p
Project emissions of N2O from combustion of waste
associated with incineration during the period p
Project emissions from electricity consumption by the project
facility during the period p
Project emissions from auxiliary fossil fuel consumption
associated with incineration during the period p
JCM Proposed Methodology Spreadsheet Form (Calculation Process Sheet)
[Attachment to Proposed Methodology Form]
Reference emissions from electricity generation during the
period p
Reference emissions from decomposition of MSW at the
SWDS during the period p
Project emissions of CO2 from combustion of fossil carbon
contained in waste associated with incineration during the
period p
9-18
[List of Default Values]
Default values for calculating RE CH4,p other than DOC j and k j
Description Value Units Parameter
Model correction factor to account for model
uncertainties0.80 - φ
Fraction of methane captured at the SWDS and
flared, combusted or used in another manner that
prevents the emissions of methane to the
atmosphere
0 - f
Global Warming Potential of methane 25 tCO2e/tCH4 GWPCH4
Oxidation factor 0.1 - OX
Fraction of methane in the SWDS gas (volume fraction) 0.5 volume fraction F
Fraction of degradable organic carbon (DOC) that
decomposes under the specific conditions occurring
in the SWDS
0.5 weight fraction DOCf
Fraction of degradable organic carbon in the waste type j
Waste type j DOCj Units
Wood and wood products 43 % wet waste
Pulp, paper and cardboard (other than sludge) 40 % wet waste
Food, food waste, beverages and tobacco (other
than sludge)15 % wet waste
Textiles 24 % wet waste
Garden, yard and park waste 20 % wet waste
Nappies 24 % wet waste
Glass, plastic, metal, other inert waste 0 % wet waste
Sludge 5 % wet waste
Decay rate for the waste type j
Waste type j kj Units
Slowly degrading:
Pulp, paper, cardboard (other than sludge), textiles0.07 1/yr
Slowly degrading:
Wood, wood products and straw0.035 1/yr
Moderately degrading:
Other (nonfood) organic putrescible garden and
park waste
0.17 1/yr
Rapidly degrading:
Food, food waste, sewage sludge, beverages and
tobacco
0.4 1/yr
Fraction of total carbon content in waste type j
Waste type j FCCj Units
Paper/cardboard 50 % dry waste
Textiles 50 % dry waste
Food waste 50 % dry waste
Wood 54 % dry waste
Garden and Park waste 55 % dry waste
Nappies 90 % dry waste
Rubber and Leather 67 % dry waste
Plastics 85 % dry waste
9-19
Metal* NA % dry waste
Glass* NA % dry waste
Other, inert waste 5 % dry waste
Fraction of fossil carbon in total carbon content of waste type j
Waste type j FFCj Units
Paper/cardboard 5 %
Textiles 50 %
Food waste - %
Wood - %
Garden and Park waste 0 %
Nappies 10 %
Rubber and Leather 20 %
Plastics 100 %
Metal* NA %
Glass* NA %
Other, inert waste 100 %
Default values for calculating project emissions
Description Value Units Parameter
Combustion efficiency of incinerator (fraction) 1 - EFFCOM
Global Warming Potential of nitrous oxide 298 tCO2e/tN2O GWPN2O
Default values for emission factor for N2O associated with incineration
Waste / Technology/Management practice EFN2O Units
MSW/ Continuous and semicontinuous incinerators 6.05E-05 tN2O/t waste wet basis
MSW/ Batch-type incinerators 7.26E-05 tN2O/t waste wet basis
9-20
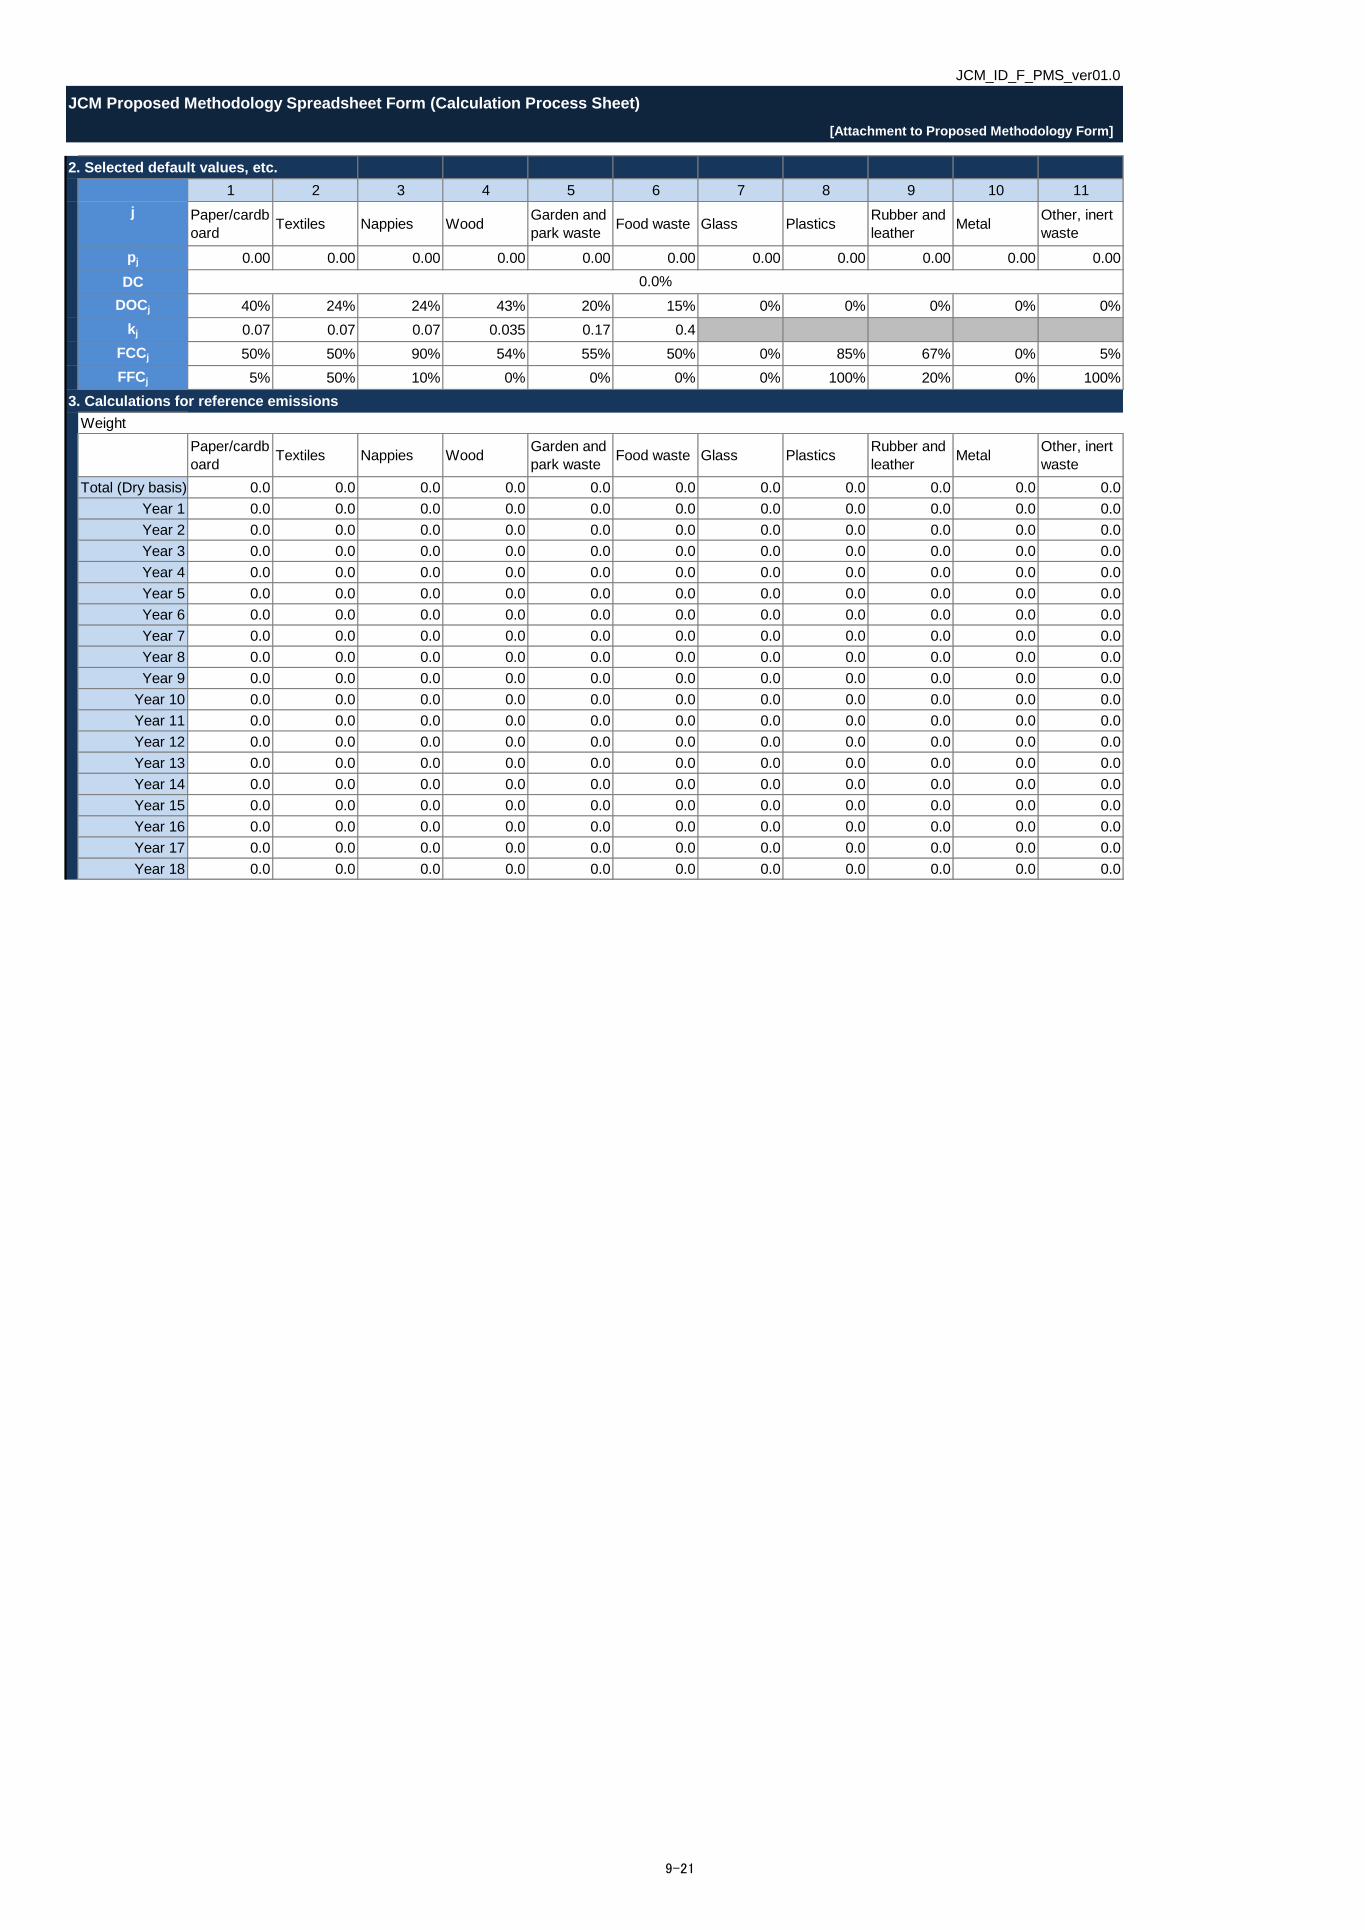
JCM_ID_F_PMS_ver01.0
JCM Proposed Methodology Spreadsheet Form (Calculation Process Sheet)
2. Selected default values, etc.
1 2 3 4 5 6 7 8 9 10 11
Paper/cardb
oardTextiles Nappies Wood
Garden and
park wasteFood waste Glass Plastics
Rubber and
leatherMetal
Other, inert
waste
pj 0.00 0.00 0.00 0.00 0.00 0.00 0.00 0.00 0.00 0.00 0.00
DC
DOCj 40% 24% 24% 43% 20% 15% 0% 0% 0% 0% 0%
kj 0.07 0.07 0.07 0.035 0.17 0.4
FCCj 50% 50% 90% 54% 55% 50% 0% 85% 67% 0% 5%
FFCj 5% 50% 10% 0% 0% 0% 0% 100% 20% 0% 100%
3. Calculations for reference emissions
Weight
Paper/cardb
oardTextiles Nappies Wood
Garden and
park wasteFood waste Glass Plastics
Rubber and
leatherMetal
Other, inert
waste
Total (Dry basis) 0.0 0.0 0.0 0.0 0.0 0.0 0.0 0.0 0.0 0.0 0.0
Year 1 0.0 0.0 0.0 0.0 0.0 0.0 0.0 0.0 0.0 0.0 0.0
Year 2 0.0 0.0 0.0 0.0 0.0 0.0 0.0 0.0 0.0 0.0 0.0
Year 3 0.0 0.0 0.0 0.0 0.0 0.0 0.0 0.0 0.0 0.0 0.0
Year 4 0.0 0.0 0.0 0.0 0.0 0.0 0.0 0.0 0.0 0.0 0.0
Year 5 0.0 0.0 0.0 0.0 0.0 0.0 0.0 0.0 0.0 0.0 0.0
Year 6 0.0 0.0 0.0 0.0 0.0 0.0 0.0 0.0 0.0 0.0 0.0
Year 7 0.0 0.0 0.0 0.0 0.0 0.0 0.0 0.0 0.0 0.0 0.0
Year 8 0.0 0.0 0.0 0.0 0.0 0.0 0.0 0.0 0.0 0.0 0.0
Year 9 0.0 0.0 0.0 0.0 0.0 0.0 0.0 0.0 0.0 0.0 0.0
Year 10 0.0 0.0 0.0 0.0 0.0 0.0 0.0 0.0 0.0 0.0 0.0
Year 11 0.0 0.0 0.0 0.0 0.0 0.0 0.0 0.0 0.0 0.0 0.0
Year 12 0.0 0.0 0.0 0.0 0.0 0.0 0.0 0.0 0.0 0.0 0.0
Year 13 0.0 0.0 0.0 0.0 0.0 0.0 0.0 0.0 0.0 0.0 0.0
Year 14 0.0 0.0 0.0 0.0 0.0 0.0 0.0 0.0 0.0 0.0 0.0
Year 15 0.0 0.0 0.0 0.0 0.0 0.0 0.0 0.0 0.0 0.0 0.0
Year 16 0.0 0.0 0.0 0.0 0.0 0.0 0.0 0.0 0.0 0.0 0.0
Year 17 0.0 0.0 0.0 0.0 0.0 0.0 0.0 0.0 0.0 0.0 0.0
Year 18 0.0 0.0 0.0 0.0 0.0 0.0 0.0 0.0 0.0 0.0 0.0
[Attachment to Proposed Methodology Form]
j
0.0%
9-21

DOC
Slowly
degrading:
Pulp, paper,
cardboard
(other than
sludge),
textiles
Slowly
degrading:
Wood,
wood
products
and straw
Moderately
degrading:
Other
(nonfood)
organic
putrescible
garden and
park waste
Rapidly
degrading:
Food, food
waste,
sewage
sludge,
beverages
and tobacco
Year 1 0.0 0.0 0.0 0.0
Year 2 0.0 0.0 0.0 0.0
Year 3 0.0 0.0 0.0 0.0
Year 4 0.0 0.0 0.0 0.0
Year 5 0.0 0.0 0.0 0.0
Year 6 0.0 0.0 0.0 0.0
Year 7 0.0 0.0 0.0 0.0
Year 8 0.0 0.0 0.0 0.0
Year 9 0.0 0.0 0.0 0.0
Year 10 0.0 0.0 0.0 0.0
Year 11 0.0 0.0 0.0 0.0
Year 12 0.0 0.0 0.0 0.0
Year 13 0.0 0.0 0.0 0.0
Year 14 0.0 0.0 0.0 0.0
Year 15 0.0 0.0 0.0 0.0
Year 16 0.0 0.0 0.0 0.0
Year 17 0.0 0.0 0.0 0.0
Year 18 0.0 0.0 0.0 0.0
9-22

Decayed DOC
y
Slowly
degrading:
Pulp, paper,
cardboard
(other than
sludge),
textiles
Slowly
degrading:
Wood,
wood
products
and straw
Moderately
degrading:
Other
(nonfood)
organic
putrescible
garden and
park waste
Rapidly
degrading:
Food, food
waste,
sewage
sludge,
beverages
and tobacco
Subtotal Total
The Nth year
from the
first
disposal (or
incineration)
, extending
from the
first year of
the period p
(y =p_start )
to the last
year of the
period p
(y =p_end )
Total for the
monitoring
period
Year 1 0.0 0.0 0.0 0.0 0.0 0.0 0 0.0
Year 2 0.0 0.0 0.0 0.0 0.0 0
Year 3 0.0 0.0 0.0 0.0 0.0 0
Year 4 0.0 0.0 0.0 0.0 0.0 0
Year 5 0.0 0.0 0.0 0.0 0.0 0
Year 6 0.0 0.0 0.0 0.0 0.0 0
Year 7 0.0 0.0 0.0 0.0 0.0 0
Year 8 0.0 0.0 0.0 0.0 0.0 0
Year 9 0.0 0.0 0.0 0.0 0.0 0
Year 10 0.0 0.0 0.0 0.0 0.0 0
Year 11 0.0 0.0 0.0 0.0 0.0 0
Year 12 0.0 0.0 0.0 0.0 0.0 0
Year 13 0.0 0.0 0.0 0.0 0.0 0
Year 14 0.0 0.0 0.0 0.0 0.0 0
Year 15 0.0 0.0 0.0 0.0 0.0 0
Year 16 0.0 0.0 0.0 0.0 0.0 0
Year 17 0.0 0.0 0.0 0.0 0.0 0
Year 18 0.0 0.0 0.0 0.0 0.0 0
9-23
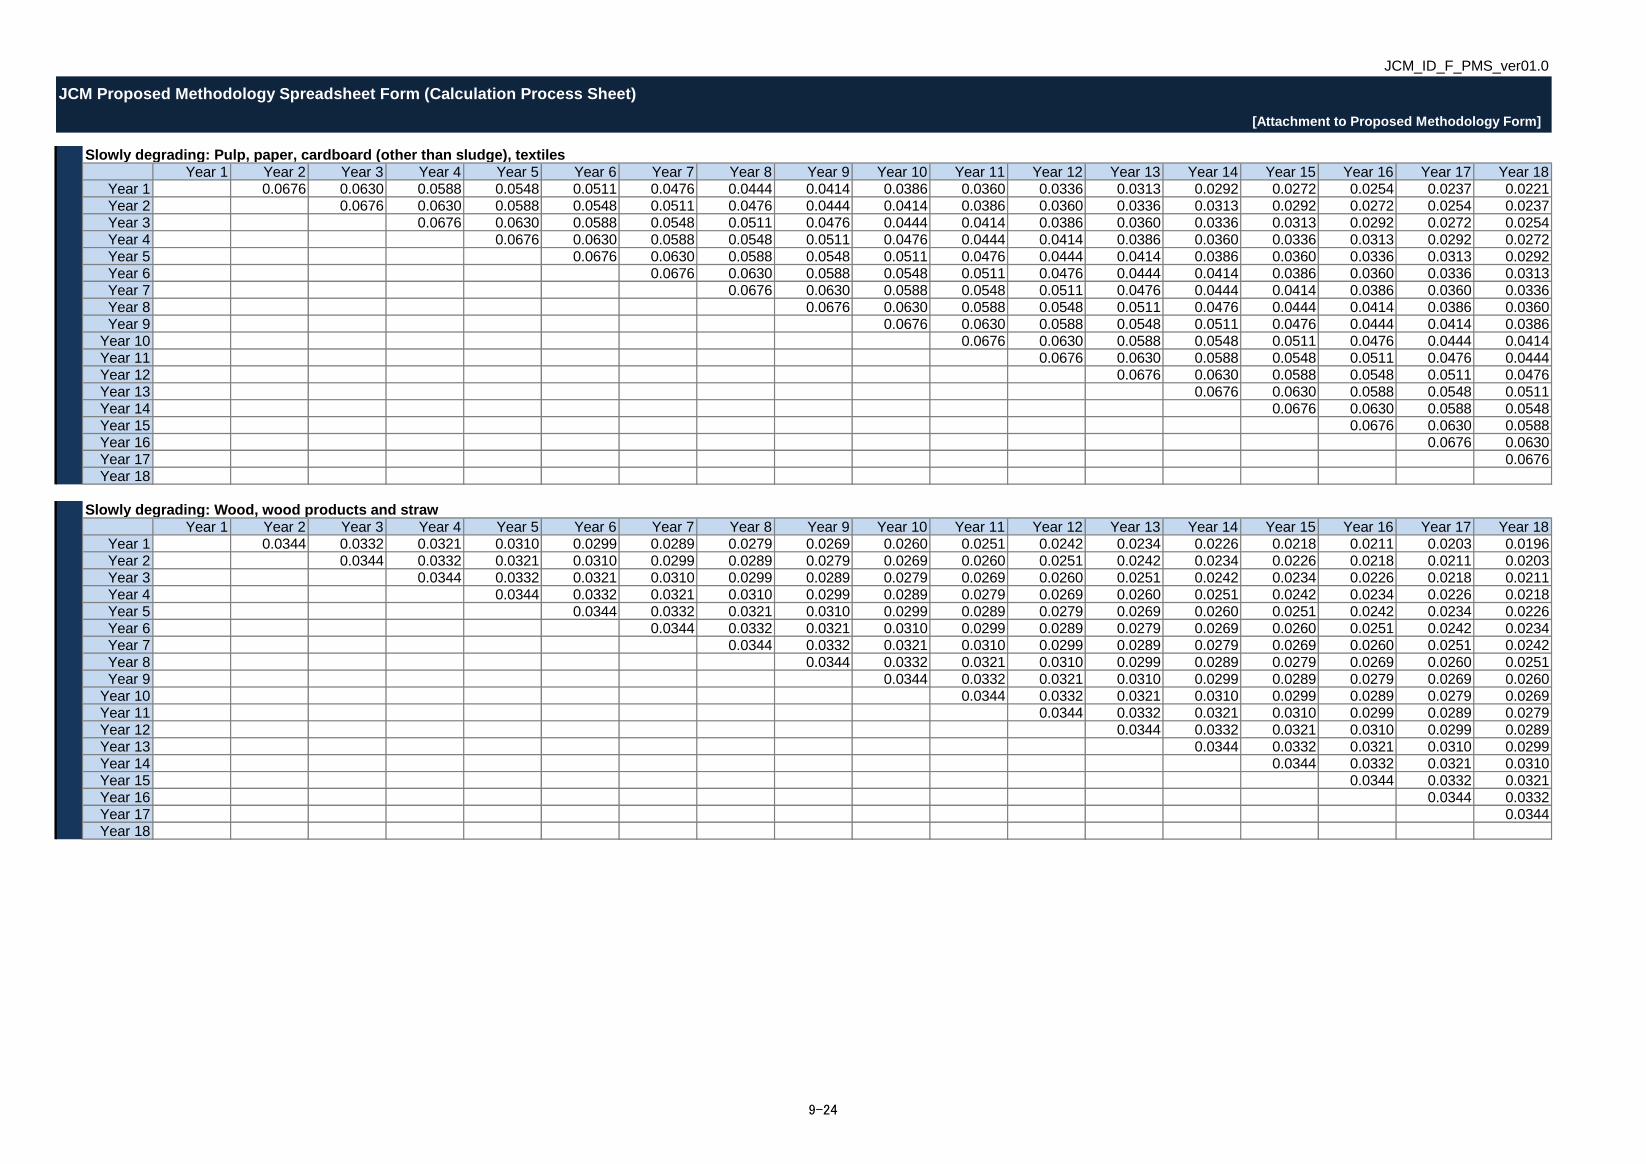
JCM_ID_F_PMS_ver01.0
JCM Proposed Methodology Spreadsheet Form (Calculation Process Sheet)
Slowly degrading: Pulp, paper, cardboard (other than sludge), textiles
Year 1 Year 2 Year 3 Year 4 Year 5 Year 6 Year 7 Year 8 Year 9 Year 10 Year 11 Year 12 Year 13 Year 14 Year 15 Year 16 Year 17 Year 18Year 1 0.0676 0.0630 0.0588 0.0548 0.0511 0.0476 0.0444 0.0414 0.0386 0.0360 0.0336 0.0313 0.0292 0.0272 0.0254 0.0237 0.0221Year 2 0.0676 0.0630 0.0588 0.0548 0.0511 0.0476 0.0444 0.0414 0.0386 0.0360 0.0336 0.0313 0.0292 0.0272 0.0254 0.0237Year 3 0.0676 0.0630 0.0588 0.0548 0.0511 0.0476 0.0444 0.0414 0.0386 0.0360 0.0336 0.0313 0.0292 0.0272 0.0254Year 4 0.0676 0.0630 0.0588 0.0548 0.0511 0.0476 0.0444 0.0414 0.0386 0.0360 0.0336 0.0313 0.0292 0.0272Year 5 0.0676 0.0630 0.0588 0.0548 0.0511 0.0476 0.0444 0.0414 0.0386 0.0360 0.0336 0.0313 0.0292Year 6 0.0676 0.0630 0.0588 0.0548 0.0511 0.0476 0.0444 0.0414 0.0386 0.0360 0.0336 0.0313Year 7 0.0676 0.0630 0.0588 0.0548 0.0511 0.0476 0.0444 0.0414 0.0386 0.0360 0.0336Year 8 0.0676 0.0630 0.0588 0.0548 0.0511 0.0476 0.0444 0.0414 0.0386 0.0360Year 9 0.0676 0.0630 0.0588 0.0548 0.0511 0.0476 0.0444 0.0414 0.0386
Year 10 0.0676 0.0630 0.0588 0.0548 0.0511 0.0476 0.0444 0.0414Year 11 0.0676 0.0630 0.0588 0.0548 0.0511 0.0476 0.0444Year 12 0.0676 0.0630 0.0588 0.0548 0.0511 0.0476Year 13 0.0676 0.0630 0.0588 0.0548 0.0511Year 14 0.0676 0.0630 0.0588 0.0548Year 15 0.0676 0.0630 0.0588Year 16 0.0676 0.0630Year 17 0.0676Year 18
Slowly degrading: Wood, wood products and straw
Year 1 Year 2 Year 3 Year 4 Year 5 Year 6 Year 7 Year 8 Year 9 Year 10 Year 11 Year 12 Year 13 Year 14 Year 15 Year 16 Year 17 Year 18Year 1 0.0344 0.0332 0.0321 0.0310 0.0299 0.0289 0.0279 0.0269 0.0260 0.0251 0.0242 0.0234 0.0226 0.0218 0.0211 0.0203 0.0196Year 2 0.0344 0.0332 0.0321 0.0310 0.0299 0.0289 0.0279 0.0269 0.0260 0.0251 0.0242 0.0234 0.0226 0.0218 0.0211 0.0203Year 3 0.0344 0.0332 0.0321 0.0310 0.0299 0.0289 0.0279 0.0269 0.0260 0.0251 0.0242 0.0234 0.0226 0.0218 0.0211Year 4 0.0344 0.0332 0.0321 0.0310 0.0299 0.0289 0.0279 0.0269 0.0260 0.0251 0.0242 0.0234 0.0226 0.0218Year 5 0.0344 0.0332 0.0321 0.0310 0.0299 0.0289 0.0279 0.0269 0.0260 0.0251 0.0242 0.0234 0.0226Year 6 0.0344 0.0332 0.0321 0.0310 0.0299 0.0289 0.0279 0.0269 0.0260 0.0251 0.0242 0.0234Year 7 0.0344 0.0332 0.0321 0.0310 0.0299 0.0289 0.0279 0.0269 0.0260 0.0251 0.0242Year 8 0.0344 0.0332 0.0321 0.0310 0.0299 0.0289 0.0279 0.0269 0.0260 0.0251Year 9 0.0344 0.0332 0.0321 0.0310 0.0299 0.0289 0.0279 0.0269 0.0260
Year 10 0.0344 0.0332 0.0321 0.0310 0.0299 0.0289 0.0279 0.0269Year 11 0.0344 0.0332 0.0321 0.0310 0.0299 0.0289 0.0279Year 12 0.0344 0.0332 0.0321 0.0310 0.0299 0.0289Year 13 0.0344 0.0332 0.0321 0.0310 0.0299Year 14 0.0344 0.0332 0.0321 0.0310Year 15 0.0344 0.0332 0.0321Year 16 0.0344 0.0332Year 17 0.0344Year 18
[Attachment to Proposed Methodology Form]
9-24
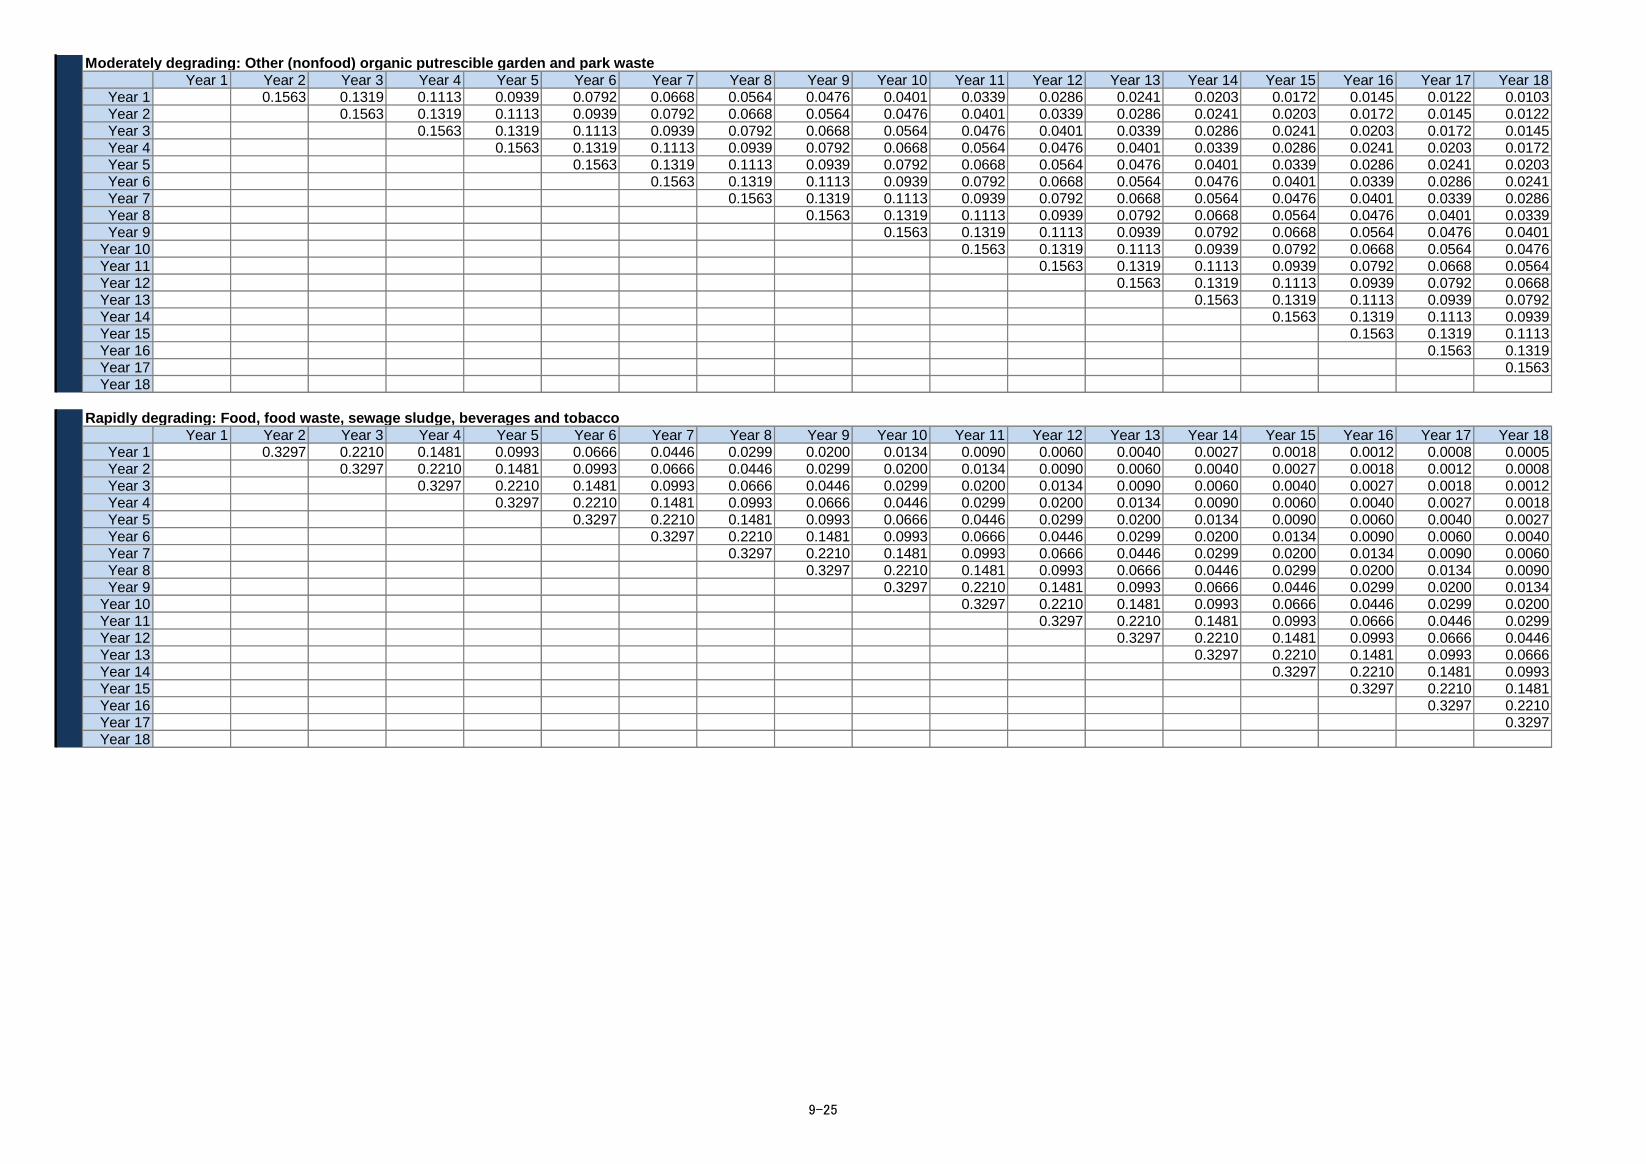
Moderately degrading: Other (nonfood) organic putrescible garden and park waste
Year 1 Year 2 Year 3 Year 4 Year 5 Year 6 Year 7 Year 8 Year 9 Year 10 Year 11 Year 12 Year 13 Year 14 Year 15 Year 16 Year 17 Year 18Year 1 0.1563 0.1319 0.1113 0.0939 0.0792 0.0668 0.0564 0.0476 0.0401 0.0339 0.0286 0.0241 0.0203 0.0172 0.0145 0.0122 0.0103Year 2 0.1563 0.1319 0.1113 0.0939 0.0792 0.0668 0.0564 0.0476 0.0401 0.0339 0.0286 0.0241 0.0203 0.0172 0.0145 0.0122Year 3 0.1563 0.1319 0.1113 0.0939 0.0792 0.0668 0.0564 0.0476 0.0401 0.0339 0.0286 0.0241 0.0203 0.0172 0.0145Year 4 0.1563 0.1319 0.1113 0.0939 0.0792 0.0668 0.0564 0.0476 0.0401 0.0339 0.0286 0.0241 0.0203 0.0172Year 5 0.1563 0.1319 0.1113 0.0939 0.0792 0.0668 0.0564 0.0476 0.0401 0.0339 0.0286 0.0241 0.0203Year 6 0.1563 0.1319 0.1113 0.0939 0.0792 0.0668 0.0564 0.0476 0.0401 0.0339 0.0286 0.0241Year 7 0.1563 0.1319 0.1113 0.0939 0.0792 0.0668 0.0564 0.0476 0.0401 0.0339 0.0286Year 8 0.1563 0.1319 0.1113 0.0939 0.0792 0.0668 0.0564 0.0476 0.0401 0.0339Year 9 0.1563 0.1319 0.1113 0.0939 0.0792 0.0668 0.0564 0.0476 0.0401
Year 10 0.1563 0.1319 0.1113 0.0939 0.0792 0.0668 0.0564 0.0476Year 11 0.1563 0.1319 0.1113 0.0939 0.0792 0.0668 0.0564Year 12 0.1563 0.1319 0.1113 0.0939 0.0792 0.0668Year 13 0.1563 0.1319 0.1113 0.0939 0.0792Year 14 0.1563 0.1319 0.1113 0.0939Year 15 0.1563 0.1319 0.1113Year 16 0.1563 0.1319Year 17 0.1563Year 18
Rapidly degrading: Food, food waste, sewage sludge, beverages and tobacco
Year 1 Year 2 Year 3 Year 4 Year 5 Year 6 Year 7 Year 8 Year 9 Year 10 Year 11 Year 12 Year 13 Year 14 Year 15 Year 16 Year 17 Year 18Year 1 0.3297 0.2210 0.1481 0.0993 0.0666 0.0446 0.0299 0.0200 0.0134 0.0090 0.0060 0.0040 0.0027 0.0018 0.0012 0.0008 0.0005Year 2 0.3297 0.2210 0.1481 0.0993 0.0666 0.0446 0.0299 0.0200 0.0134 0.0090 0.0060 0.0040 0.0027 0.0018 0.0012 0.0008Year 3 0.3297 0.2210 0.1481 0.0993 0.0666 0.0446 0.0299 0.0200 0.0134 0.0090 0.0060 0.0040 0.0027 0.0018 0.0012Year 4 0.3297 0.2210 0.1481 0.0993 0.0666 0.0446 0.0299 0.0200 0.0134 0.0090 0.0060 0.0040 0.0027 0.0018Year 5 0.3297 0.2210 0.1481 0.0993 0.0666 0.0446 0.0299 0.0200 0.0134 0.0090 0.0060 0.0040 0.0027Year 6 0.3297 0.2210 0.1481 0.0993 0.0666 0.0446 0.0299 0.0200 0.0134 0.0090 0.0060 0.0040Year 7 0.3297 0.2210 0.1481 0.0993 0.0666 0.0446 0.0299 0.0200 0.0134 0.0090 0.0060Year 8 0.3297 0.2210 0.1481 0.0993 0.0666 0.0446 0.0299 0.0200 0.0134 0.0090Year 9 0.3297 0.2210 0.1481 0.0993 0.0666 0.0446 0.0299 0.0200 0.0134
Year 10 0.3297 0.2210 0.1481 0.0993 0.0666 0.0446 0.0299 0.0200Year 11 0.3297 0.2210 0.1481 0.0993 0.0666 0.0446 0.0299Year 12 0.3297 0.2210 0.1481 0.0993 0.0666 0.0446Year 13 0.3297 0.2210 0.1481 0.0993 0.0666Year 14 0.3297 0.2210 0.1481 0.0993Year 15 0.3297 0.2210 0.1481Year 16 0.3297 0.2210Year 17 0.3297Year 18
9-25
10-1
Chapter 10 Future tasks and conclusions of the
Feasibility Study
This feasibility study is prepared for Feasibility Study of Joint Crediting Mechanism Project under City to
City collaboration by Clean Authority of TOKYO who has a capability of operation and maintenance of
Waste to Energy (WTE) Power plant in order to promote a recycling-oriented society and to realize most
appropriate urban waste combustion technology in Bali Province. The following is the summary of the
conclusion and the future tasks which should be resolved.
10.1 Future tasks
1) Power purchase agreement with PT. PLN
As stated in the Chapter 8, the fluctuation of the electricity tariff brings serious negative impact
on SPC’s project cash flow. The results of the comical feasibility study is feasible if the tariff of
electricity is guaranteed that is USDC 18.77 defined by” Minister degree 44” published by
Ministry of Energy and Mineral Resources. However, the electricity tariff is often determined
through negotiation between SPC and PT PLN, even the electricity tariff is defied in the law.
Therefore, the further clarification and/or improvement of flame work of Power purchase
agreement shall be required for realization of WTE project in Indonesia. The background of this
problem is that Indonesia has no regulation or special law concerning financial support to
renewable energy project, and there is no incentive for PLN to make a PPA contract by using
electricity tariff specified by the law. This is one of the major problems that prevent to promote
WTE project in Indonesia.
2) New presidential degree substituted for Presidential degree No.18
After this F/S is commenced, the “Presidential degree No.18 has been revoked by the order of
the Indonesian supreme court. We’ve confirmed from related Ministry that the related Ministry
is now preparing for alternative presidential degree in order to promote WTE project in
Indonesia. The following is the major problems on Presidential degree No.18 which should be
resolved by the new presidential degree.
1) The definition of the thermal treatment shall be specified
2) No guidance/instruction of the detailed selection (tender) process for thermal treatment of
MSW
3) Local government does not have enough knowledge concerning appropriate waste
combustion technology and official tender process
In order to realize WTE project not only Denpasar City but also in whole area of Indonesia, it is
10-2
essential to define the new presidential degree or related law having more clear guideline
explaining more detailed selection process and definition for combustion technology of MSW
to be introduced in Indonesia.
3) Financial support for Tipping Fee
As stated in Chapter 8, the economic feasibility study has been conducted under the assumption
that VGF will be applied to the WTE project in Denpasar City. By utilization of the financial
support or related subsidy such as VGF and JCM by Indonesian and Japanese Government, the
required Tipping Fee might be decreased as stated in Chapter 8. However, there are few PPP
Project applying VGF and the process of application of VGF is not still clear. In addition, the
establishment of the financial support for Tipping Fee borne by the local government greatly
contribute for realization of WTE project in Indonesia.
10.2 Conclusion
The conclusion of this feasibility study is that the WTE project in Denpasar is economically feasible if
the Presidential degree No.18 and Minister Degree 44 is applied and it is expected that the state of the art
technology developing from Japan can be utilized in order to realize a recycling-oriented society in
Indonesia. Since expected project scheme is BOT under 25 years operation period and from the point of
view of sustainable MSW treatment during the concession period, we conclude that the most appropriate
combustion technology applied to this project is “Stoker Furnace Technology” which is the most wildly
known as most proven technology for combustion of MSW.
Meanwhile, there is a serious concern that the realization of WTE project in Indonesia itself is now
threatened by the change in law concerning the above stated presidential degree No.18 and ministry degree
No. 44. We convince that an integrated strategic approach by the Japanese and Indonesian governments
with private sector will become increasingly important in order to overcome all difficulties and obstacles,
and to assist the establishment of the appropriate guideline and/or law related to “Feed in Tariff for
Renewable Energy Project” and “Introduction of Thermal Treatment Technology of MSW”.