wastewater treatment models: current developments & trends
TRANSCRIPT

1
Wastewater treatment models: Wastewater treatment models: Wastewater treatment models: Wastewater treatment models:
Current developments & trendsCurrent developments & trendsCurrent developments & trendsCurrent developments & trends
AnvändergruppAnvändergruppAnvändergruppAnvändergruppmodelleringmodelleringmodelleringmodellering ARVARVARVARV
Linköping, SwedenLinköping, SwedenLinköping, SwedenLinköping, Sweden
26 August 201426 August 201426 August 201426 August 2014Peter VANROLLEGHEMCanada Research Chairin Water Quality ModellingTable of ContentsTable of ContentsTable of ContentsTable of Contents
� Use of models in North-America
� New developments and trends
� Micropollutants
� Greenhouse gases
� Suspended solids
� Resource recovery (physicochemical models)
2
2
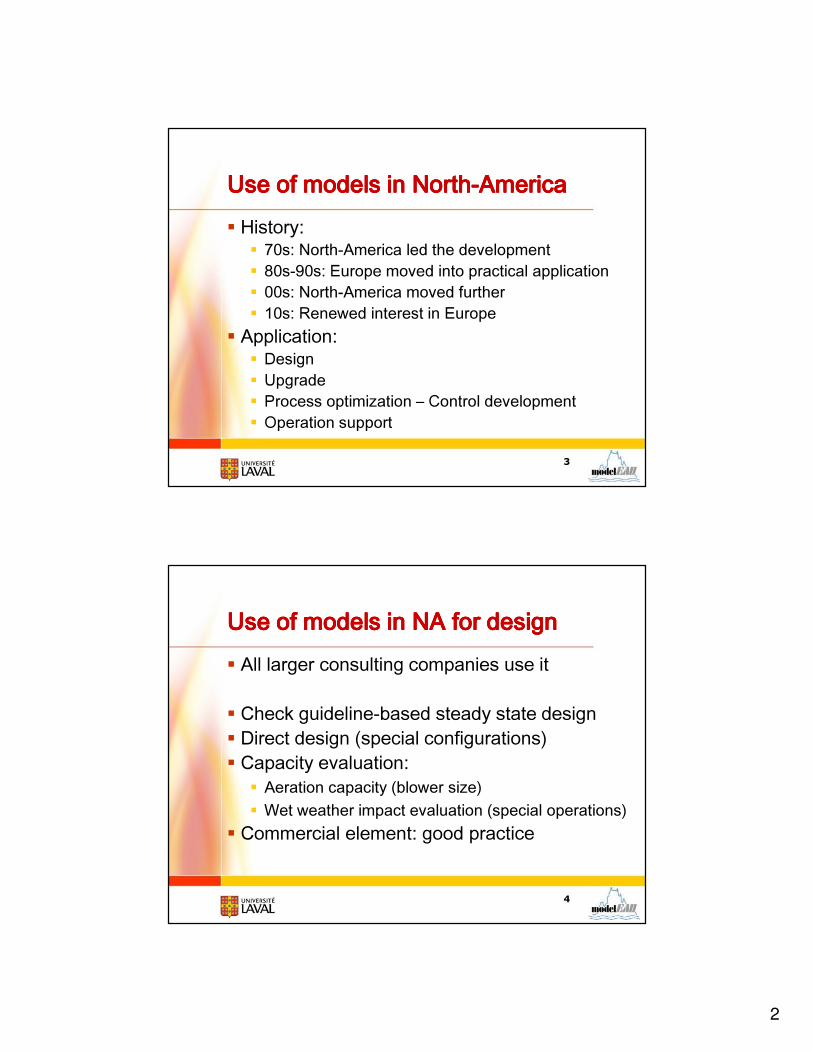
Use of Use of Use of Use of modelsmodelsmodelsmodels in in in in NorthNorthNorthNorth----AmericaAmericaAmericaAmerica
� History:� 70s: North-America led the development
� 80s-90s: Europe moved into practical application
� 00s: North-America moved further
� 10s: Renewed interest in Europe
� Application:� Design
� Upgrade
� Process optimization – Control development
� Operation support
3
Use of Use of Use of Use of modelsmodelsmodelsmodels in NA for designin NA for designin NA for designin NA for design
� All larger consulting companies use it
� Check guideline-based steady state design
� Direct design (special configurations)
� Capacity evaluation:
� Aeration capacity (blower size)
� Wet weather impact evaluation (special operations)
� Commercial element: good practice
4

3
Use of Use of Use of Use of modelsmodelsmodelsmodels in NA for designin NA for designin NA for designin NA for design
� Probabilistic design
5
Use of Use of Use of Use of modelsmodelsmodelsmodels in NA for designin NA for designin NA for designin NA for design
� Probabilistic versus traditional design
6
4
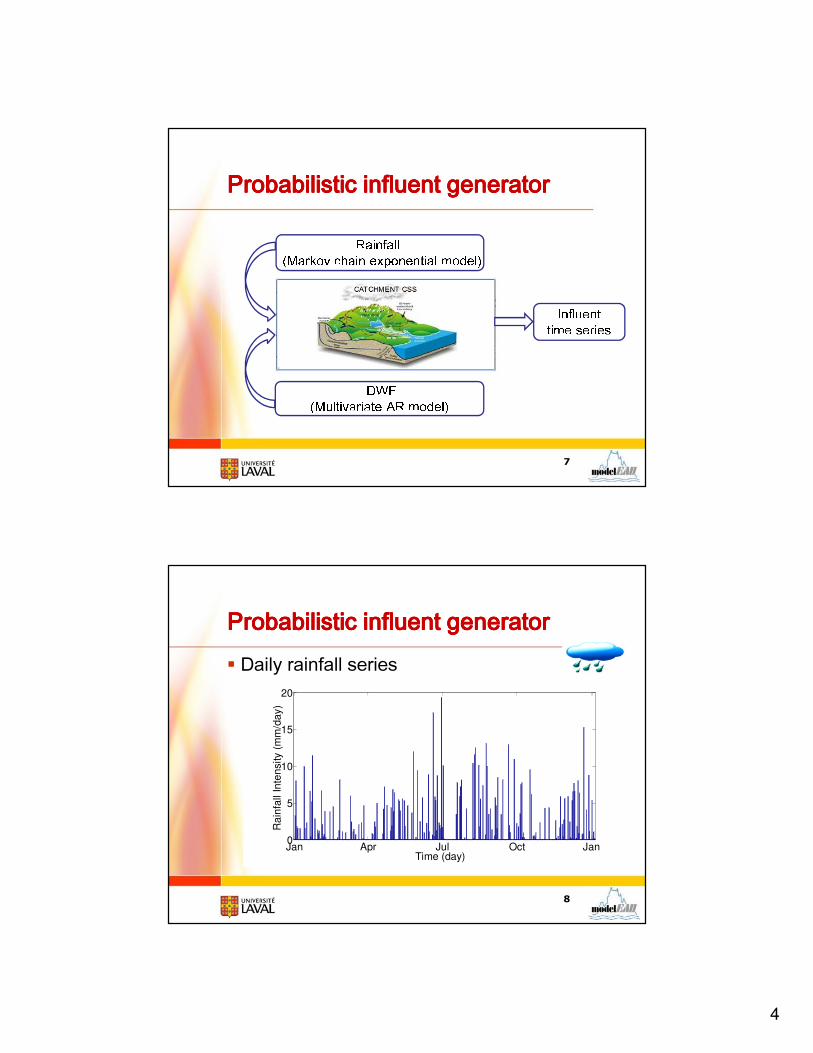
Probabilistic influent generatorProbabilistic influent generatorProbabilistic influent generatorProbabilistic influent generatorRainfall (Markov chain exponential model)DWF (Multivariate AR model)
Influenttime series7
Probabilistic influent generatorProbabilistic influent generatorProbabilistic influent generatorProbabilistic influent generator
� Daily rainfall series
Jan Apr Jul Oct Jan0
5
10
15
20
Time (day)
Ra
infa
ll In
ten
sity (
mm
/da
y)
8
5
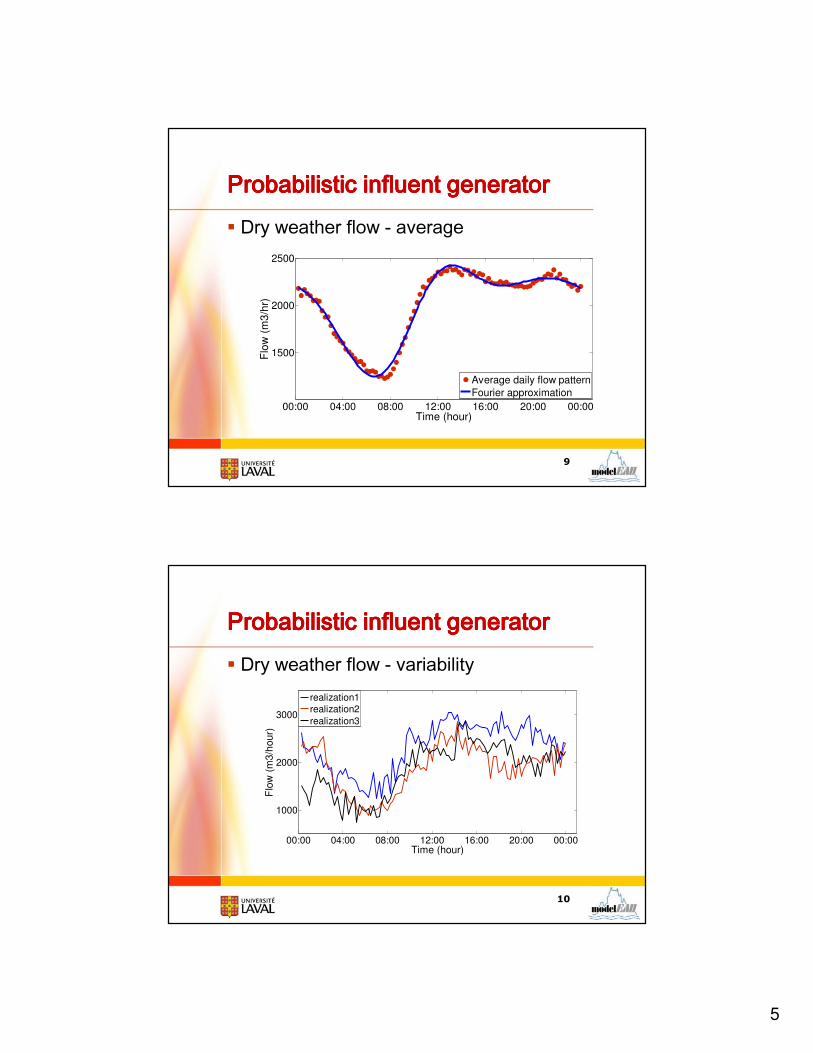
Probabilistic influent generatorProbabilistic influent generatorProbabilistic influent generatorProbabilistic influent generator
� Dry weather flow - average
9
00:00 04:00 08:00 12:00 16:00 20:00 00:00
1500
2000
2500
Time (hour)
Flo
w (
m3
/hr)
Average daily flow pattern
Fourier approximation
Probabilistic influent generatorProbabilistic influent generatorProbabilistic influent generatorProbabilistic influent generator
� Dry weather flow - variability
10
00:00 04:00 08:00 12:00 16:00 20:00 00:00
1000
2000
3000
Time (hour)
Flo
w (
m3/h
our)
realization1
realization2
realization3
6
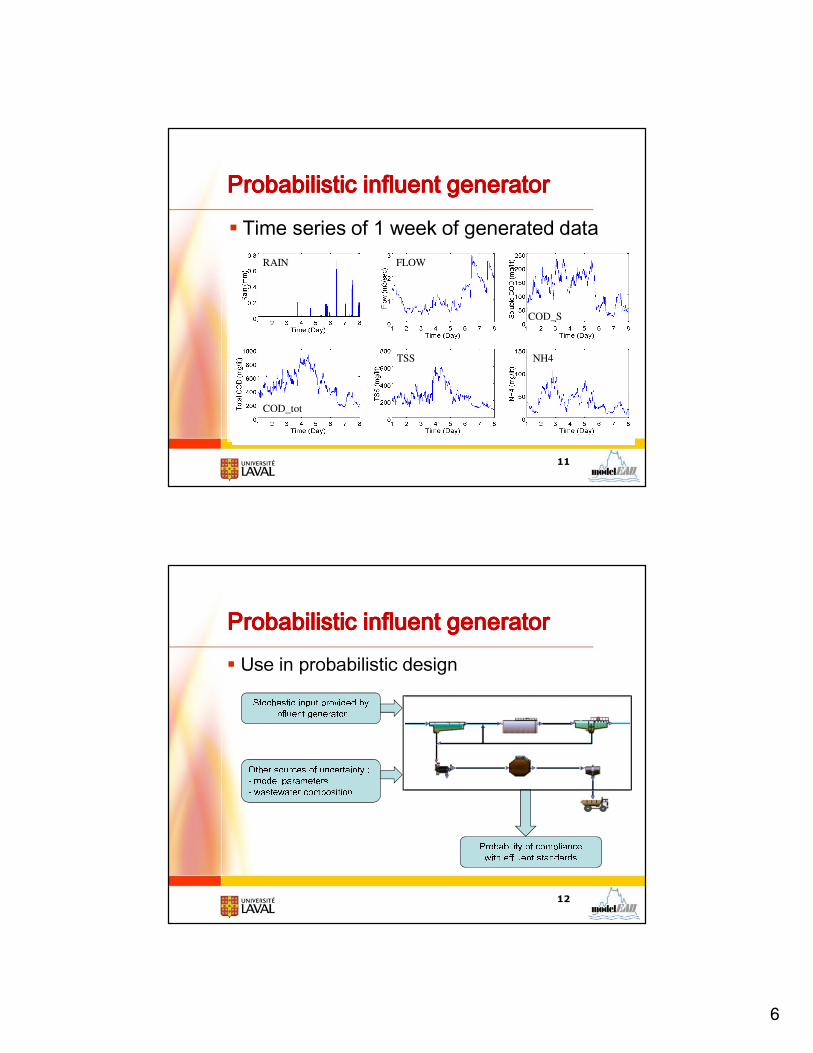
Probabilistic influent generatorProbabilistic influent generatorProbabilistic influent generatorProbabilistic influent generator
� Time series of 1 week of generated dataRainfall (Markov chain exponential model)DWF (Multivariate AR model)
WWFRAIN FLOW
COD_S
COD_tot
TSS NH4
RAIN FLOW
COD_S
COD_tot
TSS NH4
RAIN FLOW
COD_S
COD_tot
TSS NH4
11
Probabilistic influent generatorProbabilistic influent generatorProbabilistic influent generatorProbabilistic influent generator
� Use in probabilistic design
12
Stochastic input provided by influent generatorOther sources of uncertainty :- model parameters- wastewater composition Probability of compliance with effluent standards
7
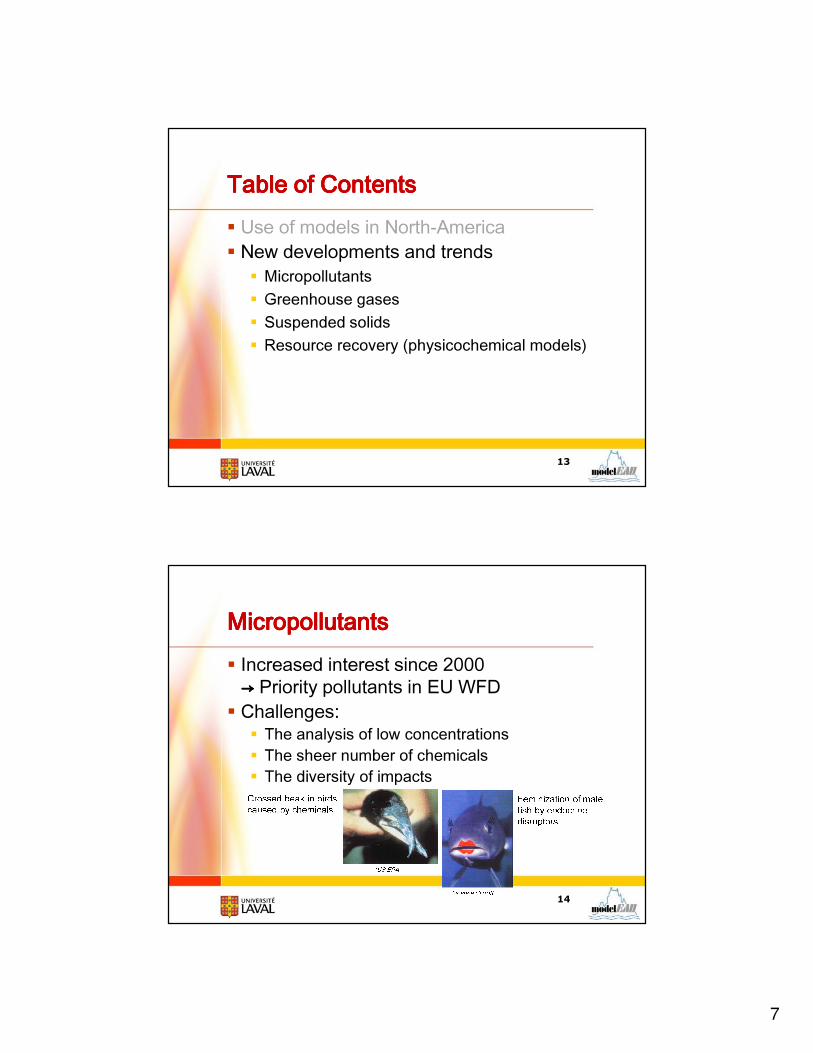
Table of ContentsTable of ContentsTable of ContentsTable of Contents
� Use of models in North-America
� New developments and trends
� Micropollutants
� Greenhouse gases
� Suspended solids
� Resource recovery (physicochemical models)
13
MicropollutantsMicropollutantsMicropollutantsMicropollutants
� Increased interest since 2000
→→→→ Priority pollutants in EU WFD
� Challenges:� The analysis of low concentrations
� The sheer number of chemicals
� The diversity of impacts
14
Feminization of male fish by endocrine disruptorsCrossed beak in birds caused by chemicals*Joanne Parrott*US EPA

8
MicropollutantsMicropollutantsMicropollutantsMicropollutants
� Increased interest since 2000
→→→→ priority pollutants in EU WFD
� Challenges:� The analysis of low concentrations
� The sheer number of chemicals
� The diversity of impacts
� The diversity of processes affecting them
� Studies at level of WWTP, but also at level of
integrated urban wastewater system (IUWS)
15
16
Unit model
Processes
Sew
er
Sto
rmw
ate
r unit
(wate
r)
Sto
rmw
ate
r unit
(sedim
ents
)
Prim
ary s
ettlin
g
Activ
ate
d s
ludge
tank
Secondary s
ettlin
g
Slu
dge th
ickener
Slu
dge a
naero
bic
dig
este
r
Slu
dge d
ew
ate
ring
Riv
er (w
ate
r)
Riv
er (s
edim
ents
)
Physical processes
Sedimentation + + + + + +
Resuspension + + +
Volatilization + + + + + + + + +
Sediment-water exchange + +
physicochemical
Adsorption-desorption + + + + + + + + + +
Hydrolysis + + + + + + + +
Photolysis + +
Biological
Aerobic biodegradation + + + + + + + + +
Anoxic biodegradation + + + + + + + + + +
9
17
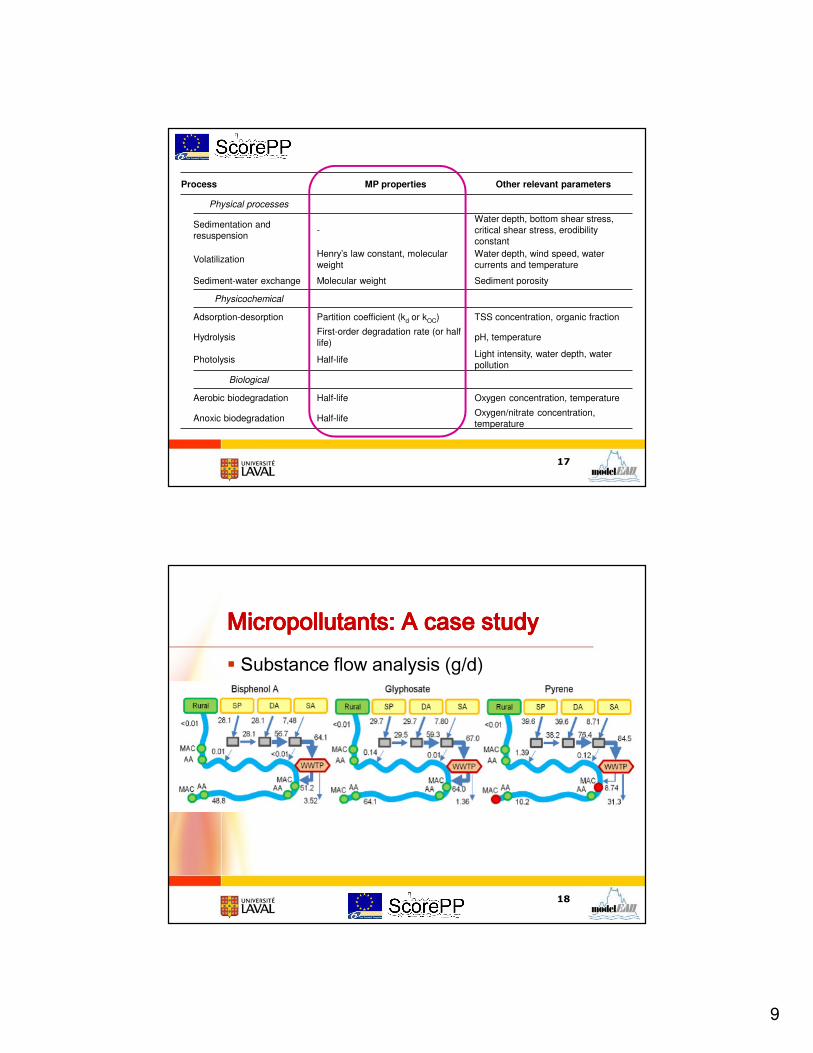
Process MP properties Other relevant parameters
Physical processes
Sedimentation and
resuspension-
Water depth, bottom shear stress,
critical shear stress, erodibility
constant
VolatilizationHenry’s law constant, molecular
weight
Water depth, wind speed, water
currents and temperature
Sediment-water exchange Molecular weight Sediment porosity
Physicochemical
Adsorption-desorption Partition coefficient (kd or kOC) TSS concentration, organic fraction
HydrolysisFirst-order degradation rate (or half
life)pH, temperature
Photolysis Half-lifeLight intensity, water depth, water
pollution
Biological
Aerobic biodegradation Half-life Oxygen concentration, temperature
Anoxic biodegradation Half-lifeOxygen/nitrate concentration,
temperature
MicropollutantsMicropollutantsMicropollutantsMicropollutants: A case : A case : A case : A case studystudystudystudy
18
� Substance flow analysis (g/d)
10
19Vezzaro et al. (2014) Environ. Modelling & Software 53, 98-111Table of ContentsTable of ContentsTable of ContentsTable of Contents
� Use of models in North-America
� New developments and trends
� Micropollutants
� Greenhouse gases
� Suspended solids
� Resource recovery (physicochemical models)
20

11
Wastewater utility GHGWastewater utility GHGWastewater utility GHGWastewater utility GHG
� Greenhouse gases in wastewater systems:
� CO2 (Biodeg., energy, chemicals) 1 CO2eq� CH4 (Anaerobic digestion) 18 CO2eq� N2O (Nitrogen removal) 300 CO2eq
21
Wastewater utility GHGWastewater utility GHGWastewater utility GHGWastewater utility GHG
22
12
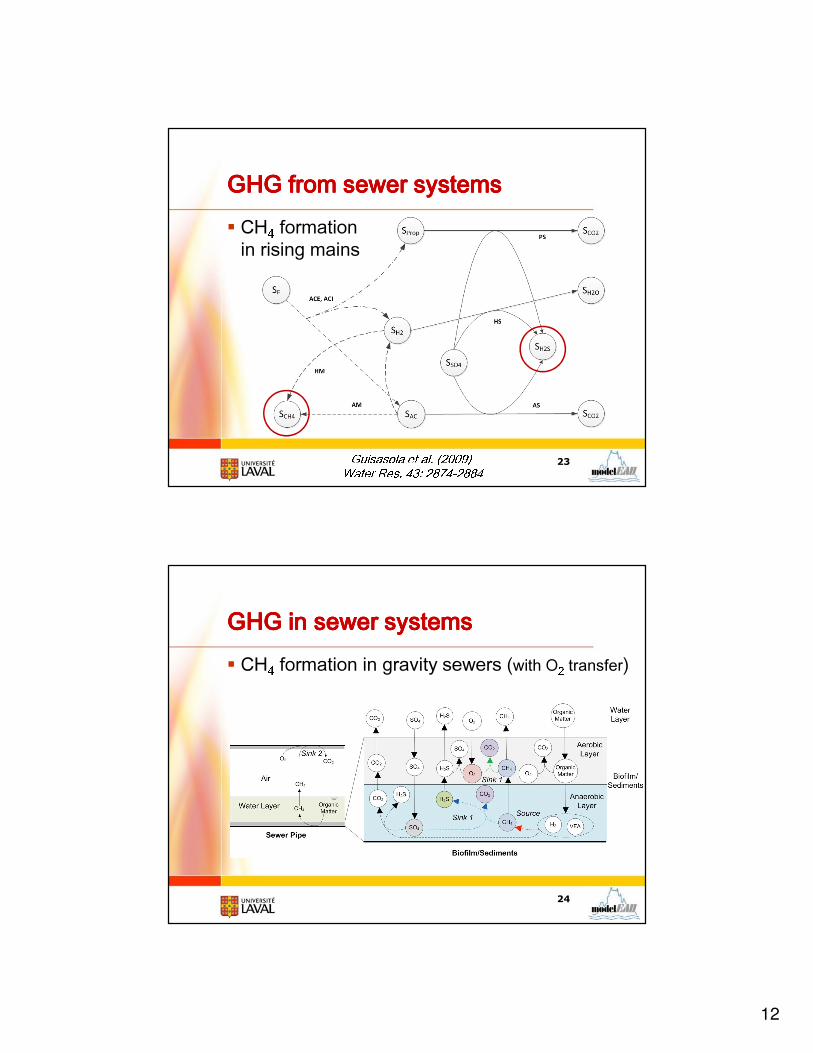
GHG from sewer systemsGHG from sewer systemsGHG from sewer systemsGHG from sewer systems
� CH4 formation
in rising mains
23Guisasola et al. (2009) Water Res. 43: 2874-2884GHG in sewer systemsGHG in sewer systemsGHG in sewer systemsGHG in sewer systems
� CH4 formation in gravity sewers (with O2 transfer)
24
13
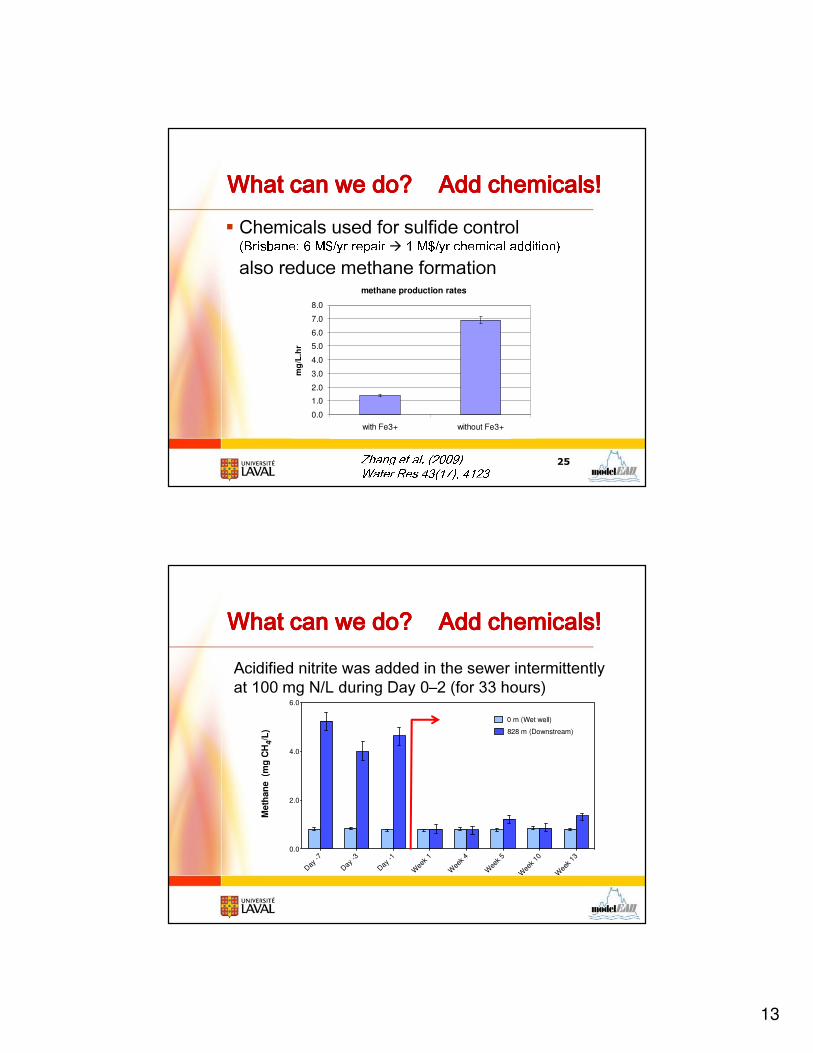
What can we do?What can we do?What can we do?What can we do? Add chemicals!Add chemicals!Add chemicals!Add chemicals!
� Chemicals used for sulfide control (Brisbane: 6 M$/yr repair � 1 M$/yr chemical addition)also reduce methane formation
25Zhang et al. (2009) Water Res 43(17), 4123methane production rates
0.0
1.0
2.0
3.0
4.0
5.0
6.0
7.0
8.0
with Fe3+ without Fe3+
mg
/L.h
r
Day
-7
Day
-3
Day
-1
Wee
k 1
Wee
k 4
Wee
k 5
Wee
k 10
Wee
k 13
0.0
2.0
4.0
6.0
0 m (Wet well)
828 m (Downstream)
Meth
an
e (m
g C
H4/L
)
Acidified nitrite was added in the sewer intermittently
at 100 mg N/L during Day 0–2 (for 33 hours)
What can we do?What can we do?What can we do?What can we do? Add chemicals!Add chemicals!Add chemicals!Add chemicals!

14
Wastewater utility GHGWastewater utility GHGWastewater utility GHGWastewater utility GHG
27
GHG GHG GHG GHG emissionsemissionsemissionsemissions fromfromfromfrom WWTPWWTPWWTPWWTP
28282828Scope 1Scope 1Scope 1Scope 1DIRECTScope 2Scope 2Scope 2Scope 2INDIRECT Scope 3Scope 3Scope 3Scope 3INDIRECTBiomass respirationBiomass respirationBiomass respirationBiomass respirationBOD oxidationBOD oxidationBOD oxidationBOD oxidationCredit nitrificationCredit nitrificationCredit nitrificationCredit nitrificationNNNN2222O denitrificationO denitrificationO denitrificationO denitrificationSlude processingSlude processingSlude processingSlude processingSludge disposal (agriculture)Sludge disposal (agriculture)Sludge disposal (agriculture)Sludge disposal (agriculture)
Production ofpurchased materialsPurchased electricity Carbon additionCarbon additionCarbon additionCarbon additionNet Power consumptionNet Power consumptionNet Power consumptionNet Power consumption
15
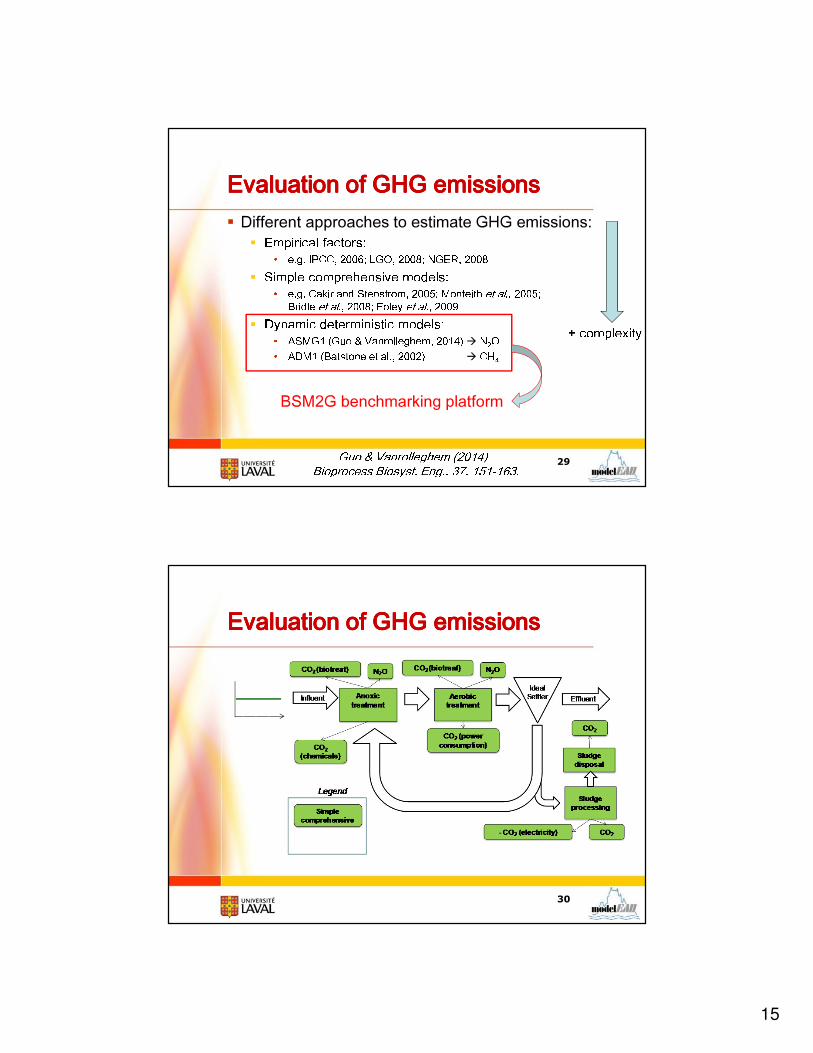
EvaluationEvaluationEvaluationEvaluation of GHG of GHG of GHG of GHG emissionsemissionsemissionsemissions
� Different approaches to estimate GHG emissions:
� Empirical factors:• e.g. IPCC, 2006; LGO, 2008; NGER, 2008� Simple comprehensive models:• e.g. Cakir and Stenstrom, 2005; Monteith et al., 2005; Bridle et al., 2008; Foley et al., 2009� Dynamic deterministic models:• ASMG1 (Guo & Vanrolleghem, 2014) � N2O• ADM1 (Batstone et al., 2002) � CH4
29
+ complexityBSM2G benchmarking platformGuo & Vanrolleghem (2014) Bioprocess Biosyst. Eng., 37, 151-163.
EvaluationEvaluationEvaluationEvaluation of GHG of GHG of GHG of GHG emissionsemissionsemissionsemissions
30

16
EvaluationEvaluationEvaluationEvaluation of GHG of GHG of GHG of GHG emissionsemissionsemissionsemissions
31Corominas et al. (2012) Biotechnol. Bioeng., 109, 2854-2863
Breakdown of GHG emissions ((((kg CO2e·m-3)))) No controlNo controlNo controlNo control Yes controlYes controlYes controlYes control %%%%Bio-treatment GHG emissions 0.4510.4510.4510.451 0.3760.3760.3760.376 ----17171717Biomass respiration 0.179 0.178 -1BOD oxidation 0.212 0.212 0Credit nitrification -0.168 -0.167 -1N2O emissions 0.228 0.152 -33Sludge processing GHG emissions 0.2310.2310.2310.231 0.2310.2310.2310.231 0000Net power GHG emissions 0.0000.0000.0000.000 ----0.0380.0380.0380.038 ----Power 0.311 0.272 -13Credit power GHG emissions -0.311 -0.310 0Embedded GHG emissions from chemical use 0.0990.0990.0990.099 0.0990.0990.0990.099 0000Sludge disposal and reuse GHG emissions 0.1930.1930.1930.193 0.1930.1930.1930.193 0000� Comparison of no controlno controlno controlno control and yes control yes control yes control yes control
(DO control in aerobic reactors, DO = 2mg·L-1)Benchmarking control Benchmarking control Benchmarking control Benchmarking control strategiesstrategiesstrategiesstrategies
32

17
Benchmarking control Benchmarking control Benchmarking control Benchmarking control strategiesstrategiesstrategiesstrategies
33
EQI (kg pollution day-1)
7000 8000 9000 10000 11000 12000 13000 14000 15000
OC
I
10000
12000
14000
16000
18000
20000
22000
24000
A1
A2A5
A4A12
A13
A3
A9
A16
A11
A17
A10 A7
A8
A6A15
A14
1.0
1.5
2.0
2.5
3.0
3.5
800010000
1200014000
160009000
12000
15000
18000
21000
24000
Avo
ided
- in
du
ce
d im
pa
ct
EQI
OC
I
A10
A11 A16
A9A17
A7A8
A6
A15
A14
A5A4
A12
A13A3
A2A1New dimension: Greenhouse gases$ Water quality $
� Overall result of our studies so far:� Compromise between:
� Effluent quality� Treatment costs� GHG emissions
Flores-Alsina et al. (2014) Sci. Total Environ., 466-467, 616-624.Wastewater utility GHGWastewater utility GHGWastewater utility GHGWastewater utility GHG
34

18
GHG emissions from WW utilityGHG emissions from WW utilityGHG emissions from WW utilityGHG emissions from WW utility
35
-5000
0
5000
10000
15000
20000
CO
2E
qu
iva
len
ts (
kg
/d)
open_loop_Qcarbon_2 open_loop_Qcarbon_4 Scenario1DO_2 Scenario1DO_1.3 Scenario2DO_1.3/1.7 Scenario2DO_1.5/1.5
Biotreatment
N2O equivalent
Power
(generated)
Chemical use
Total plant emission
Sewer
Total system emission
Aeration
Power
(consumed) 8 %25 %Guo et al. (2012) Towards …Wat. Sci. Tech., 66(11), 2483-2495.Table of ContentsTable of ContentsTable of ContentsTable of Contents
� Use of models in North-America
� New developments and trends
� Micropollutants
� Greenhouse gases
� Suspended solids
� Resource recovery (physicochemical models)
36
19
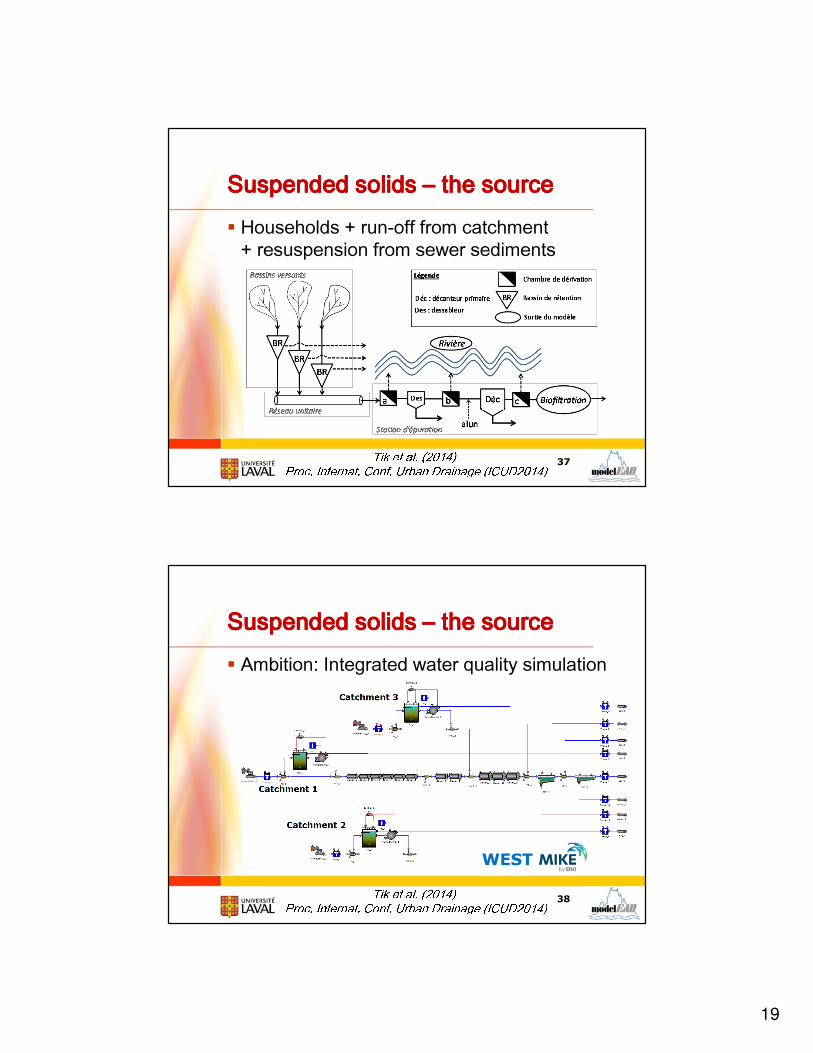
Suspended solids Suspended solids Suspended solids Suspended solids –––– the sourcethe sourcethe sourcethe source
� Households + run-off from catchment
+ resuspension from sewer sediments
37Tik et al. (2014)Proc. Internat. Conf. Urban Drainage (ICUD2014)
Suspended solids Suspended solids Suspended solids Suspended solids –––– the sourcethe sourcethe sourcethe source
� Ambition: Integrated water quality simulation
38
WESTTik et al. (2014)Proc. Internat. Conf. Urban Drainage (ICUD2014)

20
The future WWTP The future WWTP The future WWTP The future WWTP ���� WRRFWRRFWRRFWRRF
39
CEPTCEPTCEPTCEPTBiogasBiogasBiogasBiogas, N, P, N, P, N, P, N, P
Bachis et al. (2014) Proceedings WWTmod2014
�Adaptation of model of Bachis et al. (2012) incorporating 5 particle classes � 10 layers�Calibrated with field data
-
+
+
+
+
-
-
-
-
+
-
+
-
-
+
-
+
-
1
2
4
5
10
Qin
Qover
Qunder
VsH2OPrimary Primary Primary Primary clarifier modelclarifier modelclarifier modelclarifier model
Bachis et al. (2012) IWA Particle Separation Conference
� ’PSVD’ model
� Particle Settling Velocity
Distribution
� No size, density, size !
� Developed for storm tanks
40

21
PSVD model PSVD model PSVD model PSVD model –––– ViCAsViCAsViCAsViCAs mmmmethodologyethodologyethodologyethodologyViCAs (Settling Velocity in Sanitation), Chebbo&Gromaire, 2009
41
PSVD model PSVD model PSVD model PSVD model –––– ViCAsViCAsViCAsViCAs mmmmethodologyethodologyethodologyethodologyViCAs (Settling Velocity in Sanitation), Chebbo&Gromaire, 2009
42

22
PSVD model PSVD model PSVD model PSVD model –––– ViCAsViCAsViCAsViCAs mmmmethodologyethodologyethodologyethodology
43
Not all particles settle over the same column height ==> Mass not directly associated to a class of velocity
PSVD model PSVD model PSVD model PSVD model –––– ViCAsViCAsViCAsViCAs mmmmethodologyethodologyethodologyethodology
44
Not all particles settle over the same column height ==> Mass not directly associated to a class of velocity46% TSSVs < 1 m/h54% TSSVs > 1 m/h
23
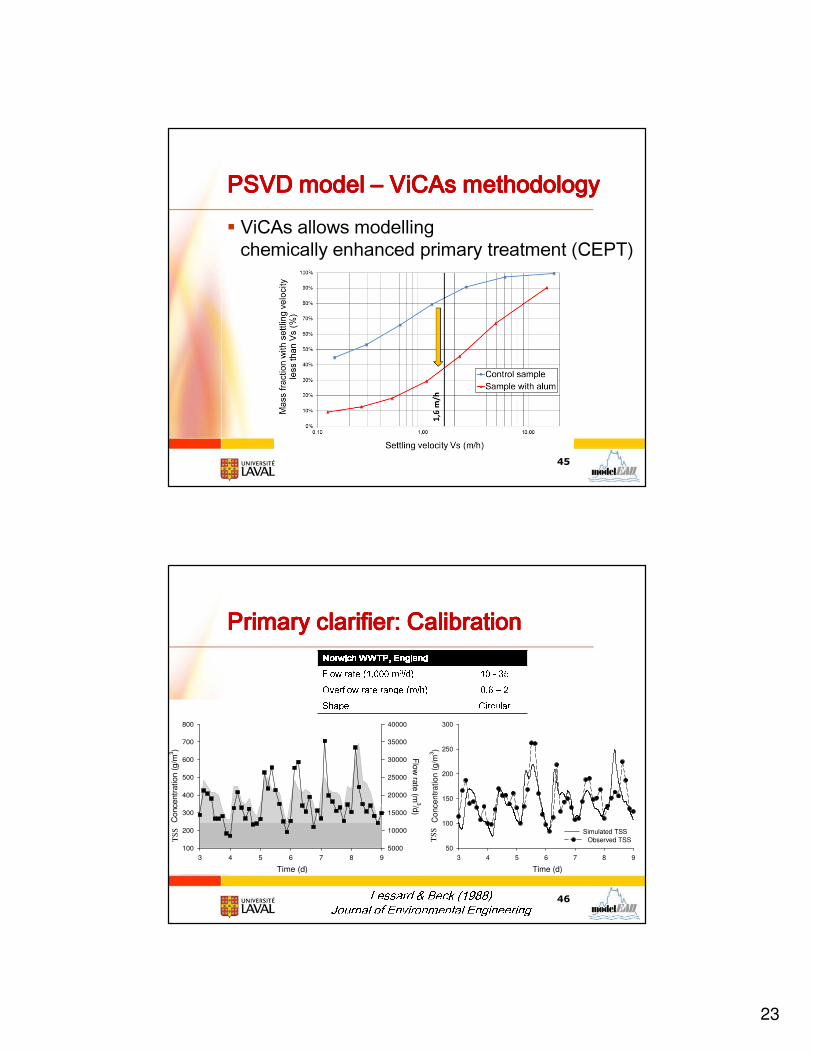
PSVD model PSVD model PSVD model PSVD model –––– ViCAsViCAsViCAsViCAs methodologymethodologymethodologymethodology
� ViCAs allows modelling
chemically enhanced primary treatment (CEPT)
45
Time (d)
3 4 5 6 7 8 9
Flo
w ra
te (m
3/d)
5000
10000
15000
20000
25000
30000
35000
40000
Concentr
ation (
g/m
3)
100
200
300
400
500
600
700
800
Time (d)
3 4 5 6 7 8 9
Co
nce
ntr
atio
n (
g/m
3)
50
100
150
200
250
300
Simulated TSS
Observed TSS
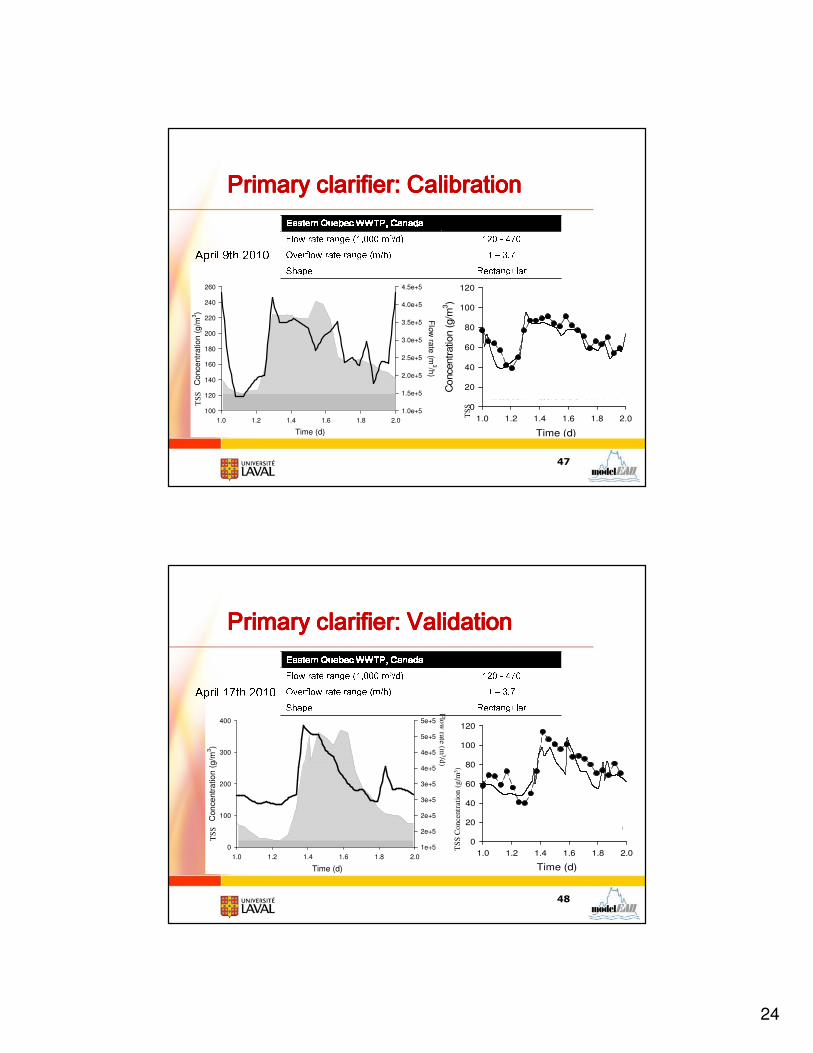
Primary clarifier: CalibrationPrimary clarifier: CalibrationPrimary clarifier: CalibrationPrimary clarifier: Calibration
Lessard & Beck (1988)Journal of Environmental EngineeringTS
S
Norwich WWTP, Norwich WWTP, Norwich WWTP, Norwich WWTP, EnglandEnglandEnglandEnglandFlow rate (1,000 m3/d) 10 - 35Overflow rate range (m/h) 0.6 – 2Shape Circular
TS
S
46
24
Time (d)
1.0 1.2 1.4 1.6 1.8 2.0
Concentr
ation (
g/m
3)
0
20
40
60
80
100
120
Eastern Quebec WWTP
Time (d)
1.0 1.2 1.4 1.6 1.8 2.0
Flo
w ra
te (m
3/h)
1.0e+5
1.5e+5
2.0e+5
2.5e+5
3.0e+5
3.5e+5
4.0e+5
4.5e+5
Co
nce
ntr
atio
n (
g/m
3)
100
120
140
160
180
200
220
240
260
Primary clarifier: CalibrationPrimary clarifier: CalibrationPrimary clarifier: CalibrationPrimary clarifier: CalibrationEasternEasternEasternEastern QuebecQuebecQuebecQuebec WWTP, CanadaWWTP, CanadaWWTP, CanadaWWTP, CanadaFlow rate range (1,000 m3/d) 120 - 470Overflow rate range (m/h) 1 – 3.7Shape RectangularT
SS
TS
S
April 9th 2010
47
2.0
Time (d)
1.0 1.2 1.4 1.6 1.8 2.0
0
20
40
60
80
100
120
Eastern Quebec WWTP
Time (d)
1.0 1.2 1.4 1.6 1.8 2.0
1e+5
2e+5
2e+5
3e+5
3e+5
4e+5
4e+5
5e+5
5e+5
Con
ce
ntr
atio
n (
g/m
3)
0
100
200
300
400
Primary clarifier: Primary clarifier: Primary clarifier: Primary clarifier: ValidationValidationValidationValidation
TS
S C
once
ntr
atio
n (
g/m
3)
TS
S
EasternEasternEasternEastern QuebecQuebecQuebecQuebec WWTP, Canada WWTP, Canada WWTP, Canada WWTP, Canada Flow rate range (1,000 m3/d) 120 - 470Overflow rate range (m/h) 1 – 3.7Shape RectangularApril 17th 2010
Flo
w rate (m
3/d)
48
25
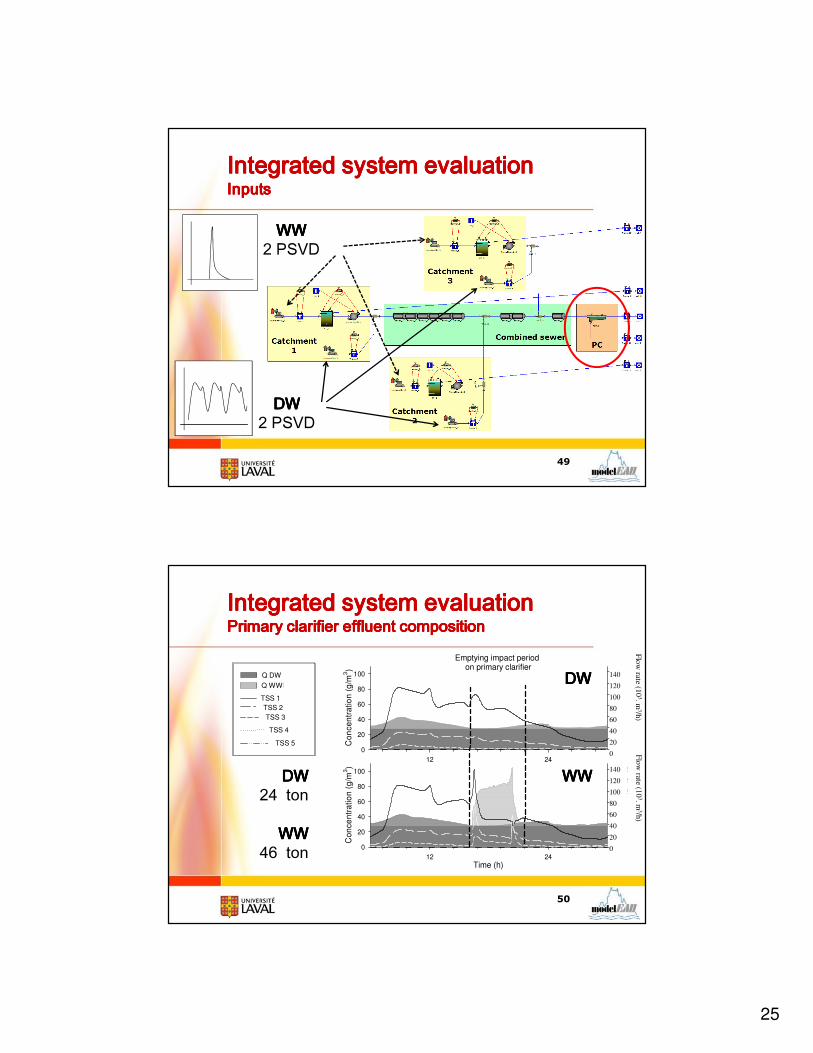
DWDWDWDW
2 PSVD
WWWWWWWW
2 PSVD
Integrated system evaluationIntegrated system evaluationIntegrated system evaluationIntegrated system evaluationInputsInputsInputsInputs
49
12 24
Flo
w ra
te (m
3/h)
0
2e+1
4e+1
6e+1
8e+1
1e+2
1e+2
1e+2
Co
nce
ntr
atio
n (
g/m
3)
0
20
40
60
80
100
12 24
Flo
w ra
te (m
3/h)
0
2e+1
4e+1
6e+1
8e+1
1e+2
1e+2
1e+2
Co
nce
ntr
atio
n (
g/m
3)
0
20
40
60
80
100
Emptying impact period on primary clarifier
Time (h)
Integrated system evaluation Integrated system evaluation Integrated system evaluation Integrated system evaluation Primary clarifier effluent compositionPrimary clarifier effluent compositionPrimary clarifier effluent compositionPrimary clarifier effluent composition
Q WWF
Q DWF
TSS 1
TSS 2
TSS 3
TSS 4
TSS 5
DWDWDWDW
WWWWWWWWDWDWDWDW
24 ton
WWWWWWWW
46 ton
TSS 2
TSS 4
TSS 5
140
120
100
80
60
40
20
0
140
120
100
80
60
40
20
0
Flo
w rate (1
03.
m3/h
)F
low
rate (10
3.m
3/h)
50
26
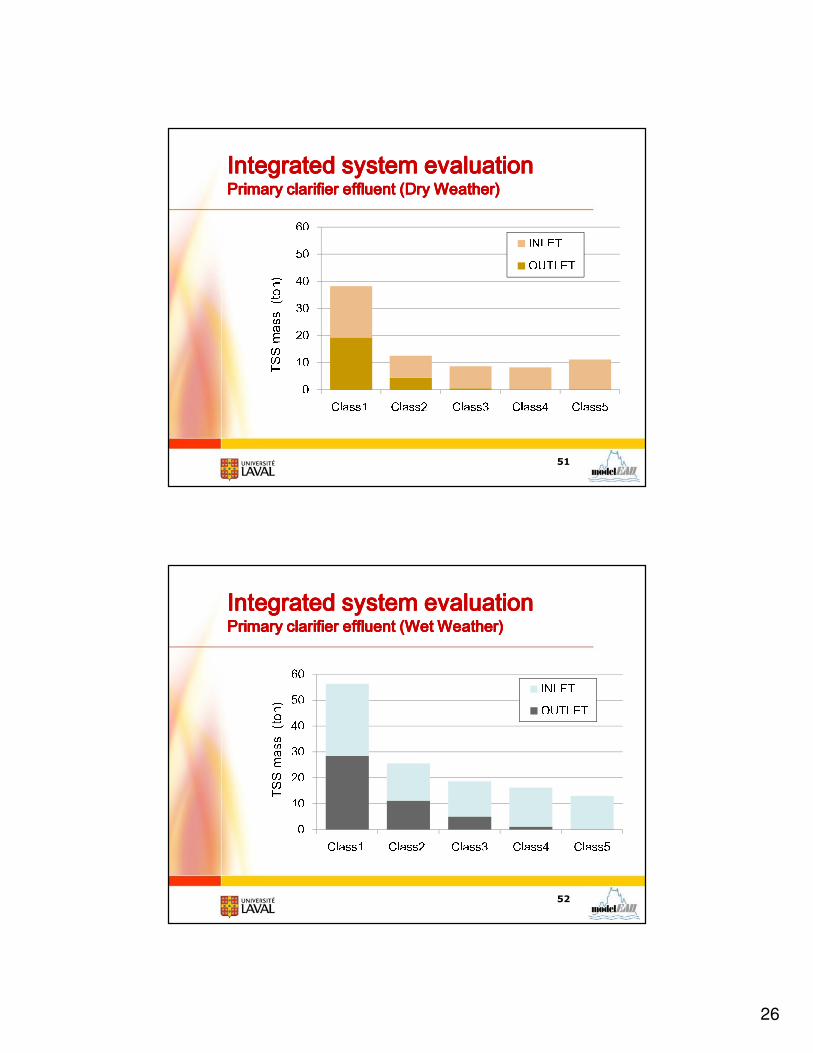
Integrated system evaluation Integrated system evaluation Integrated system evaluation Integrated system evaluation Primary clarifier effluent (Dry Weather)Primary clarifier effluent (Dry Weather)Primary clarifier effluent (Dry Weather)Primary clarifier effluent (Dry Weather)
0102030405060Class1 Class2 Class3 Class4 Class5
INLETOUTLETTSSmass (ton)
51
Integrated system evaluation Integrated system evaluation Integrated system evaluation Integrated system evaluation Primary clarifier effluent (Wet Weather)Primary clarifier effluent (Wet Weather)Primary clarifier effluent (Wet Weather)Primary clarifier effluent (Wet Weather)
0102030405060Class1 Class2 Class3 Class4 Class5
INLETOUTLETTSSmass (ton)
52

27
Table of ContentsTable of ContentsTable of ContentsTable of Contents
� Use of models in North-America
� New developments and trends
� Micropollutants
� Greenhouse gases
� Suspended solids
� Resource recovery (physicochemical models)
53
““““WurfsWurfsWurfsWurfs””””
� Water resource recovery facility (WRRF)
54Verstraete & Vlaeminck (2011)Int. J. Sust. Dev. World Ecol., 18, 253-264.

28
Resource recovery processesResource recovery processesResource recovery processesResource recovery processes
� Stripping (NH3, fatty acids)
� Precipitation (struvite)
� Filtering (paper fibers)
� Extraction (PHA)
� Ion exchange (NH4+)� Reverse osmosis (H2O)
� Phase separation (butanol)
� Pyrolysis, gasification, incineration (energy)
� Chemically enhanced primary treatment (COD)
55
All
physico-
chemical
unit
processes
Modelling Modelling Modelling Modelling
physicochemical processesphysicochemical processesphysicochemical processesphysicochemical processes
� We’ve done it
simply:
� Aeration: Kla (Csat-C)
� pH: f(pKa, TAN, Alk, …)
� Precipitation: MeOH/MeP
� Membrane: J = TMP/μ.(Rm+Rf+Rc)56
29
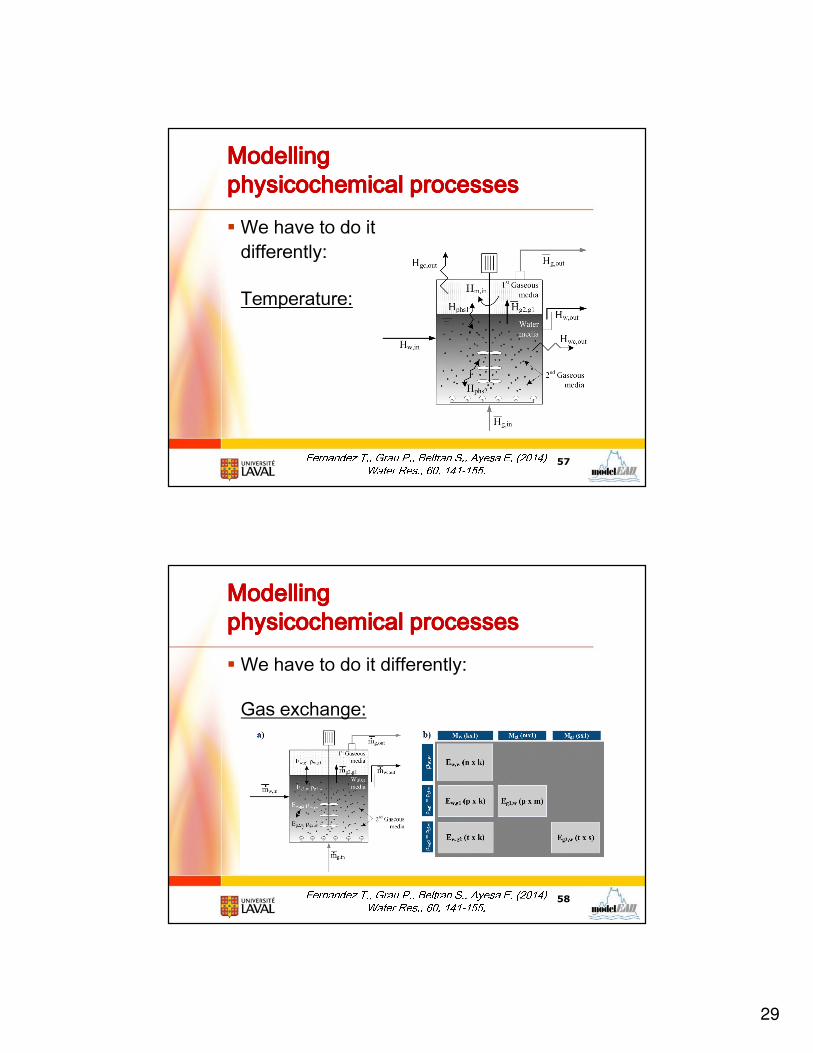
Modelling Modelling Modelling Modelling
physicochemical processesphysicochemical processesphysicochemical processesphysicochemical processes
� We have to do it
differently:
Temperature:
57Fernandez T., Grau P., Beltran S., Ayesa E. (2014)Water Res., 60, 141-155.Modelling Modelling Modelling Modelling
physicochemical processesphysicochemical processesphysicochemical processesphysicochemical processes
� We have to do it differently:
Gas exchange:
58Fernandez T., Grau P., Beltran S., Ayesa E. (2014)Water Res., 60, 141-155.

30
Modelling Modelling Modelling Modelling
physicochemical processesphysicochemical processesphysicochemical processesphysicochemical processes
� We have to do it differently:
Precipitation:
59
Modelling Modelling Modelling Modelling
physicochemical processesphysicochemical processesphysicochemical processesphysicochemical processes
� We have to do it differently:
Precipitation:
It gets a
little crowded
in wastewater
60
Mg2+ HCO3-Na+ Ca2+Mg2+SO42- Cl- K+Na+ CO32-HPO42-CaCO3 (aq)CaHCO3+MgHCO3+, CaHPO4 (aq)
CaSO4 (aq)CaOH+
MgSO4 (aq)NaHPO4-NaCO3- NaHCO3 (aq)MgH2PO4+ CaAc+
NaAc (aq)NaSO4-

31
Modelling Modelling Modelling Modelling
physicochemical processesphysicochemical processesphysicochemical processesphysicochemical processes
� We have to do it differently:
Precipitation:
61
Modelling Modelling Modelling Modelling
physicochemical processesphysicochemical processesphysicochemical processesphysicochemical processes
� We have to do it differently:
Precipitation:
Ion pairs
increase
solubility
62
32
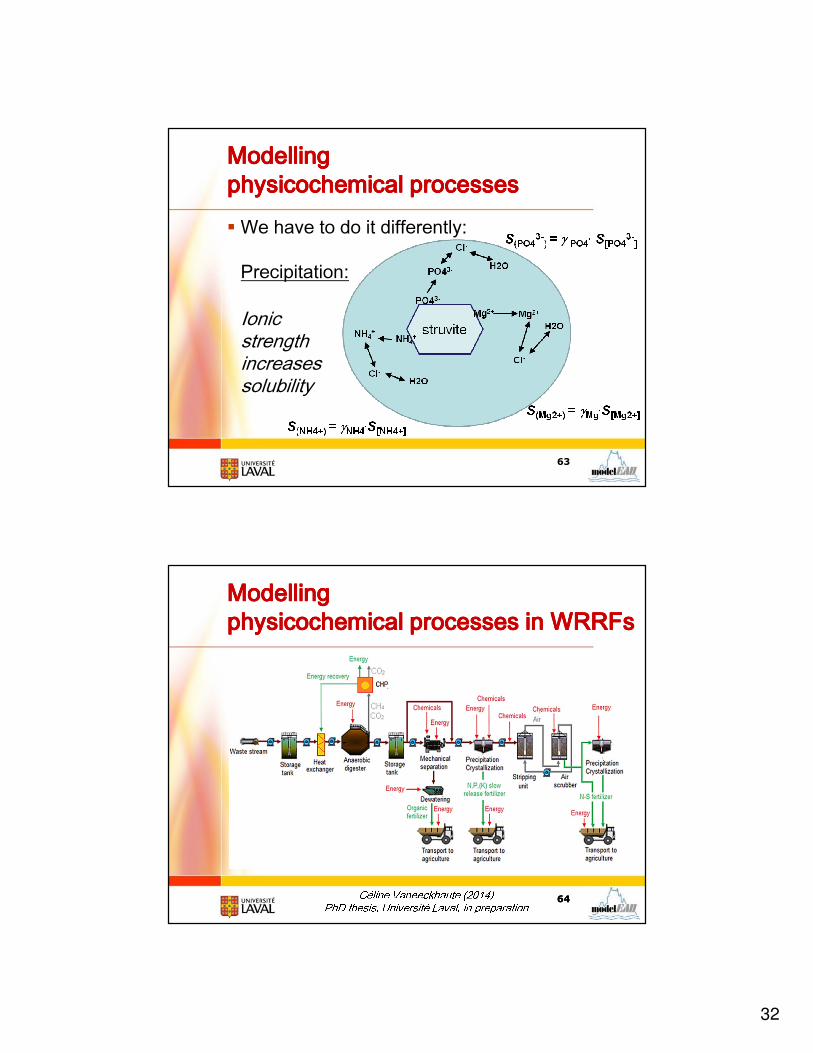
Modelling Modelling Modelling Modelling
physicochemical processesphysicochemical processesphysicochemical processesphysicochemical processes
� We have to do it differently:
Precipitation:
Ionic
strength
increases
solubility
63
Modelling Modelling Modelling Modelling
physicochemical physicochemical physicochemical physicochemical processes in WRRFsprocesses in WRRFsprocesses in WRRFsprocesses in WRRFs
6464Céline Vaneeckhaute (2014) PhD thesis, Université Laval, in preparation
33
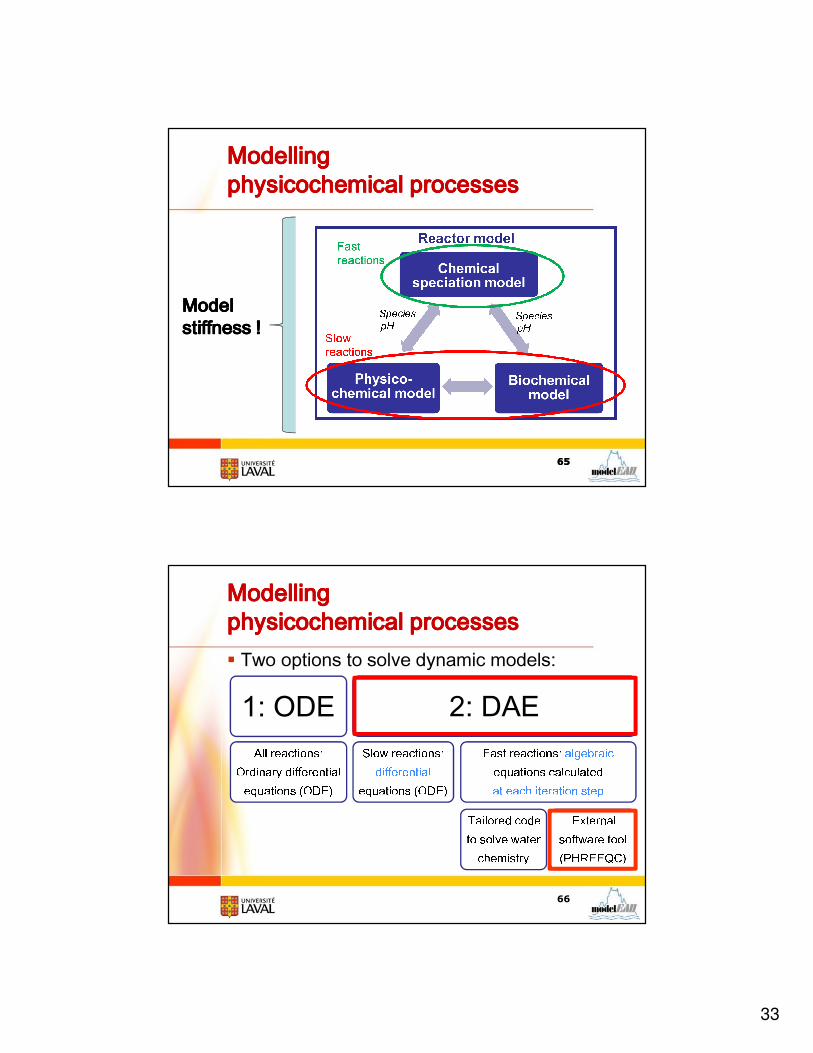
Modelling Modelling Modelling Modelling
physicochemical processesphysicochemical processesphysicochemical processesphysicochemical processes
65
Model Model Model Model
stiffnessstiffnessstiffnessstiffness ! ! ! !
65
Modelling Modelling Modelling Modelling
physicochemical processesphysicochemical processesphysicochemical processesphysicochemical processes
� Two options to solve dynamic models:
66
1: ODEAll reactions: Ordinary differential equations (ODE) 2: DAESlow reactions: differentialequations (ODE) Fast reactions: algebraic equations calculated at each iteration stepTailored code to solve water chemistry External software tool (PHREEQC)

34
Setting up a reduced PCM modelSetting up a reduced PCM modelSetting up a reduced PCM modelSetting up a reduced PCM model
67
I. Physicochemical
component
selection II. Speciation
calculation
III+IV. Selection of
species/reactions
⟹ reduced model
SO4 NH4 H PO4Na K Ca Mg CO3Fe Cl Al N2 HS
Ac Pr Bu Va
PHREEQC/ PHREEQC/
MINTEQC
73 species 12 acid-base reactions43 ion-pairing reactions22 precipitation reactions7 gas-liquid reactions Corrections:- Ion activity- Temperature ± 253 species
Modelling WRRFs Modelling WRRFs Modelling WRRFs Modelling WRRFs –––– ADM1.5ADM1.5ADM1.5ADM1.5
� To properly model P in WRRFs,
we need to extend ADM1 (only COD & N):
� Consider Fe and its interaction with Sulphide (FeS!)
� Phosphate fate, including PAO’s
� P-release from organics
68

35
ADM1 Extension 1: ADM1 Extension 1: ADM1 Extension 1: ADM1 Extension 1: SulfurgenesisSulfurgenesisSulfurgenesisSulfurgenesis
� Model of Knobel & Lewis (2002)
69Knobel & Lewis (2002) Water Research, 36(1), 257-265.
ADM1 Extension 1: ADM1 Extension 1: ADM1 Extension 1: ADM1 Extension 1: SulfurgenesisSulfurgenesisSulfurgenesisSulfurgenesis
� Model of Knobel & Lewis (2002)
� 4 Types of bacteria
� Electron acceptor: SO42-� Electron donor & carbon source for growth:• Pro, Bu, Ac• Donor = H2 and carbon source = CO2� Inhibition factor H2S included
70Knobel & Lewis (2002) Water Research, 36(1), 257-265.

36
ADM1 Extension 2: HydrolysisADM1 Extension 2: HydrolysisADM1 Extension 2: HydrolysisADM1 Extension 2: Hydrolysis
� Incorporation in disintegration/hydrolysis:
release of P, K and S, based on the
composition of bacterial cells
71
ADM1 Extension 3: EBPRADM1 Extension 3: EBPRADM1 Extension 3: EBPRADM1 Extension 3: EBPR
� PAO’s (heterotrophs with anaerobic metabolism)
� Poly-P accumulation in cells (1-2%P → 5-7%P)
� Reactions in AD (Ikumi, 2011):
� Release of polyphosphate (PP) (+ release of K, Ca and Mg) with uptake of acetate by PAOs while they are still alive� Maintenance by hydrolysis of PP� Decay of PAOs� Hydrolysis of poly-hydroxy-alkanoate (PHA) when PAOs die
72
(Last supper ;-)
Ikumi (2011) PhD thesis, University of Cape Town.
37
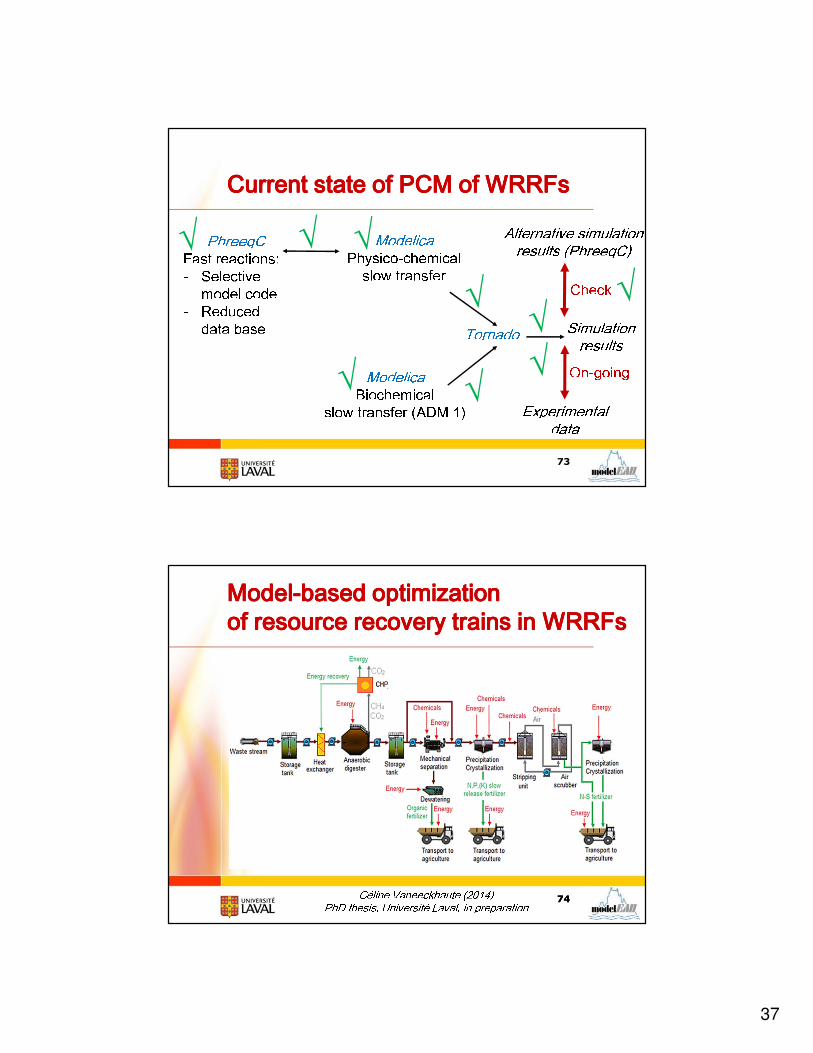
Current state of PCM of WRRFsCurrent state of PCM of WRRFsCurrent state of PCM of WRRFsCurrent state of PCM of WRRFs
73
PhreeqCFast reactions:- Selectivemodel code- Reduceddata base ModelicaPhysico-chemicalslow transfer
ModelicaBiochemicalslow transfer (ADM 1)Tornado Simulation results√ √
√
√ √
√
√
√ Alternative simulation results (PhreeqC)CheckOn-goingExperimentaldata√
ModelModelModelModel----based optimizationbased optimizationbased optimizationbased optimization
of resource of resource of resource of resource recovery trains in WRRFsrecovery trains in WRRFsrecovery trains in WRRFsrecovery trains in WRRFs
7474Céline Vaneeckhaute (2014) PhD thesis, Université Laval, in preparation

38
Table of ContentsTable of ContentsTable of ContentsTable of Contents
� Use of models in North-America
� New developments and trends
� Micropollutants
� Greenhouse gases
� Suspended solids
� Resource recovery (physicochemical models)
75
AcknowledgementsAcknowledgementsAcknowledgementsAcknowledgements
76
Canada Research Chairin Water Quality ModellingOtto
Mønsted