water quality of the thompson’s creek...
TRANSCRIPT
1
Water Quality of the Thompson’s Creek Watershed, Claremont CA.
Jazmin Gonzalez
California State Polytechnic University, Pomona
Internship Dec. 2012-Dec. 2013
Dr. Stephen Osborn- California State Polytechnic University, Pomona
December 16, 2013

2
Table of Contents Page
Title Page………………………………………………………………………………………….1 Table of Contents …………………………………………………………………………………2 Acknowledgements………………………………………………………………………………..3 Executive Summary……………………………………………………………………………….4 Project Objectives…………………………………………………………………........................5 Project Approach………………………………………………………………………………….6 Project Outcomes………………………………………………………………………………….7 Conclusions………………………………………………………………………………………..8 Appendices…………………………………………………………………………………….9-14 References………………………………………………………………………………………..15

3
Acknowledgements
This project was supported by Agriculture and Food Research Initiative Competitive Grant number 2011- 38422-31204 from the USDA National Institute of Food and Agriculture. Special thanks to Dr. Stephen Osborn for his expertise, time and support as my academic advisor through out the entirety of the project. Additionally, this project was also funded by the National Science Foundation grant number HRD:0902628 available through Cal Poly Pomona’s LSAMP program.

4
Executive Summary
Water quality is fundamental for healthy riverine ecosystem functions and sustainable human use. To these ends, The Claremont League of Women Voters (CLV) proposed a large-scale project in 2008 to better utilize the Thompson's Creek Dam in Claremont, CA by improving storm water storage and groundwater recharge of the six basins aquifer. The CLV project is also expected to help revitalize and preserve four different biological habitats: Riparian, Chaparral, Wetland and three stages of Riversidean Alluvial Fan Sage Scrub. In addition, drinking water supplies are expected to increase for many local communities throughout the Pomona Valley. The conservation plan, proposed by the CLV, assumed that there is little impact to water quality due to the lack of historical land use and development. However, there was little water quality testing results available for this watershed as verification. To test this assumption, spring water samples were collected throughout the 2012-2013 academic year. Water samples were analyzed for Chloride and Bromide (salinity); Nitrate (NO₃¯); Fluoride (F¯); Sulfate (SO₄¯); pH; and alkalinity as basic measures of water quality. Oxygen (O18) and hydrogen (H2) isotopes have been analyzed to understand the source of fluids in the watershed (i.e., meteoric, or deeper groundwater). Tritium isotope values (H3) of select spring samples have been measured to estimate the age of waters in the watershed. Preliminary results indicate that elemental analyses are below Primary and Secondary Environmental Protection Agency (EPA) Standards. Field pH measurements ranged between 6.9 and 8.14, consistent with natural waters. Total alkalinity is consistent with groundwaters from mountain front recharge, ranging between 224 and 352 mg/L. Preliminary tritium results indicate that the lower spring in the watershed may have a longer residence time than the higher spring. These results have some implications for interpreting contaminant migration and watershed management.

5
Project Objectives Thompson’s Creek is located in a transitional setting between urban sprawl and un-inhabited wild lands of Claremont in Southern California. The creek is at the base of the foothills of the San Gabriel Mountains on the Eastern edge of Los Angeles County. The watershed is composed of 5 tributary streams: Cobal, Burbank, Williams, Palmer and Chicken Canyon (see Figure 2). This project focused on springs along Cobal canyon and where Palmer canyon meets Thompson’s creek. In 2008, Claremont League of Women voters proposed to increase storm water recharge to benefit the six basins aquifer. While doing so, it would serve to benefit four biological habitats; Riparian, Chaparral, Wetland and three stages of Riversidean Alluvial Fan Sage Scrub. However, the CLV assumed water quality was pristine with no scientific evidence. This project aimed to test their assumption by monitoring and analyzing the local water supply for one academic year. Field and laboratory parameters chosen to examine are pH, alkalinity, anions (chloride, nitrate, fluoride, sulfate), tritium and stable isotopes. Specific goals for this research project were to gain practical field experience using new equipment such as pH, electrical conductivity and flow meters. In addition, learn how to take water samples from a field site, and conduct and interpret elemental analysis in the laboratory. Finally, another goal was to utilize GPS coordinate systems to properly display spatial relationships using GIS software depicting sample locations (see Figure 1). I have chosen to follow a career path within the USDA as a hydrogeologist and after completing the project it has reassured my goals to pursing this type of work.

6
Project Approach
During the academic year of 2012 to 2013, the goal was to get a representative set of water samples to determine the water quality in the watershed. Spring water, seasonal stream, and precipitation samples were collected. Water Sample kits were prepared in advanced and kits included a 0.45 µm filter, 50 (mL) syringe, latex gloves and four plastic sample bottles. Sampled water was washed through the syringe once, refilled and then filtered into a bottle to be sealed and labeled. Samples were then preserved in refrigeration. Field observations of pH and electrical conductivity were taken in the field when possible. Calibration of pH meters was necessary at the start of every sampling day. Water samples were analyzed at the Cal Poly Pomona Hydrogeology and Water Quality laboratory using an Dionex ICS1100 ion chromatograph measuring Chloride and Bromide (salinity); Nitrate, Fluoride, and Sulfate. Alkalinity testing occurred in the lab, samples were extracted and weighed into a glass flask (between 15-20 mg). Hydro Chloric (HCl) acid of normality of (.1) was titrated into the sample while monitoring the pH until a pH of 4.5 was reached (see Figure 3e). The equation to calculate total alkalinity was used. [(Normality of Acid) (Sample weight in (mg)) (50,000)/ (volume of acid added)]= Total alkalinity in (mg/L) Tritium isotopes (H3) of select springs were analyzed to estimate the apparent age of waters. Oxygen (O18) and Hydrogen (H2) isotopes were measured at the Arizona University Geosciences lab to determine the source of spring and stream samples. Unfiltered spring water samples were collected into a 500 (mL) bottle and shipped to the Isotope laboratory at the University of Arizona for Tritium analysis a Hydrogen isotope (H³) used to age date water (see Figure 3d).
7
Project Outcomes
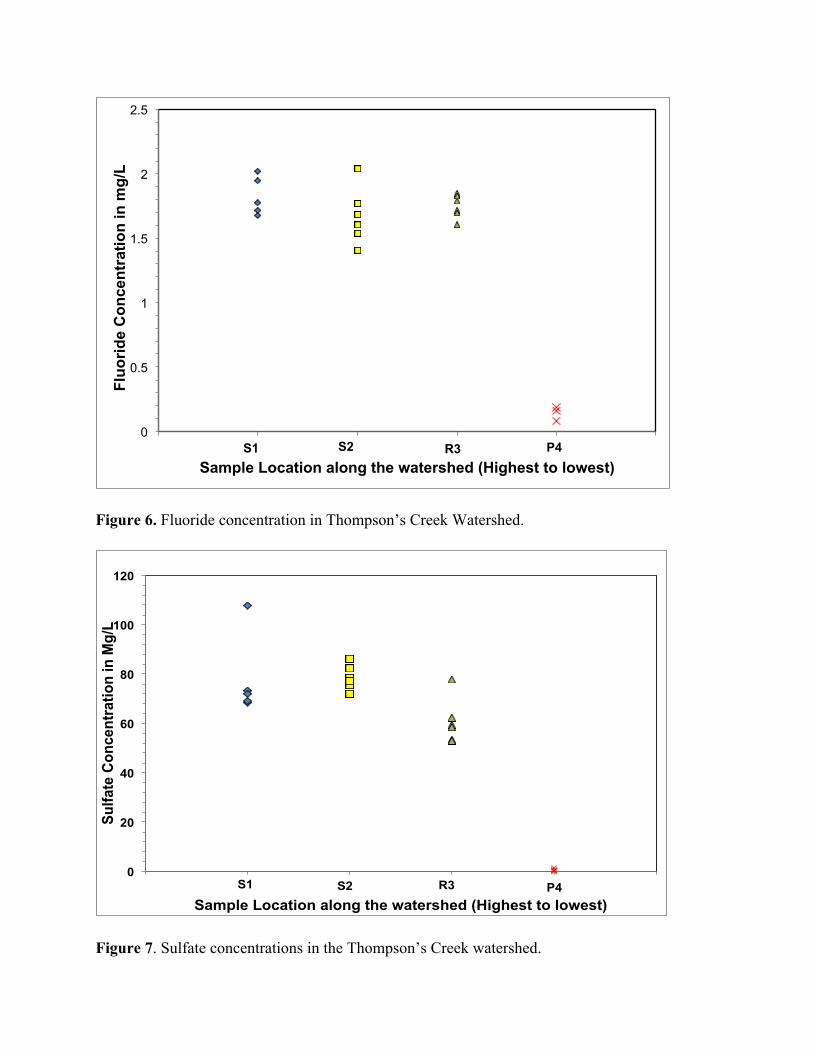
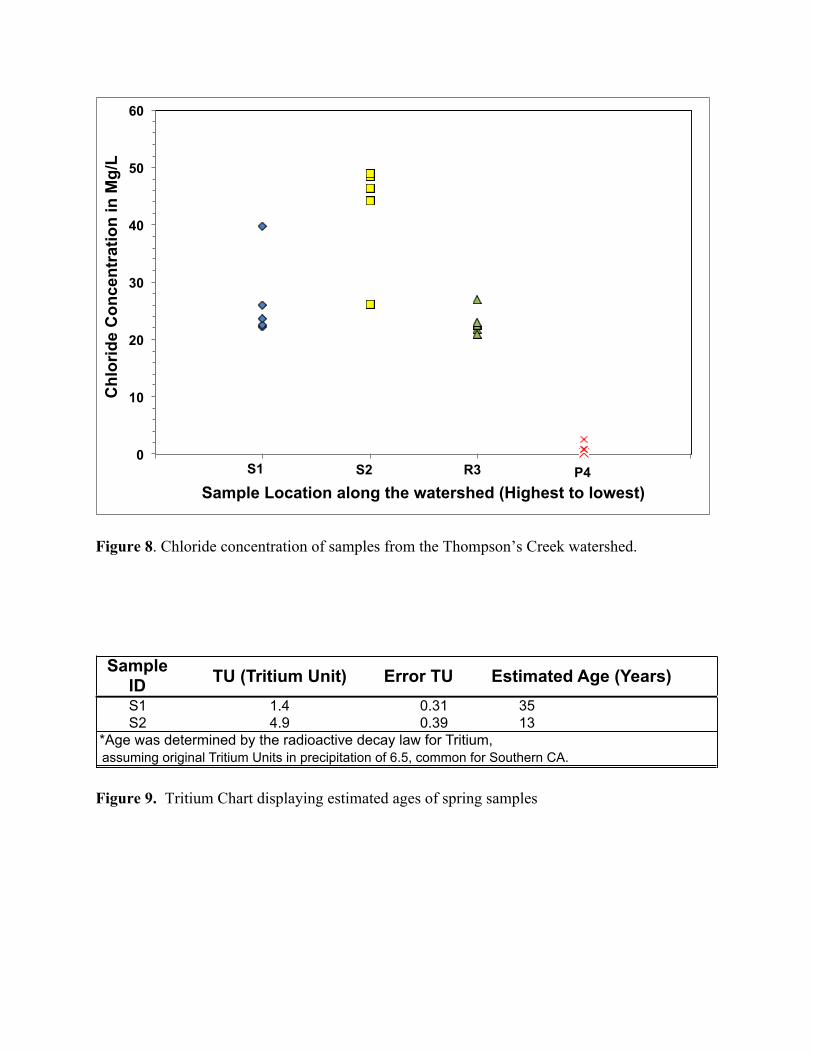
The measured pH varied between 6.9 to 8.14 (see Figure 4), which is consistent with most natural waters. Some variation is normal due to seasons and these values are a good first indication of water quality. Similarly to pH, alkalinity of water will portray how well that water will resist any changes of pH by addition of acidity into that system. Alkalinity values were calculated to be within 224 and 352 mg/L(see Figure 5). Such values are indicative of natural riverine environments. A more in depth parameter was anion concentrations. These values generated through lab testing were compared to the EPA primary and secondary drinking water standards. Fluoride concentrations in the samples were all below the EPA primary standard of 4mg/L(see Figure 6). Sulfate concentrations were all below the EPA secondary standard of 250 mg/L(see Figure 7). Chloride levels peaked at 52 mg/L while EPA’s secondary standard is 250 mg/L(see Figure 8). Tritium age dating preliminary calculations were estimated to be 35 years for spring 1 (S1 highest in watershed) and 13 years for spring 2 (S2 lower in the watershed) assuming an initial tritium 6.5 TU for southern California (see Figure 9). We would expect to have the oldest spring lower in the watershed but we have the opposite here. What is important about this result is we see that these values are different, signaling to interpret they have different flow paths.
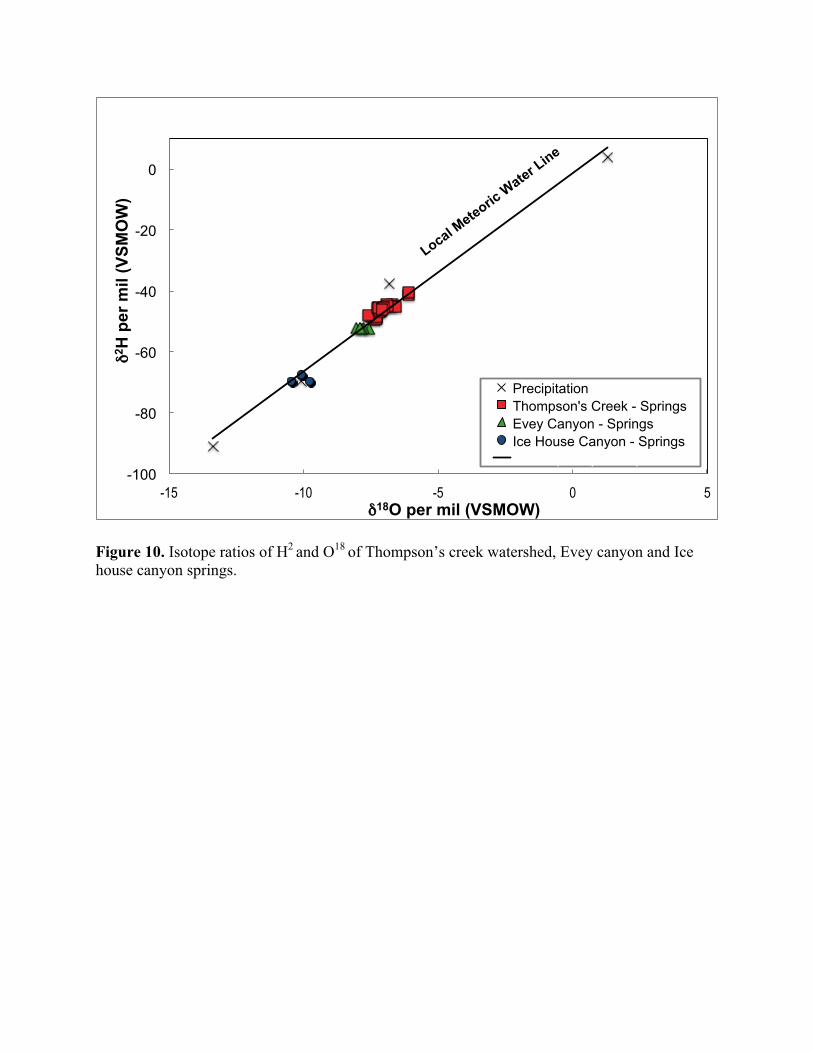
Stable isotope ratio data was gathered by University of Arizona and plotted relative to isotope data from precipitation samples that yielded a local meteoric water line (See Figure 10). Using this reference point we are able to compare the source of the fluid. Based on where the data from Thompson’s creek plotted, we were able to determine the source of the fluids was meteoric in origin. Comparing the data to a watershed just east and of greater altitude than Thompson’s creek, Ice house canyon data plots lower along the line to show us that these are temperature dependent at the time of origin. When compared to Thompson’s creek, where it is not as cold and higher in altitude, we get a data set plotting towards the middle.
8
Conclusions
During the 2012-2013 academic year, the study completed in the Thompson’s creek watershed has shown that the water quality within the site appears to be reasonably good, based on this data set. Anion concentrations of Chloride, Bromide, Nitrate, Fluoride, and Sulfate were below their respective Environmental Protection Agency Primary and secondary standards. Alkalinity results were consistent values common for mountain environments. Recommendation for future research would be to continue to monitor the site and look for more springs higher in elevation to sample. If more springs are found, tritium analysis can be done to determine apparent ages and map out ages of springs and understand groundwater flow paths better.
This experience of learning through the USDA watershed management internship has given me valuable opportunities that have already proved to be beneficial. I have been able to add additional work experience as a result of getting hired at a local water agency. Throughout this year, I have also been able to fulfill a personal goal of mine at presenting at a professional geoscience conference by presenting my research conducted through the USDA internship. During this time, I have learned a lot about data acquisition, research and interpreting resultant data to put together a scientific document. I truly believe the skills I have gained will help me be successful in the field of science and my future in graduate school. Thanks to the watershed management internship I will continue to pursue my career in the environmental water sector.

9
Appendices
Figure 1. Sample map modified from USGS Mt. Baldy 7.5 minute Quadrangle
XY
#*
")
E
0 0.25 0.5 0.75 10.125Kilometers
Sample Locations in Thompson's Creek Watershed
Legend
XY S1-Spring
") S2- Spring
#* R3-River
E P4 -Precipitation
±
Author: Jazmin Gonzalez
10
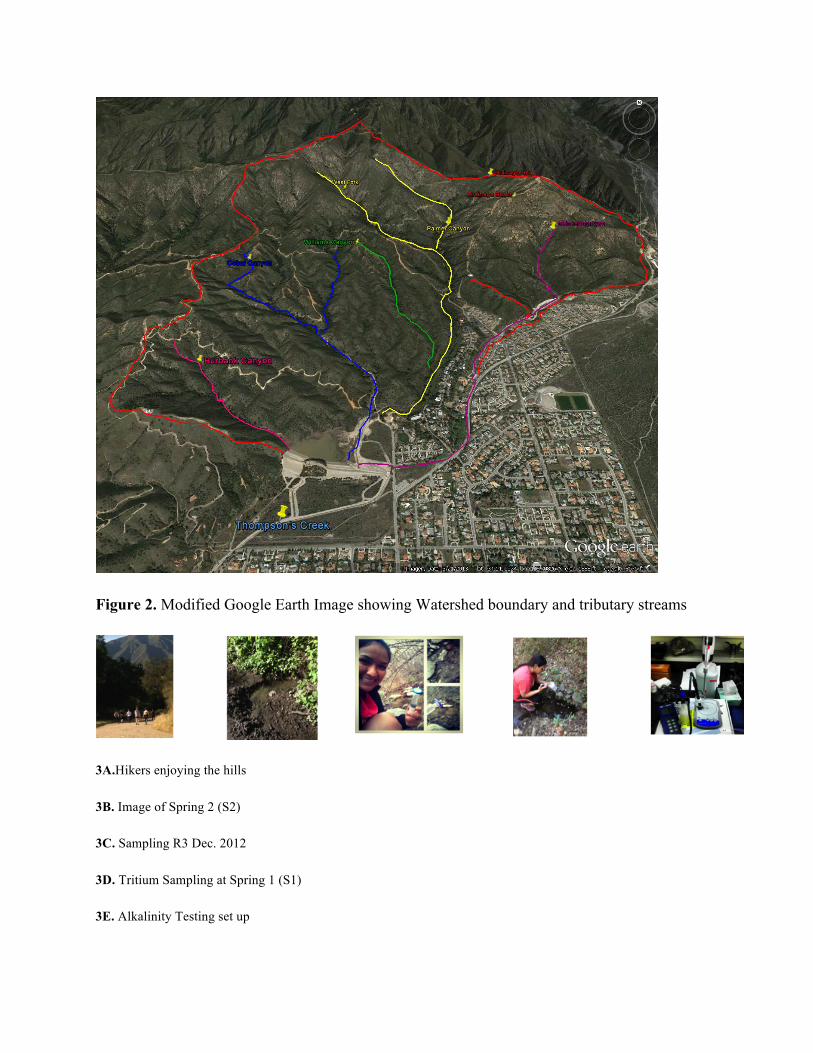
Figure 2. Modified Google Earth Image showing Watershed boundary and tributary streams
3A.Hikers enjoying the hills
3B. Image of Spring 2 (S2)
3C. Sampling R3 Dec. 2012
3D. Tritium Sampling at Spring 1 (S1)
3E. Alkalinity Testing set up

11
Figure 4. pH values in Thompson’s creek watershed.
Figure 5. Alkalinity Concentrations in Thompson’s creek watershed.
5
5.5
6
6.5
7
7.5
8
8.5
0 1 2 3 4 5
pH
Sample Location along the watershed (Highest to lowest)
S1 S2 R3 P4
0
50
100
150
200
250
300
350
400
450
0 1 2 3 4 5
Alk
alin
ity C
once
ntra
tion
in (m
g/L)
Sample Location along the watershed (Highest to lowest)
S1 S2 R3 P4
12
Figure 6. Fluoride concentration in Thompson’s Creek Watershed.
Figure 7. Sulfate concentrations in the Thompson’s Creek watershed.
0
0.5
1
1.5
2
2.5
0 1 2 3 4 5
Fluo
ride
Con
cent
ratio
n in
mg/
L
Sample Location along the watershed (Highest to lowest)
S1 S2 R3 P4
0
20
40
60
80
100
120
0 1 2 3 4 5
Sulfa
te C
once
ntra
tion
in M
g/L
Sample Location along the watershed (Highest to lowest) S1 S2 R3 P4
13
Figure 8. Chloride concentration of samples from the Thompson’s Creek watershed.
Figure 9. Tritium Chart displaying estimated ages of spring samples
0
10
20
30
40
50
60
0 1 2 3 4 5
Chl
orid
e C
once
ntra
tion
in M
g/L
Sample Location along the watershed (Highest to lowest) P4 R3 S2 S1
Sample ID TU (Tritium Unit) Error TU Estimated Age (Years)
S1 1.4 0.31 35S2 4.9 0.39 13
*Age was determined by the radioactive decay law for Tritium, assuming original Tritium Units in precipitation of 6.5, common for Southern CA.
14
Figure 10. Isotope ratios of H2 and O18 of Thompson’s creek watershed, Evey canyon and Ice house canyon springs.
-100
-80
-60
-40
-20
0
-15 -10 -5 0 5
δ2H
per
mil
(VSM
OW
)
δ18O per mil (VSMOW)
Precipitation Thompson's Creek - Springs Evey Canyon - Springs Ice House Canyon - Springs Linear (Precipitation)
Local Meteoric
Water L
ine

15
References
"Drinking Water Contaminants." Home. Web. 14 Sept. 2013. <http://water.epa.gov/drink/contaminants/>.