wcdma link budget
TRANSCRIPT
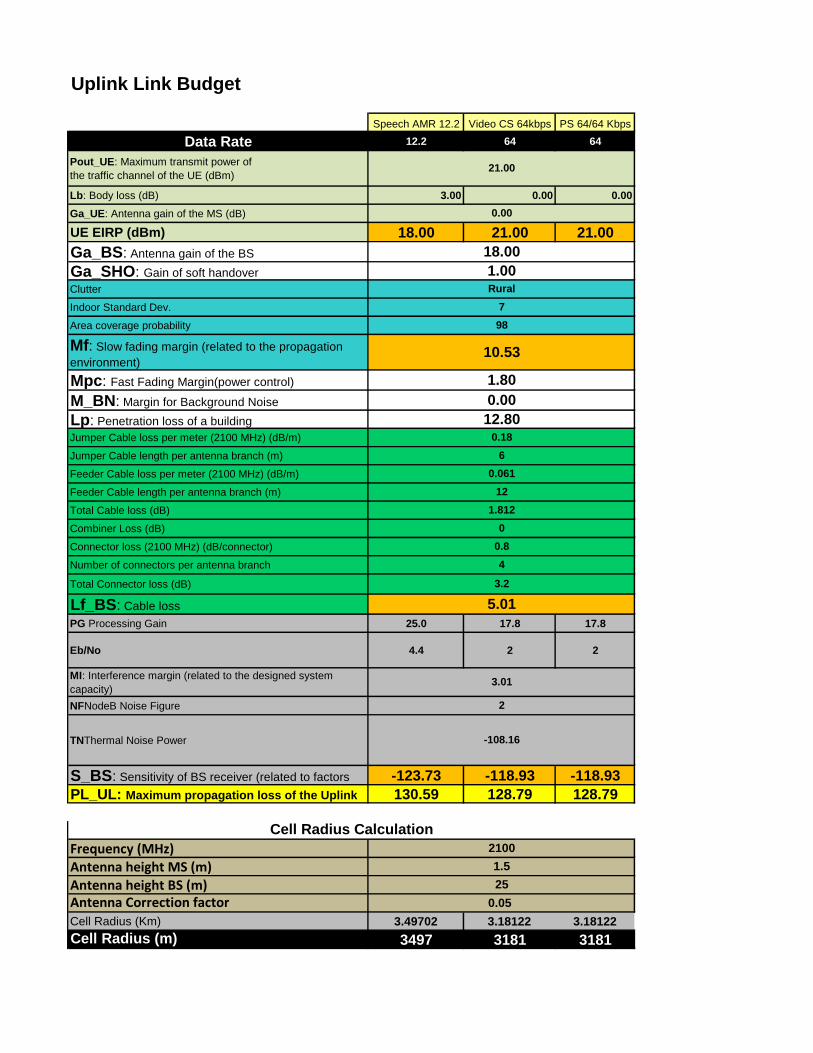
Uplink Link Budget
Speech AMR 12.2 Video CS 64kbps PS 64/64 Kbps
Data Rate 12.2 64 64
Pout_UE: Maximum transmit power of
the traffic channel of the UE (dBm)
Lb: Body loss (dB) 3.00 0.00 0.00
Ga_UE: Antenna gain of the MS (dB)
UE EIRP (dBm) 18.00 21.00 21.00
Ga_BS: Antenna gain of the BS
Ga_SHO: Gain of soft handover
Clutter
Indoor Standard Dev.
Area coverage probability
Mf: Slow fading margin (related to the propagation
environment)
Mpc: Fast Fading Margin(power control)
M_BN: Margin for Background Noise
Lp: Penetration loss of a building
Jumper Cable loss per meter (2100 MHz) (dB/m)
Jumper Cable length per antenna branch (m)
Feeder Cable loss per meter (2100 MHz) (dB/m)
Feeder Cable length per antenna branch (m)
Total Cable loss (dB)
Combiner Loss (dB)
Connector loss (2100 MHz) (dB/connector)
Number of connectors per antenna branch
Total Connector loss (dB)
Lf_BS: Cable loss
PG Processing Gain 25.0 17.8 17.8
Eb/No 4.4 2 2
MI: Interference margin (related to the designed system
capacity)
NFNodeB Noise Figure
TNThermal Noise Power
S_BS: Sensitivity of BS receiver (related to factors -123.73 -118.93 -118.93
PL_UL: Maximum propagation loss of the Uplink 130.59 128.79 128.79
Frequency (MHz)Antenna height MS (m)Antenna height BS (m)Antenna Correction factorCell Radius (Km) 3.49702 3.18122 3.18122
Cell Radius (m) 3497 3181 3181
2
21.00
Rural
7
98
10.53
1.80
3.01
12.800.18
6
0.061
12
1.812
0
0.8
4
3.2
5.01
0.00
-108.16
Cell Radius Calculation
2100
1.5
25
0.05
18.00
1.00
0.00

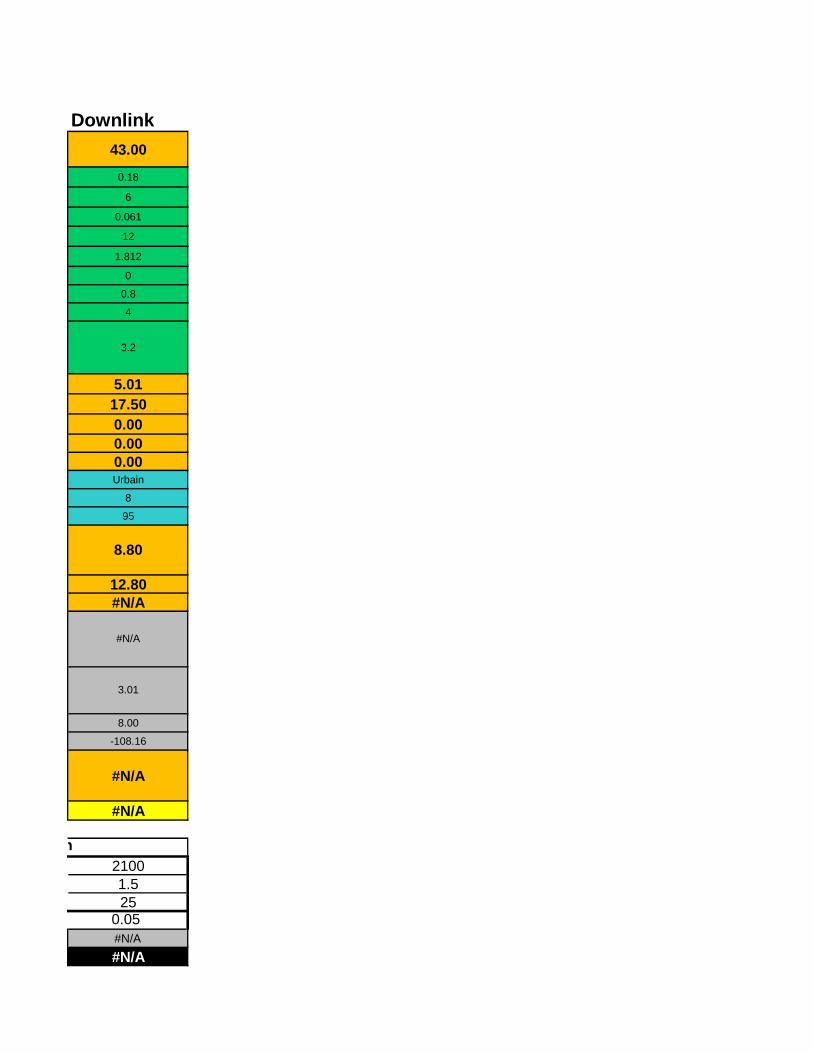
Downlink Link Budget
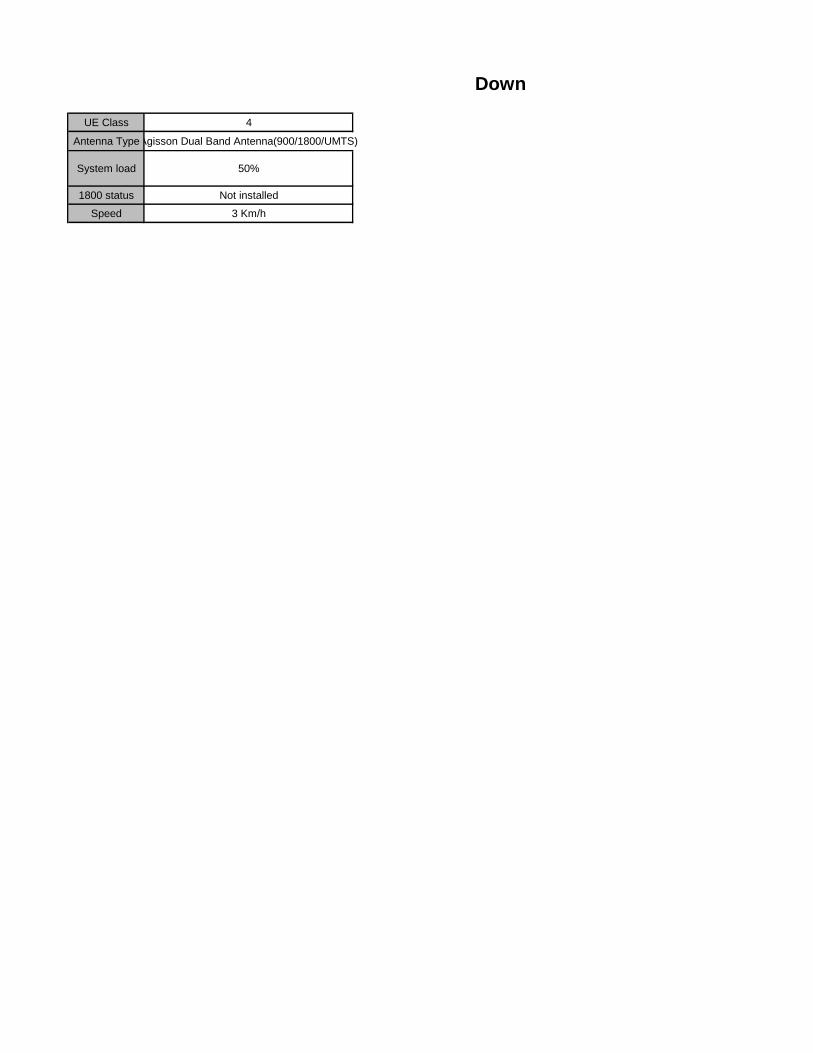
UE Class 4
Antenna TypeAgisson Dual Band Antenna(900/1800/UMTS)
System load 50%
1800 status Not installed
Speed 3 Km/h

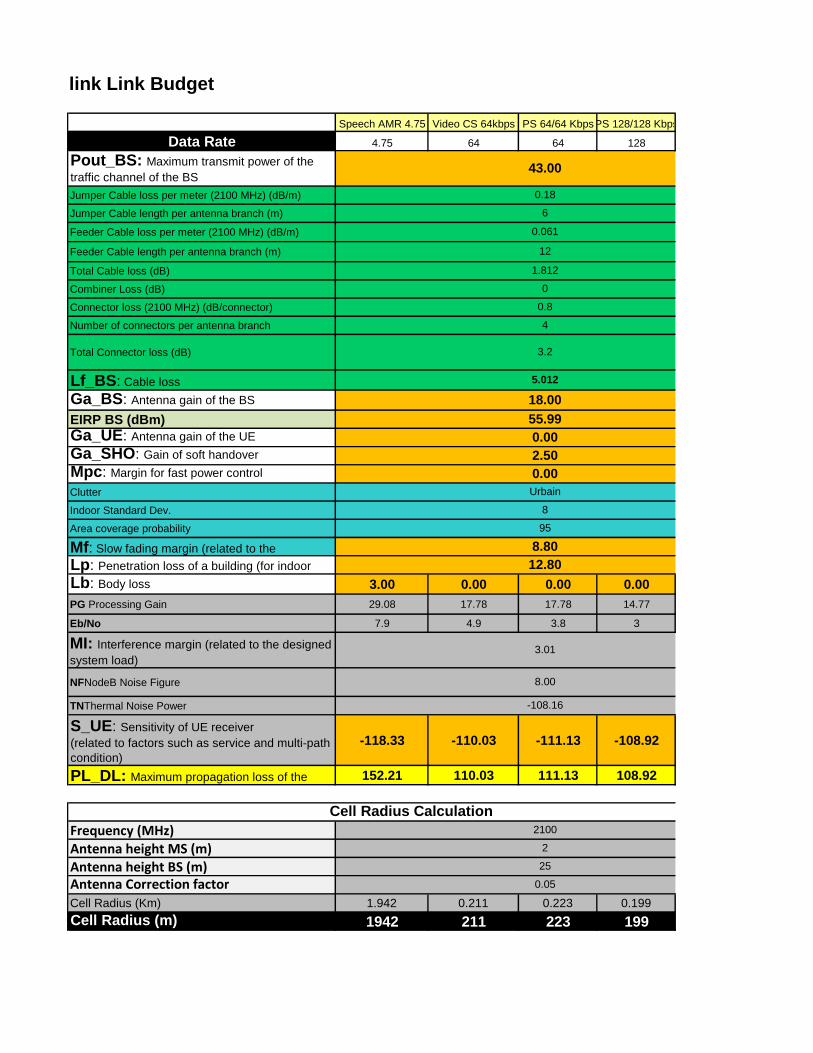
Downlink Link Budget
Speech AMR 4.75 Video CS 64kbps PS 64/64 KbpsPS 128/128 Kbps
Data Rate 4.75 64 64 128
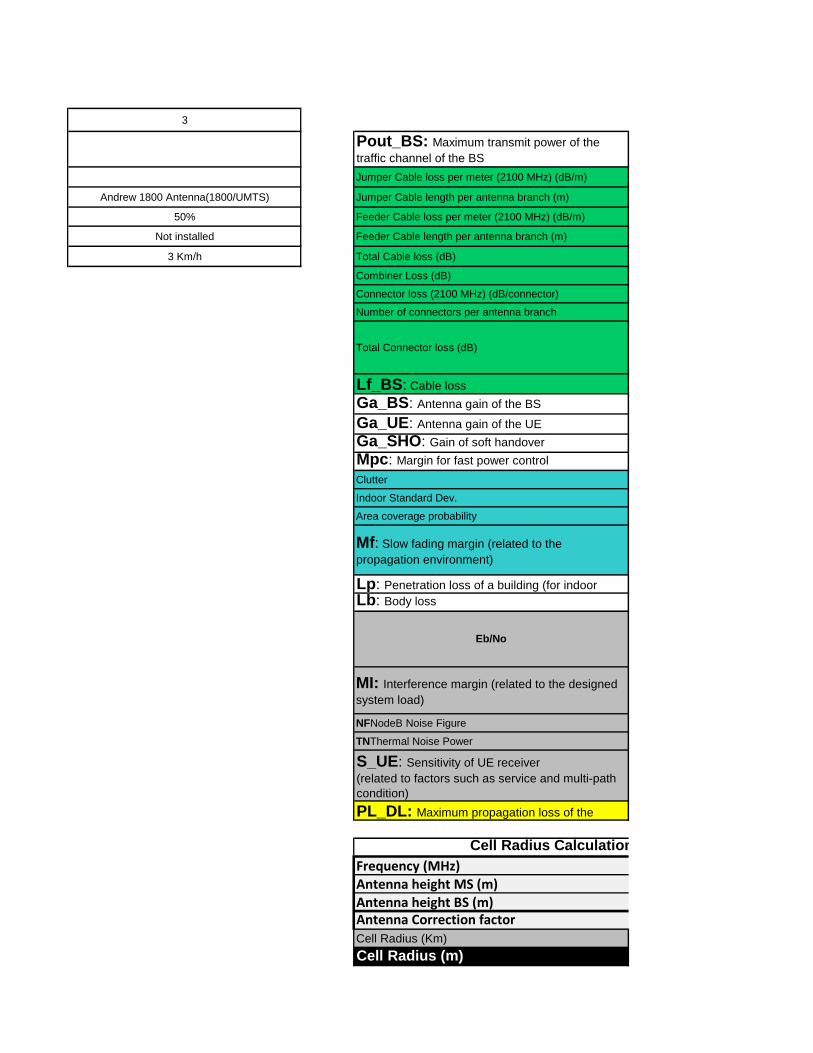
Pout_BS: Maximum transmit power of the
traffic channel of the BS
Jumper Cable loss per meter (2100 MHz) (dB/m)
Jumper Cable length per antenna branch (m)
Feeder Cable loss per meter (2100 MHz) (dB/m)
Feeder Cable length per antenna branch (m)
Total Cable loss (dB)
Combiner Loss (dB)
Connector loss (2100 MHz) (dB/connector)
Number of connectors per antenna branch
Total Connector loss (dB)
Lf_BS: Cable loss
Ga_BS: Antenna gain of the BS
EIRP BS (dBm)
Ga_UE: Antenna gain of the UE
Ga_SHO: Gain of soft handover
Mpc: Margin for fast power control
Clutter
Indoor Standard Dev.
Area coverage probability
Mf: Slow fading margin (related to the
Lp: Penetration loss of a building (for indoor
Lb: Body loss 3.00 0.00 0.00 0.00
PG Processing Gain 29.08 17.78 17.78 14.77
Eb/No 7.9 4.9 3.8 3
MI: Interference margin (related to the designed
system load)
NFNodeB Noise Figure
TNThermal Noise Power
S_UE: Sensitivity of UE receiver
(related to factors such as service and multi-path
condition)
-118.33 -110.03 -111.13 -108.92
PL_DL: Maximum propagation loss of the 152.21 110.03 111.13 108.92
Frequency (MHz)Antenna height MS (m)Antenna height BS (m)Antenna Correction factorCell Radius (Km) 1.942 0.211 0.223 0.199
Cell Radius (m) 1942 211 223 199
2100
2
0.00
12.80
3.01
8.00
-108.16
18.00
0
0.8
4
3.2
5.012
8.80
0.18
6
0.061
12
1.812
25
0.05
Cell Radius Calculation
43.00
55.99
2.50
0.00
Urbain
8
95

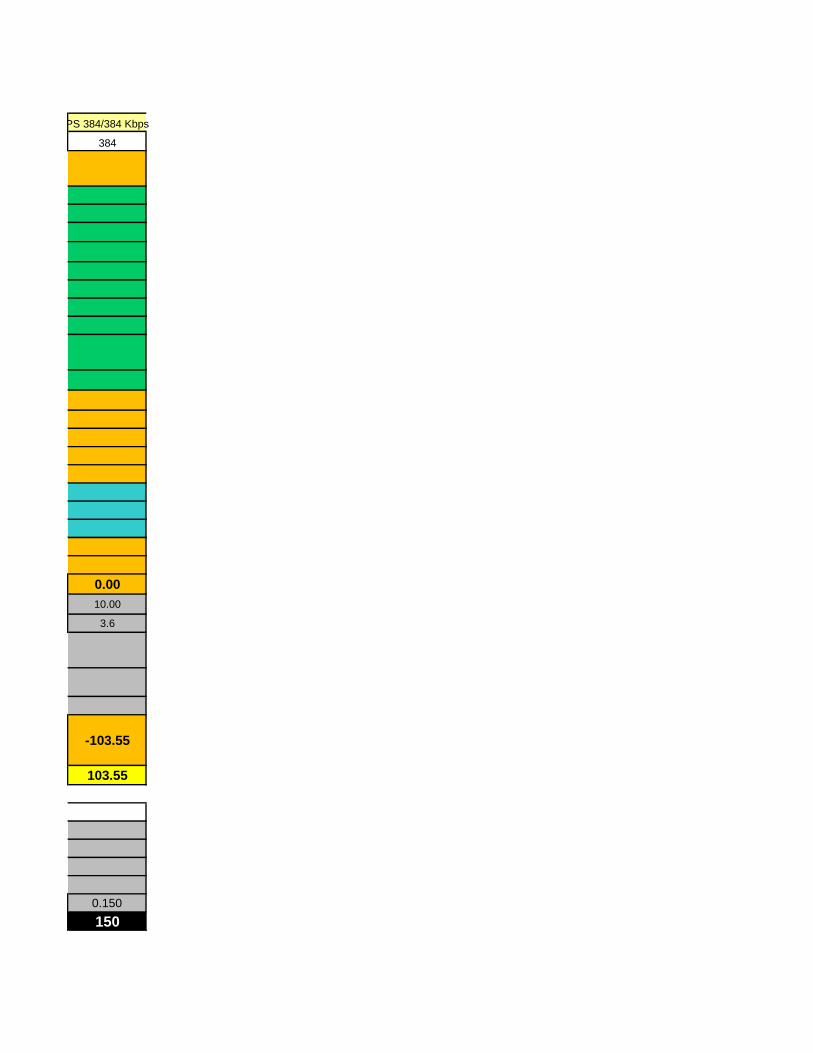
PS 384/384 Kbps
384
0.00
10.00
3.6
-103.55
103.55
0.150
150
2100
2
0.00
12.80
3.01
8.00
-108.16
18.00
0
0.8
4
3.2
5.012
8.80
0.18
6
0.061
12
1.812
25
0.05
Cell Radius Calculation
43.00
55.99
2.50
0.00
Urbain
8
95


Uplink UE Class
Pout_UE: Maximum transmit power of
the traffic channel of the UE (dBm)24.00 Service Type Uplink
Lb: Body loss (dB) #N/A Service Type Downlink
Ga_UE: Antenna gain of the MS (dB) 0.00 Antenna Type
UE EIRP (dBm) #N/A System load
Ga_BS: Antenna gain of the BS 17.50 1800 status
Ga_SHO: Gain of soft handover 3.00 Speed
Clutter Urbain
Indoor Standard Dev. 8
Area coverage probability 95
Mf: Slow fading margin (related to the
propagation environment)8.80
Mpc: Fast Fading Margin(power control) 1.80
M_BN: Margin for Background Noise 0.00
Lp: Penetration loss of a building 12.80
Jumper Cable loss per meter (2100 MHz) (dB/m) 0.18
Jumper Cable length per antenna branch (m) 6
Feeder Cable loss per meter (2100 MHz) (dB/m) 0.061
Feeder Cable length per antenna branch (m) 12
Total Cable loss (dB) 1.812
Combiner Loss (dB) 0
Connector loss (2100 MHz) (dB/connector) 0.8
Number of connectors per antenna branch 4
Total Connector loss (dB) 3.2
Lf_BS: Cable loss 5.01
PG Processing Gain #N/A
Eb/No #N/A
MI: Interference margin (related to the designed
system capacity)3.01
NFNodeB Noise Figure 2
TNThermal Noise Power -108.16
S_BS: Sensitivity of BS receiver (related to
factors such as service and multi-path
condition)
#N/A
PL_UL: Maximum propagation loss of the
Uplink#N/A
Frequency (MHz) 2100
Antenna height MS (m) 1.5
Antenna height BS (m) 25Antenna Correction factor 0.05
Cell Radius (Km) #N/A
Cell Radius (m) #N/A
Cell Radius Calculation

3
Pout_BS: Maximum transmit power of the
traffic channel of the BS
Jumper Cable loss per meter (2100 MHz) (dB/m)
Andrew 1800 Antenna(1800/UMTS) Jumper Cable length per antenna branch (m)
50% Feeder Cable loss per meter (2100 MHz) (dB/m)
Not installed Feeder Cable length per antenna branch (m)
3 Km/h Total Cable loss (dB)
Combiner Loss (dB)
Connector loss (2100 MHz) (dB/connector)
Number of connectors per antenna branch
Total Connector loss (dB)
Lf_BS: Cable loss
Ga_BS: Antenna gain of the BS
Ga_UE: Antenna gain of the UE
Ga_SHO: Gain of soft handover
Mpc: Margin for fast power control
Clutter
Indoor Standard Dev.
Area coverage probability
Lp: Penetration loss of a building (for indoor
Lb: Body loss
NFNodeB Noise Figure
TNThermal Noise Power
S_UE: Sensitivity of UE receiver
(related to factors such as service and multi-path
condition)
PL_DL: Maximum propagation loss of the
Frequency (MHz)Antenna height MS (m)Antenna height BS (m)Antenna Correction factorCell Radius (Km)
Cell Radius (m)
Mf: Slow fading margin (related to the
propagation environment)
Cell Radius Calculation
Eb/No
MI: Interference margin (related to the designed
system load)

Downlink
43.00
0.18
6
0.061
12
1.812
0
0.8
4
3.2
5.01
17.50
0.00
0.00
0.00Urbain
8
95
12.80
#N/A
8.00
-108.16
#N/A
#N/A
2100
1.5
250.05
#N/A
#N/A
8.80
Cell Radius Calculation
#N/A
3.01


Service Body Loss (dB) Data Rate
Speech AMR 12.2 3 12.2
Speech AMR 7.95 3 7.95
Speech AMR 5.9 3 5.9
Speech AMR 4.75 3 4.75
Speech WB-AMR 12.65 3 12.65
Speech WB-AMR 8.85 3 8.85
Speech WB-AMR 6.65 3 6.65
Video CS 64kbps 0 64
PS 64 Kbps 0 64
PS 8 Kbps 0 8
PS 16 Kbps 0 16
PS 32 Kbps 0 32
PS 128 Kbps 0 128
PS 256 Kbps 0 256
PS 384 Kbps 0 384
PS 1000 0 1000
Type d'antennes Specification technique Gain 900 Gain 1800
Bi-tech antenna (CDMA&GSM900) TDQ-809018DME-65F 17.5 NA
Andrew antenna(900/1800/UMTS) DBXLH-6565A-VTM 14.4 16.5
Andrew antenna (Small)(900/1800/UMTS) DBXLH-6565S-T0M 11.2 13.5
Katherin Direction antenna(900/1800/UMTS)XXPOL Panel 806-960/1710-2170 65°/60° 12/14 dbi 0°
/0° 7 : 74222612 14
Katherin Omni antenna(900) Vpol Omni 870-960 360° 8 dbi : 736350/736351 8 NA
Mono Band Antenna(900) 900 MET( Agisson-DX-824-960-65-17.5i-M) 17.5 NA
Agisson Dual Band Antenna(900/1800/UMTS)Agisson DXX-824-9601710-2170-6565-17.5i18i-MM 17.5 18
Andrew 1800 Antenna(1800/UMTS) HBX-6516DS-VTM NA 17.1
1800 Status Connectors number Combiner
Installed 6 0.3
Not installed 4 0
Clutter Type Standard deviation
Dense Urbain 8
Urbain 8
SubUrbain 8
Rural 7
6
Area SFMStd. Deviations (dB)

10 -19.34
20 -14.14
30 -10.92
40 -8.43
50 -6.25
60 -4.18
70 -2.08
80 0.28
90 3.43
95 5.95
96 6.67
97 7.55
98 8.72
99 10.54
speed Service HSDPA Eb/No Uplink Eb/No Downlink
3 Km/h Voice_3 Km/h 4.40 7.90
120 Km/h Data 64_3 Km/h 2.00 5.00
Data 128_3 Km/h 1.40 4.70
Data 384_3 Km/h 1.70 4.80
Voice_120 Km/h 5.40 7.40
Data 64_120 Km/h 2.90 4.50
Data 128_120 Km/h 2.40 4.20
Data 384_120 Km/h 2.90 4.30
Data 512_3 Km
Power Class Nominal maximum output power (dBm)
1 33
2 27
3 24
4 21
COST 231 Model Parameters
2100
1.5
25
0.05
Frequency (MHz)
Antenna height MS (m)
Antenna height BS (m)
Antenna Correction factor
Prbability (%)
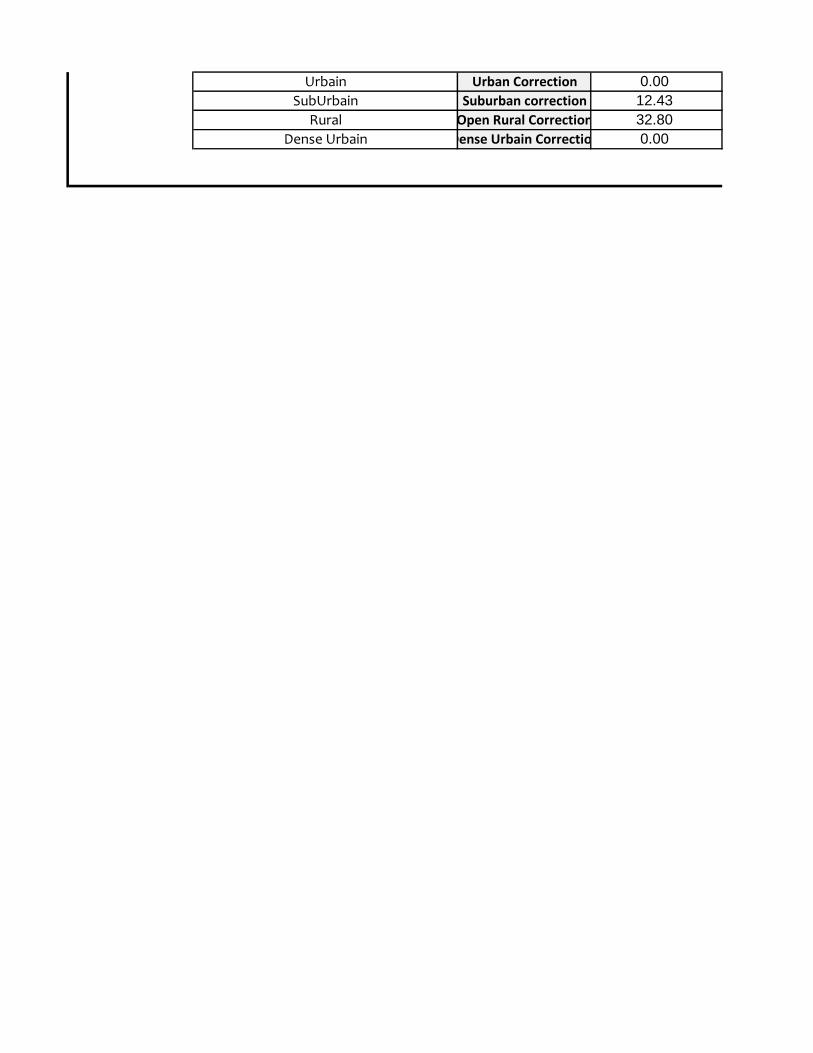
Urbain Urban Correction 0.00
SubUrbain Suburban correction 12.43
Rural Open Rural Correction 32.80
Dense Urbain Dense Urbain Correction 0.00
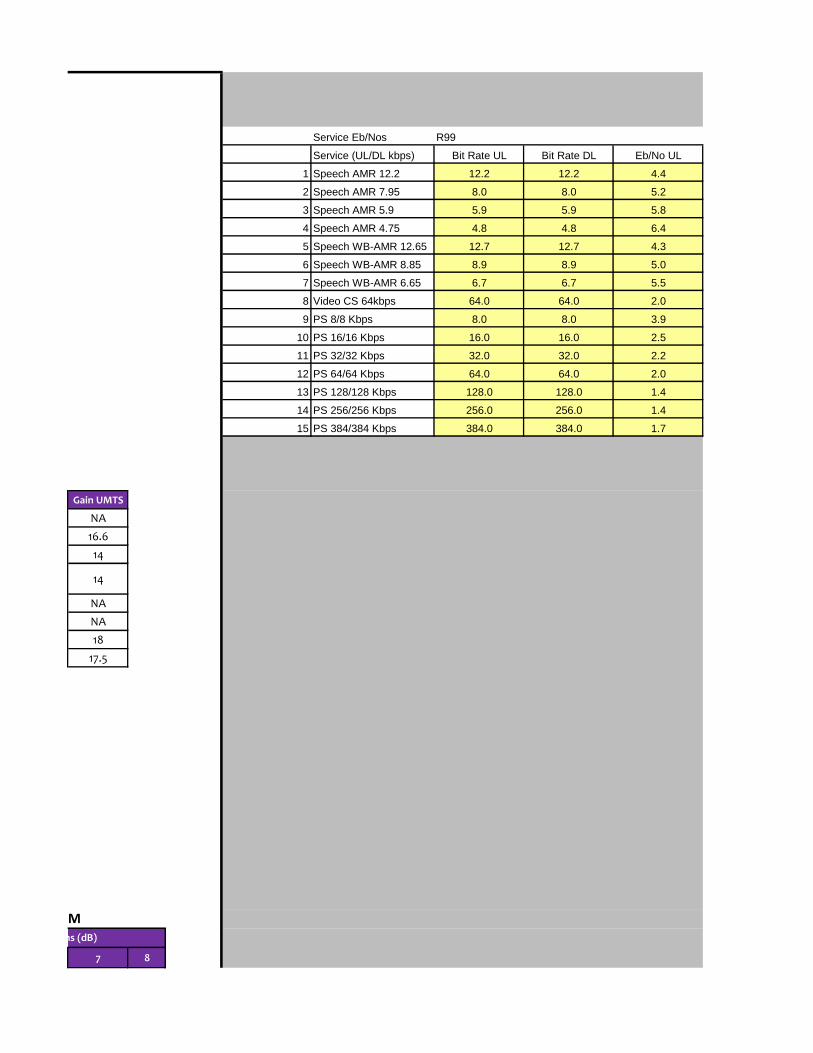
Service Eb/Nos R99
Service (UL/DL kbps) Bit Rate UL Bit Rate DL Eb/No UL
1 Speech AMR 12.2 12.2 12.2 4.4
2 Speech AMR 7.95 8.0 8.0 5.2
3 Speech AMR 5.9 5.9 5.9 5.8
4 Speech AMR 4.75 4.8 4.8 6.4
5 Speech WB-AMR 12.65 12.7 12.7 4.3
6 Speech WB-AMR 8.85 8.9 8.9 5.0
7 Speech WB-AMR 6.65 6.7 6.7 5.5
8 Video CS 64kbps 64.0 64.0 2.0
9 PS 8/8 Kbps 8.0 8.0 3.9
10 PS 16/16 Kbps 16.0 16.0 2.5
11 PS 32/32 Kbps 32.0 32.0 2.2
12 PS 64/64 Kbps 64.0 64.0 2.0
13 PS 128/128 Kbps 128.0 128.0 1.4
14 PS 256/256 Kbps 256.0 256.0 1.4
15 PS 384/384 Kbps 384.0 384.0 1.7
Gain UMTS
NA
16.6
14
14
NA
NA
18
17.5
7 8
Area SFMStd. Deviations (dB)

-20.19 -21.12
-14.85 -15.59
-11.46 -11.99
-8.77 -9.09
-6.39 -6.51
-4.11 -4.01
-1.76 -1.41
0.90 1.55
4.48 5.56
7.36 8.80
8.18 9.73
9.19 10.87
10.53 12.38
12.62 14.74

Eb/No DL Processing Gain
7.3 25.0
7.4 26.8
7.9 28.1
7.9 29.1
7.0 24.8
7.5 26.4
7.9 27.6
4.9 17.8
6.6 26.8
6.3 23.8
6.0 20.8
3.8 17.8
3.0 14.8
3.6 11.8
3.6 10.0
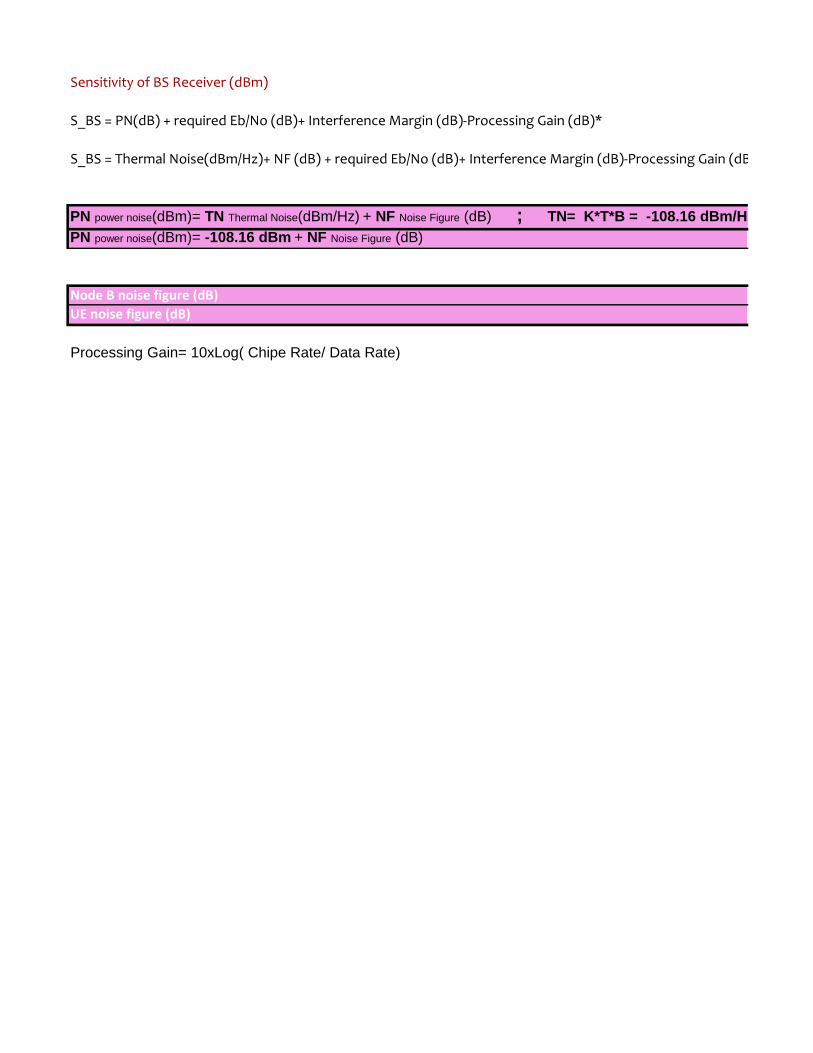
Sensitivity of BS Receiver (dBm)
S_BS = PN(dB) + required Eb/No (dB)+ Interference Margin (dB)-Processing Gain (dB)*
S_BS = Thermal Noise(dBm/Hz)+ NF (dB) + required Eb/No (dB)+ Interference Margin (dB)-Processing Gain (dB)
PN power noise(dBm)= TN Thermal Noise(dBm/Hz) + NF Noise Figure (dB) ; TN= K*T*B = -108.16 dBm/Hz
PN power noise(dBm)= -108.16 dBm + NF Noise Figure (dB)
Node B noise figure (dB)
UE noise figure (dB)
Processing Gain= 10xLog( Chipe Rate/ Data Rate)

http://fr.slideshare.net/riadhbachrouch/dimensioning-wcdma-ran-22070030
S_BS = Thermal Noise(dBm/Hz)+ NF (dB) + required Eb/No (dB)+ Interference Margin (dB)-Processing Gain (dB)
PN power noise(dBm)= TN Thermal Noise(dBm/Hz) + NF Noise Figure (dB) ; TN= K*T*B = -108.16 dBm/Hz
2
8
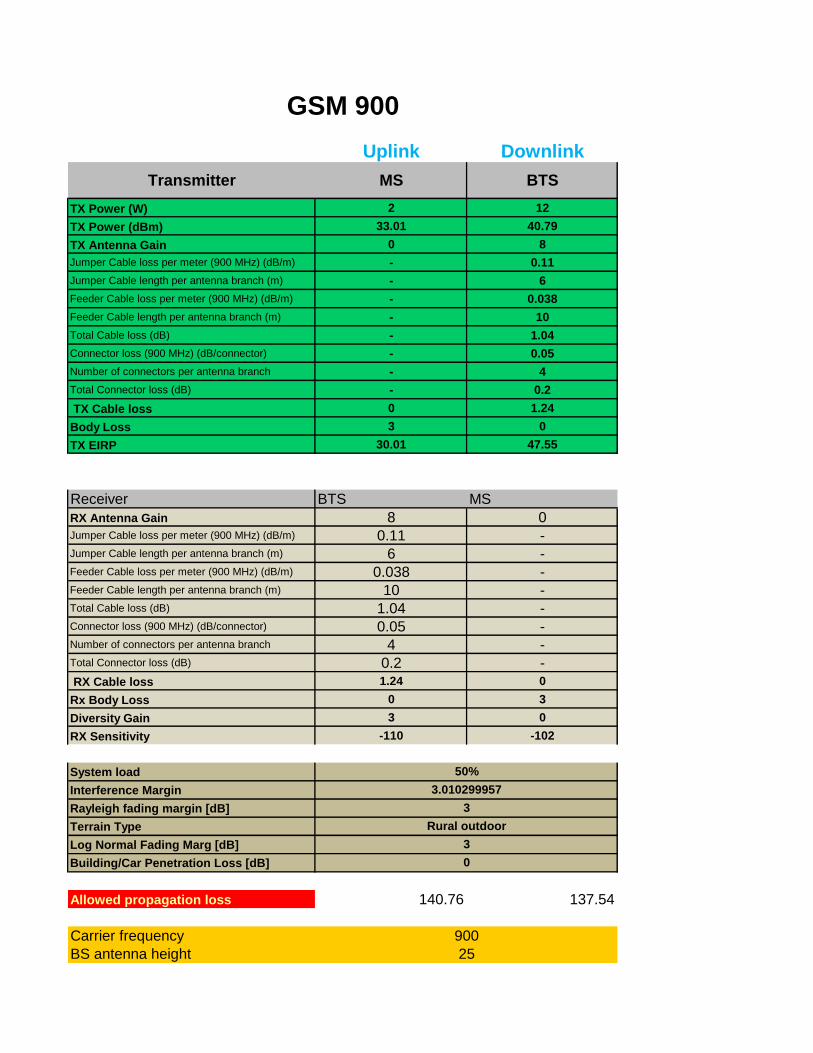
Uplink Downlink
TX Power (W) 2 12
TX Power (dBm) 33.01 40.79
TX Antenna Gain 0 8
Jumper Cable loss per meter (900 MHz) (dB/m) - 0.11
Jumper Cable length per antenna branch (m) - 6
Feeder Cable loss per meter (900 MHz) (dB/m) - 0.038
Feeder Cable length per antenna branch (m) - 10
Total Cable loss (dB) - 1.04
Connector loss (900 MHz) (dB/connector) - 0.05
Number of connectors per antenna branch - 4
Total Connector loss (dB) - 0.2
TX Cable loss 0 1.24
Body Loss 3 0
TX EIRP 30.01 47.55
Receiver BTS MS
RX Antenna Gain 8 0Jumper Cable loss per meter (900 MHz) (dB/m) 0.11 -Jumper Cable length per antenna branch (m) 6 -Feeder Cable loss per meter (900 MHz) (dB/m) 0.038 -Feeder Cable length per antenna branch (m) 10 -Total Cable loss (dB) 1.04 -Connector loss (900 MHz) (dB/connector) 0.05 -Number of connectors per antenna branch 4 -Total Connector loss (dB) 0.2 -
RX Cable loss 1.24 0
Rx Body Loss 0 3
Diversity Gain 3 0
RX Sensitivity -110 -102
System load
Interference Margin
Rayleigh fading margin [dB]
Terrain Type
Log Normal Fading Marg [dB]
Building/Car Penetration Loss [dB]
Allowed propagation loss 140.76 137.54
Carrier frequency
BS antenna height
MS BTSTransmitter
3.010299957
50%
3
Rural outdoor
3
0
900
25
GSM 900
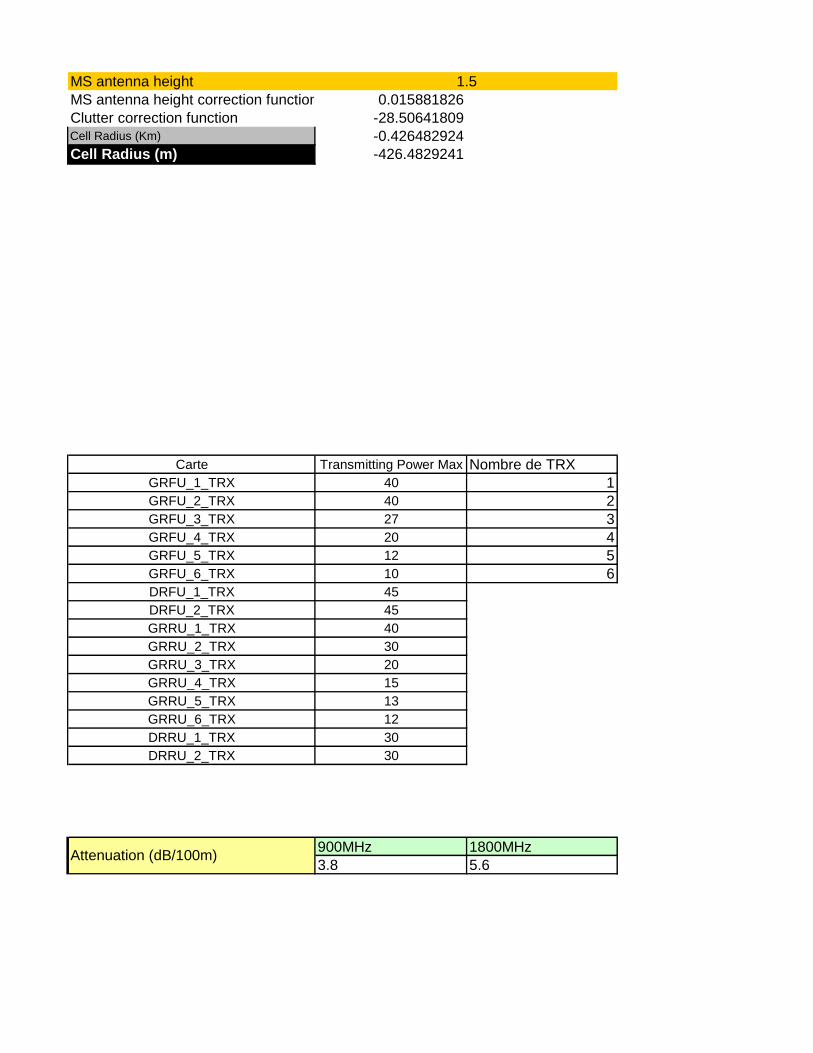
MS antenna height
MS antenna height correction function 0.015881826
Clutter correction function -28.50641809
Cell Radius (Km) -0.426482924
Cell Radius (m) -426.4829241
Carte Transmitting Power Max Nombre de TRX
GRFU_1_TRX 40 1
GRFU_2_TRX 40 2
GRFU_3_TRX 27 3
GRFU_4_TRX 20 4
GRFU_5_TRX 12 5
GRFU_6_TRX 10 6
DRFU_1_TRX 45
DRFU_2_TRX 45
GRRU_1_TRX 40
GRRU_2_TRX 30
GRRU_3_TRX 20
GRRU_4_TRX 15
GRRU_5_TRX 13
GRRU_6_TRX 12
DRRU_1_TRX 30
DRRU_2_TRX 30
900MHz 1800MHz
3.8 5.6Attenuation (dB/100m)
1.5

BTS Type Type de cartes BTS Sensitivity
BTS 3900 GRFU -113
DBS 3900 DRFU -113
GRRU
DRRU
Type d'antennes Specification technique Gain 900
Bi-tech antenna (CDMA&GSM900) TDQ-809018DME-65F 17.5
Andrew antenna(900/1800/UMTS) DBXLH-6565A-VTM 14.4
Andrew antenna (Small)(900/1800/UMTS) DBXLH-6565S-T0M 11.2
Katherin Direction antenna(900/1800/UMTS)
XXPOL Panel 806-960/1710-
2170 65°/60° 12/14 dbi 0° /0° 7
: 742226
12
Katherin Omni antenna(900) Vpol Omni 870-960 360° 8 dbi : 736350/736351 8
Mono Band Antenna(900) 900 MET( Agisson-DX-824-960-65-17.5i-M) 17.5
Agisson Dual Band Antenna(900/1800/UMTS)Agisson DXX-824-9601710-2170-6565-17.5i18i-MM 17.5
Andrew 1800 Antenna(1800/UMTS) HBX-6516DS-VTM NA
Terrain Type: Urban SubUrban
Log Normal Fading Marg [dB] 8.4 6.8
Building/Car Penetration Loss [dB] 22.6 14.2
Clutter Correction 0 -9.942607248
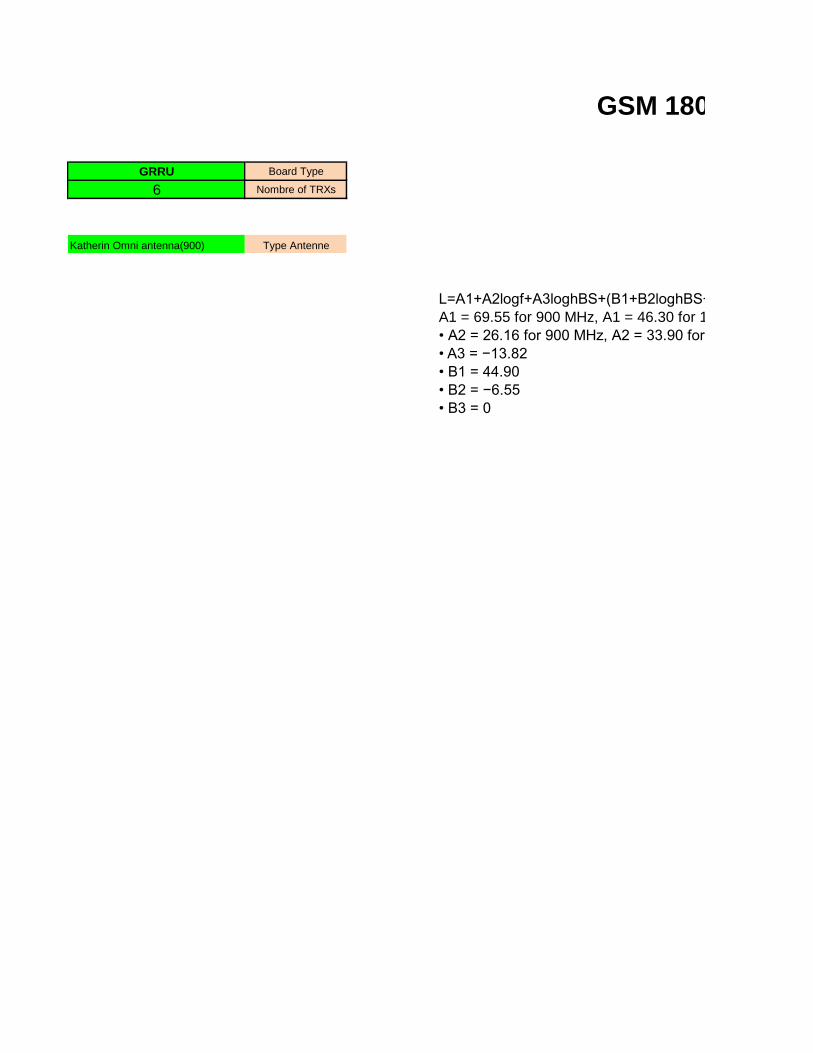
GRRU Board Type
6 Nombre of TRXs
Katherin Omni antenna(900) Type Antenne
L=A1+A2logf+A3loghBS+(B1+B2loghBS+B3hBS)logd – a(hm)– Cclutter
A1 = 69.55 for 900 MHz, A1 = 46.30 for 1800 MHz
• A2 = 26.16 for 900 MHz, A2 = 33.90 for 1800 MHz
• A3 = −13.82
• B1 = 44.90
• B2 = −6.55
• B3 = 0
GSM 1800


Gain 1800 Gain UMTS
NA NA
16.5 16.6
13.5 14
14 14
NA NA
NA NA
18 18
17.1 17.5
Rural incar Rural outdoor
3.0 3.0
6.0 0.0
-28.50641809 -28.50641809
L=A1+A2logf+A3loghBS+(B1+B2loghBS+B3hBS)logd – a(hm)– Cclutter
A1 = 69.55 for 900 MHz, A1 = 46.30 for 1800 MHz
• A2 = 26.16 for 900 MHz, A2 = 33.90 for 1800 MHz
GSM 1800