whole-cell circular dichroism ... - ueaeprints.uea.ac.uk · this ournal is ' the royal ociety...
TRANSCRIPT
This journal is©The Royal Society of Chemistry 2018 Chem. Commun.
Cite this:DOI: 10.1039/c8cc06309e
Whole-cell circular dichroism differencespectroscopy reveals an in vivo-specificdeca-heme conformation in bacterial surfacecytochromes†‡
Yoshihide Tokunou, a Punthira Chinotaikul,a Shingo Hattori,b Thomas A. Clarke,c
Liang Shi,d Kazuhito Hashimoto,e Kazuyuki Ishii b and Akihiro Okamoto*e
We established whole-cell circular dichroism difference spectro-
scopy to identify the inter-heme interaction in deca-heme cyto-
chrome protein MtrC in whole cell. Our data showed that the heme
alignment of reduced MtrC in whole cell is distinct from that in
purified one, suggesting the in vivo specific electron transport
kinetics.
Bacterial electron transport to a solid substrate or electrodelocated extracellularly is accomplished by unidirectional electronflow via an array of more than twenty heme redox centersarranged in the outer membrane c-type cytochrome complex(OM c-Cyts).1–4 The biological electron conduction occurs with arate constant of 104–105 electrons per second along a distanceover 100 Å.4–6 The ability of the multi-heme alignment andinteraction to promote highly efficient long-range electrontransport under non-equilibrium conditions has been a focalpoint for nanoscale electronic applications.7,8 Recent studieshave resolved the three dimensional structures of some units inOM c-Cyts, MtrC, MtrF and OmcA, at atomic resolution in a modelbacterium, Shewanella oneidensis MR-1.5,9,10 The redox potential andelectronic coupling among hemes have been investigated using the
crystal structure, and significant contributions elucidating functionsincluding electron transfer rates and pathways among hemes havebeen achieved.6,9–13 However, the structural flexibility of a unit inOM c-Cyts has been suggested by small-angle X-ray scattering;14
thus, rearrangement of the heme conformation in vivo is likelyinfluenced by interactions with the OM, solid electron acceptors,cofactors, and proteins as well as by a shift in equilibrium from thecontinuous electron flow in a thermodynamically open livingsystem.15–18 Therefore, establishing a methodology to directlymonitor the heme arrangement in intact cells is critical.
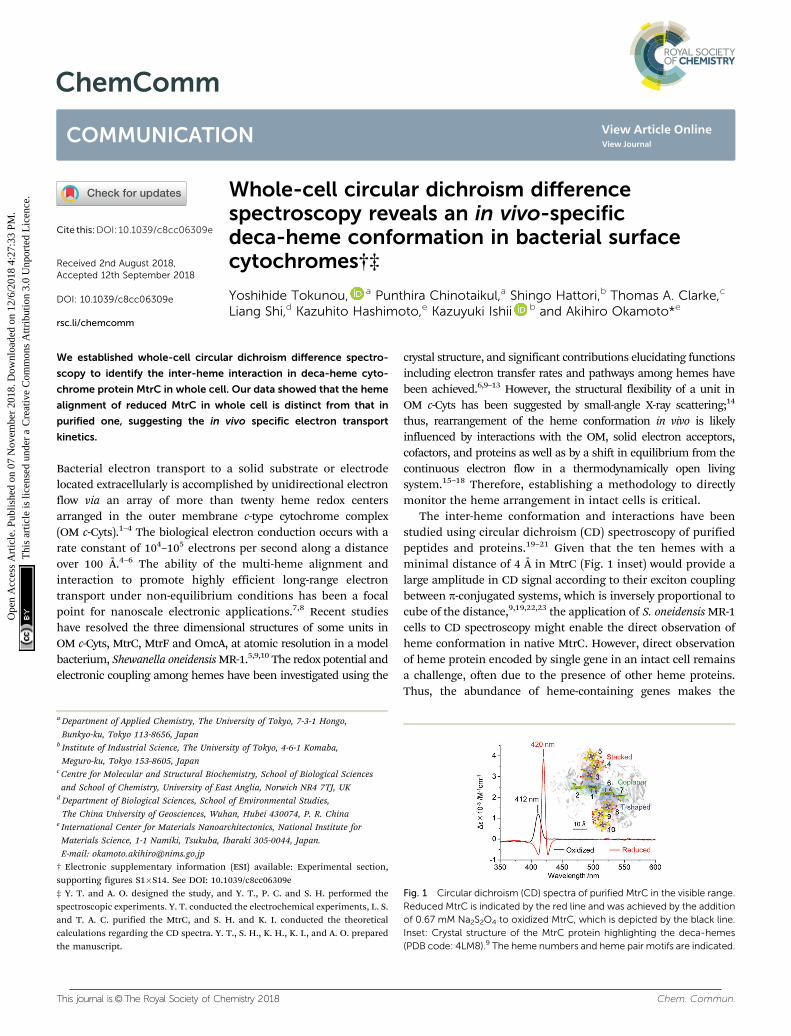
The inter-heme conformation and interactions have beenstudied using circular dichroism (CD) spectroscopy of purifiedpeptides and proteins.19–21 Given that the ten hemes with aminimal distance of 4 Å in MtrC (Fig. 1 inset) would provide alarge amplitude in CD signal according to their exciton couplingbetween p-conjugated systems, which is inversely proportional tocube of the distance,9,19,22,23 the application of S. oneidensis MR-1cells to CD spectroscopy might enable the direct observation ofheme conformation in native MtrC. However, direct observationof heme protein encoded by single gene in an intact cell remainsa challenge, often due to the presence of other heme proteins.Thus, the abundance of heme-containing genes makes the
Fig. 1 Circular dichroism (CD) spectra of purified MtrC in the visible range.Reduced MtrC is indicated by the red line and was achieved by the additionof 0.67 mM Na2S2O4 to oxidized MtrC, which is depicted by the black line.Inset: Crystal structure of the MtrC protein highlighting the deca-hemes(PDB code: 4LM8).9 The heme numbers and heme pair motifs are indicated.
a Department of Applied Chemistry, The University of Tokyo, 7-3-1 Hongo,
Bunkyo-ku, Tokyo 113-8656, Japanb Institute of Industrial Science, The University of Tokyo, 4-6-1 Komaba,
Meguro-ku, Tokyo 153-8605, Japanc Centre for Molecular and Structural Biochemistry, School of Biological Sciences
and School of Chemistry, University of East Anglia, Norwich NR4 7TJ, UKd Department of Biological Sciences, School of Environmental Studies,
The China University of Geosciences, Wuhan, Hubei 430074, P. R. Chinae International Center for Materials Nanoarchitectonics, National Institute for
Materials Science, 1-1 Namiki, Tsukuba, Ibaraki 305-0044, Japan.
E-mail: [email protected]
† Electronic supplementary information (ESI) available: Experimental section,supporting figures S1�S14. See DOI: 10.1039/c8cc06309e‡ Y. T. and A. O. designed the study, and Y. T., P. C. and S. H. performed thespectroscopic experiments. Y. T. conducted the electrochemical experiments, L. S.and T. A. C. purified the MtrC, and S. H. and K. I. conducted the theoreticalcalculations regarding the CD spectra. Y. T., S. H., K. H., K. I., and A. O. preparedthe manuscript.
Received 2nd August 2018,Accepted 12th September 2018
DOI: 10.1039/c8cc06309e
rsc.li/chemcomm
ChemComm
COMMUNICATION
Ope
n A
cces
s A
rtic
le. P
ublis
hed
on 0
7 N
ovem
ber
2018
. Dow
nloa
ded
on 1
2/6/
2018
4:2
7:33
PM
. T
his
artic
le is
lice
nsed
und
er a
Cre
ativ
e C
omm
ons
Attr
ibut
ion
3.0
Unp
orte
d L
icen
ce.
View Article OnlineView Journal

Chem. Commun. This journal is©The Royal Society of Chemistry 2018
characterization of MtrC particularly difficult in an intact cell ofS. oneidensis MR-1.24 Here, we established the whole-cell CDdifference spectroscopy using S. oneidensis MR-1 wild type (WT)and mutant strain lacking MtrC to acquire the CD signal of MtrCunder native conditions. Our data revealed that, compared topurified MtrC, reduced, but not oxidized, MtrC in intact cellsexhibits a distinct heme alignment and that this alignment likelyaffects the rate of electron transport.
First, we examined the extent of exciton coupling among theten heme centers in MtrC using CD spectroscopy. Purified MtrCin HEPES buffer was added to a Pyrex cuvette with a 1.0 cmoptical path length and exhibited a positive peak at 412 nm inthe CD spectrum and Soret peak absorption at 410 nm, whichwas assigned to the hemes in MtrC (Fig. 1 and Fig. S1, ESI†).25
Upon MtrC reduction by 0.67 mM Na2S2O4, the positive CDpeak signal shifted to 420 nm, and relatively small negativesignals appeared (Fig. 1).22,23 The peak CD signal intensities inthe oxidized and reduced MtrC (De) were 1.19 � 103 and 3.86 �103 M�1 cm�1, respectively, which are two orders of magnitudelarger than that of mono-heme horse heart cytochrome c(approximately 17 M�1 cm�1).26 Considering that this intensity iseven larger than that of the artificially synthesized bis-porphyrincompound (De is approximately 400 M�1 cm�1),22,27,28 the De ofMtrC is extraordinary large. CD calculations based on the excitonchirality method19,29 reproduced the relative intensity betweenreduced and oxidized MtrC (Fig. S2, ESI†), suggesting that theexciton coupling among ten heme centers in MtrC dominates theobserved CD intensity. This extraordinary large CD intensitypossibly enables CD spectroscopy of an intact cell to reveal theconformation of native MtrC.
However, to accomplish the identification of the CD signalof the MtrC protein in intact S. oneidensis MR-1 cells, we had toovercome two problems concerning background signal: lightscattering and interference from other cytochrome proteins.Because use of intact cells decreases the detectable light due toscattering from cell surfaces,16 the signal-to-noise ratio waspoor, and a broad background peak was observed throughoutthe visible light region (Fig. 2a and Fig. S3, ESI†). Thus, weoptimized CD measurement conditions as follows: the celldensity was set as an optical density (OD) at 600 nm of 1.33 �0.02, and the 1.0 nm bandwidth for purified MtrC was changedto 5.0 nm for intact cells (Fig. S4, ESI†). Second, we minimizedinterference from the other cytochromes in S. oneidensis MR-1cells by subtracting the CD spectrum from a mutant with adeletion in the gene encoding the MtrC protein (DmtrC) fromthe WT spectrum. The CD spectrum of WT suspended indefined-medium in a Pyrex cuvette with a 1.0 cm path lengthshowed a strong signal near the Soret band, which was clearlydiminished in DmtrC (Fig. 2a). The difference in the CD spectrumbetween WT and DmtrC showed a large signal with a peak at413 nm, which is almost identical in wavelength to the purifiedMtrC protein (Fig. 2b). Furthermore, the reduction of native MtrCin S. oneidensis MR-1 by the addition of an electron donor, 30 mMlactate, under anaerobic condition shifted the peak to a longerwavelength centered at 421 nm with splitting signals (Fig. 2b andFig. S5, ESI†). The peak position and peak width in both the
oxidized and reduced states were almost identical to the CDspectrum of the purified MtrC protein (Fig. 2b).
Correlation of the intensity of the Soret CD peak with theconcentration of the MtrC protein in cell suspension confirmedthe assignment of the CD peak signals as native MtrC. Fig. 2cand d show the relationship between the intensity of thewhole-cell CD difference spectrum at 413 nm (D[y](413nm)) andthe amount of MtrC in the cell suspension during variousaerobic growth phases estimated by SDS-PAGE.30,31 Consistentwith a previous report,32 the MtrC concentration in the cellsuspension increased depending on the growth phase and thedeletion of mtrC gene had scarce impact on gene expression ofother major proteins (Fig. 2c, d and Fig. S6, ESI†). While theSoret absorption peak intensity indicates that the amount ofMtrC is less than 20% of total cytochrome proteins (Fig. 2ainset), the D[y](413nm) linearly increased with MtrC concentration,and the squares of the correlation coefficient of 0.979 (black line inFig. 2d) passed through the origin. This direct positive relationshipstrongly suggests that the whole-cell CD difference spectrum in theSoret region represents the signal from the native MtrC protein. Incontrast, the amounts of other cytochromes in the cell fluctuate ineach growth phase, as the absorption peak intensity at 410 nmshowed poor correlation with the amount of the MtrC protein(Fig. 2d inset, R2 = 0.746), further supporting that the Soret CDsignal is specific for the MtrC protein in native environment.
Notably, the Soret CD peak intensity of oxidized native MtrCobtained from the slope in Fig. 2d (De(413nm) = 1.11� 103 M�1 cm�1)
Fig. 2 (a) Circular dichroism (CD) spectra of whole S. oneidensis MR-1cells (wild-type, WT; black line) and a mutant strain deficient for the mtrCgene (DmtrC; blue line). The cell density was adjusted to OD600 = 1.33 �0.02. Inset: Absorption spectra of the same samples in diffused transmis-sion mode. (b) Differences in CD spectra between WT and DmtrC oxidizedby oxygen (black line) and reduced by 30 mM lactate (red line). The errorbars represent the mean � SEM obtained using three individual samplesand eight measurements each. (c) The differences in CD spectra betweenWT and DmtrC at various growth phases in the oxidized state. (d) Plots ofthe changes in CD signal intensity at 413 nm observed in (c) (D[y](413nm))against the MtrC concentration in the cell suspension. The squares of thecorrelation coefficients (R2 = 0.979, black line) include the point of origin.The gray line represents the CD signal intensity for purified MtrC at 412 nmestimated from De = 1.19 � 103 M�1 cm�1. Inset: The plots of DAbs at410 nm between WT and DmtrC against the MtrC concentration.
Communication ChemComm
Ope
n A
cces
s A
rtic
le. P
ublis
hed
on 0
7 N
ovem
ber
2018
. Dow
nloa
ded
on 1
2/6/
2018
4:2
7:33
PM
. T
his
artic
le is
lice
nsed
und
er a
Cre
ativ
e C
omm
ons
Attr
ibut
ion
3.0
Unp
orte
d L
icen
ce.
View Article Online

This journal is©The Royal Society of Chemistry 2018 Chem. Commun.
was almost identical to that of purified MtrC (De(412nm) = 1.19 �103 M�1 cm�1), indicating that native MtrC maintains thearrangement of heme centers. In contrast, once native MtrCwas reduced, the Soret CD intensity (whole-cell: De = 1.97 �103 M�1 cm�1) was approximately twofold lower than that ofpurified MtrC (De = 3.86 � 103 M�1 cm�1), and the splittingsignals around the positive peak at 420 nm were suppressed(Fig. 3a and Fig. S7, ESI†), indicating the possibility of aconformational change in native MtrC associated with thereduction reaction. Furthermore, purified MtrC exhibited aSoret CD signal with a distinct pH dependency in the reducedstate (Fig. 3b and Fig. S8, ESI†). In the oxidized state, bothpurified and native MtrC maintained the Soret peak at a similarintensity throughout the physiological pH range. However,reduced native MtrC exhibited a drastic decrease in De of SoretCD peak at a pH of approximately 7 that was not observed inpurified MtrC (Fig. 3b and Fig. S8–S10, ESI†). These distinct CDprofiles suggest that the inter-heme interaction of reduced MtrCdiffers between in native and purified system. In addition tointer-heme interaction, aromatic amino acids in the vicinity ofhemes, specifically bis-histidine coordinated to deca-hemes,potentially alter CD amplitude.33,34 Therefore, we conductedmagnetic CD (MCD) spectroscopy to examine the coordinationstate of heme centers in reduced native and purified MtrCs.Both MCD spectra exhibited a dispersion-type Faraday A termwith a center wavelength of approximately 550 nm (Fig. S11,ESI†), which is characteristic of the low-spin Fe2+ state. Thesedata suggest that the coordination of bis-histidine with thedeca-hemes is maintained inside native MtrC as well as purified
MtrC in the reduced state35–37 and has little effect on Soret CDpeak intensity. Therefore, the CD signal decrease in reducedMtrC in native compared with purified system (Fig. 3a) and at apH of approximately 7 in native reduced MtrC (Fig. 3b) are likelyassignable to changes in inter-heme interaction.
Accordingly, the electron transport kinetics through theheme centers in native MtrC represented a similar pH dependencywith CD signal. We performed a whole-cell electrochemical assayto probe the microbial lactate-oxidation current, which is limitedby the rate of electron transport via OM c-Cyts under ourexperimental conditions (Fig. S12, ESI†).38,39 At a pH below 7,current production at +0.4 V (versus a standard hydrogenelectrode) significantly decreased compared with higher pHconditions (Fig. S12, ESI†), suggesting that the CD signaldecrease at pH of between 7.4 and 6.8 corresponded with therate of electron transport via the heme conduit in MtrC. Incontrast, such pH dependency was not observed in the redoxproperty of purified MtrC protein,25 which is also consistentwith the pH susceptibility of CD signal in purified MtrC(Fig. 3b). Assuming that the conformational change of hemesin reduced native MtrC decreases the electron flux, the criticalconformational change may occur in T-shaped heme pairs (1,3and 6,8) and coplanar heme pairs (2,1, 1,6 and 6,7) (Fig. 1 inset)because they mediate slower electron transport reactions thanother stacked heme pairs in MtrF, which is a homologue ofMtrC.6 Given that the orientation change in T-shaped hemepairs potentially alters the electron transfer matrix element over1000 times,40 T-shaped heme pairs are the most likely candidatescausing the decrease of electron transport rate. Similarly, the Decalculation based on the exciton chirality method19,29 indicatedthat the T-shaped heme pairs have a larger impact on not onlyelectron transport kinetics but also CD signal intensity comparedwith coplanar pairs (Fig. S13, ESI†).22,27 However, given thestacked heme pairs provided more significant contribution inDe value, the pH dependent conformational change in reducednative MtrC may not be limited to T-shaped heme pairs but alsoheme conduit as a whole.
Similarly, the large difference in the CD intensity of reducedMtrC between in native and purified system (Fig. 3a) may beassociated with changes in interaction of heme conduit includingT-shaped pairs, given the native OM c-Cyts shows over 10 timeslower electron transport kinetics than purified OM c-Cyts at aneutral pH.41–43 Since previous study demonstrated that associatedproton transfer limits the rate of current production of S. oneidensisMR-1,38 heme conformation might also impact the proton transferkinetics. Considering that the significant suppression in Soret CDsignal in native MtrC was diminished in purified MtrCAB complex(Fig. S14, ESI†), the in vivo-specific conformational change ispotentially caused by unfolding reaction of reduced MtrC assistedby other components of OM c-Cyts such as OmcA, othermembrane proteins, and/or lipopolysaccharide.44 It would be,therefore, interesting to further identify the critical molecularaspects using a combination of whole-cell CD spectroscopy andbiochemical techniques such as point mutations.
In this study, we established whole-cell difference CDspectroscopy to investigate inter-heme interactions in native
Fig. 3 (a) Circular dichroism (CD) spectra of purified MtrC (blue line) andnative MtrC in whole cells (red line) in the reduced state at pH values of7.5 and 7.4, respectively. The De(420nm) for purified MtrC and the De(421nm)
for native MtrC are 3.86 � 103 M�1 cm�1 and 1.97 � 103 M�1 cm�1,respectively. (b) Soret peak intensities in the CD spectra of purified reducedMtrC (De(420nm), blue), native reduced MtrC (De(421nm), red), purifiedoxidized MtrC (De(412nm), gray), and native oxidized MtrC (De(413nm), black)as a function of pH.
ChemComm Communication
Ope
n A
cces
s A
rtic
le. P
ublis
hed
on 0
7 N
ovem
ber
2018
. Dow
nloa
ded
on 1
2/6/
2018
4:2
7:33
PM
. T
his
artic
le is
lice
nsed
und
er a
Cre
ativ
e C
omm
ons
Attr
ibut
ion
3.0
Unp
orte
d L
icen
ce.
View Article Online

Chem. Commun. This journal is©The Royal Society of Chemistry 2018
MtrC protein by using wild-type and a mutant strain lackingMtrC in S. oneidensis MR-1. Comparisons of MtrCs in purifiedand native systems suggested that the heme conformation inreduced MtrC is altered in whole cells and that this alterationmight critically affect electron transport kinetics. Gaininginsight into multi-heme cytochromes in an intact cell by usingmutant strains has broad applicability beyond the bacterialspecies, such as Geobacter sulfurreducens PCA.45,46 We anticipate thatthe combination of this whole-cell CD spectroscopy method withelectrochemistry would enable monitoring of MtrC conformation ina state where the equilibrium is shifted by continuous electron flowin a thermodynamically open system,15,16 which is fundamental forunderstanding biological redox reactions.
We thank Prof. Kohei Uosaki and Prof. Hiroyuki Noji fortheir advice. This work was supported financially by a Grant-in-Aid from the Japan Society for Promotion of Science (JSPS)KAKENHI Grant Number 17H04969 to A. O. and 17J02602 to Y. T.,the US Office of Naval Research Global (N62909-17-1-2038)and the Japan Agency for Medical Research and Development(17gm6010002h0002), National Natural Science foundation ofChina (41630318 & 41772363), and Biotechnology and BiologicalSciences Research Council (BB/P01819X). It was also supportedby the NIMS Molecule & Material Synthesis Platform in ‘‘Nano-technology Platform Project’’ operated by the Ministry of Education,Culture, Sports, Science and Technology (MEXT), Japan. Y. T. is aJSPS Research Fellow and supported by JSPS through the Programfor Leading Graduate Schools (MERIT).
Conflicts of interest
The authors declare no competing financial interest.
Notes and references1 K. H. Nealson and D. Saffarini, Annu. Rev. Microbiol., 1994, 48, 311.2 Y. J. Xiong, L. Shi, B. W. Chen, M. U. Mayer, B. H. Lower, Y. Londer,
S. Bose, M. F. Hochella, J. K. Fredrickson and T. C. Squier, J. Am.Chem. Soc., 2006, 128(43), 13978.
3 J. P. Busalmen, A. Esteve-Nunez, A. Berna and J. M. Feliu, Angew.Chem., Int. Ed., 2008, 47(26), 4874.
4 R. S. Hartshorne, C. L. Reardon, D. Ross, J. Nuester, T. A. Clarke,A. J. Gates, P. C. Mills, J. K. Fredrickson, J. M. Zachara, L. Shi,A. S. Beliaev, M. J. Marshall, M. Tien, S. Brantley, J. N. Butt andD. Richardson, Proc. Natl. Acad. Sci. U. S. A., 2009, 106(52), 22169.
5 T. A. Clarke, M. J. Edwards, A. J. Gates, A. Hall, G. F. White,J. Bradley, C. L. Reardon, L. Shi, A. S. Beliaev, M. J. Marshall,Z. M. Wang, N. J. Watmough, J. K. Fredrickson, J. M. Zachara,J. N. Butt and D. Richardson, Proc. Natl. Acad. Sci. U. S. A., 2011,108(23), 9384.
6 M. Breuer, K. M. Rosso and J. Blumberger, Proc. Natl. Acad. Sci.U. S. A., 2014, 111(2), 611.
7 S. Pirbadian, S. E. Barchinger, K. M. Leung, H. S. Byun, Y. Jangir,R. A. Bouhenni, S. B. Reed, M. F. Romine, D. A. Saffarini, L. Shi,Y. A. Gorby, J. H. Golbeck and M. Y. El-Naggar, Proc. Natl. Acad. Sci.U. S. A., 2014, 111(35), 12883.
8 K. M. Leung, G. Wanger, M. Y. El-Naggar, Y. Gorby, G. Southam,W. M. Lau and J. Yang, Nano Lett., 2013, 13(6), 2407.
9 M. J. Edwards, G. F. White, M. Norman, A. Tome-Fernandez,E. Ainsworth, L. Shi, J. K. Fredrickson, J. M. Zachara, J. N. Butt,D. J. Richardson and T. A. Clarke, Sci. Rep., 2015, 5, 11677.
10 M. J. Edwards, N. A. Baiden, A. Johs, S. J. Tomanicek, L. Y. Liang,L. Shi, J. K. Fredrickson, J. M. Zachara, A. J. Gates, J. N. Butt, D. J.Richardson and T. A. Clarke, FEBS Lett., 2014, 588(10), 1886.
11 M. Breuer, P. Zarzycki, J. Blumberger and K. M. Rosso, J. Am. Chem.Soc., 2012, 134(24), 9868.
12 H. C. Watanabe, Y. Yamashita and H. Ishikita, Proc. Natl. Acad. Sci.U. S. A., 2017, 114(11), 2916.
13 A. Barrozo, M. Y. El-Naggar and A. I. Krylov, Angew. Chem., Int. Ed.,2018, 57(23), 6805.
14 A. Johs, L. Shi, T. Droubay, J. F. Ankner and L. Liang, Biophys. J.,2010, 98(12), 3035.
15 H. Tributsch and L. Pohlmann, Science, 1998, 279(5358), 1891.16 R. Nakamura, K. Ishii and K. Hashimoto, Angew. Chem., Int. Ed.,
2009, 48(9), 1606.17 A. Okamoto, K. Hashimoto, K. H. Nealson and R. Nakamura, Proc.
Natl. Acad. Sci. U. S. A., 2013, 110(19), 7856.18 Y. Tokunou, K. Hashimoto and A. Okamoto, J. Phys. Chem. C, 2016,
120(29), 16168.19 N. Harada and K. Nakanishi, Circular dichroic spectroscopy: exciton
coupling in organic stereochemistry, Univ. Science Books, 1983.20 N. Berova, L. Di Bari and G. Pescitelli, Chem. Soc. Rev., 2007, 36(6), 914.21 G. Palmer and M. D. Esposti, Biochemistry, 1994, 33(1), 176.22 S. Matile, N. Berova, K. Nakanishi, J. Fleischhauer and R. W. Woody,
J. Am. Chem. Soc., 1996, 118(22), 5198.23 M. P. Heyn, J. Phys. Chem., 1975, 79(22), 2424.24 J. F. Heidelberg, et al., Nat. Biotechnol., 2002, 20, 1118.25 R. S. Hartshorne, B. N. Jepson, T. A. Clarke, S. J. Field,
J. Fredrickson, J. Zachara, L. Shi, J. N. Butt and D. J. Richardson,J. Biol. Inorg. Chem., 2007, 12(7), 1083.
26 R. Schweitzer-Stenner, J. Phys. Chem. B, 2008, 112(33), 10358.27 G. Pescitelli, S. Gabriel, Y. K. Wang, J. Fleischhauer, R. W. Woody
and N. Berova, J. Am. Chem. Soc., 2003, 125(25), 7613.28 V. V. Borovkov, I. Fujii, A. Muranaka, G. A. Hembury, T. Tanaka,
A. Ceulemans, N. Kobayashi and Y. Inoue, Angew. Chem., Int. Ed., 2004,43(41), 5481.
29 S. Hattori, K. Akagawa, K. Kudo and K. Ishii, J. Phys. Chem. B, 2016,120(39), 10280.
30 C. F. Goodhew, K. R. Brown and G. W. Pettigrew, Biochim. Biophys.Acta, 1986, 852(2-3), 288.
31 P. E. Thomas, D. Ryan and W. Levin, Anal. Biochem., 1976, 75(1), 168.32 T. Kasai, A. Kouzuma, H. Nojiri and K. Watanabe, BMC Microbiol.,
2015, 15, 68.33 R. W. Woody and M.-C. Hsu, J. Am. Chem. Soc., 1971, 93(14), 3515.34 G. Blauer, N. Sreerama and R. W. Woody, Biochemistry, 1993,
32(26), 6674.35 T. Shibanuma, R. Nakamura, Y. Hirakawa, K. Hashimoto and
K. Ishii, Angew. Chem., Int. Ed., 2011, 50(39), 9137.36 S. J. Field, P. S. Dobbin, M. R. Cheesman, N. J. Watmough, A. J.
Thomson and D. J. Richardson, J. Biol. Chem., 2000, 275(12), 8515.37 Y. Takayama, Y. Kobayashi, N. Yahata, T. Saitoh, H. Hori, T. Ikegami
and H. Akutsu, Biochemistry, 2006, 45(10), 3163.38 A. Okamoto, Y. Tokunou, S. Kalathil and K. Hashimoto, Angew.
Chem., Int. Ed., 2017, 56(31), 9082.39 Y. Tokunou, K. Hashimoto and A. Okamoto, J. Visualized Exp., 2018,
134, 57584.40 D. M. A. Smith, K. M. Rosso, M. Dupuis, M. Valiev and T. P. Straatsma,
J. Phys. Chem. B, 2006, 110(31), 15582.41 B. H. Lower, L. Shi, R. Yongsunthon, T. C. Droubay, D. E. McCready
and S. K. Lower, J. Bacteriol., 2007, 189(13), 4944.42 H. A. Liu, G. J. Newton, R. Nakamura, K. Hashimoto and S. Nakanishi,
Angew. Chem., Int. Ed., 2010, 49(37), 6596.43 A. Okamoto, Y. Tokunou and J. Saito, Biophys. Physicobiol., 2016, 13, 71.44 P. V. Bulieris, S. Behrens, O. Holst and J. Kleinschmidt, J. Biol.
Chem., 2003, 278(11), 9092.45 D. R. Bond and D. R. Lovley, Appl. Environ. Microbiol., 2003, 69(3), 1548.46 L. Shi, T. C. Squier, J. M. Zachara and J. K. Fredrickson, Mol.
Microbiol., 2007, 65(1), 12.
Communication ChemComm
Ope
n A
cces
s A
rtic
le. P
ublis
hed
on 0
7 N
ovem
ber
2018
. Dow
nloa
ded
on 1
2/6/
2018
4:2
7:33
PM
. T
his
artic
le is
lice
nsed
und
er a
Cre
ativ
e C
omm
ons
Attr
ibut
ion
3.0
Unp
orte
d L
icen
ce.
View Article Online