x-tel edge white paper
TRANSCRIPT
8/3/2019 X-tel Edge White Paper
http://slidepdf.com/reader/full/x-tel-edge-white-paper 1/7
EDGE Performance Metrics
X-TEL Communications, Inc.1919 S. Highland Avenue, Suite 255D
Lombard, IL 60148(630) 705-9090www.x-tel.com
UpdatedSeptember 10, 2003
8/3/2019 X-tel Edge White Paper
http://slidepdf.com/reader/full/x-tel-edge-white-paper 2/7
Page 2 of 7
Enhanced data rates for GSM evolution (EDGE) Performance Metrics
EDGE enhances throughput per timeslot for both HSCSD (ECSD- enhanced circuit switched
data) and GPRS (EGPRS enhanced general packet radio service). In EGPRS the data rate per
timeslot triples and the peak throughput, with all eight timeslots in use, can reach 473 kbps. This
document focuses on EGPRS quality and performance metrics that can be measured and analyzed
in the field. Example displays are included for each performance metric.
Enhancements that make EGPRS rates possible include the use of new modulation techniques
and error-tolerant transmission methods. A PDTCH/F using GMSK modulation carries
information at an instantaneous bit rate up to 22.8 kbps. A PDTCH/F using 8-PSK modulation
carries information at an instantaneous bit rate up to 69.6 kbps. The 8-PSK signal is able to carry
3 bits per modulated symbol versus 1 bit per symbol using GMSK. This increased throughput
comes at a cost of decreased sensitivity of the 8-PSK signal. Thus, the highest data rates have
limited coverage areas since they can only be provided in areas with adequate signal strength.
EGPRS also introduces a new set of coding schemes and quality metrics used with improved link
adaptation mechanisms and incremental redundancy. The next section includes a description of
the Modulation and Coding Schemes (MCSs) and the quality metrics used to evaluate the radio
link. The document concludes with three important performance metrics that can be used to
evaluate the health of the data network – reliability, throughput and delay.
Radio Link Quality Metrics
EGPRS has an impact on the RF and physical layer of the radio interface and on the RLC/MAC
protocol. Link Quality Control (LQC) for EGPRS is modified to include incremental redundancy
(IR) in addition to link adaptation mode found in GPRS. The LQC includes nine different
modulation and coding schemes (MSC 1-9), shown in Table 1, as well as procedures for
switching between different MCSs.
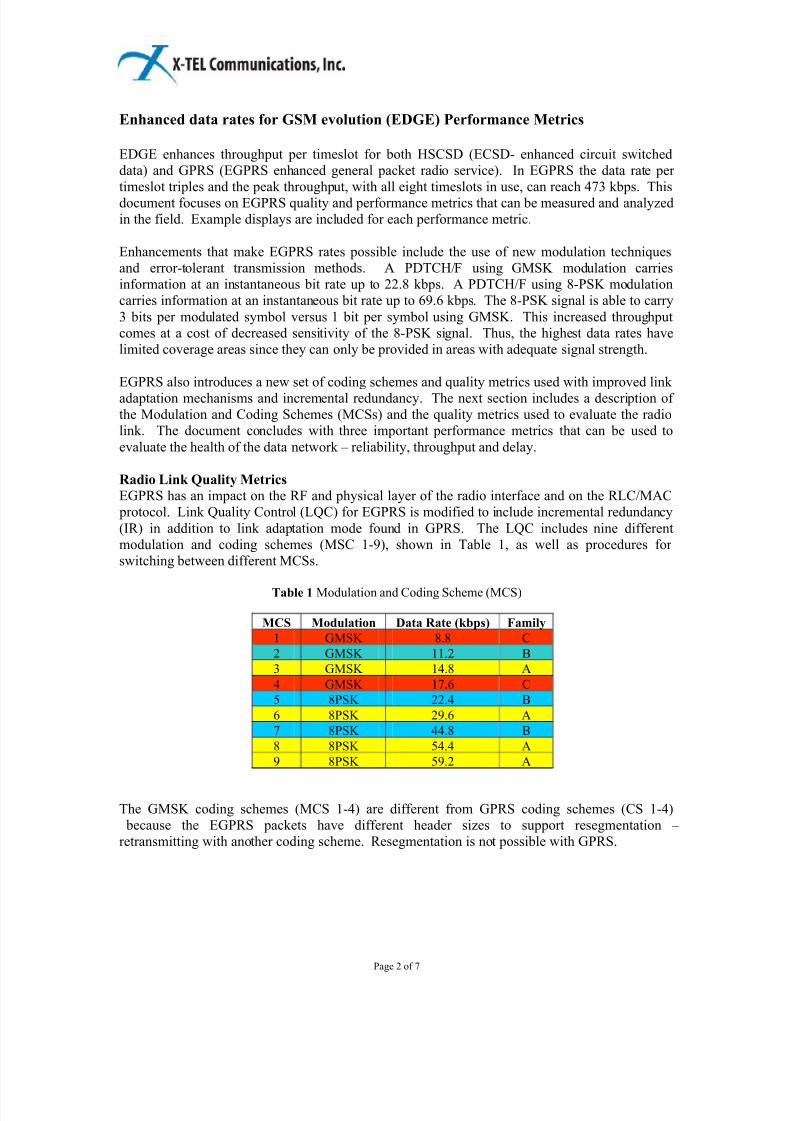
Table 1 Modulation and Coding Scheme (MCS)
MCS Modulation Data Rate (kbps) Family
1 GMSK 8.8 C
2 GMSK 11.2 B
3 GMSK 14.8 A
4 GMSK 17.6 C
5 8PSK 22.4 B
6 8PSK 29.6 A
7 8PSK 44.8 B
8 8PSK 54.4 A
9 8PSK 59.2 A
The GMSK coding schemes (MCS 1-4) are different from GPRS coding schemes (CS 1-4)
because the EGPRS packets have different header sizes to support resegmentation –
retransmitting with another coding scheme. Resegmentation is not possible with GPRS.
8/3/2019 X-tel Edge White Paper
http://slidepdf.com/reader/full/x-tel-edge-white-paper 3/7
Page 3 of 7
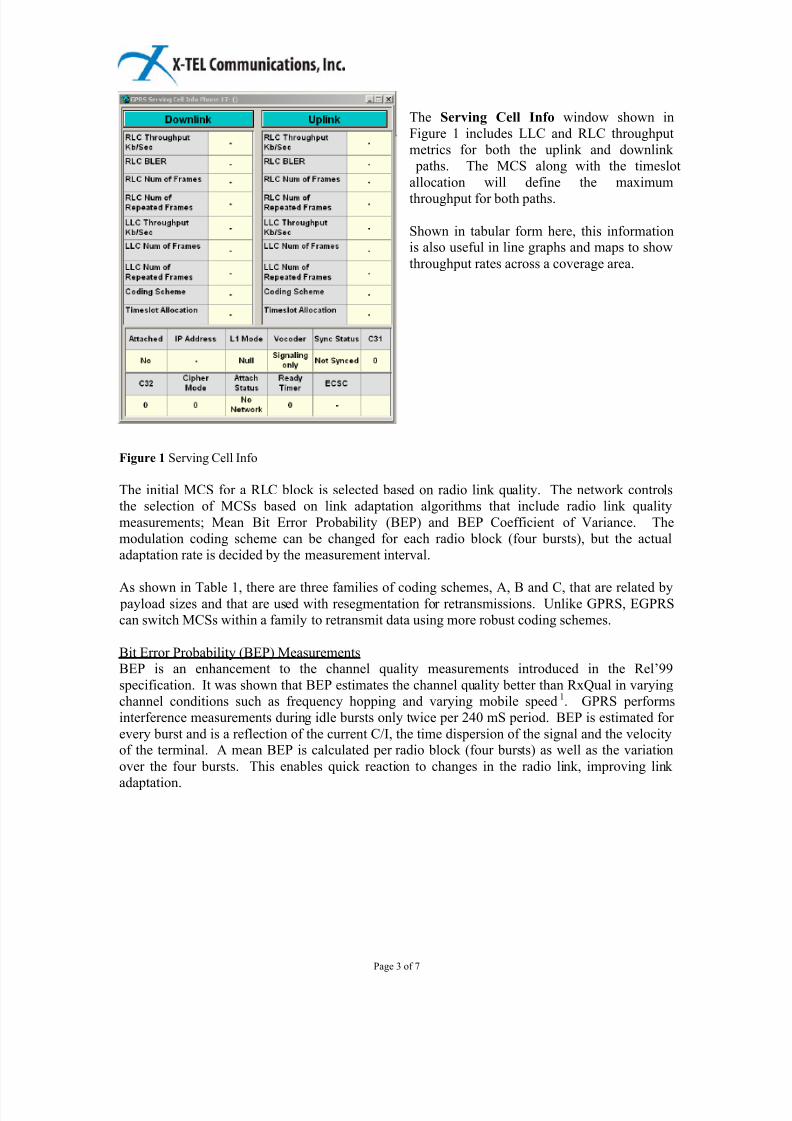
The Serving Cell Info window shown in
Figure 1 includes LLC and RLC throughput
metrics for both the uplink and downlink
paths. The MCS along with the timeslot
allocation will define the maximum
throughput for both paths.
Shown in tabular form here, this informationis also useful in line graphs and maps to show
throughput rates across a coverage area.
Figure 1 Serving Cell Info
The initial MCS for a RLC block is selected based on radio link quality. The network controls
the selection of MCSs based on link adaptation algorithms that include radio link quality
measurements; Mean Bit Error Probability (BEP) and BEP Coefficient of Variance. The
modulation coding scheme can be changed for each radio block (four bursts), but the actual
adaptation rate is decided by the measurement interval.
As shown in Table 1, there are three families of coding schemes, A, B and C, that are related by payload sizes and that are used with resegmentation for retransmissions. Unlike GPRS, EGPRS
can switch MCSs within a family to retransmit data using more robust coding schemes.
Bit Error Probability (BEP) MeasurementsBEP is an enhancement to the channel quality measurements introduced in the Rel’99
specification. It was shown that BEP estimates the channel quality better than RxQual in varying
channel conditions such as frequency hopping and varying mobile speed1. GPRS performs
interference measurements during idle bursts only twice per 240 mS period. BEP is estimated for
every burst and is a reflection of the current C/I, the time dispersion of the signal and the velocityof the terminal. A mean BEP is calculated per radio block (four bursts) as well as the variation
over the four bursts. This enables quick reaction to changes in the radio link, improving link
adaptation.
8/3/2019 X-tel Edge White Paper
http://slidepdf.com/reader/full/x-tel-edge-white-paper 4/7
Page 4 of 7
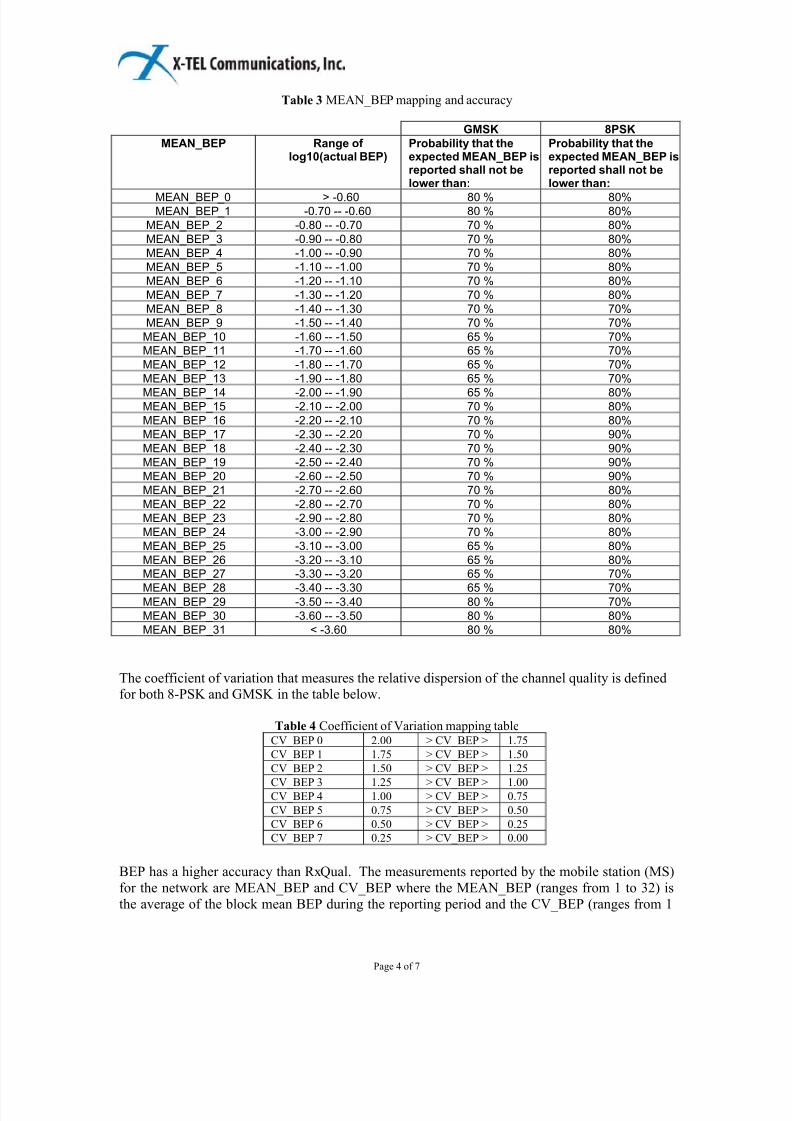
Table 3 MEAN_BEP mapping and accuracy
GMSK 8PSK
MEAN_BEP Range of log10(actual BEP)
Probability that theexpected MEAN_BEP isreported shall not belower than:
Probability that theexpected MEAN_BEP isreported shall not belower than:
MEAN_BEP_0 > -0.60 80 % 80%MEAN_BEP_1 -0.70 -- -0.60 80 % 80%
MEAN_BEP_2 -0.80 -- -0.70 70 % 80%
MEAN_BEP_3 -0.90 -- -0.80 70 % 80%
MEAN_BEP_4 -1.00 -- -0.90 70 % 80%
MEAN_BEP_5 -1.10 -- -1.00 70 % 80%
MEAN_BEP_6 -1.20 -- -1.10 70 % 80%
MEAN_BEP_7 -1.30 -- -1.20 70 % 80%
MEAN_BEP_8 -1.40 -- -1.30 70 % 70%
MEAN_BEP_9 -1.50 -- -1.40 70 % 70%
MEAN_BEP_10 -1.60 -- -1.50 65 % 70%
MEAN_BEP_11 -1.70 -- -1.60 65 % 70%
MEAN_BEP_12 -1.80 -- -1.70 65 % 70%
MEAN_BEP_13 -1.90 -- -1.80 65 % 70%
MEAN_BEP_14 -2.00 -- -1.90 65 % 80%MEAN_BEP_15 -2.10 -- -2.00 70 % 80%
MEAN_BEP_16 -2.20 -- -2.10 70 % 80%
MEAN_BEP_17 -2.30 -- -2.20 70 % 90%
MEAN_BEP_18 -2.40 -- -2.30 70 % 90%
MEAN_BEP_19 -2.50 -- -2.40 70 % 90%
MEAN_BEP_20 -2.60 -- -2.50 70 % 90%
MEAN_BEP_21 -2.70 -- -2.60 70 % 80%
MEAN_BEP_22 -2.80 -- -2.70 70 % 80%
MEAN_BEP_23 -2.90 -- -2.80 70 % 80%
MEAN_BEP_24 -3.00 -- -2.90 70 % 80%
MEAN_BEP_25 -3.10 -- -3.00 65 % 80%
MEAN_BEP_26 -3.20 -- -3.10 65 % 80%
MEAN_BEP_27 -3.30 -- -3.20 65 % 70%
MEAN_BEP_28 -3.40 -- -3.30 65 % 70%MEAN_BEP_29 -3.50 -- -3.40 80 % 70%
MEAN_BEP_30 -3.60 -- -3.50 80 % 80%
MEAN_BEP_31 < -3.60 80 % 80%
The coefficient of variation that measures the relative dispersion of the channel quality is definedfor both 8-PSK and GMSK in the table below.
Table 4 Coefficient of Variation mapping tableCV_BEP 0 2.00 > CV_BEP > 1.75
CV_BEP 1 1.75 > CV_BEP > 1.50
CV_BEP 2 1.50 > CV_BEP > 1.25
CV_BEP 3 1.25 > CV_BEP > 1.00CV_BEP 4 1.00 > CV_BEP > 0.75
CV_BEP 5 0.75 > CV_BEP > 0.50
CV_BEP 6 0.50 > CV_BEP > 0.25
CV_BEP 7 0.25 > CV_BEP > 0.00
BEP has a higher accuracy than RxQual. The measurements reported by the mobile station (MS)
for the network are MEAN_BEP and CV_BEP where the MEAN_BEP (ranges from 1 to 32) is
the average of the block mean BEP during the reporting period and the CV_BEP (ranges from 1
8/3/2019 X-tel Edge White Paper
http://slidepdf.com/reader/full/x-tel-edge-white-paper 5/7
Page 5 of 7
to 8) is the average of the block Coefficient of Variation (CV = Std(BEP)/Mean(BEP)) during the
reporting period. Higher relative MEAN_BEP values (1-32) correspond to lower actual BEPs.
Higher CV_BEPs (1-8) indicate lower actual CV and greater data consistency. Lower CV-BEPs
indicate a higher actual CV and greater dispersion around the mean. Look up tables of
MEAN_BEP versus CV_BEP can be used in the link adaptation process to select the appropriate
MCS for the radio link environment. MCSs and hence throughput increase as the MEAN_BEP
and CV_BEP values increase.
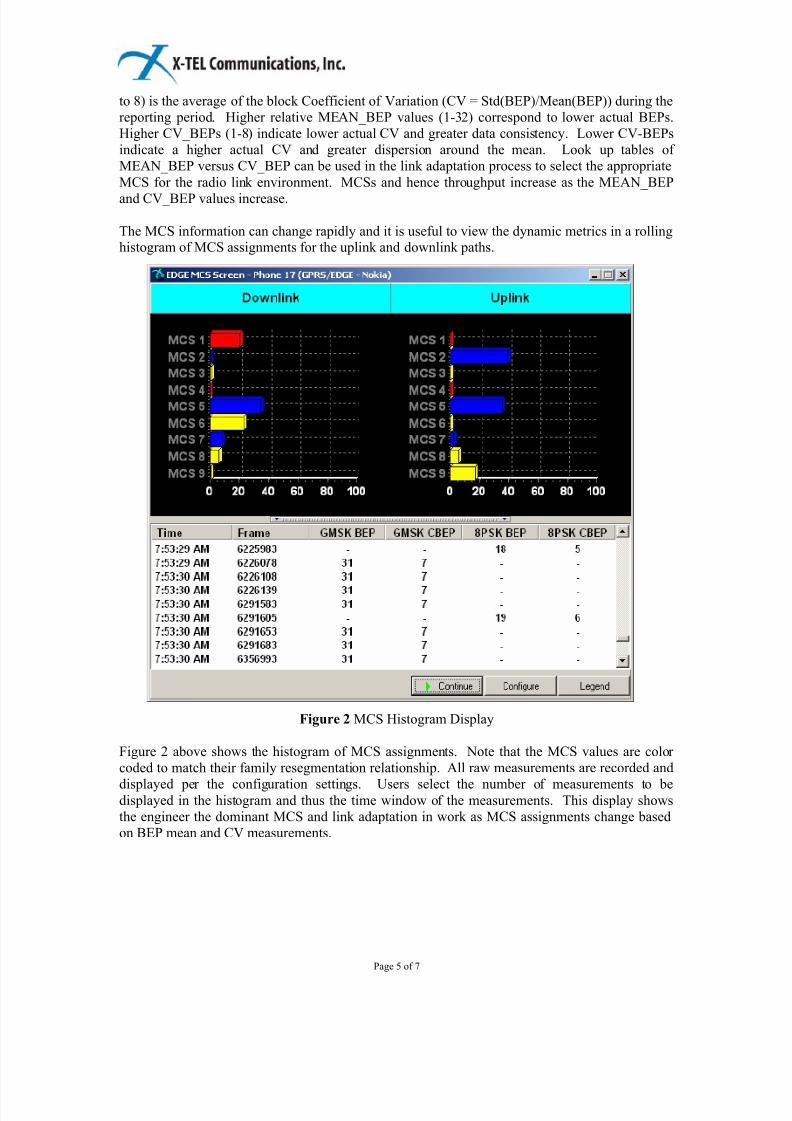
The MCS information can change rapidly and it is useful to view the dynamic metrics in a rollinghistogram of MCS assignments for the uplink and downlink paths.
Figure 2 MCS Histogram Display
Figure 2 above shows the histogram of MCS assignments. Note that the MCS values are color
coded to match their family resegmentation relationship. All raw measurements are recorded and
displayed per the configuration settings. Users select the number of measurements to bedisplayed in the histogram and thus the time window of the measurements. This display shows
the engineer the dominant MCS and link adaptation in work as MCS assignments change based
on BEP mean and CV measurements.
8/3/2019 X-tel Edge White Paper
http://slidepdf.com/reader/full/x-tel-edge-white-paper 6/7
Page 6 of 7
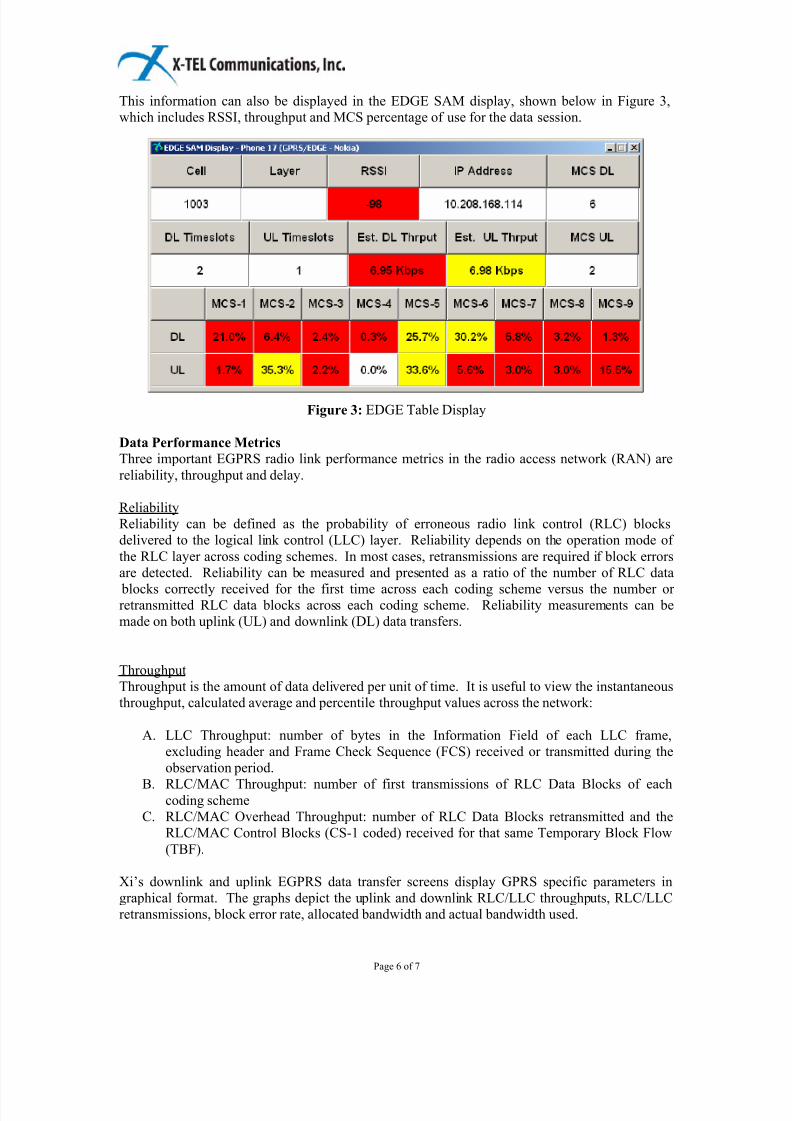
This information can also be displayed in the EDGE SAM display, shown below in Figure 3,
which includes RSSI, throughput and MCS percentage of use for the data session.
Figure 3: EDGE Table Display
Data Performance Metrics
Three important EGPRS radio link performance metrics in the radio access network (RAN) are
reliability, throughput and delay.
Reliability
Reliability can be defined as the probability of erroneous radio link control (RLC) blocks
delivered to the logical link control (LLC) layer. Reliability depends on the operation mode of
the RLC layer across coding schemes. In most cases, retransmissions are required if block errors
are detected. Reliability can be measured and presented as a ratio of the number of RLC data
blocks correctly received for the first time across each coding scheme versus the number or retransmitted RLC data blocks across each coding scheme. Reliability measurements can be
made on both uplink (UL) and downlink (DL) data transfers.
Throughput
Throughput is the amount of data delivered per unit of time. It is useful to view the instantaneous
throughput, calculated average and percentile throughput values across the network:
A. LLC Throughput: number of bytes in the Information Field of each LLC frame,
excluding header and Frame Check Sequence (FCS) received or transmitted during the
observation period.
B. RLC/MAC Throughput: number of first transmissions of RLC Data Blocks of eachcoding scheme
C. RLC/MAC Overhead Throughput: number of RLC Data Blocks retransmitted and the
RLC/MAC Control Blocks (CS-1 coded) received for that same Temporary Block Flow
(TBF).
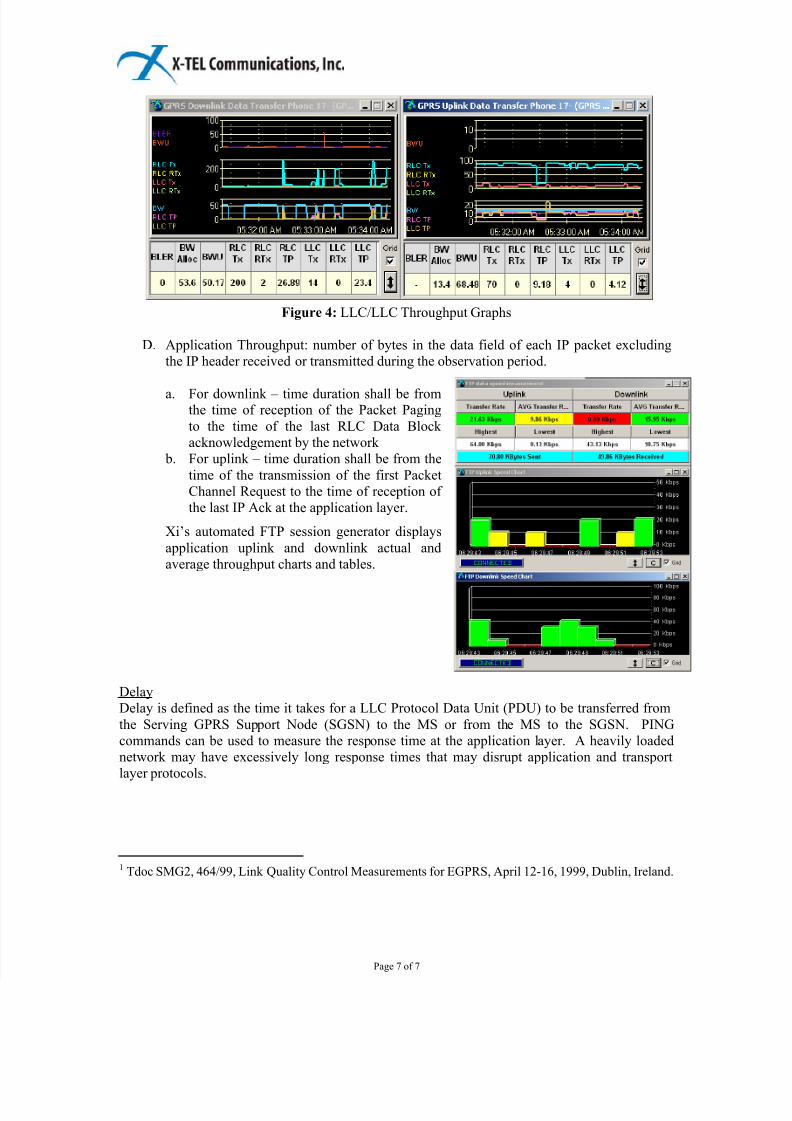
Xi’s downlink and uplink EGPRS data transfer screens display GPRS specific parameters in
graphical format. The graphs depict the uplink and downlink RLC/LLC throughputs, RLC/LLC
retransmissions, block error rate, allocated bandwidth and actual bandwidth used.
8/3/2019 X-tel Edge White Paper
http://slidepdf.com/reader/full/x-tel-edge-white-paper 7/7
Page 7 of 7
Figure 4: LLC/LLC Throughput Graphs
D. Application Throughput: number of bytes in the data field of each IP packet excluding
the IP header received or transmitted during the observation period.
a. For downlink – time duration shall be fromthe time of reception of the Packet Paging
to the time of the last RLC Data Block
acknowledgement by the network
b. For uplink – time duration shall be from the
time of the transmission of the first Packet
Channel Request to the time of reception of
the last IP Ack at the application layer.
Xi’s automated FTP session generator displays
application uplink and downlink actual and
average throughput charts and tables.
Delay
Delay is defined as the time it takes for a LLC Protocol Data Unit (PDU) to be transferred from
the Serving GPRS Support Node (SGSN) to the MS or from the MS to the SGSN. PING
commands can be used to measure the response time at the application layer. A heavily loaded
network may have excessively long response times that may disrupt application and transport
layer protocols.
1 Tdoc SMG2, 464/99, Link Quality Control Measurements for EGPRS, April 12-16, 1999, Dublin, Ireland.