year number of retail stores number of employees …...number of retail stores number of employees...
TRANSCRIPT
[3]-19
2.小売業 Retail
(1) 店舗数と床面積 Number and Floor Space of Stores
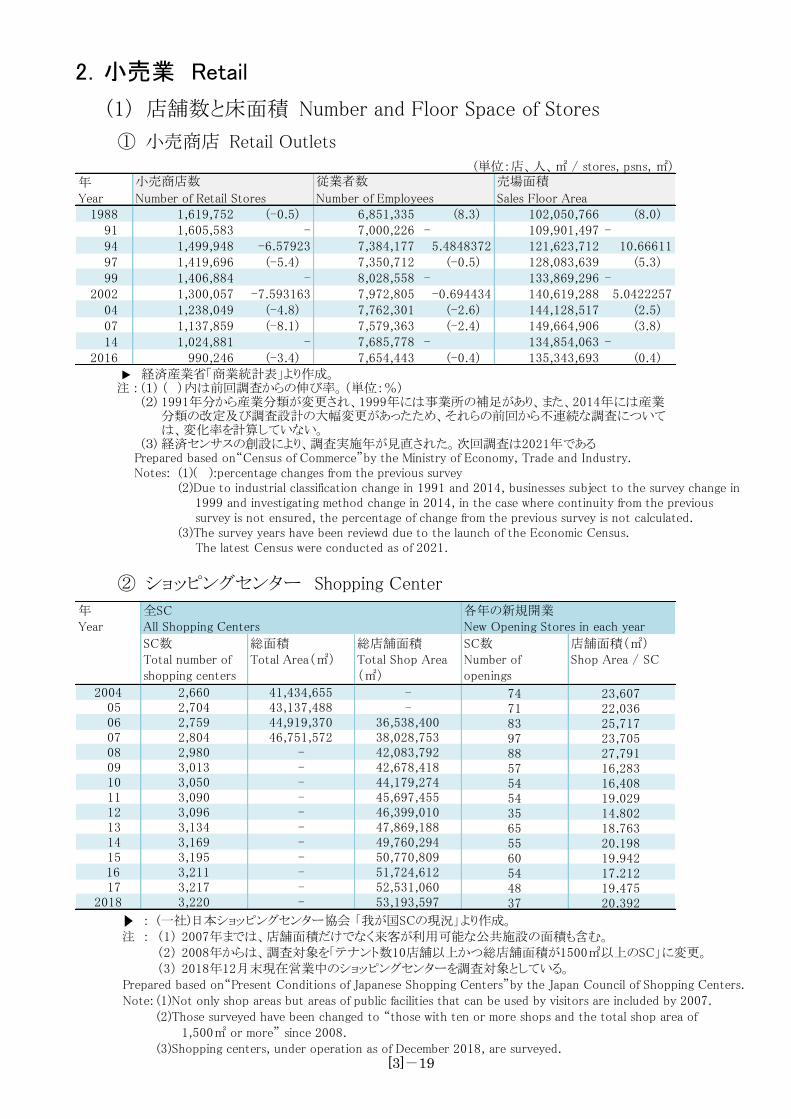
① 小売商店 Retail Outlets (単位:店、人、㎡ / stores, psns, ㎡)
年Year
1988 1,619,752 (-0.5) 6,851,335 (8.3) 102,050,766 (8.0) 91 1,605,583 - 7,000,226 - 109,901,497 - 94 1,499,948 -6.57923 7,384,177 5.4848372 121,623,712 10.66611 97 1,419,696 (-5.4) 7,350,712 (-0.5) 128,083,639 (5.3) 99 1,406,884 - 8,028,558 - 133,869,296 -2002 1,300,057 -7.593163 7,972,805 -0.694434 140,619,288 5.0422257 04 1,238,049 (-4.8) 7,762,301 (-2.6) 144,128,517 (2.5) 07 1,137,859 (-8.1) 7,579,363 (-2.4) 149,664,906 (3.8)
14 1,024,881 - 7,685,778 - 134,854,063 -2016 990,246 (-3.4) 7,654,443 (-0.4) 135,343,693 (0.4)
小売商店数 従業者数 売場面積
Number of Retail Stores Number of Employees Sales Floor Area
経済産業省「商業統計表」より作成。
注 : (1) ( )内は前回調査からの伸び率。(単位:%)(2) 1991年分から産業分類が変更され、1999年には事業所の補足があり、また、2014年には産業
分類の改定及び調査設計の大幅変更があったため、それらの前回から不連続な調査については、変化率を計算していない。
(3) 経済センサスの創設により、調査実施年が見直された。次回調査は2021年であるPrepared based on“Census of Commerce”by the Ministry of Economy, Trade and Industry.Notes: (1)( ):percentage changes from the previous survey
(2)Due to industrial classification change in 1991 and 2014, businesses subject to the survey change in 1999 and investigating method change in 2014, in the case where continuity from the previous survey is not ensured, the percentage of change from the previous survey is not calculated.
(3)The survey years have been reviewd due to the launch of the Economic Census.The latest Census were conducted as of 2021.
② ショッピングセンター Shopping Center
2004 2,660 41,434,655 - 74 23,607 05 2,704 43,137,488 - 71 22,036 06 2,759 44,919,370 36,538,400 83 25,717 07 2,804 46,751,572 38,028,753 97 23,705 08 2,980 - 42,083,792 88 27,791 09 3,013 - 42,678,418 57 16,283 10 3,050 - 44,179,274 54 16,408 11 3,090 - 45,697,455 54 19,029 12 3,096 - 46,399,010 35 14,802 13 3,134 - 47,869,188 65 18,763 14 3,169 - 49,760,294 55 20,198 15 3,195 - 50,770,809 60 19,942 16 3,211 - 51,724,612 54 17,212 17 3,217 - 52,531,060 48 19,4752018 3,220 - 53,193,597 37 20,392
各年の新規開業New Opening Stores in each year
SC数Total number ofshopping centers
総面積Total Area(㎡)
総店舗面積Total Shop Area(㎡)
SC数Number ofopenings
店舗面積(㎡)Shop Area / SC
全SCAll Shopping Centers
年Year
: (一社)日本ショッピングセンター協会 「我が国SCの現況」より作成。
注 : (1) 2007年までは、店舗面積だけでなく来客が利用可能な公共施設の面積も含む。(2) 2008年からは、調査対象を「テナント数10店舗以上かつ総店舗面積が1500㎡以上のSC」に変更。(3) 2018年12月末現在営業中のショッピングセンターを調査対象としている。
Prepared based on“Present Conditions of Japanese Shopping Centers”by the Japan Council of Shopping Centers.Note: (1)Not only shop areas but areas of public facilities that can be used by visitors are included by 2007.
(2)Those surveyed have been changed to “those with ten or more shops and the total shop area of 1,500㎡ or more” since 2008.
(3)Shopping centers, under operation as of December 2018, are surveyed.
[3]-20
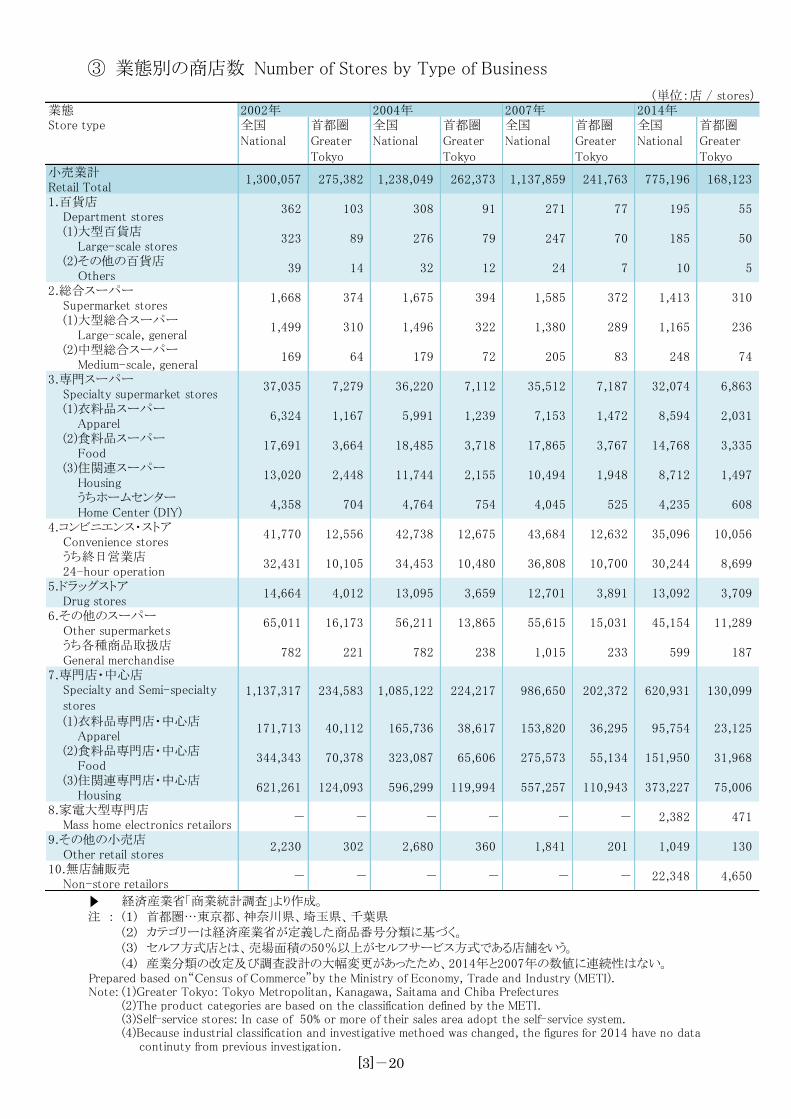
③ 業態別の商店数 Number of Stores by Type of Business
(単位:店 / stores)業態Store type 全国 首都圏 全国 首都圏 全国 首都圏 全国 首都圏
National GreaterTokyo
National GreaterTokyo
National GreaterTokyo
National GreaterTokyo
小売業計Retail Total1.百貨店
Department stores(1)大型百貨店
(2)その他の百貨店
2.総合スーパーSupermarket stores(1)大型総合スーパー
(2)中型総合スーパー
3.専門スーパーSpecialty supermarket stores(1)衣料品スーパー
(2)食料品スーパー
(3)住関連スーパー
うちホームセンターHome Center (DIY)
4.コンビニエンス・ストアConvenience storesうち終日営業店
5.ドラッグストアDrug stores
6.その他のスーパーOther supermarketsうち各種商品取扱店General merchandise
7.専門店・中心店
(1)衣料品専門店・中心店
(2)食料品専門店・中心店
(3)住関連専門店・中心店
8.家電大型専門店Mass home electronics retailors
9.その他の小売店Other retail stores
10.無店舗販売Non-store retailors
2002年 2004年 2007年 2014年
1,300,057 275,382 1,238,049 262,373 1,137,859 241,763 775,196 168,123
50Large-scale stores
91 271 77 195 55
323 89 276
362 103 308
79 247 70 185
24 7 10 5Others
1,668 374 1,675
39 14 32 12
322 1,380 289 1,165 236Large-scale, general
394 1,585 372 1,413 310
1,499 310 1,496
205 83 248 74Medium-scale, general
37,035 7,279 36,220
169 64 179 72
1,239 7,153 1,472 8,594 2,031Apparel
7,112 35,512 7,187 32,074 6,863
6,324 1,167 5,991
2,155 10,494 1,948 8,712 1,497Housing
17,865 3,767 14,768 3,335Food
13,020 2,448 11,744
17,691 3,664 18,485 3,718
525 4,235 608
41,770 12,556 42,738 12,675
4,358 704 4,764 754 4,045
43,684 12,632 35,096 10,056
8,69924-hour operation
14,664 4,012 13,095 3,659 12,701 3,891 13,092 3,709
32,431 10,105 34,453 10,480 36,808 10,700 30,244
11,289
782 221 782 238 1,015 233 599 187
65,011 16,173 56,211 13,865 55,615 15,031 45,154
1,137,317 234,583 1,085,122 224,217 986,650 202,372 620,931 130,099Specialty and Semi-specialtystores
171,713 40,112 165,736 38,617
65,606 275,573 55,134 151,950 31,968Food
153,820 36,295 95,754 23,125Apparel
344,343 70,378 323,087
557,257 110,943 373,227 75,006119,994Housing
- - -
621,261 124,093 596,299
- - - 2,382
- - - 22,348
471
4,650
360 1,841 201 1,049 130
- - -
2,230 302 2,680
経済産業省「商業統計調査」より作成。注 : (1) 首都圏…東京都、神奈川県、埼玉県、千葉県
(2) カテゴリーは経済産業省が定義した商品番号分類に基づく。(3) セルフ方式店とは、売場面積の50%以上がセルフサービス方式である店舗をいう。(4) 産業分類の改定及び調査設計の大幅変更があったため、2014年と2007年の数値に連続性はない。
Prepared based on“Census of Commerce”by the Ministry of Economy, Trade and Industry (METI).Note: (1)Greater Tokyo: Tokyo Metropolitan, Kanagawa, Saitama and Chiba Prefectures
(2)The product categories are based on the classification defined by the METI.(3)Self-service stores: In case of 50% or more of their sales area adopt the self-service system.(4)Because industrial classification and investigative methoed was changed, the figures for 2014 have no data continuty from previous investigation.
[3]-21
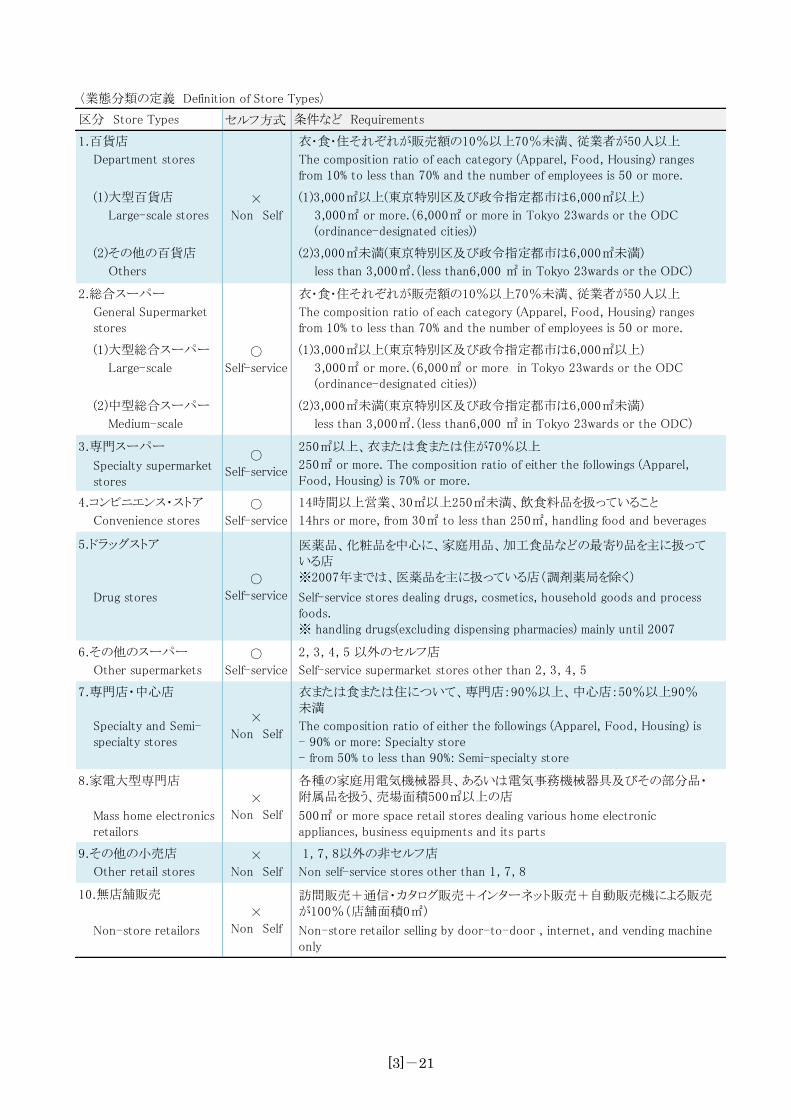
〈業態分類の定義 Definition of Store Types〉
セルフ方式
1.百貨店 衣・食・住それぞれが販売額の10%以上70%未満、従業者が50人以上
Department stores The composition ratio of each category (Apparel, Food, Housing) rangesfrom 10% to less than 70% and the number of employees is 50 or more.
(1)大型百貨店 (1)3,000㎡以上(東京特別区及び政令指定都市は6,000㎡以上)
Large-scale stores 3,000㎡ or more.(6,000㎡ or more in Tokyo 23wards or the ODC (ordinance-designated cities))
(2)その他の百貨店 (2)3,000㎡未満(東京特別区及び政令指定都市は6,000㎡未満)
Others less than 3,000㎡.(less than6,000 ㎡ in Tokyo 23wards or the ODC)
2.総合スーパー 衣・食・住それぞれが販売額の10%以上70%未満、従業者が50人以上
The composition ratio of each category (Apparel, Food, Housing) rangesfrom 10% to less than 70% and the number of employees is 50 or more.
(1)大型総合スーパー (1)3,000㎡以上(東京特別区及び政令指定都市は6,000㎡以上)
Large-scale 3,000㎡ or more.(6,000㎡ or more in Tokyo 23wards or the ODC (ordinance-designated cities))
(2)中型総合スーパー (2)3,000㎡未満(東京特別区及び政令指定都市は6,000㎡未満)
Medium-scale less than 3,000㎡.(less than6,000 ㎡ in Tokyo 23wards or the ODC)
3.専門スーパー 250㎡以上、衣または食または住が70%以上
250㎡ or more. The composition ratio of either the followings (Apparel,Food, Housing) is 70% or more.
4.コンビニエンス・ストア 14時間以上営業、30㎡以上250㎡未満、飲食料品を扱っていること
Convenience stores 14hrs or more, from 30㎡ to less than 250㎡, handling food and beverages
医薬品、化粧品を中心に、家庭用品、加工食品などの最寄り品を主に扱っている店※2007年までは、医薬品を主に扱っている店(調剤薬局を除く)
Drug stores Self-service stores dealing drugs, cosmetics, household goods and processfoods.※ handling drugs(excluding dispensing pharmacies) mainly until 2007
6.その他のスーパー 2, 3, 4, 5 以外のセルフ店
Other supermarkets Self-service supermarket stores other than 2, 3, 4, 5
衣または食または住について、専門店:90%以上、中心店:50%以上90%未満
The composition ratio of either the followings (Apparel, Food, Housing) is- 90% or more: Specialty store- from 50% to less than 90%: Semi-specialty store
各種の家庭用電気機械器具、あるいは電気事務機械器具及びその部分品・附属品を扱う、売場面積500㎡以上の店
500㎡ or more space retail stores dealing various home electronicappliances, business equipments and its parts
9.その他の小売店 1, 7, 8以外の非セルフ店
Other retail stores Non self-service stores other than 1, 7, 8
訪問販売+通信・カタログ販売+インターネット販売+自動販売機による販売が100%(店舗面積0㎡)
Non-store retailor selling by door-to-door , internet, and vending machineonly
○Self-serviceSpecialty supermarket
stores
区分 Store Types 条件など Requirements
×Non Self
○Self-service
General Supermarketstores
×Non Self
×Non SelfNon-store retailors
○Self-service
○Self-service
○Self-service
×Non Self
Specialty and Semi-specialty stores
×Non SelfMass home electronics
retailors
5.ドラッグストア
8.家電大型専門店
10.無店舗販売
7.専門店・中心店
[3]-22
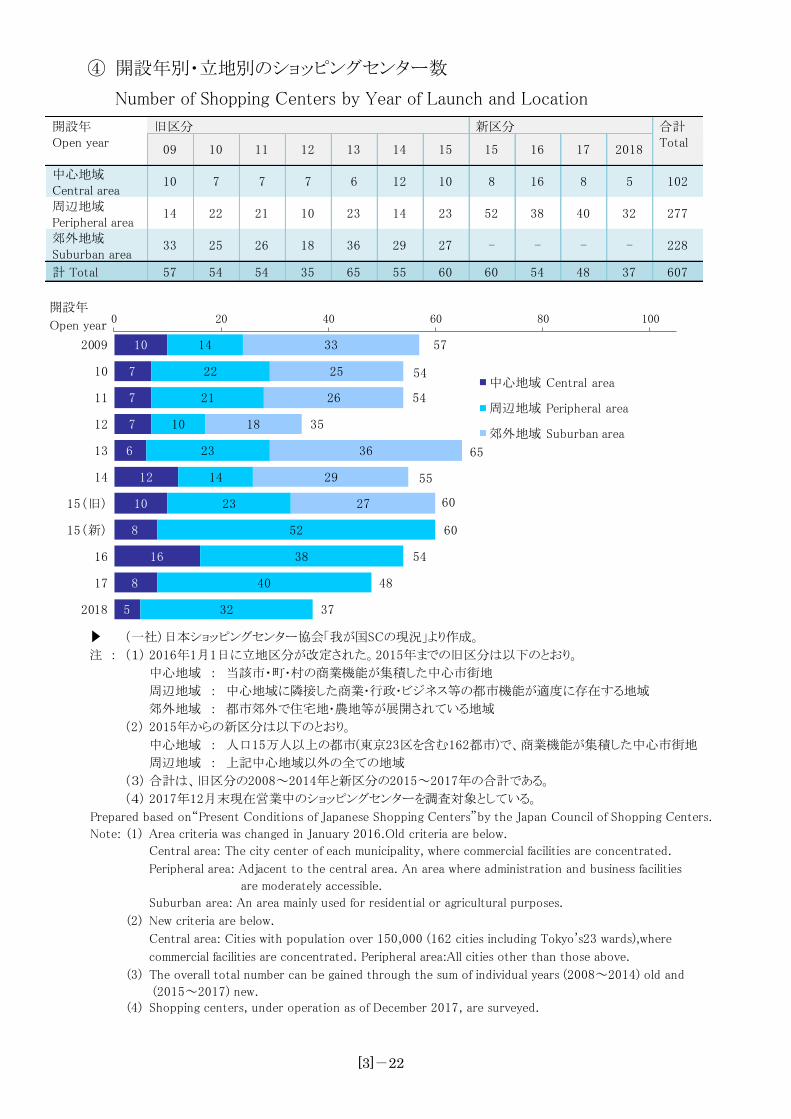
④ 開設年別・立地別のショッピングセンター数
Number of Shopping Centers by Year of Launch and Location
開設年 合計 Total
中心地域 Central area 周辺地域 Peripheral area 郊外地域 Suburban area
計 Total 57 54 54 35 65 55 60 60 54 48 37 607
23
13 Open year
2322
11 12
14
10 7
21 10
旧区分
15
8
52
7 7 6 12 10
1514
14
09 10
27 -33 25 26 18 36 29
277
-
2018
5
32
- 228
102
16
16
38
17
8
40
-
新区分
10
7
7
7
6
12
10
8
16
8
5
14
22
21
10
23
14
23
52
38
40
32
33
25
26
18
36
29
27
57
54
54
35
65
55
60
60
54
48
37
0 20 40 60 80 100
2009
10
11
12
13
14
15(旧)
15(新)
16
17
2018
開設年
Open year
中心地域 Central area
周辺地域 Peripheral area
郊外地域 Suburban area
(一社)日本ショッピングセンター協会「我が国SCの現況」より作成。
注 : (1) 2016年1月1日に立地区分が改定された。2015年までの旧区分は以下のとおり。
中心地域 : 当該市・町・村の商業機能が集積した中心市街地
周辺地域 : 中心地域に隣接した商業・行政・ビジネス等の都市機能が適度に存在する地域
郊外地域 : 都市郊外で住宅地・農地等が展開されている地域
(2) 2015年からの新区分は以下のとおり。
中心地域 : 人口15万人以上の都市(東京23区を含む162都市)で、商業機能が集積した中心市街地
周辺地域 : 上記中心地域以外の全ての地域
(3) 合計は、旧区分の2008~2014年と新区分の2015~2017年の合計である。
(4) 2017年12月末現在営業中のショッピングセンターを調査対象としている。
Prepared based on“Present Conditions of Japanese Shopping Centers”by the Japan Council of Shopping Centers.
Note: (1) Area criteria was changed in January 2016.Old criteria are below.
Central area: The city center of each municipality, where commercial facilities are concentrated.
Peripheral area: Adjacent to the central area. An area where administration and business facilities
are moderately accessible.
Suburban area: An area mainly used for residential or agricultural purposes.
(2) New criteria are below.
Central area: Cities with population over 150,000 (162 cities including Tokyo's23 wards),where
commercial facilities are concentrated. Peripheral area:All cities other than those above.
(3) The overall total number can be gained through the sum of individual years (2008~2014) old and
(2015~2017) new.(4) Shopping centers, under operation as of December 2017, are surveyed.
[3]-23
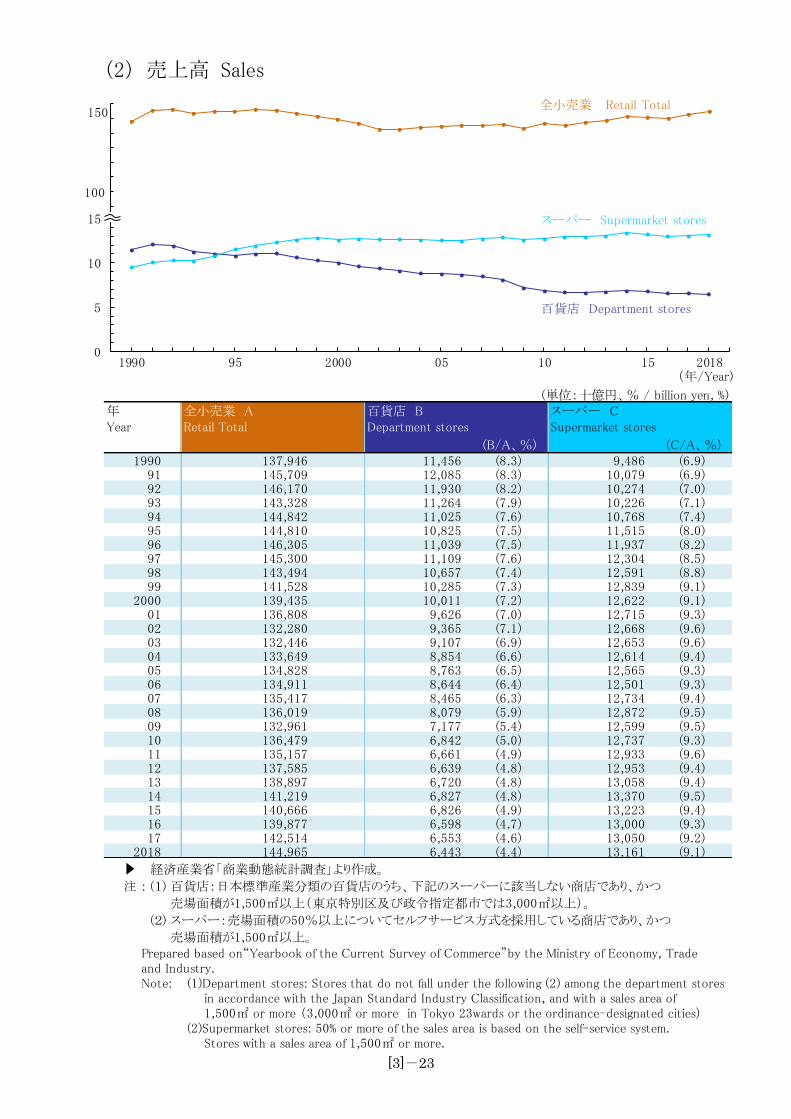
(2) 売上高 Sales
全小売業 Retail Total150
100
0
5
10
15
1990 95 2000 05 10 15 2018(年/Year)
百貨店 Department stores
スーパー Supermarket stores
(単位:十億円、% / billion yen, %)
(B/A、%) (C/A、%) 1990 137,946 11,456 (8.3) 9,486 (6.9)
91 145,709 12,085 (8.3) 10,079 (6.9)92 146,170 11,930 (8.2) 10,274 (7.0)93 143,328 11,264 (7.9) 10,226 (7.1)94 144,842 11,025 (7.6) 10,768 (7.4)95 144,810 10,825 (7.5) 11,515 (8.0)96 146,305 11,039 (7.5) 11,937 (8.2)97 145,300 11,109 (7.6) 12,304 (8.5)98 143,494 10,657 (7.4) 12,591 (8.8)99 141,528 10,285 (7.3) 12,839 (9.1)
2000 139,435 10,011 (7.2) 12,622 (9.1)01 136,808 9,626 (7.0) 12,715 (9.3)02 132,280 9,365 (7.1) 12,668 (9.6)03 132,446 9,107 (6.9) 12,653 (9.6)04 133,649 8,854 (6.6) 12,614 (9.4)05 134,828 8,763 (6.5) 12,565 (9.3)06 134,911 8,644 (6.4) 12,501 (9.3)07 135,417 8,465 (6.3) 12,734 (9.4)08 136,019 8,079 (5.9) 12,872 (9.5)09 132,961 7,177 (5.4) 12,599 (9.5)10 136,479 6,842 (5.0) 12,737 (9.3)11 135,157 6,661 (4.9) 12,933 (9.6)12 137,585 6,639 (4.8) 12,953 (9.4)13 138,897 6,720 (4.8) 13,058 (9.4)14 141,219 6,827 (4.8) 13,370 (9.5)15 140,666 6,826 (4.9) 13,223 (9.4)16 139,877 6,598 (4.7) 13,000 (9.3)17 142,514 6,553 (4.6) 13,050 (9.2)
2018 144,965 6,443 (4.4) 13,161 (9.1)
年Year
全小売業 ARetail Total
百貨店 BDepartment stores
スーパー CSupermarket stores
経済産業省「商業動態統計調査」より作成。
注 : (1) 百貨店:日本標準産業分類の百貨店のうち、下記のスーパーに該当しない商店であり、かつ
売場面積が1,500㎡以上(東京特別区及び政令指定都市では3,000㎡以上)。
(2) スーパー:売場面積の50%以上についてセルフサービス方式を採用している商店であり、かつ
売場面積が1,500㎡以上。Prepared based on“Yearbook of the Current Survey of Commerce”by the Ministry of Economy, Trade and Industry.Note: (1)Department stores: Stores that do not fall under the following (2) among the department stores
in accordance with the Japan Standard Industry Classification, and with a sales area of 1,500㎡ or more (3,000㎡ or more in Tokyo 23wards or the ordinance-designated cities)
(2)Supermarket stores: 50% or more of the sales area is based on the self-service system.Stores with a sales area of 1,500㎡ or more.
[3]-24
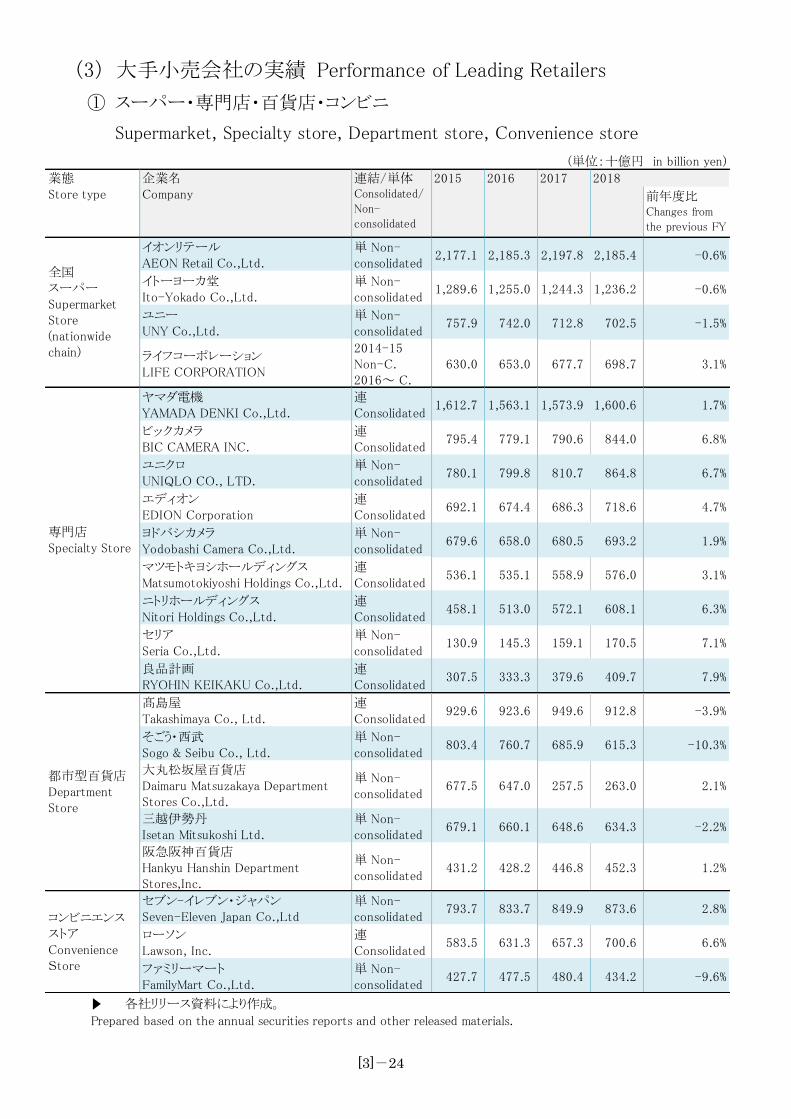
(3) 大手小売会社の実績 Performance of Leading Retailers
① スーパー・専門店・百貨店・コンビニ
Supermarket, Specialty store, Department store, Convenience store
(単位:十億円 in billion yen)
前年度比Changes from
the previous FY
イオンリテールAEON Retail Co.,Ltd.
単 Non-consolidated
2,177.1 2,185.3 2,197.8 2,185.4 -0.6%
イトーヨーカ堂Ito-Yokado Co.,Ltd.
単 Non-consolidated
1,289.6 1,255.0 1,244.3 1,236.2 -0.6%
ユニーUNY Co.,Ltd.
単 Non-consolidated
757.9 742.0 712.8 702.5 -1.5%
ライフコーポレーションLIFE CORPORATION
2014-15Non-C.2016~ C.
630.0 653.0 677.7 698.7 3.1%
ヤマダ電機YAMADA DENKI Co.,Ltd.
連Consolidated
1,612.7 1,563.1 1,573.9 1,600.6 1.7%
ビックカメラBIC CAMERA INC.
連Consolidated
795.4 779.1 790.6 844.0 6.8%
ユニクロUNIQLO CO., LTD.
単 Non-consolidated
780.1 799.8 810.7 864.8 6.7%
エディオンEDION Corporation
連Consolidated
692.1 674.4 686.3 718.6 4.7%
ヨドバシカメラYodobashi Camera Co.,Ltd.
単 Non-consolidated
679.6 658.0 680.5 693.2 1.9%
マツモトキヨシホールディングスMatsumotokiyoshi Holdings Co.,Ltd.
連Consolidated
536.1 535.1 558.9 576.0 3.1%
ニトリホールディングスNitori Holdings Co.,Ltd.
連Consolidated
458.1 513.0 572.1 608.1 6.3%
セリアSeria Co.,Ltd.
単 Non-consolidated
130.9 145.3 159.1 170.5 7.1%
良品計画RYOHIN KEIKAKU Co.,Ltd.
連Consolidated
307.5 333.3 379.6 409.7 7.9%
髙島屋Takashimaya Co., Ltd.
連Consolidated
929.6 923.6 949.6 912.8 -3.9%
そごう・西武Sogo & Seibu Co., Ltd.
単 Non-consolidated
803.4 760.7 685.9 615.3 -10.3%
大丸松坂屋百貨店Daimaru Matsuzakaya DepartmentStores Co.,Ltd.
単 Non-consolidated
677.5 647.0 257.5 263.0 2.1%
三越伊勢丹Isetan Mitsukoshi Ltd.
単 Non-consolidated
679.1 660.1 648.6 634.3 -2.2%
阪急阪神百貨店Hankyu Hanshin DepartmentStores,Inc.
単 Non-consolidated
431.2 428.2 446.8 452.3 1.2%
セブン-イレブン・ジャパンSeven-Eleven Japan Co.,Ltd
単 Non-consolidated
793.7 833.7 849.9 873.6 2.8%
ローソンLawson, Inc.
連Consolidated
583.5 631.3 657.3 700.6 6.6%
ファミリーマートFamilyMart Co.,Ltd.
単 Non-consolidated
427.7 477.5 480.4 434.2 -9.6%
20182016 2017
全国スーパーSupermarketStore(nationwidechain)
専門店Specialty Store
2015
都市型百貨店DepartmentStore
コンビニエンスストアConvenienceStore
業態Store type
企業名Company
連結/単体Consolidated/Non-
consolidated
各社リリース資料により作成。
Prepared based on the annual securities reports and other released materials.
[3]-25
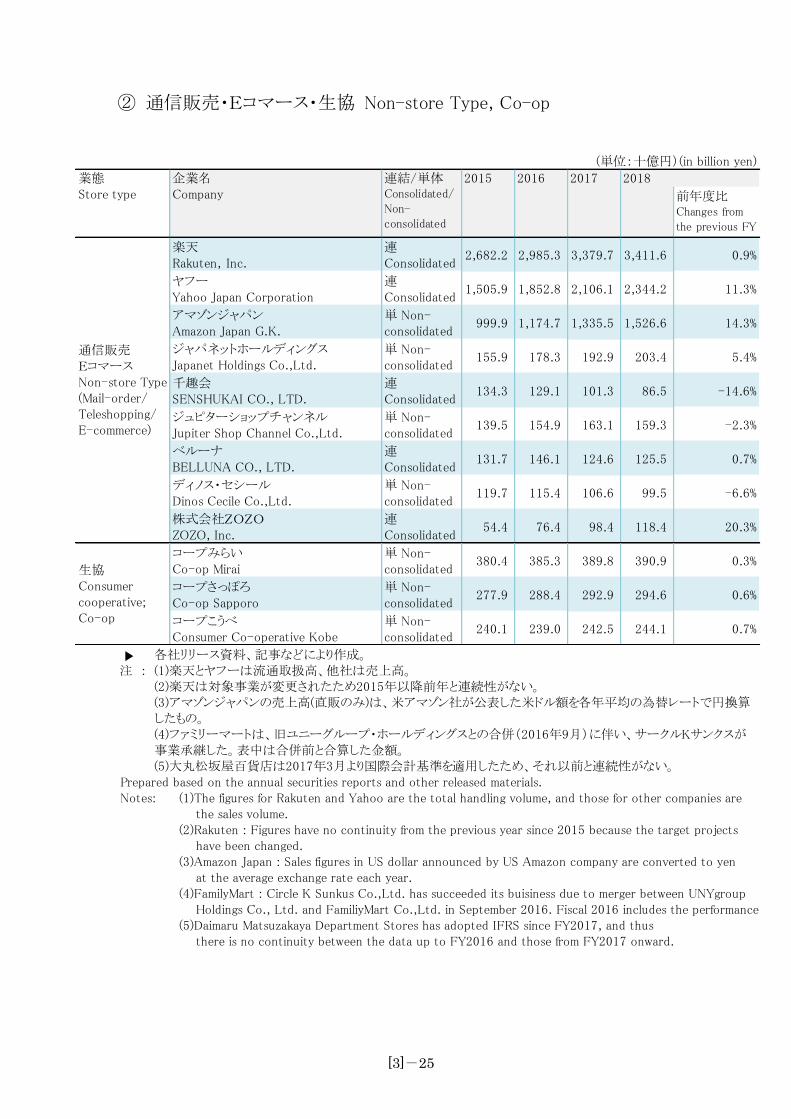
② 通信販売・Eコマース・生協 Non-store Type, Co-op
(単位:十億円)(in billion yen)
前年度比Changes fromthe previous FY
楽天Rakuten,Inc.
連Consolidated
2,682.2 2,985.3 3,379.7 3,411.6 0.9%
ヤフーYahoo Japan Corporation
連Consolidated
1,505.9 1,852.8 2,106.1 2,344.2 11.3%
アマゾンジャパンAmazon Japan G.K.
単 Non-consolidated
999.9 1,174.7 1,335.5 1,526.6 14.3%
ジャパネットホールディングスJapanet Holdings Co.,Ltd.
単 Non-consolidated
155.9 178.3 192.9 203.4 5.4%
千趣会SENSHUKAI CO., LTD.
連Consolidated
134.3 129.1 101.3 86.5 -14.6%
ジュピターショップチャンネルJupiter Shop Channel Co.,Ltd.
単 Non-consolidated
139.5 154.9 163.1 159.3 -2.3%
ベルーナBELLUNA CO., LTD.
連Consolidated
131.7 146.1 124.6 125.5 0.7%
ディノス・セシールDinos Cecile Co.,Ltd.
単 Non-consolidated
119.7 115.4 106.6 99.5 -6.6%
株式会社ZOZOZOZO, Inc.
連Consolidated
54.4 76.4 98.4 118.4 20.3%
コープみらいCo-op Mirai
単 Non-consolidated
380.4 385.3 389.8 390.9 0.3%
コープさっぽろCo-op Sapporo
単 Non-consolidated
277.9 288.4 292.9 294.6 0.6%
コープこうべConsumer Co-operative Kobe
単 Non-consolidated
240.1 239.0 242.5 244.1 0.7%
2016 2017
通信販売EコマースNon-store Type(Mail-order/Teleshopping/E-commerce)
生協Consumercooperative;Co-op
2018業態Store type
企業名Company
連結/単体Consolidated/Non-consolidated
2015
各社リリース資料、記事などにより作成。
注 : (1)楽天とヤフーは流通取扱高、他社は売上高。(2)楽天は対象事業が変更されたため2015年以降前年と連続性がない。(3)アマゾンジャパンの売上高(直販のみ)は、米アマゾン社が公表した米ドル額を各年平均の為替レートで円換算したもの。(4)ファミリーマートは、旧ユニーグループ・ホールディングスとの合併(2016年9月)に伴い、サークルKサンクスが事業承継した。表中は合併前と合算した金額。(5)大丸松坂屋百貨店は2017年3月より国際会計基準を適用したため、それ以前と連続性がない。
Prepared based on the annual securities reports and other released materials.Notes: (1)The figures for Rakuten and Yahoo are the total handling volume, and those for other companies are
the sales volume.(2)Rakuten : Figures have no continuity from the previous year since 2015 because the target projects
have been changed.(3)Amazon Japan : Sales figures in US dollar announced by US Amazon company are converted to yen
at the average exchange rate each year.(4)FamilyMart : Circle K Sunkus Co.,Ltd. has succeeded its buisiness due to merger between UNYgroup
Holdings Co., Ltd. and FamiliyMart Co.,Ltd. in September 2016. Fiscal 2016 includes the performance (5)Daimaru Matsuzakaya Department Stores has adopted IFRS since FY2017, and thus
there is no continuity between the data up to FY2016 and those from FY2017 onward.
[3]-26
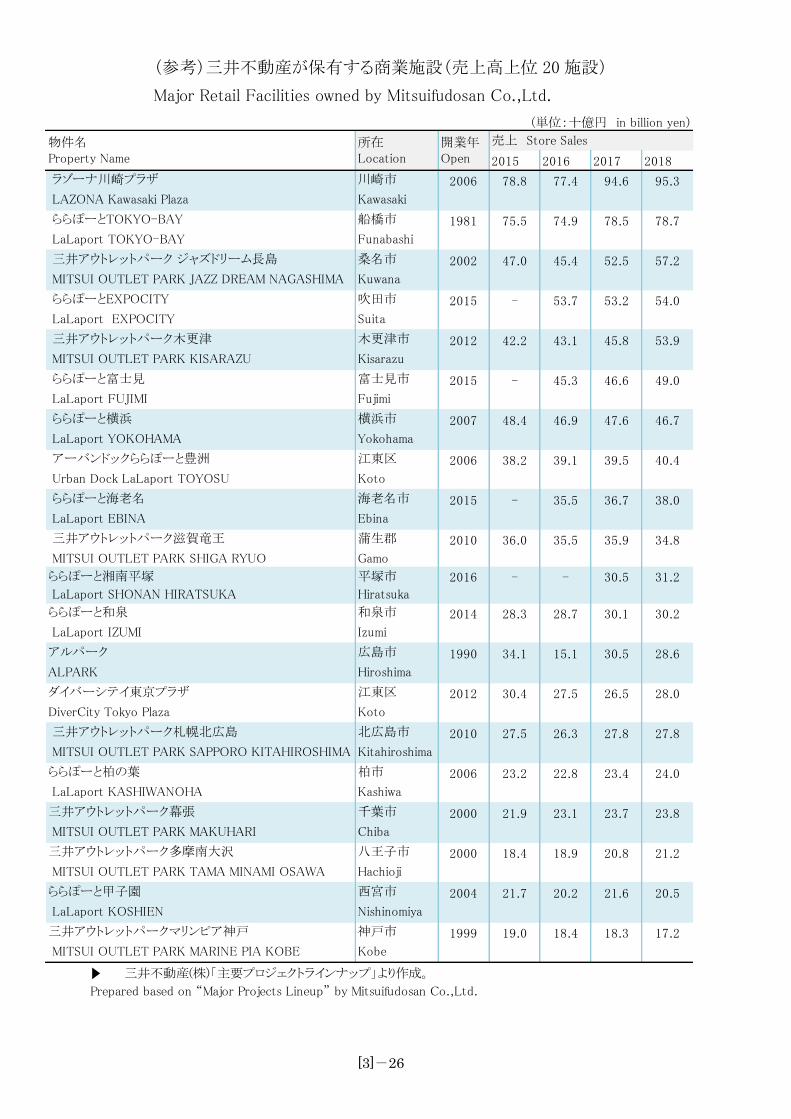
(参考)三井不動産が保有する商業施設(売上高上位 20 施設)
Major Retail Facilities owned by Mitsuifudosan Co.,Ltd.
(単位:十億円 in billion yen)
2015 2016 2017 2018
ラゾーナ川崎プラザ 川崎市 2006 78.8 77.4 94.6 95.3
LAZONA Kawasaki Plaza Kawasaki
ららぽーとTOKYO-BAY 船橋市 1981 75.5 74.9 78.5 78.7
LaLaport TOKYO-BAY Funabashi
三井アウトレットパーク ジャズドリーム長島 桑名市 2002 47.0 45.4 52.5 57.2
MITSUI OUTLET PARK JAZZ DREAM NAGASHIMA Kuwana
ららぽーとEXPOCITY 吹田市 2015 - 53.7 53.2 54.0
LaLaport EXPOCITY Suita
三井アウトレットパーク木更津 木更津市 2012 42.2 43.1 45.8 53.9
MITSUI OUTLET PARK KISARAZU Kisarazu
ららぽーと富士見 富士見市 2015 - 45.3 46.6 49.0
LaLaport FUJIMI Fujimi
ららぽーと横浜 横浜市 2007 48.4 46.9 47.6 46.7
LaLaport YOKOHAMA Yokohama
アーバンドックららぽーと豊洲 江東区 2006 38.2 39.1 39.5 40.4
Urban Dock LaLaport TOYOSU Koto
ららぽーと海老名 海老名市 2015 - 35.5 36.7 38.0
LaLaport EBINA Ebina
三井アウトレットパーク滋賀竜王 蒲生郡 2010 36.0 35.5 35.9 34.8
MITSUI OUTLET PARK SHIGA RYUO Gamo
ららぽーと湘南平塚 平塚市 2016 - - 30.5 31.2
LaLaport SHONAN HIRATSUKA Hiratsuka
ららぽーと和泉 和泉市 2014 28.3 28.7 30.1 30.2
LaLaport IZUMI Izumi
アルパーク 広島市 1990 34.1 15.1 30.5 28.6
ALPARK Hiroshima
ダイバーシテイ東京プラザ 江東区 2012 30.4 27.5 26.5 28.0
DiverCity Tokyo Plaza Koto
三井アウトレットパーク札幌北広島 北広島市 2010 27.5 26.3 27.8 27.8
MITSUI OUTLET PARK SAPPORO KITAHIROSHIMA Kitahiroshima
ららぽーと柏の葉 柏市 2006 23.2 22.8 23.4 24.0
LaLaport KASHIWANOHA Kashiwa
三井アウトレットパーク幕張 千葉市 2000 21.9 23.1 23.7 23.8
MITSUI OUTLET PARK MAKUHARI Chiba
三井アウトレットパーク多摩南大沢 八王子市 2000 18.4 18.9 20.8 21.2
MITSUI OUTLET PARK TAMA MINAMI OSAWA Hachioji
ららぽーと甲子園 西宮市 2004 21.7 20.2 21.6 20.5
LaLaport KOSHIEN Nishinomiya
三井アウトレットパークマリンピア神戸 神戸市 1999 19.0 18.4 18.3 17.2
MITSUI OUTLET PARK MARINE PIA KOBE Kobe
物件名Property Name
所在Location
開業年Open
売上 Store Sales
三井不動産(株) 「主要プロジェクトラインナップ」より作成。
Prepared based on “Major Projects Lineup” by Mitsuifudosan Co.,Ltd.
[3]-27
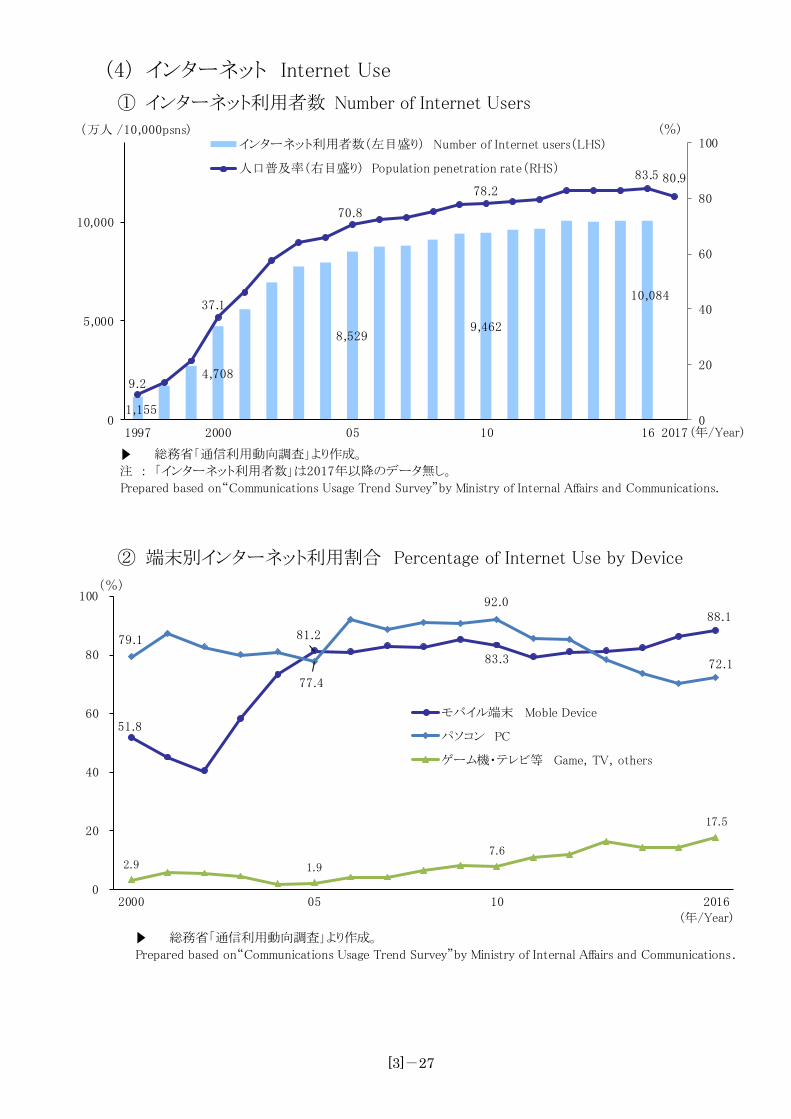
(4) インターネット Internet Use
① インターネット利用者数 Number of Internet Users
1,155
4,708
8,5299,462
10,084
9.2
37.1
70.8
78.283.5 80.9
0
20
40
60
80
100
0
5,000
10,000
1997 2000 05 10 16 2017
インターネット利用者数(左目盛り) Number of Internet users(LHS)
人口普及率(右目盛り) Population penetration rate(RHS)
(万人 /10,000psns)
(年/Year)
(%)
総務省「通信利用動向調査」より作成。
注 : 「インターネット利用者数」は2017年以降のデータ無し。
Prepared based on“Communications Usage Trend Survey”by Ministry of Internal Affairs and Communications.
② 端末別インターネット利用割合 Percentage of Internet Use by Device
51.8
81.2
83.3
88.1
79.1
77.4
92.0
72.1
2.9 1.9
7.6
17.5
0
20
40
60
80
100
2000 05 10 2016
モバイル端末 Moble Device
パソコン PC
ゲーム機・テレビ等 Game, TV, others
(%)
(年/Year)
総務省「通信利用動向調査」より作成。
Prepared based on“Communications Usage Trend Survey”by Ministry of Internal Affairs and Communications.
[3]-28
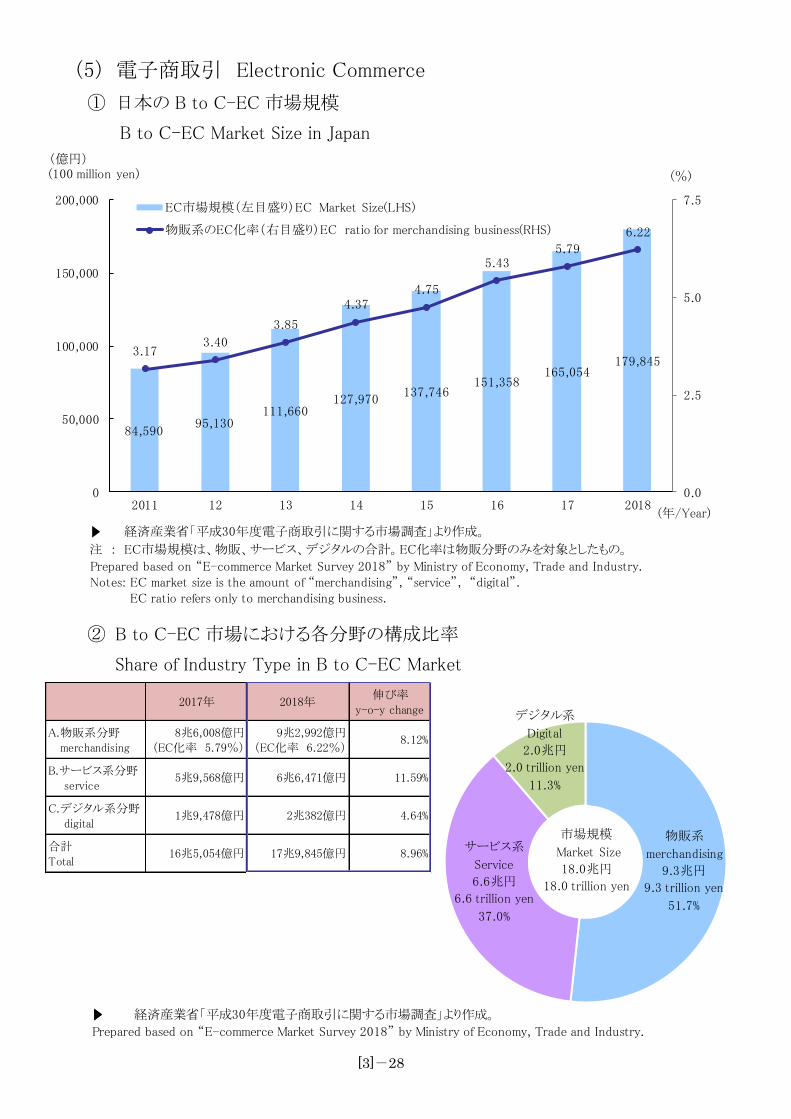
(5) 電子商取引 Electronic Commerce
① 日本の B to C-EC 市場規模
B to C-EC Market Size in Japan
84,59095,130
111,660127,970
137,746151,358
165,054179,845
3.173.40
3.85
4.374.75
5.435.79
6.22
0.0
2.5
5.0
7.5
0
50,000
100,000
150,000
200,000
2011 12 13 14 15 16 17 2018
EC市場規模(左目盛り)EC Market Size(LHS)
物販系のEC化率(右目盛り)EC ratio for merchandising business(RHS)
(億円)(100 million yen)
(年/Year)
(%)
経済産業省「平成30年度電子商取引に関する市場調査」より作成。
注 : EC市場規模は、物販、サービス、デジタルの合計。EC化率は物販分野のみを対象としたもの。
Prepared based on “E-commerce Market Survey 2018” by Ministry of Economy, Trade and Industry.Notes: EC market size is the amount of “merchandising”, “service”, “digital”. EC ratio refers only to merchandising business.
② B to C-EC 市場における各分野の構成比率
Share of Industry Type in B to C-EC Market
2017年 2018年伸び率
y-o-y change
A.物販系分野 merchandising
8兆6,008億円(EC化率 5.79%)
9兆2,992億円(EC化率 6.22%)
8.12%
B.サービス系分野 service
5兆9,568億円 6兆6,471億円 11.59%
C.デジタル系分野
digital1兆9,478億円 2兆382億円 4.64%
合計
Total16兆5,054億円 17兆9,845億円 8.96%
経済産業省「平成30年度電子商取引に関する市場調査」より作成。
Prepared based on “E-commerce Market Survey 2018” by Ministry of Economy, Trade and Industry.
物販系
merchandising
9.3兆円
9.3 trillion yen
51.7%
サービス系
Service
6.6兆円
6.6 trillion yen
37.0%
デジタル系
Digital
2.0兆円
2.0 trillion yen
11.3%
市場規模
Market Size
18.0兆円
18.0 trillion yen
[3]-29
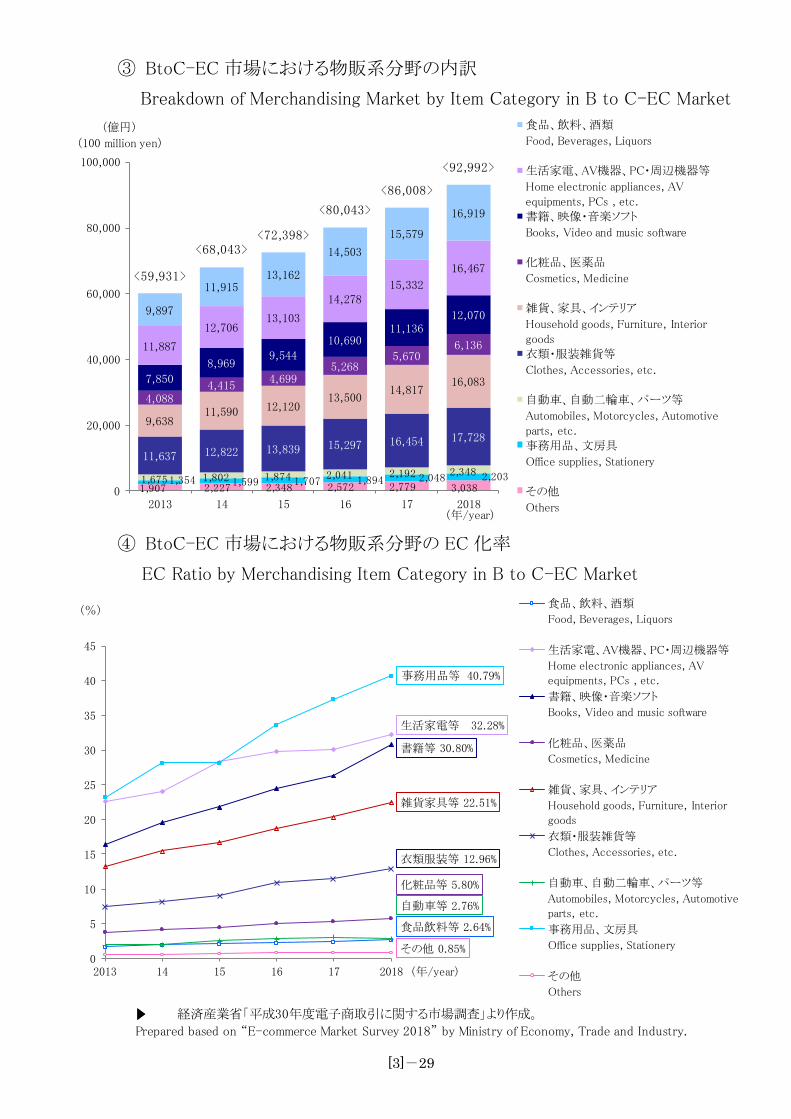
③ BtoC-EC 市場における物販系分野の内訳
Breakdown of Merchandising Market by Item Category in B to C-EC Market
1,907 2,227 2,348 2,572 2,779 3,0381,354 1,599 1,707 1,894 2,048 2,2031,675 1,802 1,874 2,041 2,192 2,348
11,637 12,822 13,839 15,297 16,454 17,728
9,63811,590 12,120
13,50014,817
16,083
4,0884,415
4,6995,268
5,6706,136
7,850
8,9699,544
10,69011,136
12,070
11,887
12,706 13,103
14,278 15,332
16,467
9,897
11,91513,162
14,503
15,579
16,919
<59,931>
<68,043><72,398>
<80,043>
<86,008>
<92,992>
0
20,000
40,000
60,000
80,000
100,000
2013 14 15 16 17 2018
(億円)
(100 million yen)
(年/year)
食品、飲料、酒類
Food, Beverages, Liquors
生活家電、AV機器、PC・周辺機器等
Home electronic appliances, AV equipments, PCs , etc.書籍、映像・音楽ソフト
Books, Video and music software
化粧品、医薬品
Cosmetics, Medicine
雑貨、家具、インテリア
Household goods, Furniture, Interior goods衣類・服装雑貨等
Clothes, Accessories, etc.
自動車、自動二輪車、パーツ等
Automobiles, Motorcycles, Automotive parts, etc.事務用品、文房具
Office supplies, Stationery
その他
Others
④ BtoC-EC 市場における物販系分野の EC 化率
EC Ratio by Merchandising Item Category in B to C-EC Market
食品飲料等 2.64%
生活家電等 32.28%
書籍等 30.80%
化粧品等 5.80%
雑貨家具等 22.51%
衣類服装等 12.96%
自動車等 2.76%
事務用品等 40.79%
その他 0.85%0
5
10
15
20
25
30
35
40
45
2013 14 15 16 17 2018
(%)
(年/year)
食品、飲料、酒類
Food, Beverages, Liquors
生活家電、AV機器、PC・周辺機器等
Home electronic appliances, AV
equipments, PCs , etc.
書籍、映像・音楽ソフト
Books, Video and music software
化粧品、医薬品
Cosmetics, Medicine
雑貨、家具、インテリア
Household goods, Furniture, Interior goods
衣類・服装雑貨等
Clothes, Accessories, etc.
自動車、自動二輪車、パーツ等
Automobiles, Motorcycles, Automotive parts, etc.
事務用品、文房具
Office supplies, Stationery
その他
Others
経済産業省「平成30年度電子商取引に関する市場調査」より作成。
Prepared based on “E-commerce Market Survey 2018” by Ministry of Economy, Trade and Industry.
[3]-30
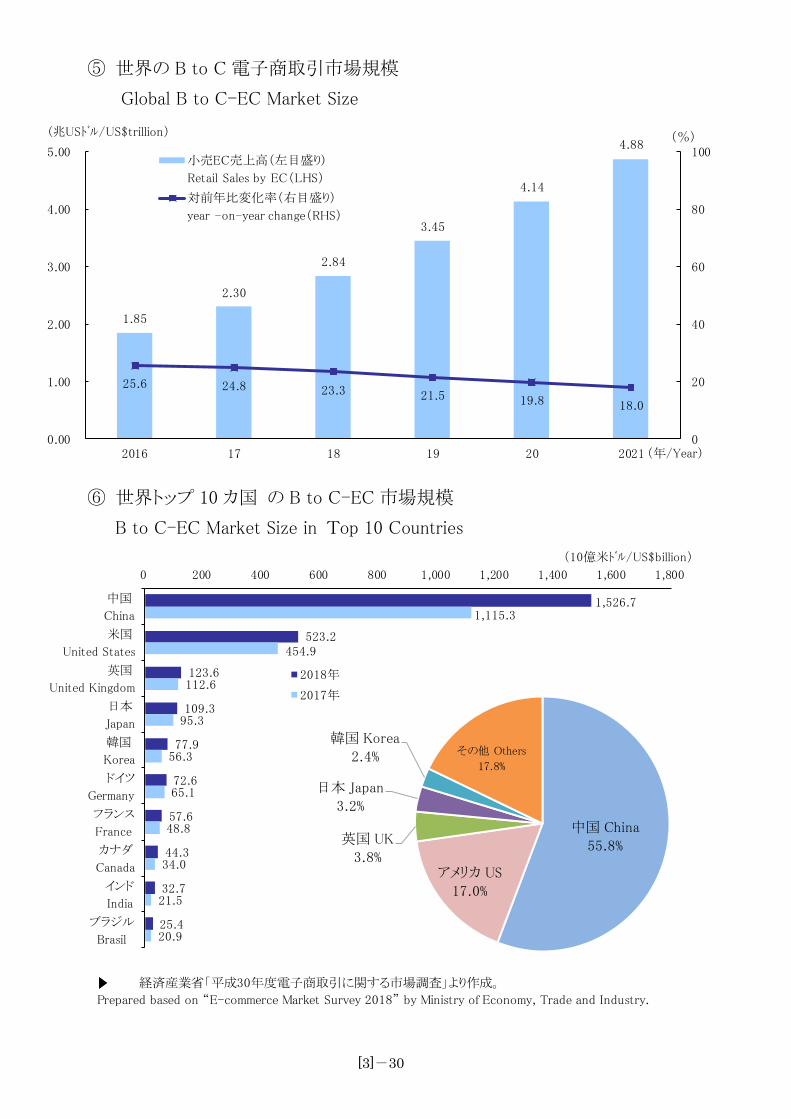
⑤ 世界の B to C 電子商取引市場規模
Global B to C-EC Market Size
1.85
2.30
2.84
3.45
4.14
4.88
25.6 24.8 23.3 21.5 19.8 18.0
0
20
40
60
80
100
0.00
1.00
2.00
3.00
4.00
5.00
2016 17 18 19 20 2021
(兆USドル/US$trillion)
小売EC売上高(左目盛り)
Retail Sales by EC(LHS)
対前年比変化率(右目盛り)
year -on-year change(RHS)
(%)
(年/Year)
⑥ 世界トップ 10 カ国 の B to C-EC 市場規模
B to C-EC Market Size in Top 10 Countries
1,526.7
523.2
123.6
109.3
77.9
72.6
57.6
44.3
32.7
25.4
1,115.3
454.9
112.6
95.3
56.3
65.1
48.8
34.0
21.5
20.9
0 200 400 600 800 1,000 1,200 1,400 1,600 1,800
中国
China
米国
United States
英国
United Kingdom
日本
Japan
韓国
Korea
ドイツ
Germany
フランス
France
カナダ
Canada
インド
India
ブラジル
Brasil
(10億米ドル/US$billion)
2018年
2017年
中国 China
55.8%
アメリカ US
17.0%
英国 UK
3.8%
日本 Japan
3.2%
韓国 Korea
2.4% その他 Others
17.8%
経済産業省「平成30年度電子商取引に関する市場調査」より作成。
Prepared based on “E-commerce Market Survey 2018” by Ministry of Economy, Trade and Industry.
[3]-31
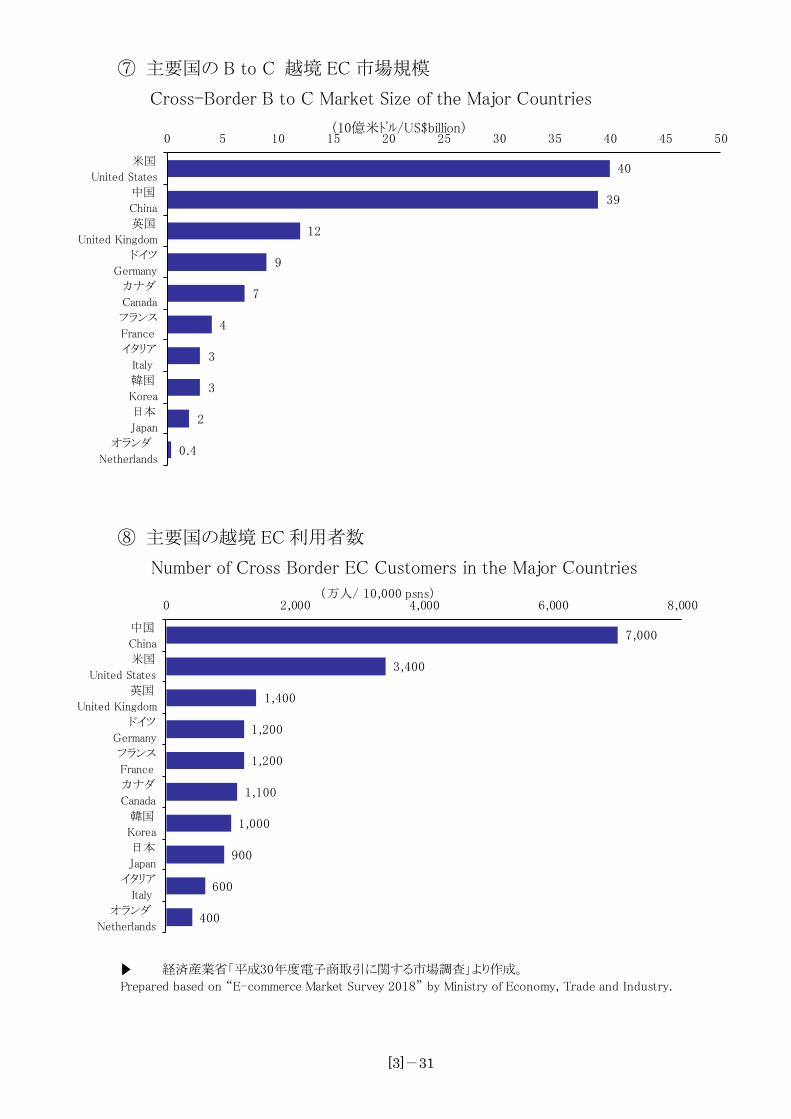
⑦ 主要国の B to C 越境 EC 市場規模
Cross-Border B to C Market Size of the Major Countries
40
39
12
9
7
4
3
3
2
0.4
0 5 10 15 20 25 30 35 40 45 50
米国
United States
中国
China
英国
United Kingdom
ドイツ
Germany
カナダ
Canada
フランス
France
イタリア
Italy
韓国
Korea
日本
Japan
オランダ
Netherlands
(10億米ドル/US$billion)
⑧ 主要国の越境 EC 利用者数
Number of Cross Border EC Customers in the Major Countries
7,000
3,400
1,400
1,200
1,200
1,100
1,000
900
600
400
0 2,000 4,000 6,000 8,000
中国
China
米国
United States
英国
United Kingdom
ドイツ
Germany
フランス
France
カナダ
Canada
韓国
Korea
日本
Japan
イタリア
Italy
オランダ
Netherlands
(万人/ 10,000 psns)
経済産業省「平成30年度電子商取引に関する市場調査」より作成。
Prepared based on “E-commerce Market Survey 2018” by Ministry of Economy, Trade and Industry.
[3]-32
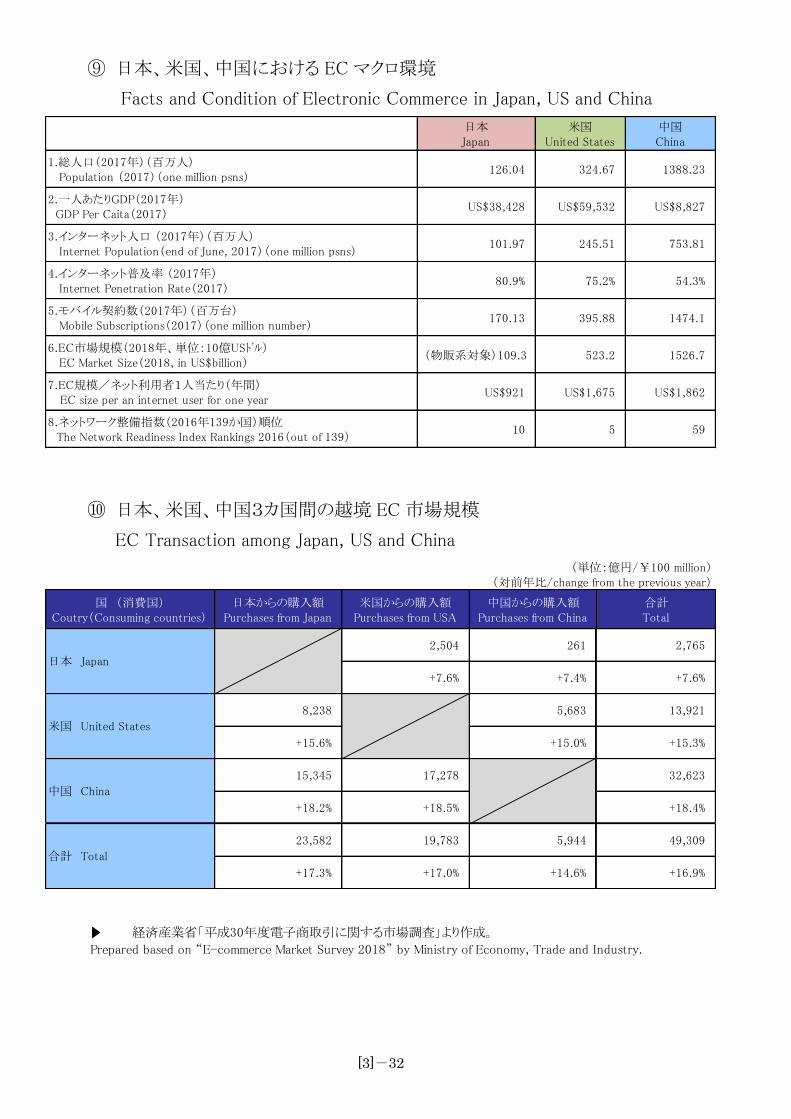
⑨ 日本、米国、中国における EC マクロ環境
Facts and Condition of Electronic Commerce in Japan, US and China
日本Japan
米国United States
中国China
1.総人口(2017年)(百万人) Population (2017)(one million psns)
126.04 324.67 1388.23
2.一人あたりGDP(2017年) GDP Per Caita(2017)
US$38,428 US$59,532 US$8,827
3.インターネット人口 (2017年)(百万人) Internet Population(end of June, 2017)(one million psns)
101.97 245.51 753.81
4.インターネット普及率 (2017年) Internet Penetration Rate(2017)
80.9% 75.2% 54.3%
5.モバイル契約数(2017年)(百万台) Mobile Subscriptions(2017)(one million number)
170.13 395.88 1474.1
6.EC市場規模(2018年、単位:10億USドル) EC Market Size(2018, in US$billion)
(物販系対象)109.3 523.2 1526.7
7.EC規模/ネット利用者1人当たり(年間) EC size per an internet user for one year
US$921 US$1,675 US$1,862
8.ネットワーク整備指数(2016年139か国)順位 The Network Readiness Index Rankings 2016(out of 139)
10 5 59
⑩ 日本、米国、中国3カ国間の越境 EC 市場規模
EC Transaction among Japan, US and China
国 (消費国)Coutry(Consuming countries)
日本からの購入額Purchases from Japan
米国からの購入額Purchases from USA
中国からの購入額Purchases from China
合計Total
2,504 261 2,765
+7.6% +7.4% +7.6%
8,238 5,683 13,921
+15.6% +15.0% +15.3%
15,345 17,278 32,623
+18.2% +18.5% +18.4%
23,582 19,783 5,944 49,309
+17.3% +17.0% +14.6% +16.9%
(単位:億円/¥100 million)(対前年比/change from the previous year)
合計 Total
日本 Japan
米国 United States
中国 China
経済産業省「平成30年度電子商取引に関する市場調査」より作成。
Prepared based on “E-commerce Market Survey 2018” by Ministry of Economy, Trade and Industry.