yes bank initiationsmartinvestor.business-standard.com/bscms/pdf/yes_bank...to follow the path of...
TRANSCRIPT


Initiating Coverage Yes Bank Ltd
Recommendation BUY Snapshot Yes Bank Ltd (Yes Bank), founded by Mr. Rana Kapoor and his highly competent top management team, is India’s new age private sector Bank. It is one of the banks which have the distinction of obtaining RBI’s Greenfield banking license. Yes Bank is recognized amongst the top five private banks in terms of business size and is one of the fastest growing banks in recent times. The total balance sheet size of the bank is Rs. 52,000 Crs with a total business (advances & deposits) of Rs. 70,000 Crs as on 31st December 2010.
Investment Rationale Strong growth in advances to continue: Going forward we expect the Bank to continue to grow much ahead of the industry given that it is the youngest bank in the sector with low credit base and an aggressive growth strategy. Management has guided its loan growth to be around 2x the industry’s loan growth. Management expects the bank’s total business to increase at a CAGR of 35% till FY 2015 with a total business size of Rs. 2.25 lakh Crs.
Aggressive branch expansion plans in order to increase retail base: Yes Bank is expanding its retail base aggressively. The bank plans to increase the number of branches to 750 by 2015 from 185 as on December 2010. In our view, extensive branch expansion will strengthen its asset base leading to higher growth and increase its low cost deposits thereby enhancing the bank’s CASA share.
Non‐interest income continues to aid top‐line growth: We expect the bank’s fee income to expand further with an increase in business and to grow at a CAGR of 26% over FY 2010‐2013E. Financial advisory and transaction banking will continue to be the key focus areas for growth in non interest income.
Asset quality remains the best in the industry: The bank's asset quality remains healthy with one of the lowest proportion of stressed assets (0.5% of total loan book). We have conservatively built in higher delinquencies given the fact that increased loans to retail and SME segment along with a significant credit growth may also result in higher slippages. Nevertheless it is noteworthy to mention, that even after factoring in an increase in NPAs it still remains low as compared to its peer group.
Valuation & Recommendation At CMP of Rs. 271, the stock is trading at 2.01x of its FY12E ABV. Looking at the historical trend and Yes Bank’s growth phase we value it at 2.75x P/ABV of FY 2012E. Based on our estimated book value of Rs.134.7 per share for FY 2012E and P/ABV target multiple of 2.75x we arrive at a target price of Rs.370. Consequently, we recommend BUY on the stock with a target price of Rs.370 indicating potential upside of 37%.
CMP (07/03/2011) Rs. 271
Target Rs. 370Sector Banking
Stock Details
BSE Code
NSE Code
Bloomberg Code
Market Cap (Rs. Crs)
Free Float (%)
52‐ wk HI/Low
Avg. volume BSE (Quarterly)
Face Value (Rs.)
Dividend (FY 2010)
Shares o/s (in Crs)
532648
YES
YES IN
9,390
73.4%
388/233
537,617
10
15%34.58
Relative Performance 1 Mth 3 Mth 1 Yr Yes Bank 6.0% ‐26.4% 9.5%
Sensex 2.5% ‐12.0% 8.8%
80
100
120
140
160
Feb‐10 May‐10 Aug‐10 Nov‐10 Feb‐11
YES Bank SENSEX
Shareholding Pattern as on 31/12/2010 Promoters Holding 26.6%
FII, Banks & Institutions 60.1%
Corporate Bodies 1.8%
Public & others 11.5%Silky Jain, Research Analyst (022‐39268178) [email protected] Pradeep Mundra, Research Associate (022‐39268078)[email protected]
Year NII (Rs. Crs)
Growth %
Profit before provisioning (Rs. Crs)
Margin %
PAT (Rs. Crs)
EPS (Rs) P/E (x) Adj. BVPS (Rs.)
P/ABV (x)
ROE %
FY 2010A 788 54.7% 863 63.3% 478 14.87 18.22 90.70 2.99 20.3% FY 2011E 1,229 56.0% 1,169 63.0% 718 20.00 13.55 109.82 2.47 21.0% FY 2012E 1,645 33.8% 1,568 62.3% 941 26.00 10.42 134.70 2.01 22.5% FY 2013E 2,236 36.0% 2,096 61.7% 1,278 35.31 7.67 168.91 1.60 24.6%

Initiating Coverage Yes Bank Ltd
Investment Rationale Strong growth in advances to continue Yes bank’s advances have grown at a CAGR of 52% over FY 2007‐FY 2010 compared to 19% CAGR growth in the industry. Accordingly, the market share of the bank in advances has expanded to 0.8% (in 9MFY11) from 0.3% in FY 2007. For 9MFY11, Yes Bank’s advances grew 66.3% YoY against approximately 24.5% YoY growth in the industry. In terms of business growth, Axis Bank and HDFC Bank had also followed the similar growth pattern historically. HDFC Bank and Axis Bank had grown at CAGR of 94% of and 60% respectively in initial years (FY1995‐ FY2000). Yes Bank continues to follow the path of Axis Bank and HDFC Bank in its initial years of inception. Management has guided that the bank’s loan growth would be around 2x the industry’s loan growth. Management expects the bank’s total business to increase at a CAGR of 35% till FY 2015 with a total business of Rs. 2.25 lakh Crs. In addition, the bank has maintained its guidance of ~60% loan growth and ~70% deposit growth in FY 2011. Going forward we expect the bank to continue to grow much ahead of the industry given that it is the youngest bank in the sector with low credit base and an aggressive growth strategy.
50%32%
79%60%
40%27%22% 17% 17% 22% 21% 20%
0%
20%
40%
60%
80%
100%
2008 2009 2010 2011E 2012E 2013E
Yes Bank advances v/s industry advances
Yes Bank Advances Industry advances
Source: Company data, RBI, Nirmal Bang Research
61%
22%
66% 65%
41%28%
22% 20%17% 17% 21% 20%
0%
20%
40%
60%
80%
2008 2009 2010 2011E 2012E 2013E
Yes Bank deposits v/s industry deposits
Yes Bank Deposits Industry deposits
Source: Company data, RBI, Nirmal Bang Research
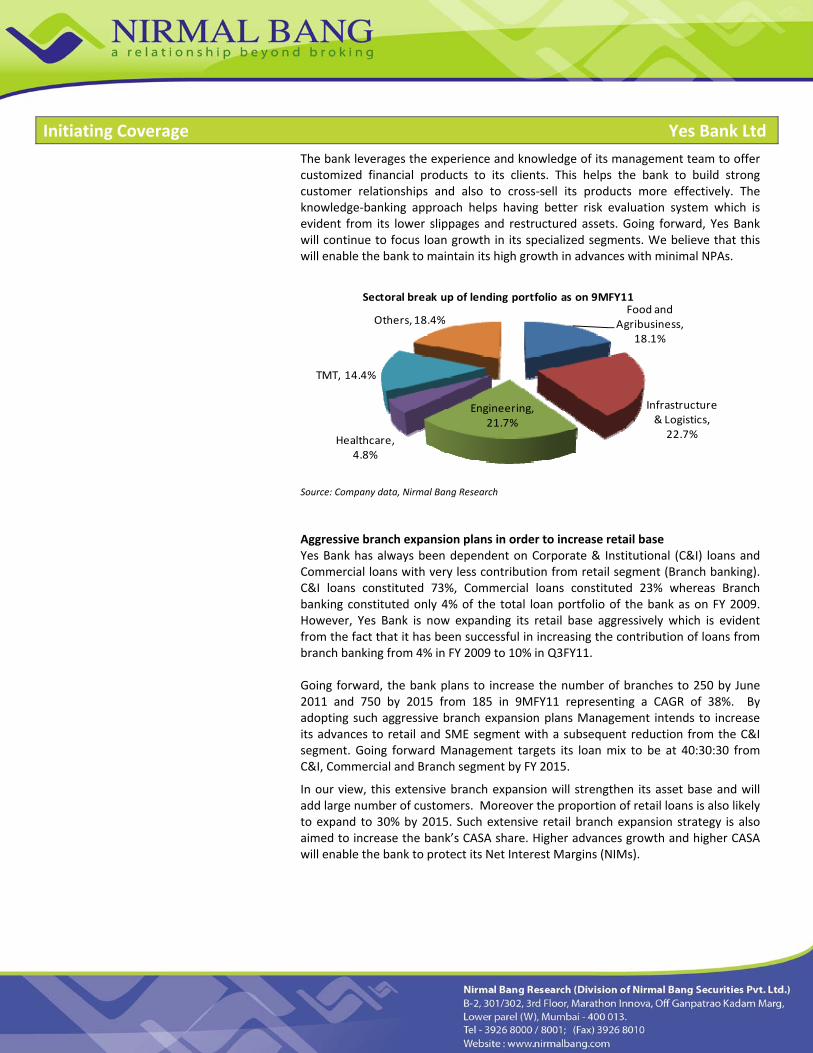
Focus on Knowledge Banking approach provides an edge Yes Bank had identified some of the niche growth sectors right from its inception which were not a major focus area for other banks. The bank developed its expertise in these key sectors to target high growth. The key knowledge sectors of Yes Bank include food and agri‐business, media and entertainment, information technology, telecommunications, infrastructure, engineering and healthcare. Approximately 82% of the bank's advances are into the knowledge sectors (9MFY11).
Initiating Coverage Yes Bank Ltd
The bank leverages the experience and knowledge of its management team to offer customized financial products to its clients. This helps the bank to build strong customer relationships and also to cross‐sell its products more effectively. The knowledge‐banking approach helps having better risk evaluation system which is evident from its lower slippages and restructured assets. Going forward, Yes Bank will continue to focus loan growth in its specialized segments. We believe that this will enable the bank to maintain its high growth in advances with minimal NPAs.
Food and Agribusiness,
18.1%
Infrastructure & Logistics, 22.7%
Engineering, 21.7%
Healthcare, 4.8%
TMT, 14.4%
Others, 18.4%
Sectoral break up of lending portfolio as on 9MFY11
Source: Company data, Nirmal Bang Research
Aggressive branch expansion plans in order to increase retail base Yes Bank has always been dependent on Corporate & Institutional (C&I) loans and Commercial loans with very less contribution from retail segment (Branch banking). C&I loans constituted 73%, Commercial loans constituted 23% whereas Branch banking constituted only 4% of the total loan portfolio of the bank as on FY 2009. However, Yes Bank is now expanding its retail base aggressively which is evident from the fact that it has been successful in increasing the contribution of loans from branch banking from 4% in FY 2009 to 10% in Q3FY11. Going forward, the bank plans to increase the number of branches to 250 by June 2011 and 750 by 2015 from 185 in 9MFY11 representing a CAGR of 38%. By adopting such aggressive branch expansion plans Management intends to increase its advances to retail and SME segment with a subsequent reduction from the C&I segment. Going forward Management targets its loan mix to be at 40:30:30 from C&I, Commercial and Branch segment by FY 2015.
In our view, this extensive branch expansion will strengthen its asset base and will add large number of customers. Moreover the proportion of retail loans is also likely to expand to 30% by 2015. Such extensive retail branch expansion strategy is also aimed to increase the bank’s CASA share. Higher advances growth and higher CASA will enable the bank to protect its Net Interest Margins (NIMs).

Initiating Coverage Yes Bank Ltd
0%
20%
40%
60%
80%
FY 2009 FY 2010 9MFY 11
Break up of advances
Commercial Branch Corporate and Institutional
Source: Company data, Nirmal Bang Research
CASA to improve gradually Yes Bank's proportion of low cost deposits i.e. current account saving account (CASA) is amongst the lowest in the sector. However, in absolute numbers CASA has grown at 81% CAGR during FY 2007‐FY 2010. The bank has historically relied more on wholesale deposits to ramp up loan growth. In addition relatively lower branches impacted the CASA mobilization of the bank. YES Bank's CASA mix is inclined towards current account which constitutes approximately 85% of its low cost deposits.
Yes Bank is looking to derive value from planned branch expansion and increase penetration to improve its CASA ratio. Management wants to increase the CASA share to 30% by FY 2015. However, we expect a gradual improvement in the bank’s CASA ratio from current 10.2% to 14.2% till FY 2013. We expect CASA deposits to grow at a CAGR of 59% over FY 2010‐FY 2013. We believe that the increase in CASA deposits will protect the bank’s net interest margins in the current scenario of rising interest rates. Consequently, we expect a marginal decline in NIMs in FY 2011E and FY 2012E.
8.7%10.5% 11.3%
12.9%14.2%
0.0%
5.0%
10.0%
15.0%
0
5,000
10,000
15,000
FY 2009 FY 2010 FY 2011EFY 2012EFY 2013E
Rs. in Crs
CASA (%)
CASA CASA %
Source: Company data, Nirmal Bang Research

Initiating Coverage Yes Bank Ltd
3.3%2.9% 2.8% 2.6% 2.7%
0.0%
1.0%
2.0%
3.0%
4.0%
0
500
1,000
1,500
2,000
2,500
FY 2009 FY 2010 FY 2011E FY 2012E FY 2013E
Rs. in Crs
Net interest margins
NII NIMs
Source: Company data, Nirmal Bang Research
Asset quality remains the best in the industry The bank's asset quality remains healthy with one of the lowest proportion of stressed assets (0.5% of total loan book). Exposure to MFI sector is less than 1% of the loans and Management has stated that as on 9MFY11, there was no account overdue. Also, it does not have any exposure to the new 2G players. The banks restructured assets stand much lower than the peers. With focused loan growth within the specialized segments, we expect that the bank would be able to maintain its asset quality.
However it would be unreasonable to assume further improvement and therefore we have conservatively built in higher delinquencies. In addition the fact that increased loans to retail and SME segment with a significant credit growth may also result in higher slippages. Nevertheless it is noteworthy to mention, that even after factoring in an increase in NPAs it still remains low as compared to its peer group. The bank’s provision coverage ratio stood at 76% as on December 2010.
0.68%
0.27% 0.35%0.39% 0.45%
0.33%
0.06% 0.07% 0.09% 0.11%0.00%
0.20%
0.40%
0.60%
0.80%
0
100
200
300
FY 2009 FY 2010 FY 2011E FY 2012E FY 2013E
Rs. in Crs
NPA Movement
Gross NPA Net NPA GNPA (%) NNPA (%)
Source: Company data, Nirmal Bang Research
Cost to income ratio to remain attractive Management expects the branch network to increase to 250 by the end of June 2011 from the current levels of 185. Larger branch penetration will act as a catalyst between growth in CASA and more market share as well as improvement in NIMs. Productivity ratios of the bank remain as one of the best, regardless of having large number of branch and employee additions. Most of the bank's branches are comparatively new and yet to pick up in terms of productivity. Even in this scenario, the bank has been able to limit its operating expenses while maintaining the growth momentum.

Initiating Coverage Yes Bank Ltd
Going forward, with the addition of number of branches and expansion of retail business, the bank’s operating expenses are expected to increase significantly. Despite the anticipated increase, cost to income ratio of Yes Bank will still stand far lower than its peer group. Management has indicated that it will make efforts to contain its cost to income ratio below 40% which it has been able to do so over the last eight quarters.
44.2%36.7% 37.0% 37.7%
38.3%
0.0%
10.0%
20.0%
30.0%
40.0%
50.0%
0
500
1,000
1,500
FY 2009 FY 2010 FY 2011E FY 2012EFY 2013E
Rs. in Crs
Cost to income ratio
Operating expenses Cost to income ratio
Source: Company data, Nirmal Bang Research
Non‐interest income continues to aid top‐line growth Yes Bank's non‐interest income broadly comprises of income from transaction banking, financial markets (mainly treasury income), financial advisory (investment banking and project advisory) and retail and other fees.
We expect the bank’s fee income to expand further with an increase in business as the bank would be able to cross sell its products to larger customer base. Income from distribution of third party products will pick up once new branches become operational. Therefore we expect fee income to grow at a CAGR of 26% over FY 2010‐FY 2013E. Financial advisory and transaction banking will continue to be the key focus areas for growth in non interest income.
46.2%42.2%
33.7% 34.7% 34.2%
0.0%
10.0%
20.0%
30.0%
40.0%
50.0%
0
500
1,000
1,500
FY 2009 FY 2010 FY 2011E FY 2012E FY 2013E
Rs. in Crs
Break up of non interest income
Transaction Banking Financial Advisory Financial MarketsRetail and others % of total income
Source: Company data, Nirmal Bang Research
Risk Concerns • Lower than anticipated CASA movement can have an impact on NIMs.
• Yes Bank's growth plans are dependent on obtaining branch licenses. Any
delays in getting branch licenses from RBI could adversely impact valuations.
• More than expected slippages from the retail segment can have an impact on the company’s valuation and impact the target price.
Initiating Coverage Yes Bank Ltd
Company Background
Yes Bank, founded by Mr. Rana Kapoor and his highly competent top management team, is India’s new age private sector Bank. It began its operations in May 2004 and is one of the banks which have the distinction of obtaining RBI’s Greenfield banking license. The bank is recognized amongst the top five private banks in terms of business size and is one of the fastest growing banks in recent times.
Yes Bank offers corporate and institutional banking, financial markets, investment banking, corporate finance, branch banking, business and transaction banking and wealth management services through its branch network spread across the country.
Business
Yes Bank operates in three segments, namely • Commercial and Institutional Banking: The Corporate & Institutional
Banking (C&IB) division provides comprehensive financial and risk management solutions to clients generally with a turnover of over Rs. 1,000 Crs. The bank provides financial solutions to the Large Corporate Groups, Public Sector Enterprises, Central and State Governments, Multinational Companies and Financial Institutions.
• Commercial Banking: Yes Bank has institutionalized Commercial Banking (CB) to serve the specialized segment of companies generally with a turnover between Rs. 100 crs to Rs. 1,000 crs. CB targets companies operating across the key emerging sectors like Food and Agribusiness, Life Sciences & Health Care, Media and Entertainment, Engineering, Telecommunications, Information Technology and Infrastructure.
• Branch Banking: Branch Banking–Liabilities & Wealth Management, Business Banking and Retail Banking customers together constitute the Branch Banking business.
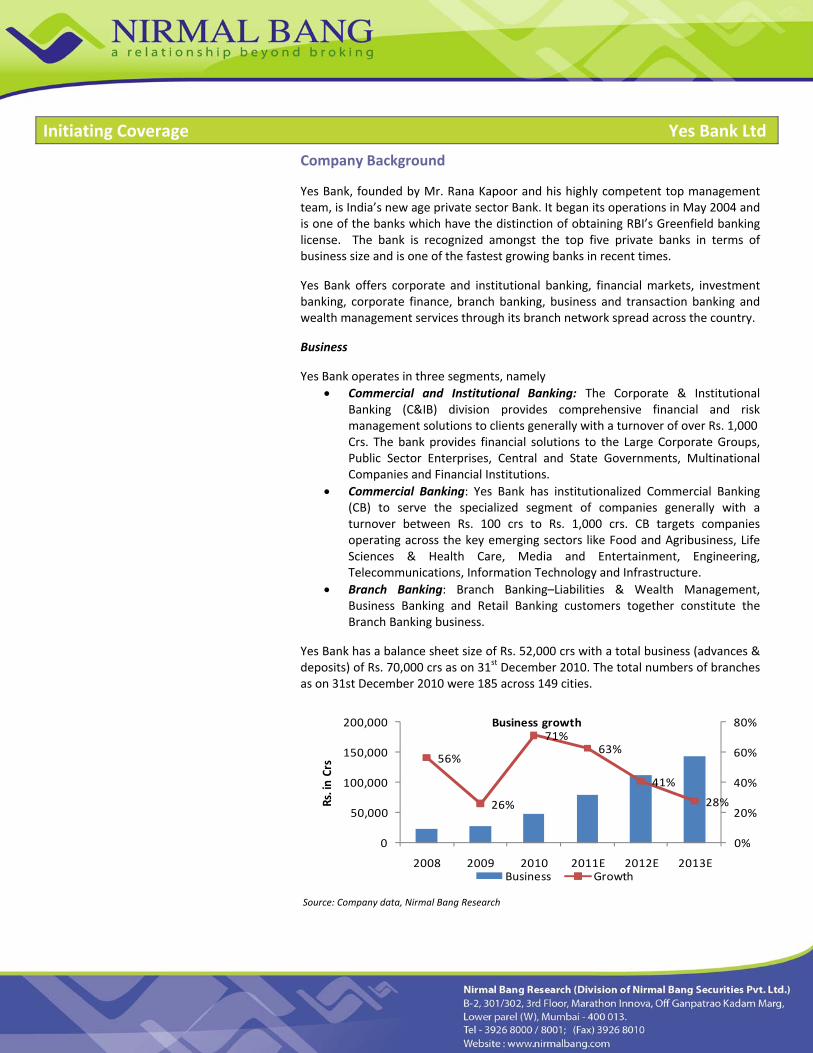
Yes Bank has a balance sheet size of Rs. 52,000 crs with a total business (advances & deposits) of Rs. 70,000 crs as on 31st December 2010. The total numbers of branches as on 31st December 2010 were 185 across 149 cities.
56%
26%
71%63%
41%
28%
0%
20%
40%
60%
80%
0
50,000
100,000
150,000
200,000
2008 2009 2010 2011E 2012E 2013E
Rs. in Crs
Business growth
Business Growth
Source: Company data, Nirmal Bang Research
Initiating Coverage Yes Bank Ltd
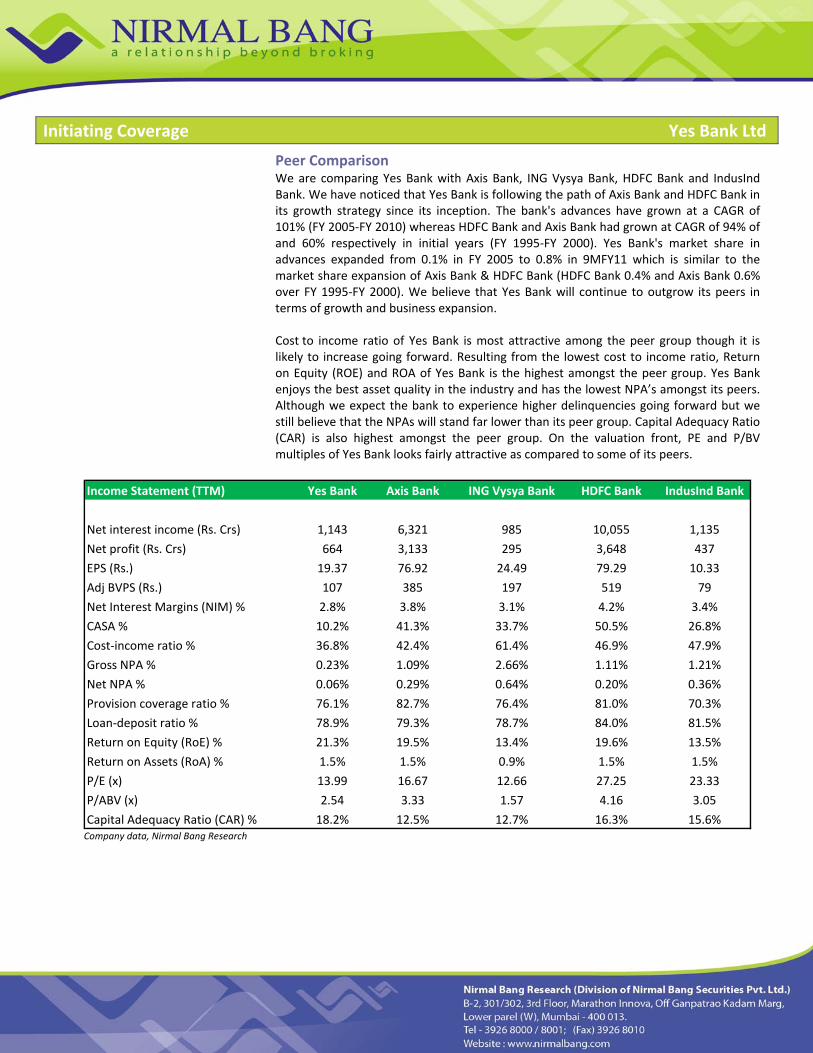
Peer Comparison We are comparing Yes Bank with Axis Bank, ING Vysya Bank, HDFC Bank and IndusInd Bank. We have noticed that Yes Bank is following the path of Axis Bank and HDFC Bank in its growth strategy since its inception. The bank's advances have grown at a CAGR of 101% (FY 2005‐FY 2010) whereas HDFC Bank and Axis Bank had grown at CAGR of 94% of and 60% respectively in initial years (FY 1995‐FY 2000). Yes Bank's market share in advances expanded from 0.1% in FY 2005 to 0.8% in 9MFY11 which is similar to the market share expansion of Axis Bank & HDFC Bank (HDFC Bank 0.4% and Axis Bank 0.6% over FY 1995‐FY 2000). We believe that Yes Bank will continue to outgrow its peers in terms of growth and business expansion. Cost to income ratio of Yes Bank is most attractive among the peer group though it is likely to increase going forward. Resulting from the lowest cost to income ratio, Return on Equity (ROE) and ROA of Yes Bank is the highest amongst the peer group. Yes Bank enjoys the best asset quality in the industry and has the lowest NPA’s amongst its peers. Although we expect the bank to experience higher delinquencies going forward but we still believe that the NPAs will stand far lower than its peer group. Capital Adequacy Ratio (CAR) is also highest amongst the peer group. On the valuation front, PE and P/BV multiples of Yes Bank looks fairly attractive as compared to some of its peers.
Income Statement (TTM) Yes Bank Axis Bank ING Vysya Bank HDFC Bank IndusInd Bank
Net interest income (Rs. Crs) 1,143 6,321 985 10,055 1,135
Net profit (Rs. Crs) 664 3,133 295 3,648 437
EPS (Rs.) 19.37 76.92 24.49 79.29 10.33
Adj BVPS (Rs.) 107 385 197 519 79
Net Interest Margins (NIM) % 2.8% 3.8% 3.1% 4.2% 3.4%
CASA % 10.2% 41.3% 33.7% 50.5% 26.8%
Cost‐income ratio % 36.8% 42.4% 61.4% 46.9% 47.9%
Gross NPA % 0.23% 1.09% 2.66% 1.11% 1.21%
Net NPA % 0.06% 0.29% 0.64% 0.20% 0.36%
Provision coverage ratio % 76.1% 82.7% 76.4% 81.0% 70.3%
Loan‐deposit ratio % 78.9% 79.3% 78.7% 84.0% 81.5%
Return on Equity (RoE) % 21.3% 19.5% 13.4% 19.6% 13.5%
Return on Assets (RoA) % 1.5% 1.5% 0.9% 1.5% 1.5%
P/E (x) 13.99 16.67 12.66 27.25 23.33
P/ABV (x) 2.54 3.33 1.57 4.16 3.05
Capital Adequacy Ratio (CAR) % 18.2% 12.5% 12.7% 16.3% 15.6% Company data, Nirmal Bang Research

Initiating Coverage Yes Bank Ltd
Valuation and Recommendation Yes Bank continues to grow at a healthy pace, while maintaining spreads and asset quality. We remain positive on the bank in the long term owing to the exponential growth in its balance sheet with a diversified fee income and superior return ratios. In addition, with business and CASA expected to improve going forward and scope to improve other income, bank definitely deserves higher valuation multiple compared to its peers. The company has historically traded in the range of 2.5x‐3.0x (as shown in the P/BV Band below) except when market conditions were bad. At CMP of Rs. 271, the stock is trading at 2.01x of its FY12E ABV. Looking at the historical trend and Yes Bank’s growth phase we value it at 2.75x P/ABV of FY 2012E. Based on our estimated book value of Rs.134.7 per share for FY 2012E and P/BV target multiple of 2.75x we arrive at a target price of Rs.370. We recommend BUY on the stock with target price of Rs.370 indicating a potential upside of 37%.
0
100
200
300
400
500
Mar‐06 Dec‐06 Oct‐07 Jul‐08 Apr‐09 Jan‐10 Oct‐10
P/BV ‐ Forward
Yes Bank PBV 1.5 PBV 2.0 PBV 2.5 PBV 3.0 PBV 3.5
Source: Company data, Nirmal Bang Research

Initiating Coverage Yes Bank Ltd
Financials Profitability (Rs. Crs) FY 2010 FY 2011E FY 2012E FY 2013E Balance Sheet (Rs. Crs) FY 2010 FY 2011E FY 2012E FY 2013E
Interest earned 2,370 4,139 6,394 8,526 Deposits 26,799 44,161 62,447 79,962
Interest expended 1,582 2,909 4,749 6,290 (of which CASA) (2,818) (4,968) (8,056) (11,355)
Net interest income 788 1,229 1,645 2,236 Borrowings 4,749 6,271 7,356 8,473
Non interest income 576 626 874 1,163 Other liab and prov 1,745 1,920 2,112 2,323
Total income 1,363 1,855 2,519 3,399 Total liabilities 33,293 52,352 71,915 90,759
Operating expenses 500 686 951 1,303 Equity Share Capital 340 340 340 340
Staff costs 257 360 516 739 Reserves and Surplus 2,750 3,407 4,267 5,444
Other Op Exp 243 326 435 564 Net worth 3,090 3,747 4,607 5,784
Operating profit 863 1,169 1,568 2,096 Total liab and equity 36,383 56,099 76,521 96,542
Provisions 137 92 164 189 Cash and bank bal 2,673 3,418 3,683 4,739
Profit before tax 726 1,077 1,404 1,907 Investments 10,210 15,730 21,642 27,138
Taxes 249 359 463 629 Advances 22,193 35,562 49,724 63,111
Net profit 478 718 941 1,278 Fixed assets 115 139 159 175Earnings per share 14.9 20.0 26.0 35.3 Other assets 1,191 1,250 1,313 1,378
Quarterly (Rs. Crs) Mar. 10 June. 10 Sept. 10 Dec. 10 Total assets 36,383 56,099 76,521 96,542
Net interest income 244 262 313 323 Key Ratios FY 2010 FY 2011E FY 2012E FY 2013E
Non interest income 160 144 131 162 Yield Ratios
Total income 404 406 444 485 Avg Yield on Assets 8.6% 9.4% 10.0% 10.2%
Operating expenses 147 157 163 174 Yield on Advances 10.2% 10.7% 11.4% 11.5%
Operating profit 258 249 281 311 Yield on Investments 6.8% 7.8% 8.0% 8.1%
Provisions 43 13 17 25 Cost of Int Bearing Liab 6.2% 7.1% 7.9% 8.0%
Profit before tax 215 236 264 286 Cost of Deposits 5.6% 6.7% 7.7% 7.8%
Taxes 75 80 88 95 Net Interest Spread 2.4% 2.3% 2.1% 2.2%
Net profit 140 156 176 191 NIM 2.9% 2.8% 2.6% 2.7%
Earnings per share 4.1 4.4 4.9 5.3 Balance Sheet Ratios
Valuation Ratios FY 2010 FY 2011E FY 2012E FY 2013E Gross NPA 0.27% 0.35% 0.39% 0.45%
P/BV 2.98 2.46 2.00 1.59 Net NPA 0.06% 0.07% 0.09% 0.11%
P/ABV 2.99 2.47 2.01 1.60 Return on Assets 1.6% 1.6% 1.4% 1.5%P/E 18.22 13.55 10.42 7.67 CASA 10.5% 11.3% 12.9% 14.2%
Profitability Ratios FY 2010 FY 2011E FY 2012E FY 2013E Loan‐deposit ratio 82.8% 80.5% 79.6% 78.9%
Cost / Income Ratio 36.7% 37.0% 37.7% 38.3% CAR 20.6% 16.9% 14.9% 13.9%Net profit margin 35.0% 38.7% 37.3% 37.6% Provision cov ratio 78.4% 80.0% 76.0% 76.0%
RONW 20.3% 21.0% 22.5% 24.6% Per Share Data FY 2010 FY 2011E FY 2012E FY 2013E
Growth Ratios FY 2010 FY 2011E FY 2012E FY 2013E EPS 14.87 20.00 26.00 35.31
Advances Growth 78.9% 60.2% 39.8% 26.9% BVPS 90.96 110.31 135.61 170.26
Deposit Growth 65.7% 64.8% 41.4% 28.0% Adjusted BVPS 90.70 109.82 134.70 168.91
NII Growth 54.7% 56.0% 33.8% 36.0% Dividend Per Share 1.50 1.50 2.00 2.50
PAT Growth 57.2% 50.4% 31.0% 35.8% Dividend yield 0.8% 0.5% 0.7% 0.9% Source: Company data, Nirmal Bang Research
Initiating Coverage Yes Bank Ltd
NOTE
DisclaimerThis Document has been prepared by Nirmal Bang Research (Nirmal Bang Securities PVT LTD).The information, analysis and estimates contained herein are based on Nirmal Bang Research assessment and have been obtained from sources believed to be reliable. This document is meant for the use of the intended recipient only. This document, at best, represents Nirmal Bang Research opinion and is meant for general information only. Nirmal Bang Research, its directors, officers or employees shall not in anyway be responsible for the contents stated herein. Nirmal Bang Research expressly disclaims any and all liabilities that may arise from information, errors or omissions in this connection. This document is not to be considered as an offer to sell or a solicitation to buy any securities. Nirmal Bang Research, its affiliates and their employees may from time to time hold positions in securities referred to herein. Nirmal Bang Research or its affiliates may from time to time solicit from or perform investment banking or other services for any company mentioned in this document.