zn: 4 5 wt%
TRANSCRIPT
○Taka-aki Hatano1, Kazuaki Tsuchiya1, Yohei Goto1, Shuji Owad2*,
Atsumi Takasugi3, Yoshifumi Kato4, Teddy Funakoshi5, Hideaki Tannno6, and Hiroyuki Yamazaki7 1. Department of Earth, Resources and Environmental Engineering, Graduate School of Creative Science and Engineering, Waseda University, Japan
2. Faculty of Science and Engineering, Waseda University, Japan
3. Japan Aluminium Association
4. EarthTechnica Co., Ltd.
5. Pony Industry Co., Ltd.
6. Eriez Magnetics Japan Co., Ltd.
7. LIXIL Corporation
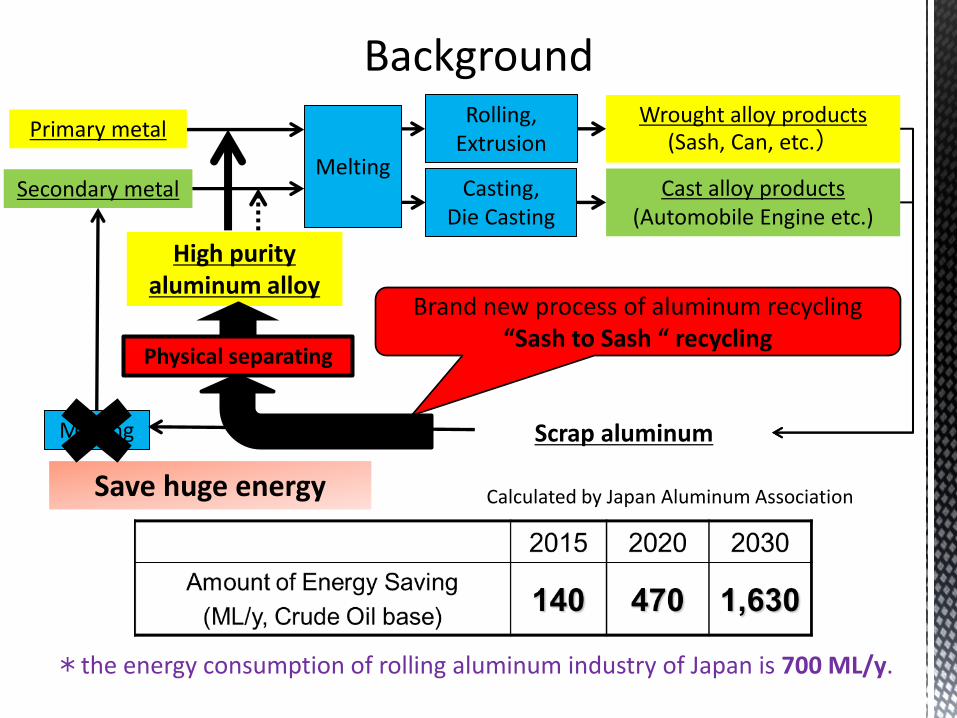
Secondary metal Melting
Rolling, Extrusion
Casting, Die Casting
Wrought alloy products (Sash, Can, etc.)
Cast alloy products (Automobile Engine etc.)
Scrap aluminum Melting
Primary metal
Brand new process of aluminum recycling “Sash to Sash “ recycling
Physical separating
High purity aluminum alloy
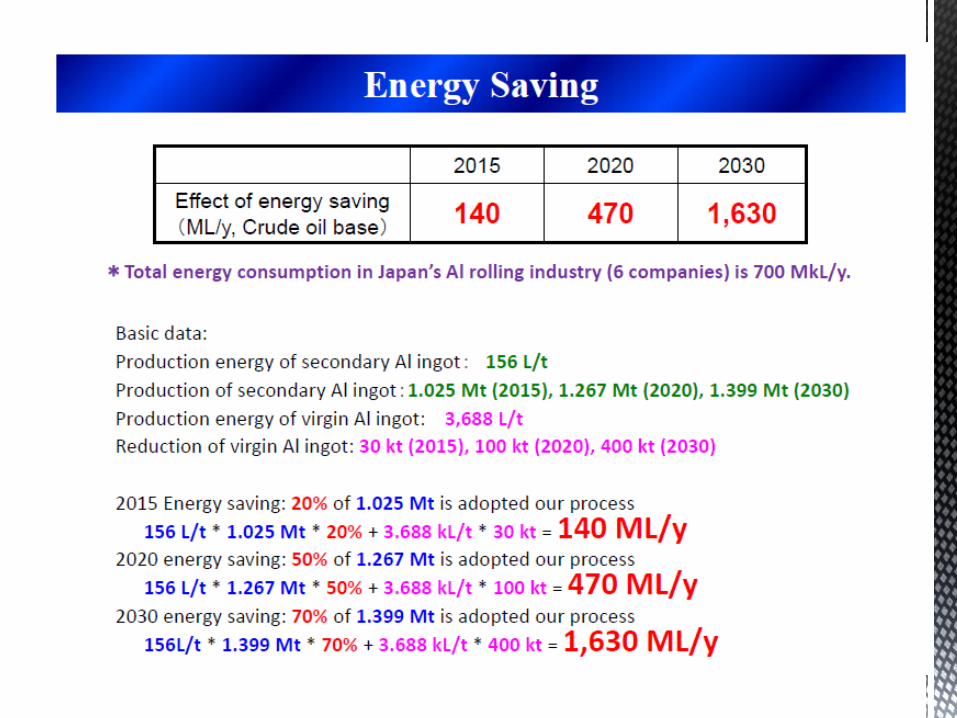
Calculated by Japan Aluminum Association
*the energy consumption of rolling aluminum industry of Japan is 700 ML/y.
Save huge energy
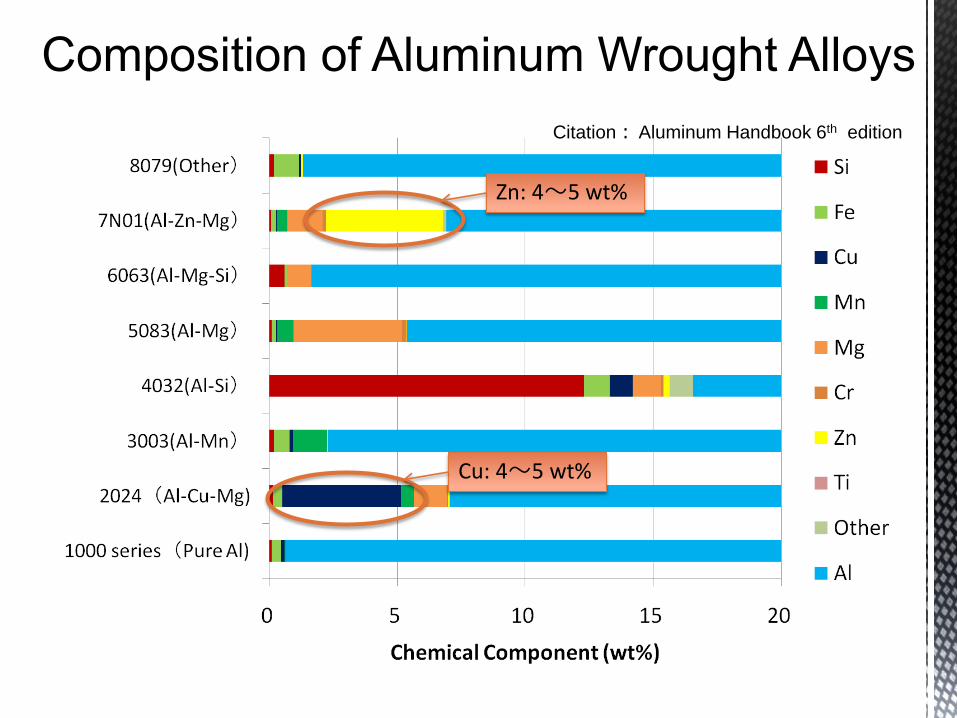
Citation: Aluminum Handbook 6th edition
Zn: 4~5 wt%
Cu: 4~5 wt%
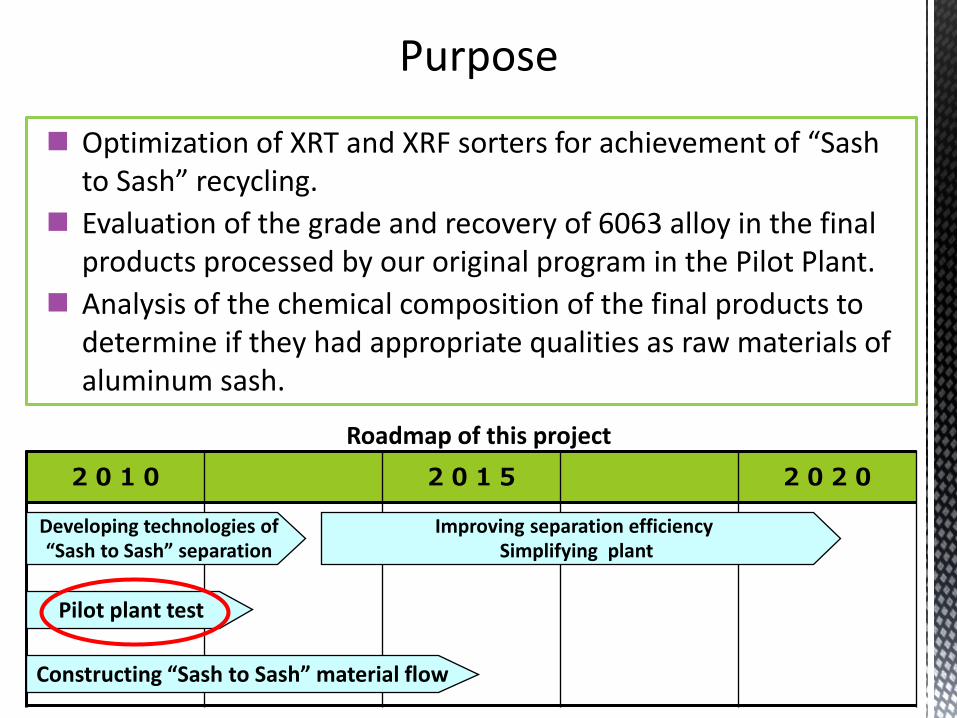
Optimization of XRT and XRF sorters for achievement of “Sash to Sash” recycling.
Evaluation of the grade and recovery of 6063 alloy in the final products processed by our original program in the Pilot Plant.
Analysis of the chemical composition of the final products to determine if they had appropriate qualities as raw materials of aluminum sash.
2010 2015 2020
Developing technologies of “Sash to Sash” separation
Pilot plant test
Constructing “Sash to Sash” material flow
Improving separation efficiency Simplifying plant
Roadmap of this project
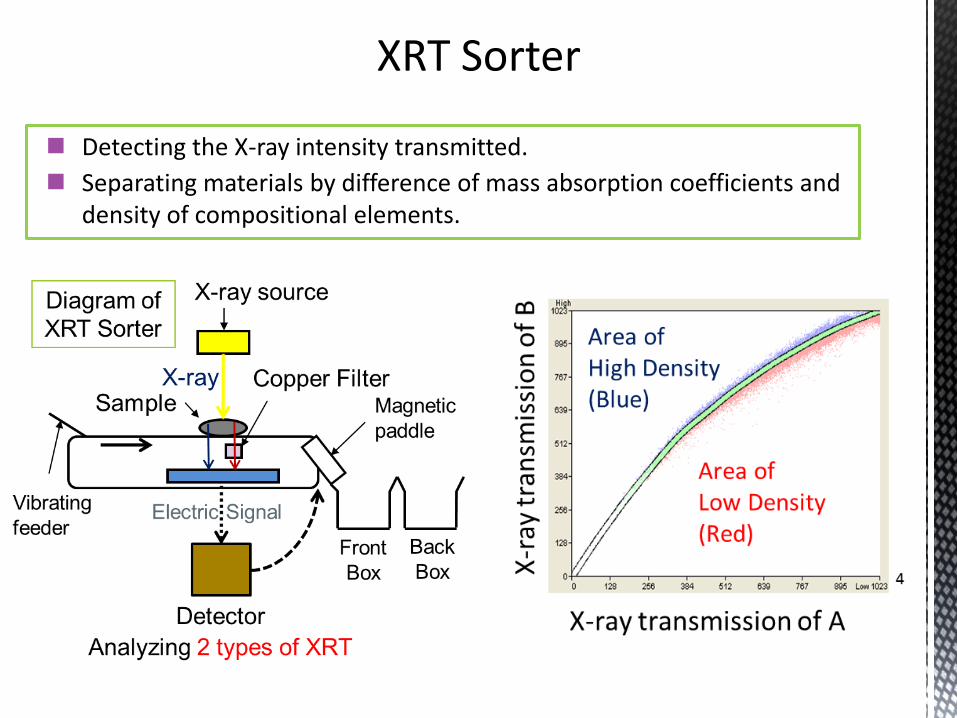
Detecting the X-ray intensity transmitted.
Separating materials by difference of mass absorption coefficients and density of compositional elements.
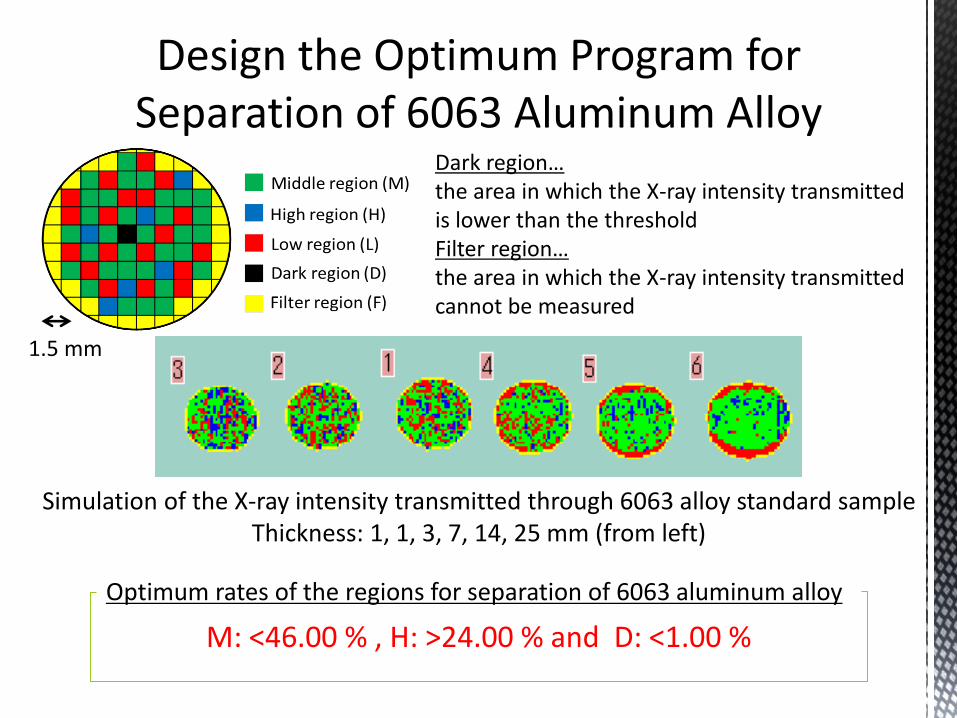
Simulation of the X-ray intensity transmitted through 6063 alloy standard sample Thickness: 1, 1, 3, 7, 14, 25 mm (from left)
Dark region… the area in which the X-ray intensity transmitted is lower than the threshold Filter region… the area in which the X-ray intensity transmitted cannot be measured
Optimum rates of the regions for separation of 6063 aluminum alloy
M: <46.00 % , H: >24.00 % and D: <1.00 %
1.5 mm
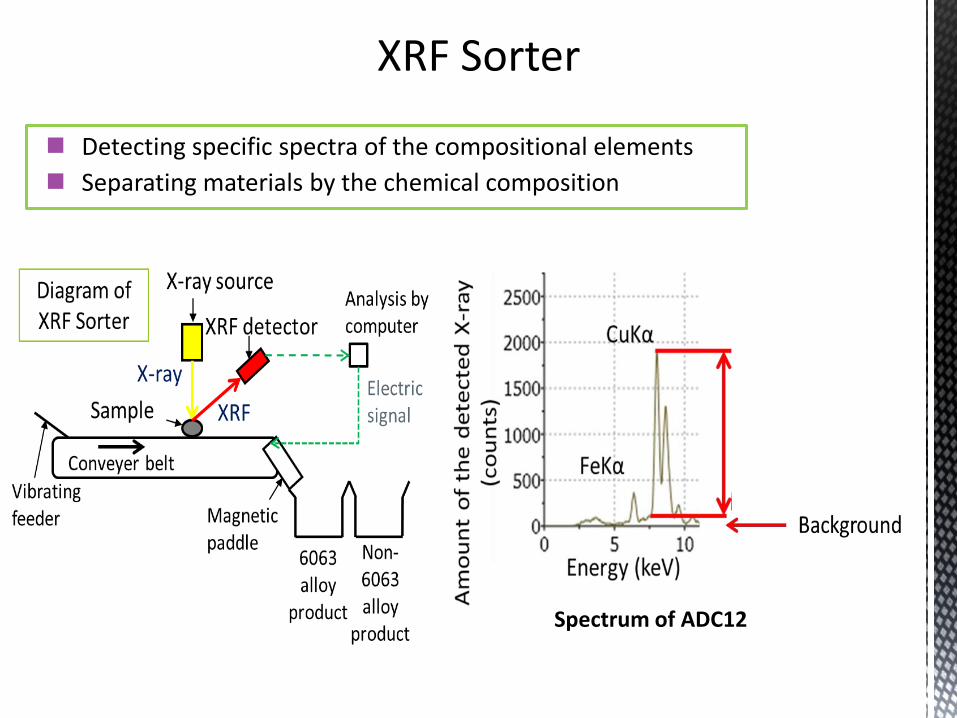
Detecting specific spectra of the compositional elements
Separating materials by the chemical composition
Spectrum of ADC12
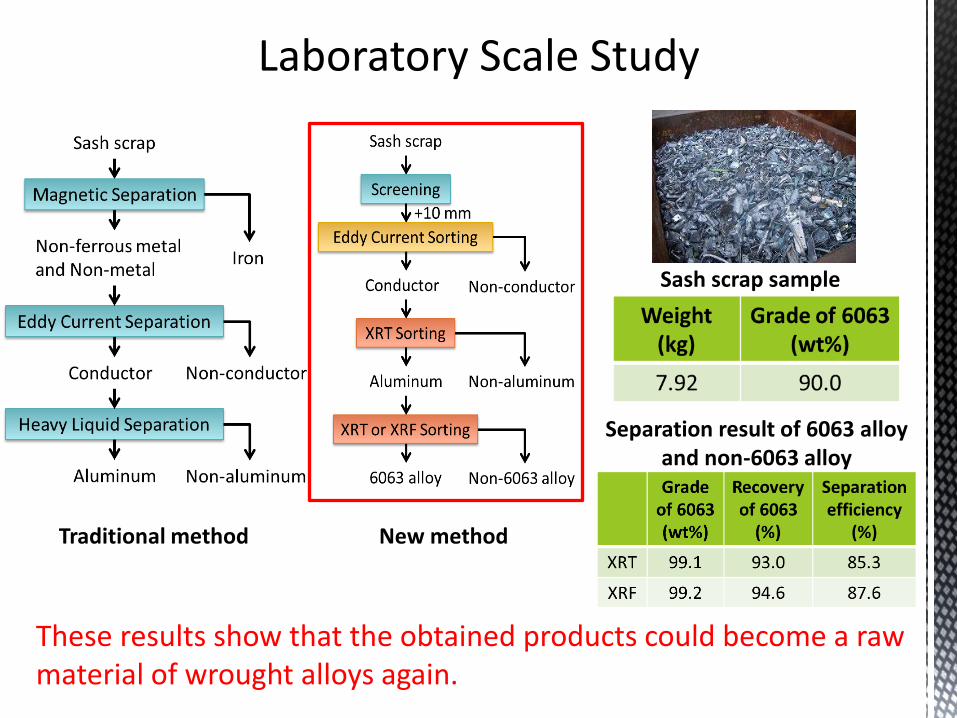
Traditional method New method
These results show that the obtained products could become a raw material of wrought alloys again.
Sash scrap sample
Separation result of 6063 alloy and non-6063 alloy
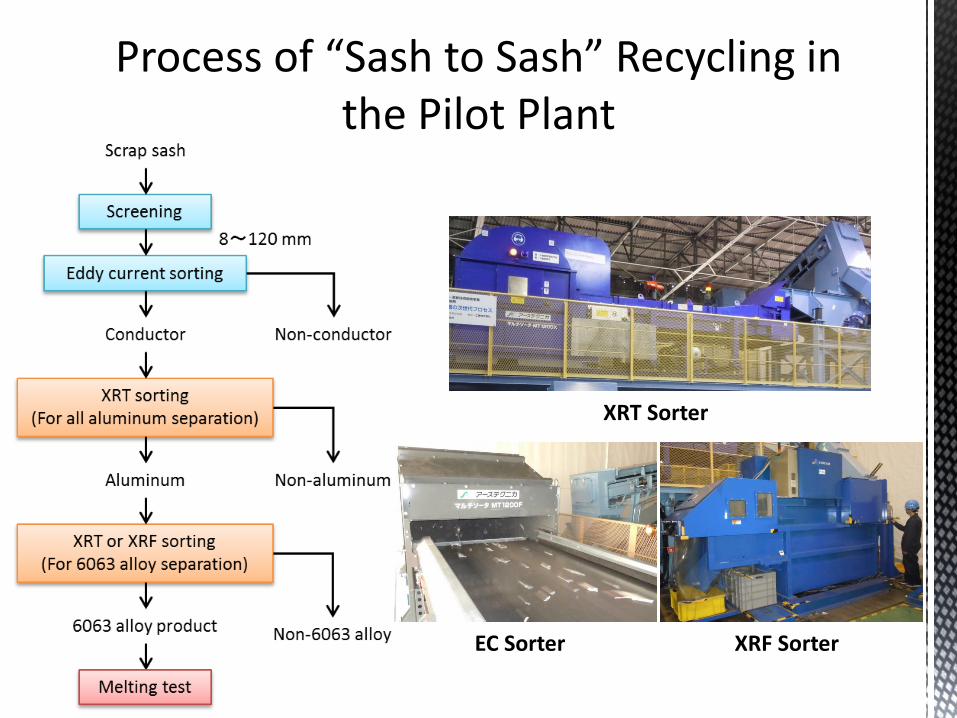
XRT Sorter
XRF Sorter EC Sorter
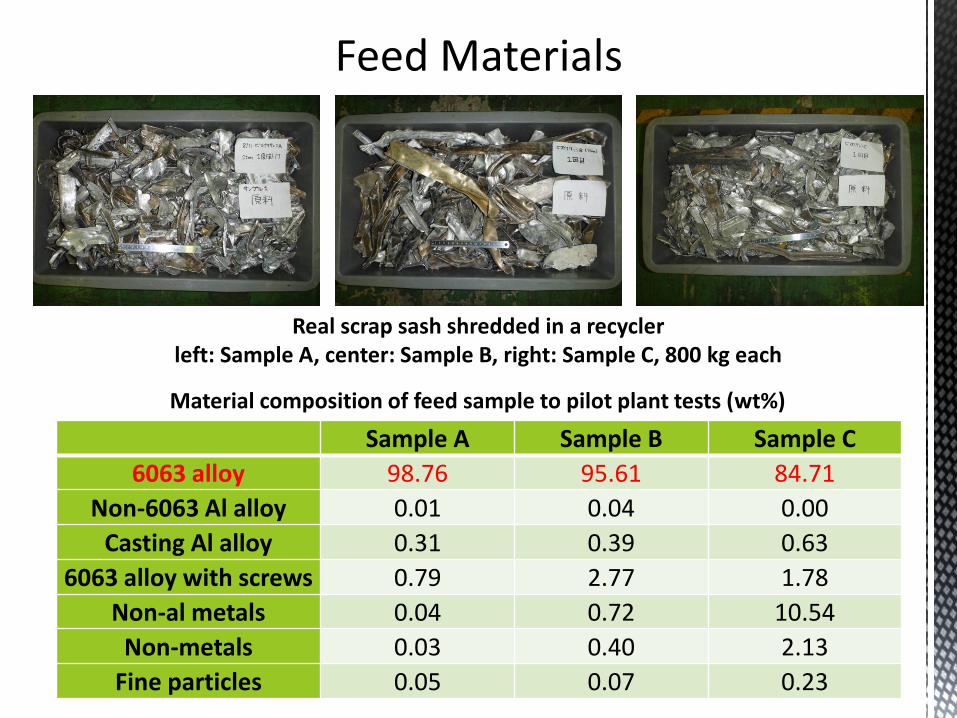
Real scrap sash shredded in a recycler left: Sample A, center: Sample B, right: Sample C, 800 kg each
Sample A Sample B Sample C
6063 alloy 98.76 95.61 84.71
Non-6063 Al alloy 0.01 0.04 0.00
Casting Al alloy 0.31 0.39 0.63
6063 alloy with screws 0.79 2.77 1.78
Non-al metals 0.04 0.72 10.54
Non-metals 0.03 0.40 2.13
Fine particles 0.05 0.07 0.23
Material composition of feed sample to pilot plant tests (wt%)
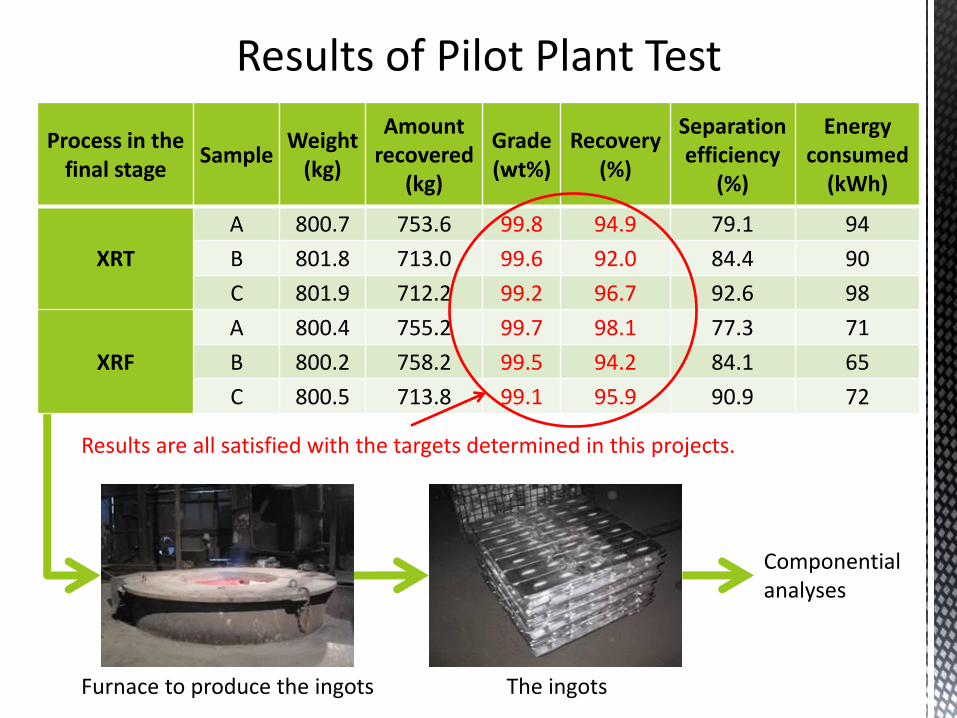
Process in the final stage
Sample Weight
(kg)
Amount recovered
(kg)
Grade (wt%)
Recovery (%)
Separation efficiency
(%)
Energy consumed
(kWh)
XRT
A 800.7 753.6 99.8 94.9 79.1 94
B 801.8 713.0 99.6 92.0 84.4 90
C 801.9 712.2 99.2 96.7 92.6 98
XRF
A 800.4 755.2 99.7 98.1 77.3 71
B 800.2 758.2 99.5 94.2 84.1 65
C 800.5 713.8 99.1 95.9 90.9 72
Results are all satisfied with the targets determined in this projects.
Componential analyses
Furnace to produce the ingots The ingots
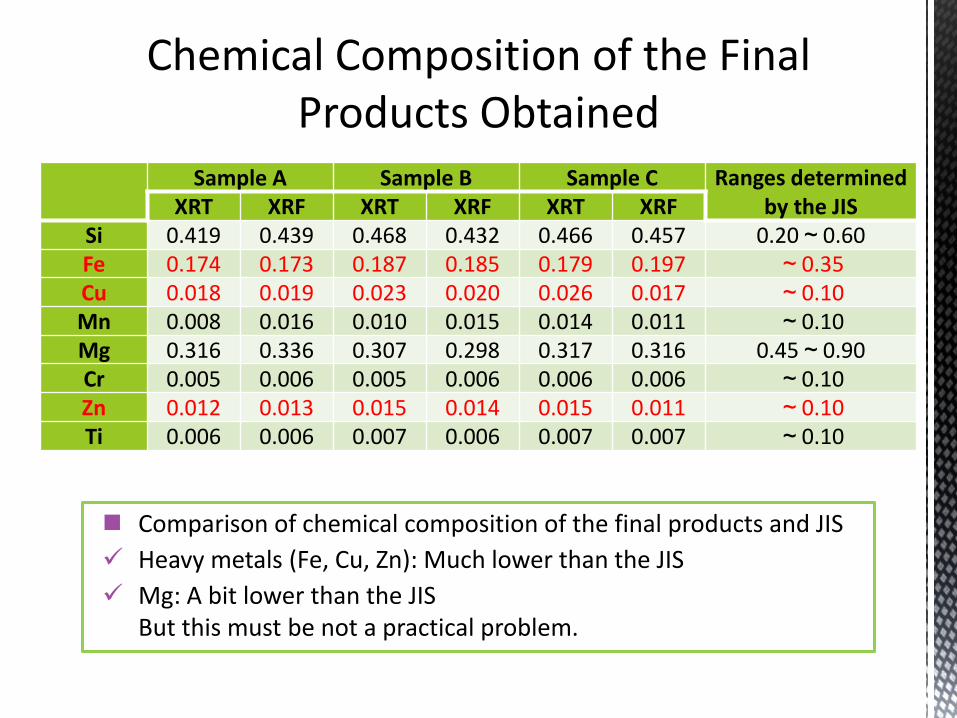
Sample A Sample B Sample C Ranges determined
by the JIS XRT XRF XRT XRF XRT XRF
Si 0.419 0.439 0.468 0.432 0.466 0.457 0.20~0.60
Fe 0.174 0.173 0.187 0.185 0.179 0.197 ~0.35
Cu 0.018 0.019 0.023 0.020 0.026 0.017 ~0.10
Mn 0.008 0.016 0.010 0.015 0.014 0.011 ~0.10
Mg 0.316 0.336 0.307 0.298 0.317 0.316 0.45~0.90
Cr 0.005 0.006 0.005 0.006 0.006 0.006 ~0.10
Zn 0.012 0.013 0.015 0.014 0.015 0.011 ~0.10
Ti 0.006 0.006 0.007 0.006 0.007 0.007 ~0.10
Comparison of chemical composition of the final products and JIS
Heavy metals (Fe, Cu, Zn): Much lower than the JIS
Mg: A bit lower than the JIS But this must be not a practical problem.
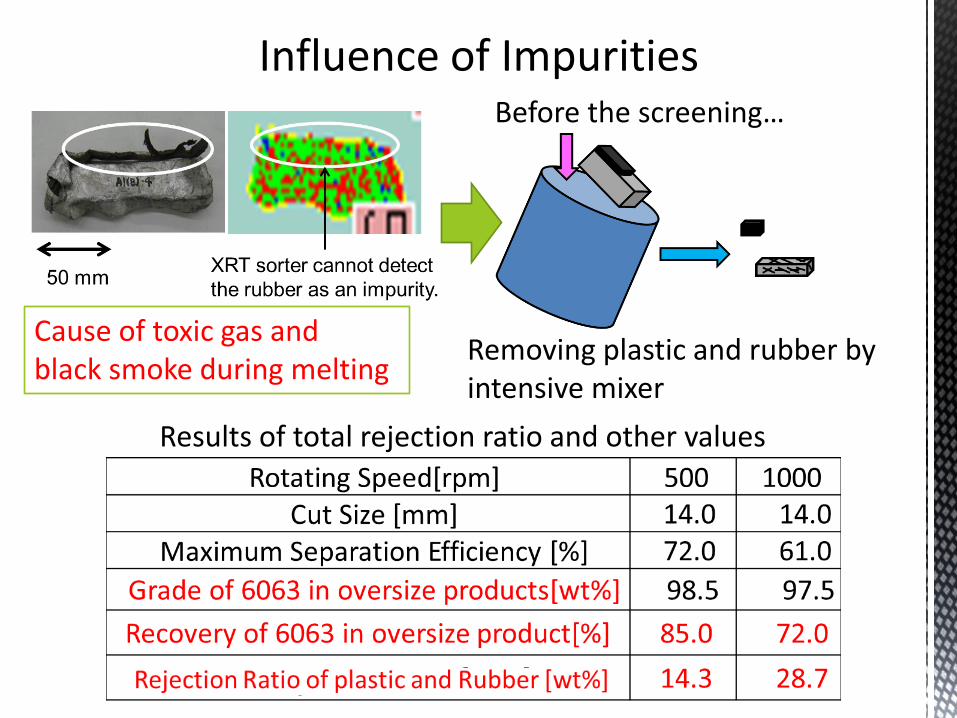
Cause of toxic gas and black smoke during melting
Before the screening…
Removing plastic and rubber by intensive mixer
Results of total rejection ratio and other values
1. We developed a brand new process in pilot plant scale to recover high purity 6063 aluminum alloy from scrap aluminum sash in order to establish “Sash to Sash” recycling.
2. Over 99 wt% grade of 6063 alloy was recovered with the recovery of 92 to 98 % depending on the feed quality, whose results are all satisfied with commercial base standard.
3. The quality of final products obtained was conformed to the JIS standard.

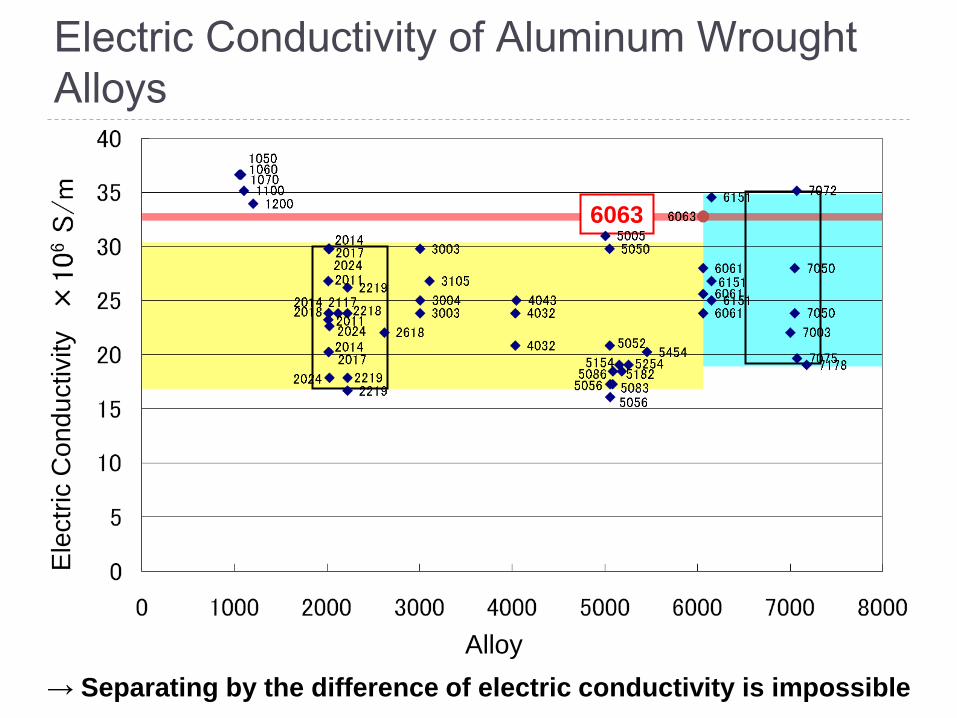
Electric Conductivity of Aluminum Wrought
Alloys
17
6063
→ Separating by the difference of electric conductivity is impossible
Alloy
Ele
ctr
ic C
on
du
ctivity
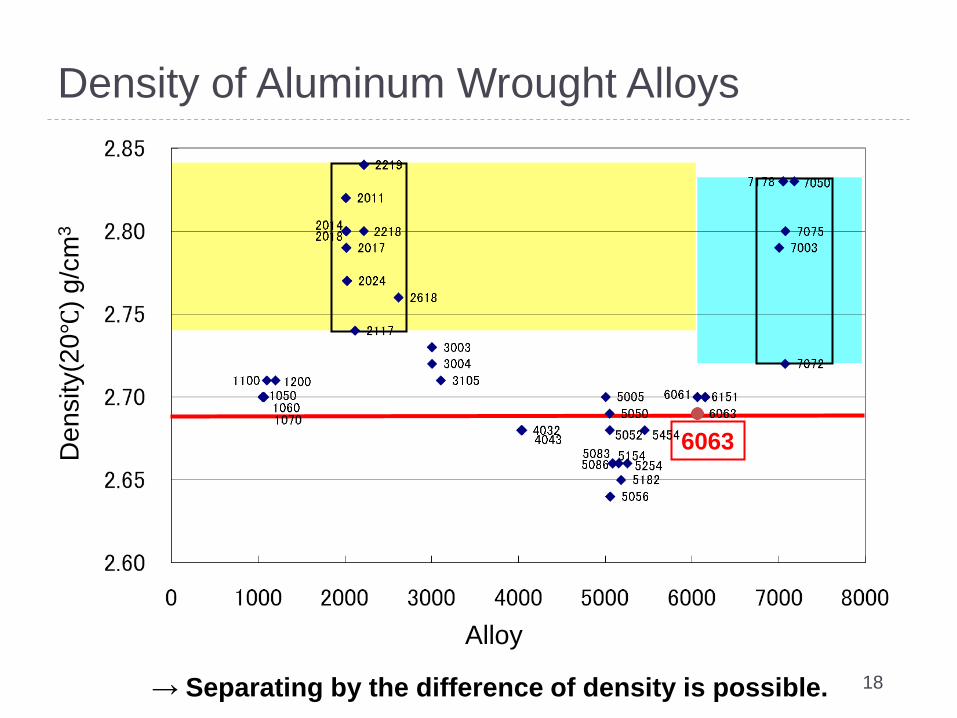
Density of Aluminum Wrought Alloys
18 → Separating by the difference of density is possible.
6063
Alloy
De
nsity(2
0℃
) g
/cm
3
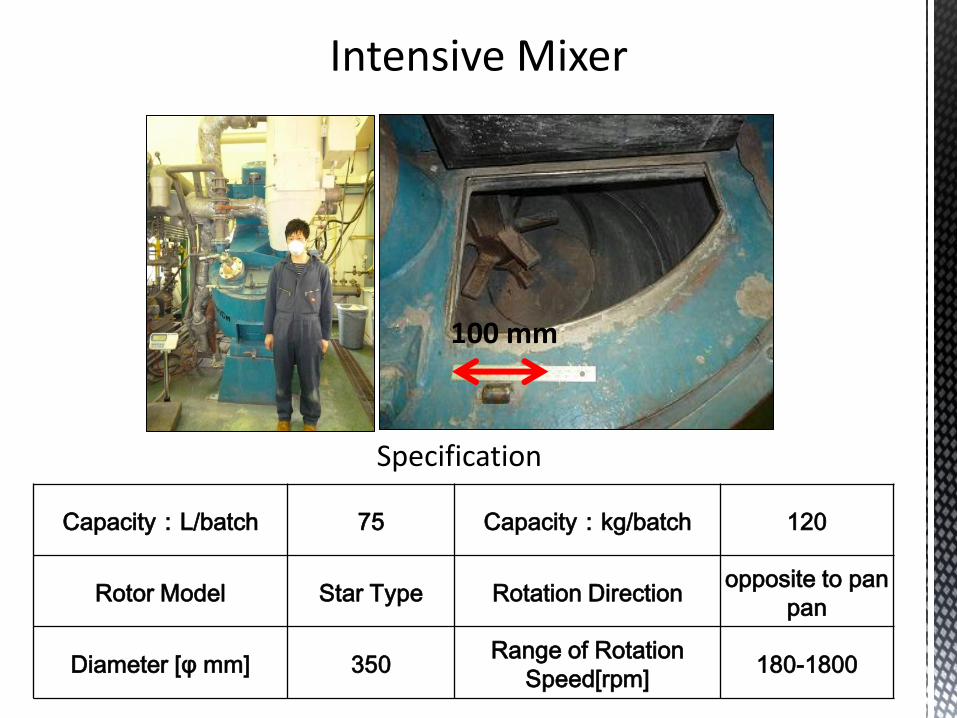
100 mm
Capacity:L/batch 75 Capacity:kg/batch 120
Rotor Model Star Type Rotation Direction opposite to pan
pan
Diameter [φ mm] 350 Range of Rotation
Speed[rpm] 180-1800
Specification
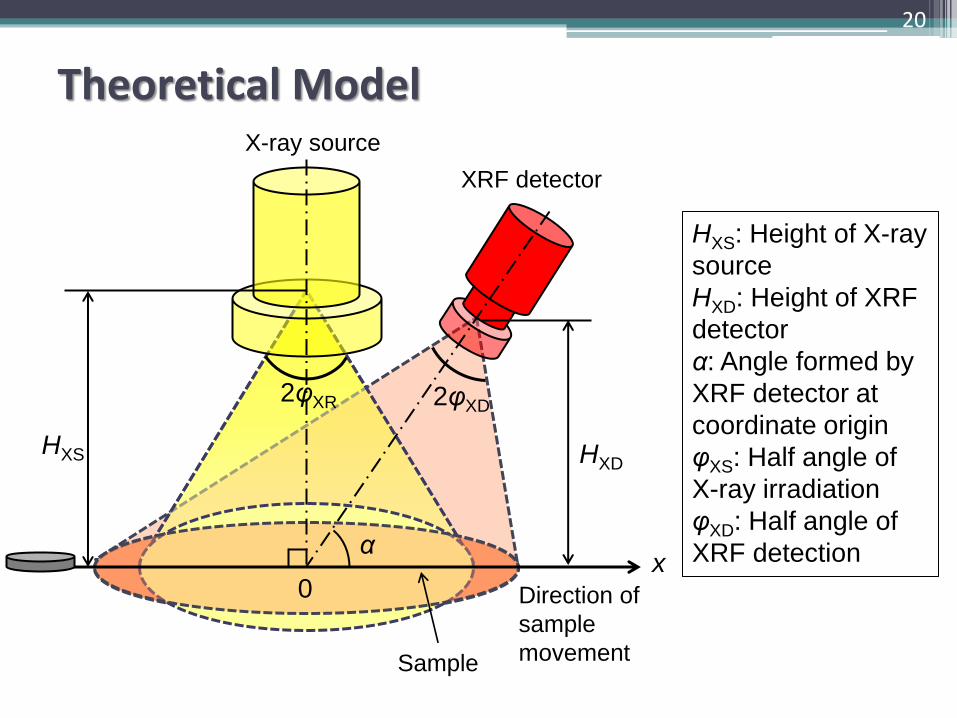
Theoretical Model
20
HXS: Height of X-ray
source
HXD: Height of XRF
detector
α: Angle formed by
XRF detector at
coordinate origin
φXS: Half angle of
X-ray irradiation
φXD: Half angle of
XRF detection
Direction of
sample
movement
HXD HXS
x
2φXD 2φXR
X-ray source
XRF detector
Sample
α
0
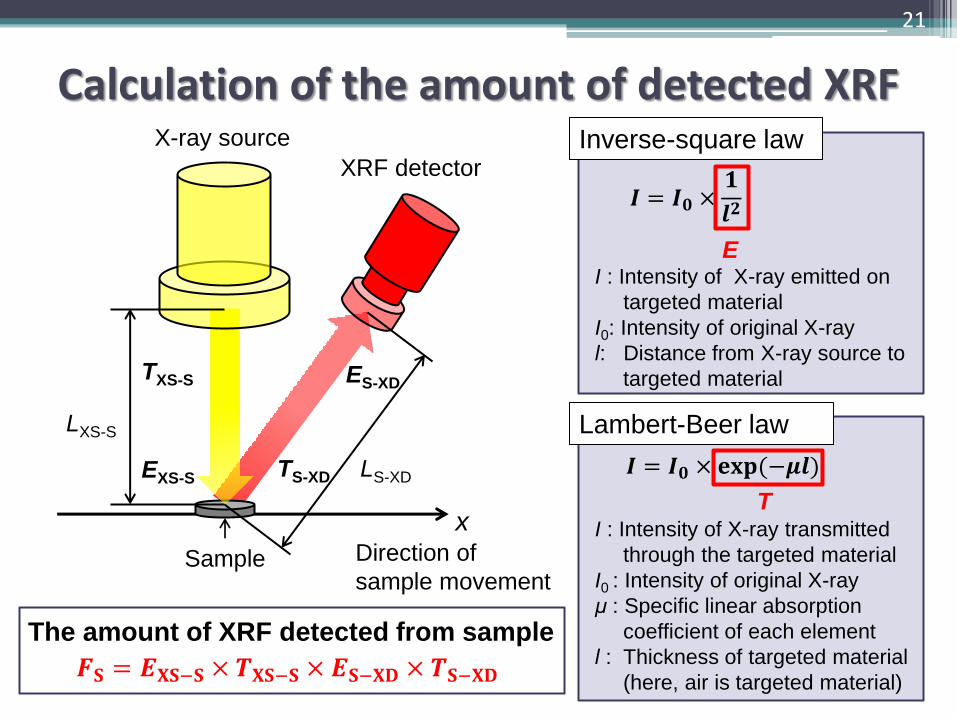
Calculation of the amount of detected XRF
21
Direction of
sample movement
x
X-ray source
XRF detector
EXS-S
ES-XD
LXS-S
LS-XD
Sample
TXS-S
TS-XD
𝑰 = 𝑰𝟎 ×𝟏
𝒍𝟐
Inverse-square law
I : Intensity of X-ray emitted on
targeted material
I0: Intensity of original X-ray
l: Distance from X-ray source to
targeted material
𝑰 = 𝑰𝟎 × 𝐞𝐱𝐩(−𝝁𝒍)
Lambert-Beer law
I : Intensity of X-ray transmitted
through the targeted material
I0 : Intensity of original X-ray
μ : Specific linear absorption
coefficient of each element
l : Thickness of targeted material
(here, air is targeted material)
T
𝑭𝐒 = 𝑬𝐗𝐒−𝐒 × 𝑻𝐗𝐒−𝐒 × 𝑬𝐒−𝐗𝐃 × 𝑻𝐒−𝐗𝐃
The amount of XRF detected from sample
E
0
50
100
150
0 50 100 150 200
FS
-F
B(-
)
HXS, HXD (mm)
Hxd
Hxs
HXD
HXS
0.0
0.5
1.0
1.5
2.0
2.5
3.0
50 100 150 200F
S-
FB
(-)
HXS, HXD (mm)
HXD
HXS
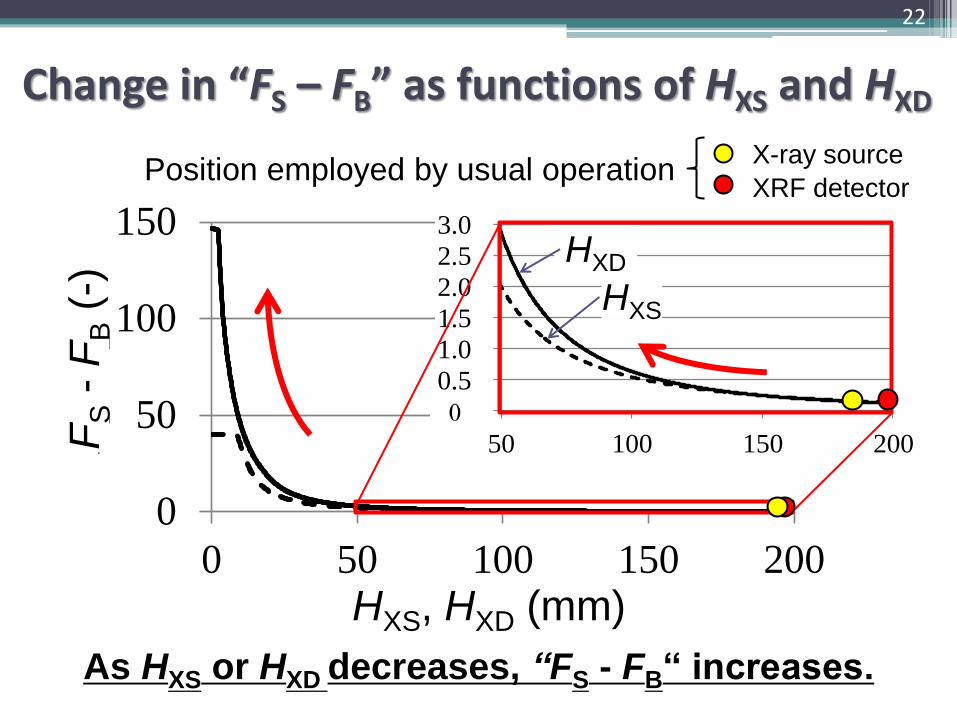
Change in “FS – FB” as functions of HXS and HXD
22
FS -
FB (
-)
HXS, HXD (mm)
As HXS or HXD decreases, “FS - FB“ increases.
Position employed by usual operation X-ray source
XRF detector
0.00
0.05
0.10
0.15
0.20
0 10 20 30 40 50 60 70 80 90
FS
-F
B(-
)
α (° )
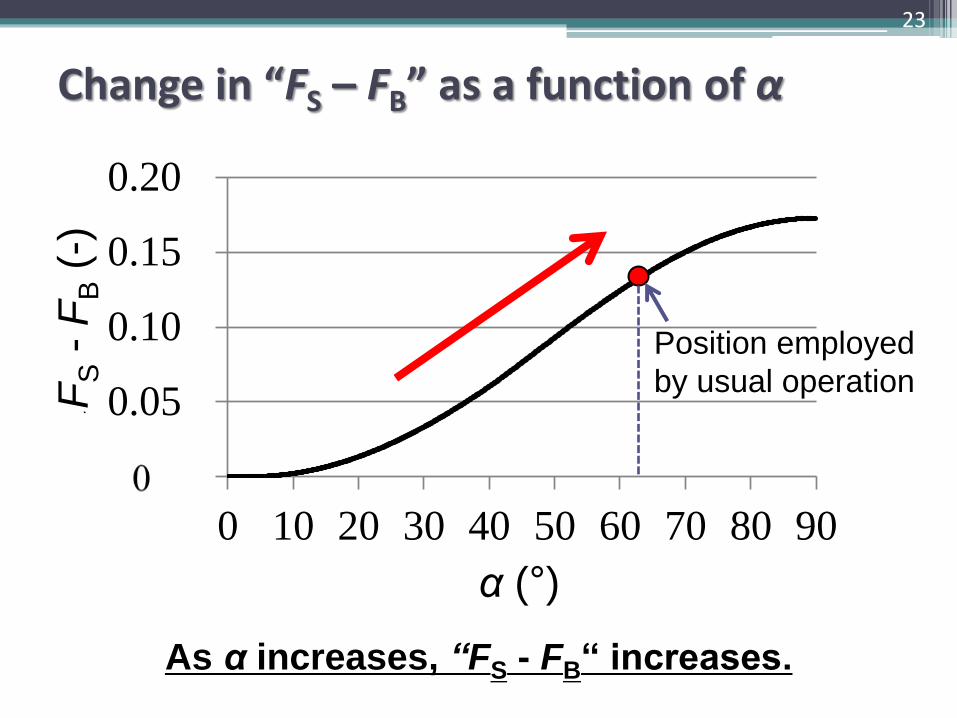
Change in “FS – FB” as a function of α
23
FS -
FB (
-)
α (°)
Position employed
by usual operation
As α increases, “FS - FB“ increases.
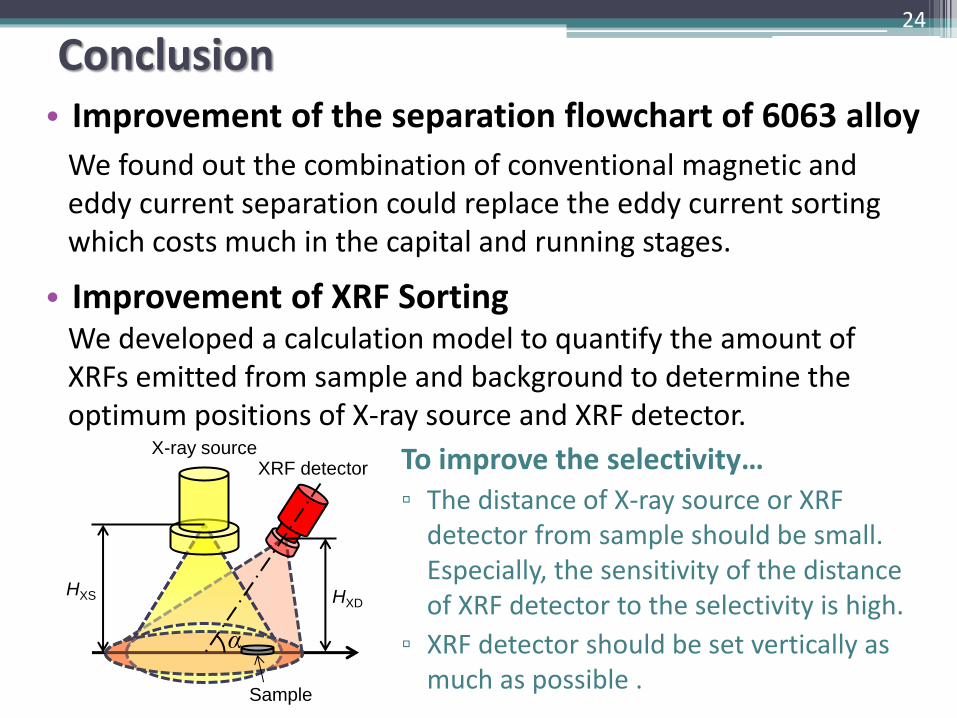
Conclusion • Improvement of the separation flowchart of 6063 alloy
24
• Improvement of XRF Sorting
To improve the selectivity… ▫ The distance of X-ray source or XRF
detector from sample should be small. Especially, the sensitivity of the distance of XRF detector to the selectivity is high.
▫ XRF detector should be set vertically as much as possible .
We found out the combination of conventional magnetic and eddy current separation could replace the eddy current sorting which costs much in the capital and running stages.
X-ray source XRF detector
HXS HXD
α
Sample
α
We developed a calculation model to quantify the amount of XRFs emitted from sample and background to determine the optimum positions of X-ray source and XRF detector.