สไลด์ กลุ่มที่ 15
TRANSCRIPT

Advisor : Assist. Prof. Dr. Chanchai Thongpin Co-advisor : Assist. Prof. Dr. Bussarin Ksapabutr
Researchers : Ms. ChayaneeKasemsook Student ID : 09530074
Mr. Triwat TalbumrungStudent ID : 09530146
Mr. Worawit Sangtean Student ID : 09530379
Present :: 3 April 2014 :: 1

Out line
Introduction
Project Objectives
Project scope
Materials and Experimental
Results and Discussion
Conclusion
Faculty of Engineering and Industrial Technology, Silpakorn UniversityFaculty of Engineering and Industrial Technology, Silpakorn University 2

INTRODUCTION
Faculty of Engineering and Industrial Technology, Silpakorn UniversityFaculty of Engineering and Industrial Technology, Silpakorn University 3
PLA is thermoplastic aliphatic polyester derived from renewable resourceds, such as corn starch.
Polylactic acid, PLA
High stiffness & strength Crystillinity High brittle Low toughness
Main Main propertiepropertiess

INTRODUCTION
Faculty of Engineering and Industrial Technology, Silpakorn UniversityFaculty of Engineering and Industrial Technology, Silpakorn University 4

INTRODUCTION
Faculty of Engineering and Industrial Technology, Silpakorn UniversityFaculty of Engineering and Industrial Technology, Silpakorn University 5
Chemical structure of NBR
NBR, a synthetic rubber which is a copolymer between acrylonitrile (ACN) and butadiene.
Nitrile butadiene
rubber, NBR
High abrasion resistance Low gas permeability Oil and Chemical resistance High thermal aging Poor weather resistance
Main Main propertiepropertiess

INTRODUCTION
Faculty of Engineering and Industrial Technology, Silpakorn UniversityFaculty of Engineering and Industrial Technology, Silpakorn University 6
Vulcanization :: Peroxide vulcanizationAdvantage1)No problem of chemicals bloom.2)Reaction is faster at higher temperatures.3)Resistance deformation of rubber after compression (at high temperatures).4) Heat resistant.
Dicumyl peroxide
Peroxide vulcanization

INTRODUCTION
Faculty of Engineering and Industrial Technology, Silpakorn UniversityFaculty of Engineering and Industrial Technology, Silpakorn University 7
Organo Montmorillonite
Low cost and easy to find.Compatibility with PLA. Reinforcement in rubber and PLA. Improve mechanical and thermal property.
Low cost and easy to find.Compatibility with PLA. Reinforcement in rubber and PLA. Improve mechanical and thermal property.

http://www.nishikawa-rbr.co.jp/english/technology/techno_5423.htm
PLAhttp://www.indiamart.com/unichemimpex/rubber-products.html
NBR & NBR compound
Toughness PLA
INTRODUCTION
Faculty of Engineering and Industrial Technology, Silpakorn UniversityFaculty of Engineering and Industrial Technology, Silpakorn University 8

Project Objectives
1. To investigate mechanical, thermal property and
morphology of PLA/NBR blends and PLA/NBR compounds.
2. The effect of Organic Montmorillonite (OMMT)Cloisite® (30B) on mechanical, thermal property and morphology of PLA/NBR blends and PLA/NBR compounds.
Faculty of Engineering and Industrial Technology, Silpakorn UniversityFaculty of Engineering and Industrial Technology, Silpakorn University 9

Using NBR rubber (acrylonitrile 50%) masticated with two roll mill for 60 min and
PLA (grade 3052 D). Study the effect of NBR content in
PLA/NBR (95:5, 90:10 85:15, 80:20, 75:25 70:30 %w/w) on toughness
of PLA.
In peroxide vulcanization, dicumylperoxide will be used as curing agent.
Using Organo Montmorillonite (OMMT) Cloisite® (30B) added in polymer blends.
Faculty of Engineering and Industrial Technology, Silpakorn UniversityFaculty of Engineering and Industrial Technology, Silpakorn University 10
Project Scope

Materials and Experimental
Faculty of Engineering and Industrial Technology, Silpakorn UniversityFaculty of Engineering and Industrial Technology, Silpakorn University 11

Faculty of Engineering and Industrial Technology, Silpakorn UniversityFaculty of Engineering and Industrial Technology, Silpakorn University 12
1. Polylactic acid (PLA) >> 3052 D from NatureWorks produced
2. Nitrile Butadiene Rubber (NBR)>> 50% acrylonitrile content from LG Chem
3. Dicumylperoxide (DCP)>> from Sigma-Aldrich
4. Organic Montmorillonite (OMMT)>> Cloisite®30B from ROCKWOOD ADDITIVE
Materials

Faculty of Engineering and Industrial Technology, Silpakorn UniversityFaculty of Engineering and Industrial Technology, Silpakorn University 13
Universal testingMachine
Universal testingMachine
Differential scanning calorimetry (DSC)
Differential scanning calorimetry (DSC)
Thermo gravimetric Analyzer (TGA)
Thermo gravimetric Analyzer (TGA)
Scanning electron microscopy (SEM)Scanning electron microscopy (SEM)
Prepare samples by Compression
molding 170 oC pressure 1000 psi
Prepare samples by Compression
molding 170 oC pressure 1000 psi
Part IPart I Study PLA/NBR BlendsStudy PLA/NBR Blends Preparation of NBR blends.
Masticate NBR by two roll mill for 60 min
ratio of PLA: NBR (95:5, 90:10, 85:15, 80:20 ,75:25, and 70:30)
Preparation of NBR blends.
Masticate NBR by two roll mill for 60 min
ratio of PLA: NBR (95:5, 90:10, 85:15, 80:20 ,75:25, and 70:30)
Preparation of PLA.
PLA dried at 50°C for 24
hours
Preparation of PLA.
PLA dried at 50°C for 24
hours
Experimental
Mix in internal mixer
at 170oC 70 rpm
Mix in internal mixer
at 170oC 70 rpm
Testing
Testing

Faculty of Engineering and Industrial Technology, Silpakorn UniversityFaculty of Engineering and Industrial Technology, Silpakorn University
Experimental
Universal testingMachine
Universal testingMachine
Differential scanning calorimetry (DSC)
Differential scanning calorimetry (DSC)
Thermo gravimetric Analyzer (TGA)
Thermo gravimetric Analyzer (TGA)
Scanning electron microscopy (SEM)Scanning electron microscopy (SEM)
Prepare samples by Compression
molding 170 oC pressure 1000 psi
Prepare samples by Compression
molding 170 oC pressure 1000 psi
Testing
Testing
Preparation of NBR blends.
Masticate NBR by two roll mill for 60 min
ratio of PLA: NBR (95:5, 90:10, 85:15, 80:20 ,75:25, and 70:30)
Preparation of NBR blends.
Masticate NBR by two roll mill for 60 min
ratio of PLA: NBR (95:5, 90:10, 85:15, 80:20 ,75:25, and 70:30)
Preparation of PLA.
PLA dried at 50 °C for 24 hours
Preparation of PLA.
PLA dried at 50 °C for 24 hours Mix in
internal mixer
at 170oC 70 rpm
Mix in internal mixer
at 170oC 70 rpm
Part IIPart II Study PLA/NBR CompoundStudy PLA/NBR Compound
14
Dicumyl peroxide (DCP) 1 phr
Dicumyl peroxide (DCP) 1 phr

Faculty of Engineering and Industrial Technology, Silpakorn UniversityFaculty of Engineering and Industrial Technology, Silpakorn University
Universal testingMachine
Universal testingMachine
Differential scanning calorimetry (DSC)
Differential scanning calorimetry (DSC)
Thermo gravimetric Analyzer (TGA)
Thermo gravimetric Analyzer (TGA)
Scanning electron microscopy (SEM)Scanning electron microscopy (SEM)
Prepare samples by Compression
molding 170 oC pressure 1000 psi
Prepare samples by Compression
molding 170 oC pressure 1000 psi
Select appropriate ratio for PLA/NBR
blends and PLA/NBR
compounds
Select appropriate ratio for PLA/NBR
blends and PLA/NBR
compounds Mix in internal mixer
at 170oC 70 rpm
Mix in internal mixer
at 170oC 70 rpm
Testing
Testing
Experimental
XRDXRD
15
Part IIIPart III Study the effect of clay on properties of PLA/NBR blends and PLA/NBR compoundsStudy the effect of clay on properties of PLA/NBR blends and PLA/NBR compounds
Cloisite®30B

Faculty of Engineering and Industrial Technology, Silpakorn UniversityFaculty of Engineering and Industrial Technology, Silpakorn University
Results and Discussion
16

Faculty of Engineering and Industrial Technology, Silpakorn UniversityFaculty of Engineering and Industrial Technology, Silpakorn University 17
PART IPART IMorphology of
PLA/NBR Blends
Figure 1 Morphology of PLA/NBR blends in 5, 10, 15, 20, 25 and 30% NBR
NBR 20
NBR 30
NBR 5
NBR 10
NBR 15
NBR 20
NBR 25
NBR 30

Faculty of Engineering and Industrial Technology, Silpakorn UniversityFaculty of Engineering and Industrial Technology, Silpakorn University 18
Figure 2 DSC Thermogram of neat PLA and PLA/NBR blends in first heating
PART IPART I Thermal properties of PLA/NBR Blends
Crystallization
1 st Heat
TgTcc Tm 160.5
7159.0
3160.06
159.05
159.05
159.00159.05160.02
149.57150.02
150.54
155.40148.50
150.58
148.42
149.57

Faculty of Engineering and Industrial Technology, Silpakorn UniversityFaculty of Engineering and Industrial Technology, Silpakorn University 19
PART IPART I Thermal properties of PLA/NBR Blends
Crystallization
Table 1 Crystallization behavior of PLA/NBR blends in different weight contents of NBR and pure PLA in first heating

Faculty of Engineering and Industrial Technology, Silpakorn UniversityFaculty of Engineering and Industrial Technology, Silpakorn University 20
Figure 3 DSC Thremogram of neat PLA and PLA/NBR blends in first heating
PART IPART I Thermal properties of PLA/NBR Blends
Crystallization
2nd Heat Tg
Tcc Tm
15
95.115
94
9
16
02.1
15
96.5
16
00.1
159.56159.60160.06
15
05.815
06.3
15
16.3
15
16.8
14
96.115
11.3
15
05.8
15
06.3

PART IPART I Thermal properties of PLA/NBR Blends
Crystallization
Table 2 Crystallization behavior of PLA/NBR blends in different weight contents of NBR and pure PLA in second heating
Faculty of Engineering and Industrial Technology, Silpakorn UniversityFaculty of Engineering and Industrial Technology, Silpakorn University 21

PART IPART I Thermal properties of PLA/NBR Blends
Degradation
Figure 4 TGA Thermogram of neat PLA and PLA/NBR blends
Faculty of Engineering and Industrial Technology, Silpakorn UniversityFaculty of Engineering and Industrial Technology, Silpakorn University 22
Virgin PLANeat PLA
PLA95/NBR5
PLA90/NBR10
PLA85/NBR15
PLA80/NBR20
PLA75/NBR25
PLA70/NBR30
Faculty of Engineering and Industrial Technology, Silpakorn UniversityFaculty of Engineering and Industrial Technology, Silpakorn University 23
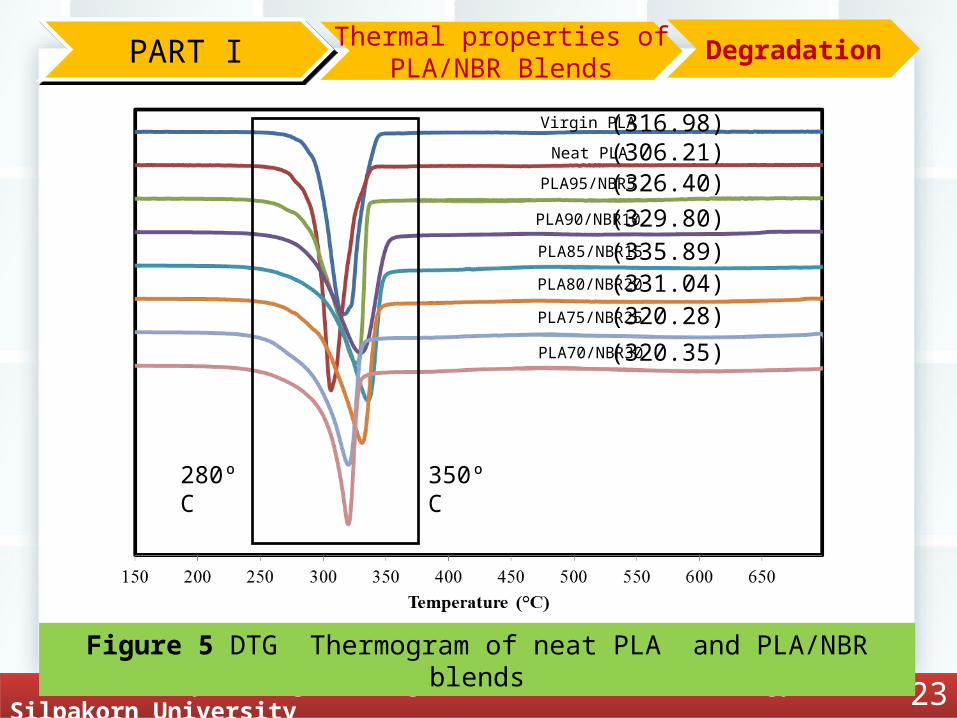
PART IPART I Thermal properties of PLA/NBR Blends
Degradation
Figure 5 DTG Thermogram of neat PLA and PLA/NBR blends
Virgin PLA
Neat PLA
PLA95/NBR5
PLA90/NBR10
PLA85/NBR15
PLA80/NBR20
PLA75/NBR25
PLA70/NBR30
280ºC 350ºC
(316.98)(306.21)(326.40)
(329.80)(335.89)(331.04)(320.28)
(320.35)

Faculty of Engineering and Industrial Technology, Silpakorn UniversityFaculty of Engineering and Industrial Technology, Silpakorn University 24
Formula
Degradation temperature (°C) Peak area
OnsetInflecti
onEnd
At 10% degradatio
n(%)
PLA virgin
294.61 316.98332.1
6298.18 94.24
PLA neat
293.46 306.21324.9
8291.84 94.29
NBR 5 284.74 326.40335.0
2291.26 88.49
NBR 10 288.65 329.80349.9
5294.28 83.07
NBR 15 303.18 335.89346.0
9292.25 74.89
NBR 20 296.64 331.04342.1
3292.26 78.16
NBR 25 292.02 320.28329.0
7280.89 67.35
NBR 30 303.73 320.35327.2
6282.81 61.94
PART IPART I Thermal properties of PLA/NBR Blends
Degradation
Table 3 Degradation data of PLA/NBR blends in different weight contents of NBR and pure PLA by TGA

Faculty of Engineering and Industrial Technology, Silpakorn UniversityFaculty of Engineering and Industrial Technology, Silpakorn University 25
PART IPART I Mechanical properties
Figure 6 Stress-Strain curve of PLA virgin and PLA/NBR blends in different weight content of NBR
PART IPART I Mechanical propertiesStress-Strain
Curve

Faculty of Engineering and Industrial Technology, Silpakorn UniversityFaculty of Engineering and Industrial Technology, Silpakorn University 26
PART IPART I Mechanical propertiesMorphology after Tensile
Testing
NBR 20
NBR 30
Figure 7 Morphology of PLA/NBR blends in 5, 10, 15, 20, 25 and 30% NBR after tensile testing
NBR 5
NBR 20
NBR 25
NBR 30
NBR 5
NBR 10
NBR 15
NBR 20
NBR 30
NBR 25

PART IPART I Mechanical properties Modulus
Figure 8 Modulus of PLA virgin and PLA/NBR blends in different weight content of NBR
Faculty of Engineering and Industrial Technology, Silpakorn UniversityFaculty of Engineering and Industrial Technology, Silpakorn University 27

PART IPART I Mechanical propertiesMaximum
Tensile Strength
Figure 9 Maximum Tensile Strength of PLA virgin and PLA/NBR blends in different weight content of NBR
Faculty of Engineering and Industrial Technology, Silpakorn UniversityFaculty of Engineering and Industrial Technology, Silpakorn University 28

PART IPART I Mechanical properties
Figure 10 Modulus of PLA virgin and PLA/NBR blends in different weight content of NBR
Faculty of Engineering and Industrial Technology, Silpakorn UniversityFaculty of Engineering and Industrial Technology, Silpakorn University 29
% Elongation at Break

Faculty of Engineering and Industrial Technology, Silpakorn UniversityFaculty of Engineering and Industrial Technology, Silpakorn University 30
PART IIPART II Morphology of PLA/NBR compounds
Figure 11 Morphology of PLA/NBR compounds in 5, 10, 15, 20, 25 and 30% NBR
NBR 5
NBR 10
NBR 15
NBR 15
NBR 20
NBR 25
NBR 20
NBR 30

Faculty of Engineering and Industrial Technology, Silpakorn UniversityFaculty of Engineering and Industrial Technology, Silpakorn University 31
Figure 12 DSC Thermogram of neat PLA and PLA/NBR compounds in first heating
PART IIPART II Thermal properties of PLA/NBR Compounds
Crystallization
1 st Heat
Tg
Tcc Tm160.5
7159.0
31589.5
15
90.1
15
89.0
15
89.0
15
84
215
89.1
147.97148.44
148.42
148.50
155.40
14
95.8148.52
149.55

Faculty of Engineering and Industrial Technology, Silpakorn UniversityFaculty of Engineering and Industrial Technology, Silpakorn University 32
PART IIPART II Thermal properties of PLA/NBR Compounds
Crystallization
Table 4 Crystallization behavior of PLA/NBR compounds in different weight contents of NBR and pure PLA in first heating

Faculty of Engineering and Industrial Technology, Silpakorn UniversityFaculty of Engineering and Industrial Technology, Silpakorn University 33
Figure 13 DSC Thermogram of neat PLA and PLA/NBR compounds in first heating
PART IIPART II Thermal properties of PLA/NBR Compounds
Crystallization
2nd Heat Tg
Tcc Tm159.5
1159.4
91596.1
15
94.8
15
95.1
15
89.6
15
90.114
89.6
14
95.3
15
04.814
98.8
149.61
155.40
15
00.315
00.215
00.4

PART IIPART II Thermal properties of PLA/NBR Compounds
Crystallization
Table 5 Crystallization behavior of PLA/NBR compounds in different weight contents of NBR and pure PLA in second heating
Faculty of Engineering and Industrial Technology, Silpakorn UniversityFaculty of Engineering and Industrial Technology, Silpakorn University 34

PART IIPART II Thermal properties of PLA/NBR Compounds
Degradation
Figure 1 4 TGA Thermogram of neat PLA and PLA/NBR compounds
Faculty of Engineering and Industrial Technology, Silpakorn UniversityFaculty of Engineering and Industrial Technology, Silpakorn University 35
Virgin PLA
Neat PLA
PLA95/NBR5
PLA90/NBR10
PLA85/NBR15
PLA80/NBR20
PLA75/NBR25
PLA70/NBR30

Faculty of Engineering and Industrial Technology, Silpakorn UniversityFaculty of Engineering and Industrial Technology, Silpakorn University 36
PART IIPART II Thermal properties of PLA/NBR Compounds
Degradation
Figure 1 5 DTG Thermogram of neat PLA and PLA/NBR compounds
Virgin PLA
Neat PLA
PLA95/NBR5
PLA90/NBR10
PLA85/NBR15
PLA80/NBR20
PLA75/NBR25
PLA70/NBR30
290 - 350ºC
430 - 475 ºC
(316.98)
(306.21)
(340.15)(333.17)(326.32)(331.04)(333.96)(329.50)
Faculty of Engineering and Industrial Technology, Silpakorn UniversityFaculty of Engineering and Industrial Technology, Silpakorn University 37
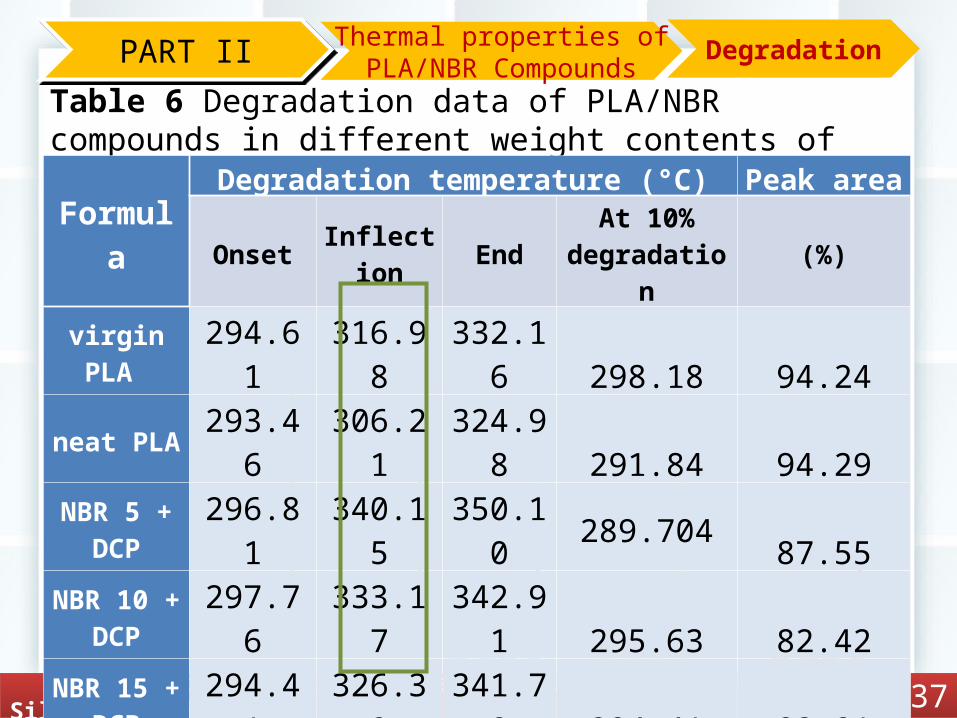
PART IIPART II Thermal properties of PLA/NBR Compounds
Degradation
Table 6 Degradation data of PLA/NBR compounds in different weight contents of NBR and pure PLA by TGA
Formula
Degradation temperature (°C)Peak area
OnsetInflecti
onEnd
At 10% degradatio
n(%)
virgin PLA 294.61 316.98
332.16 298.18 94.24
neat PLA 293.46 306.21
324.98 291.84 94.29
NBR 5 + DCP 296.81 340.15
350.10
289.70487.55
NBR 10 + DCP 297.76 333.17
342.91 295.63 82.42
NBR 15 + DCP 294.41 326.32
341.78 294.41 83.81
NBR 20 + DCP
296.64 331.04342.1
3292.26 78.16
NBR 25 + DCP
304.68 333.96
341.70
291.4269.71
431.89 440.05
472.20 15.80
NBR 30 + DCP
308.95 329.50
335.62
288.6062.57
432.84
439.21
475.84 15.01

Faculty of Engineering and Industrial Technology, Silpakorn UniversityFaculty of Engineering and Industrial Technology, Silpakorn University 38
PART IPART I Mechanical properties
Figure 16 Stress-Strain curve of PLA virgin and PLA/NBR compounds in different weight content of NBR
PART IIPART II Mechanical propertiesStress-Strain
Curve

Faculty of Engineering and Industrial Technology, Silpakorn UniversityFaculty of Engineering and Industrial Technology, Silpakorn University 39
PART IIPART II Mechanical propertiesMorphology after Tensile
Testing
Figure 17 Morphology of PLA/NBR compounds in 5, 10, 15, 20, 25 and 30% NBR after tensile testing
NBR 5
NBR 5
NBR 10
NBR 15
NBR 20
NBR 25
NBR 30

PART IIPART II Mechanical properties Modulus
Figure 18 Modulus of PLA virgin and PLA/NBR compounds in different weight content of NBR
Faculty of Engineering and Industrial Technology, Silpakorn UniversityFaculty of Engineering and Industrial Technology, Silpakorn University 40

PART IIPART II Mechanical propertiesMaximum
Tensile Strength
Figure 19 Maximum Tensile Strength of PLA virgin and PLA/NBR compounds in different weight content of NBRFaculty of Engineering and Industrial Technology, Silpakorn UniversityFaculty of Engineering and Industrial Technology, Silpakorn University 41

PART IIPART II Mechanical properties
Figure 20 Modulus of PLA virgin and PLA/NBR compounds in different weight content of NBR
Faculty of Engineering and Industrial Technology, Silpakorn UniversityFaculty of Engineering and Industrial Technology, Silpakorn University 42
% Elongation at Break

Faculty of Engineering and Industrial Technology, Silpakorn UniversityFaculty of Engineering and Industrial Technology, Silpakorn University 43
PART III.IPART III.I Morphology of PLA/NBR Blends with OMMT
Figure 21 Morphology of PLA/NBR blends in 20, 25 and 30% NBR with OMMT
NBR 20
NBR 25
NBR 30
NBR 20
NBR 25
NBR 30

Faculty of Engineering and Industrial Technology, Silpakorn UniversityFaculty of Engineering and Industrial Technology, Silpakorn University 44
PART III.IPART III.I Morphology of PLA/NBR Blends with OMMT
Figure 22 Morphology of PLA/NBR blends in 20, 25 and 30% NBR with OMMT
5º

Faculty of Engineering and Industrial Technology, Silpakorn UniversityFaculty of Engineering and Industrial Technology, Silpakorn University 45
Figure 23 DSC Thermogram of neat PLA and PLA/NBR blends with OMMT in first heating
PART III.IPART III.I Thermal properties of PLA/NBR Blends
Crystallization
1 st Heat
PLA70/NBR30
TgTcc
Tm160.5
7
159.03
15
8.89
158.00
157.99
148.50
155.40

Faculty of Engineering and Industrial Technology, Silpakorn UniversityFaculty of Engineering and Industrial Technology, Silpakorn University 46
PART III.IPART III.I Thermal properties of PLA/NBR Blends
Crystallization
Table 7 Crystallization behavior of PLA/NBR blends with OMMT in different weight contents of NBR and pure PLA in first heating

Faculty of Engineering and Industrial Technology, Silpakorn UniversityFaculty of Engineering and Industrial Technology, Silpakorn University 47
Figure 24 DSC Thermogram of neat PLA and PLA/NBR blends with OMMT in first heating
PART III.IPART III.I Thermal properties of PLA/NBR Blends
Crystallization
2nd Heat Tg Tcc
Tm
159.51
159.49
159.0515
90.51 5895
14
95.7
149.56
149.57
149.61
151.68

PART III.IPART III.I Thermal properties of PLA/NBR Blends
Crystallization
Table 8 Crystallization behavior of PLA/NBR blends with OMMT in different weight contents of NBR and pure PLA in second heating
Faculty of Engineering and Industrial Technology, Silpakorn UniversityFaculty of Engineering and Industrial Technology, Silpakorn University 48

PART III.IPART III.I Thermal properties of PLA/NBR Blends
Degradation
Figure 2 5 TGA Thermogram of neat PLA and PLA/NBR blends with OMMT
Faculty of Engineering and Industrial Technology, Silpakorn UniversityFaculty of Engineering and Industrial Technology, Silpakorn University 49
PLA75/NBR25

Faculty of Engineering and Industrial Technology, Silpakorn UniversityFaculty of Engineering and Industrial Technology, Silpakorn University 50
PART III.IPART III.I Thermal properties of PLA/NBR Blends
Degradation
Figure 26 DTG Thermogram of neat PLA and PLA/NBR blends with OMMT
300 - 350ºC
400 - 530 ºC
(316.98)
(306.21)
(337.47)
(339.12)
(330.23)

Faculty of Engineering and Industrial Technology, Silpakorn UniversityFaculty of Engineering and Industrial Technology, Silpakorn University 51
PART III.IPART III.I Thermal properties of PLA/NBR Blends
Degradation
Table 9 Degradation data of PLA/NBR blends with OMMT in different weight contents of NBR and pure PLA by TGA
Formula
Degradation temperature (°C)Peak area
OnsetInflecti
onEnd
At 10% degradatio
n(%)
virgin PLA 294.61 316.98
332.16 298.18 94.24
neat PLA 293.46 306.21
324.98 291.84 94.29
NBR 20316.17 337.47
349.34
297.4568.99
435.00 453.15522.9
3 9.31
NBR 25318.44 339.12
349.03
299.0766.63
408.37 455.41532.5
6 9.60
NBR 30309.26 330.23
338.96
290.2259.75
400.49 452.77515.3
1 12.21
Faculty of Engineering and Industrial Technology, Silpakorn UniversityFaculty of Engineering and Industrial Technology, Silpakorn University 52
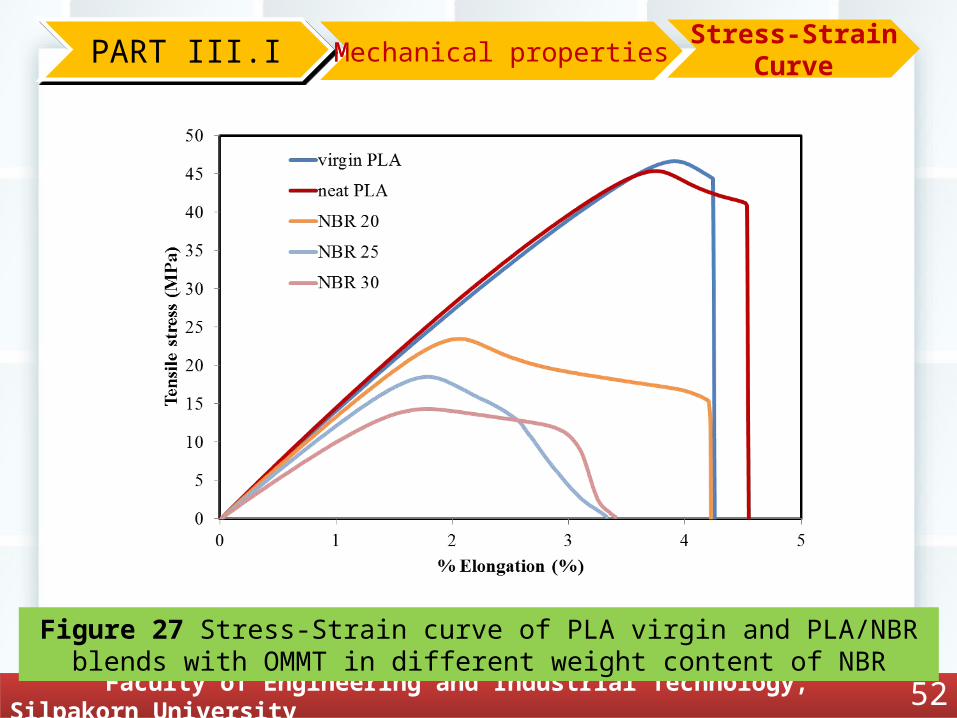
PART IPART I Mechanical properties
Figure 27 Stress-Strain curve of PLA virgin and PLA/NBR blends with OMMT in different weight content of NBR
PART III.IPART III.I Mechanical propertiesStress-Strain
Curve

Faculty of Engineering and Industrial Technology, Silpakorn UniversityFaculty of Engineering and Industrial Technology, Silpakorn University 53
PART III.IPART III.I Mechanical propertiesMorphology after Tensile
Testing
Figure 28 Morphology of PLA/NBR blends in 20, 25 and 30% NBR with OMMT after tensile testing
NBR 20
NBR 25
NBR 30
NBR 20
NBR 30
NBR 25

PART III.IPART III.I Mechanical properties Modulus
Figure 29 Modulus of PLA virgin and PLA/NBR blends with OMMT in different weight content of NBR
Faculty of Engineering and Industrial Technology, Silpakorn UniversityFaculty of Engineering and Industrial Technology, Silpakorn University 54

PART III.IPART III.I Mechanical propertiesMaximum
Tensile Strength
Figure 30 Maximum Tensile Strength of PLA virgin and PLA/NBR blends with OMMT in different weight content of NBR
Faculty of Engineering and Industrial Technology, Silpakorn UniversityFaculty of Engineering and Industrial Technology, Silpakorn University 55
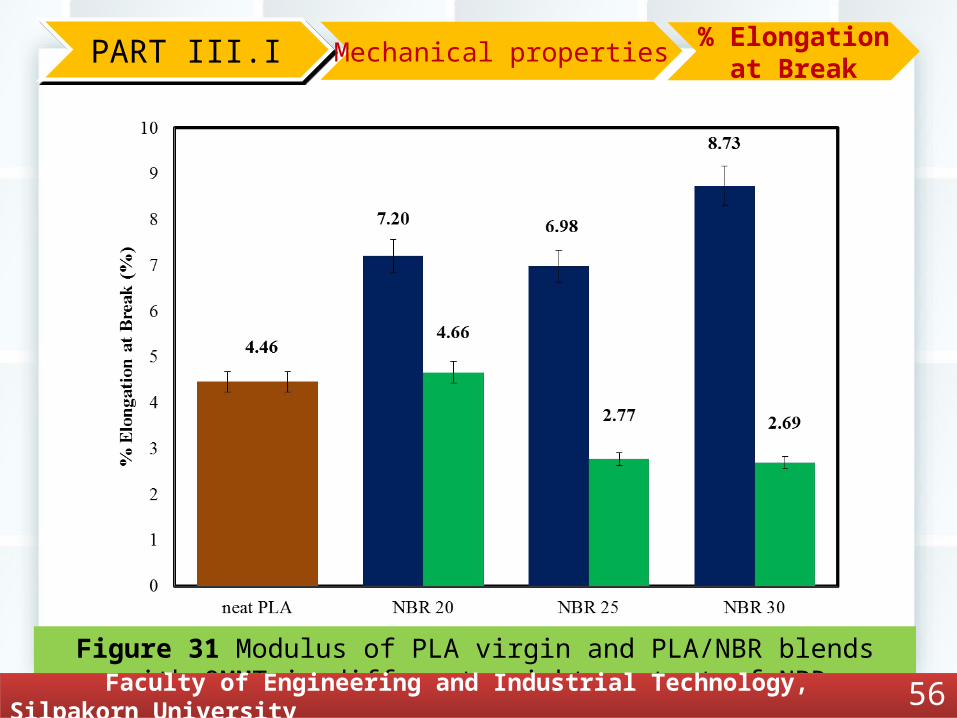
PART III.IPART III.I Mechanical properties
Figure 31 Modulus of PLA virgin and PLA/NBR blends with OMMT in different weight content of NBR
Faculty of Engineering and Industrial Technology, Silpakorn UniversityFaculty of Engineering and Industrial Technology, Silpakorn University 56
% Elongation at Break
Faculty of Engineering and Industrial Technology, Silpakorn UniversityFaculty of Engineering and Industrial Technology, Silpakorn University 57
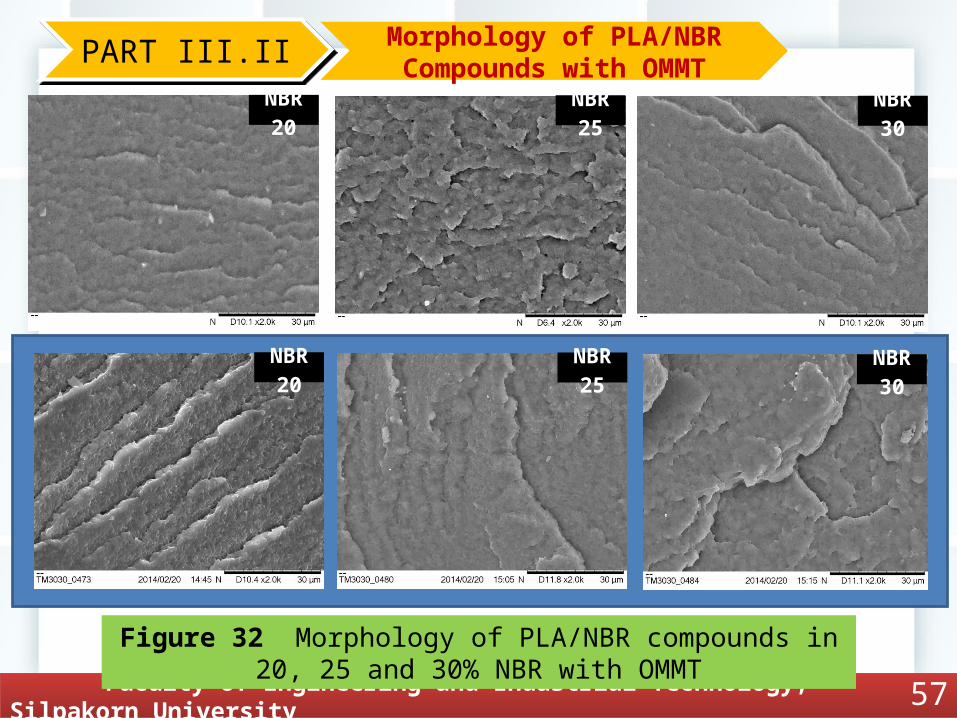
PART III.IIPART III.II Morphology of PLA/NBR Compounds with OMMT
Figure 32 Morphology of PLA/NBR compounds in 20, 25 and 30% NBR with OMMT
NBR 20
NBR 25
NBR 30
NBR 25
NBR 20
NBR 30

Faculty of Engineering and Industrial Technology, Silpakorn UniversityFaculty of Engineering and Industrial Technology, Silpakorn University 58
PART III.IIPART III.II Morphology of PLA/NBR Compounds with OMMT
Figure 3 3 Morphology of PLA/NBR compounds in 20, 25 and 30% NBR with OMMT
5º

Faculty of Engineering and Industrial Technology, Silpakorn UniversityFaculty of Engineering and Industrial Technology, Silpakorn University 59
Figure 34 DSC Thermogram of neat PLA and PLA/NBR compounds with OMMT in first heating
PART III.IIPART III.II Thermal properties of PLA/NBR Compounds
Crystallization
1 st Heat
PLA70/NBR30
neat PLA
PLA80/NBR20
PLA75/NBR25
Tg Tcc
Tm
160.57
159.03
15
8.55
158.05
158.50
149.50
155.40

Faculty of Engineering and Industrial Technology, Silpakorn UniversityFaculty of Engineering and Industrial Technology, Silpakorn University 60
PART III.IIPART III.II Thermal properties of PLA/NBR Compounds
Crystallization
Table 10 Crystallization behavior of PLA/NBR compounds with OMMT in different weight contents of NBR and pure PLA in first heating

Faculty of Engineering and Industrial Technology, Silpakorn UniversityFaculty of Engineering and Industrial Technology, Silpakorn University 61
Figure 35 DSC Thermogram of neat PLA and PLA/NBR compounds with OMMT in first heating
PART III.IIPART III.II Thermal properties of PLA/NBR Compounds
Crystallization
2nd Heat
neat PLA
PLA80/NBR20
PLA75/NBR25
PLA70/NBR30
Tg Tcc
Tm
159.51
159.4915
95.115
8.501 5850
149.61
151.68
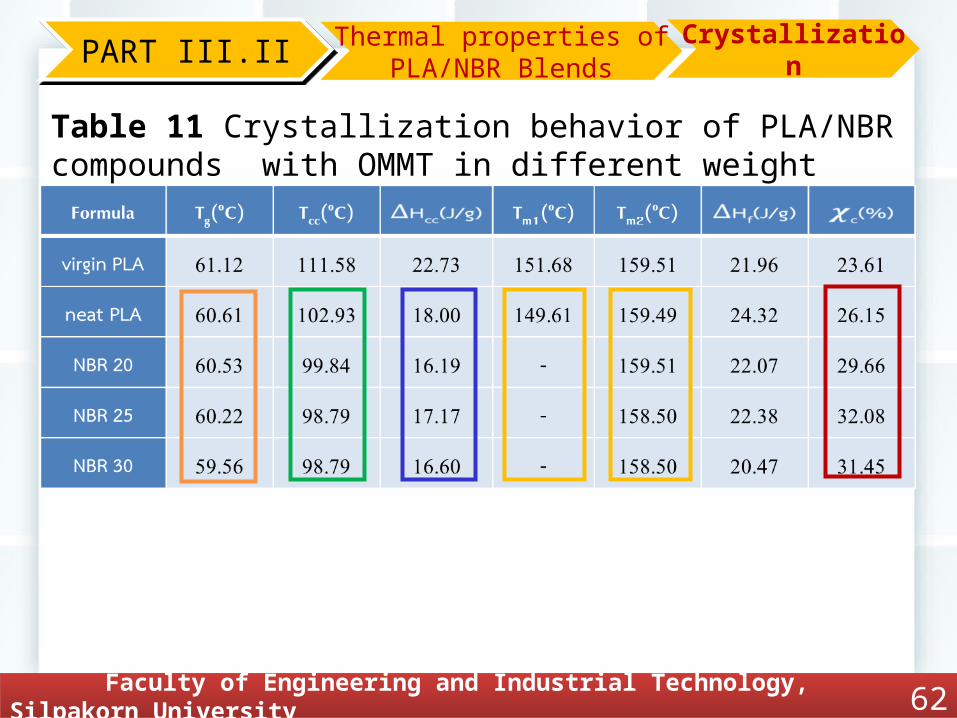
PART III.IIPART III.II Thermal properties of PLA/NBR Blends
Crystallization
Table 11 Crystallization behavior of PLA/NBR compounds with OMMT in different weight contents of NBR and pure PLA in second heating
Faculty of Engineering and Industrial Technology, Silpakorn UniversityFaculty of Engineering and Industrial Technology, Silpakorn University 62

PART III.IIPART III.II Thermal properties of PLA/NBR Compounds
Degradation
Figure 3 6 TGA Thermogram of neat PLA and PLA/NBR compounds with OMMT
Faculty of Engineering and Industrial Technology, Silpakorn UniversityFaculty of Engineering and Industrial Technology, Silpakorn University 63
PLA80/NBR20
PLA75/NBR25
PLA70/NBR30

Faculty of Engineering and Industrial Technology, Silpakorn UniversityFaculty of Engineering and Industrial Technology, Silpakorn University 64
PART III.IIPART III.II Thermal properties of PLA/NBR Compounds
Degradation
Figure 37 DTG Thermogram of neat PLA and PLA/NBR compounds with OMMT
PLA80/NBR20
PLA75/NBR25
(316.98)
(306.21)
(326.30)
(322.00)
(319.41)

Faculty of Engineering and Industrial Technology, Silpakorn UniversityFaculty of Engineering and Industrial Technology, Silpakorn University 65
PART III.IIPART III.II Thermal properties of PLA/NBR Compounds
Degradation
Table 12 Degradation data of PLA/NBR compounds with OMMT in different weight contents of NBR and pure PLA by TGA
Formula
Degradation temperature (°C)Peak area
OnsetInflecti
onEnd
At 10% degradatio
n(%)
virgin PLA 294.61 316.98
332.16 298.18 94.24
neat PLA 293.46 306.21
324.98 291.84 94.29
NBR 20
294.62 326.30337.4
3286.54
67.93
403.90 442.21468.4
28.12
NBR 25
289.91 322.00330.1
3280.05
64.26
401.07 446.36470.0
714.6
NBR 30
290.87 319.41330.0
2278.44
59.63
408.9 445.94472.6
619.18

Faculty of Engineering and Industrial Technology, Silpakorn UniversityFaculty of Engineering and Industrial Technology, Silpakorn University 66
PART IPART I Mechanical properties
Figure 38 Stress-Strain curve of PLA virgin and PLA/NBR compounds with OMMT in different weight content of NBR
PART III.IIPART III.II Mechanical propertiesStress-Strain
Curve

Faculty of Engineering and Industrial Technology, Silpakorn UniversityFaculty of Engineering and Industrial Technology, Silpakorn University 67
PART III.IIPART III.II Mechanical propertiesMorphology after Tensile
Testing
Figure 39 Morphology of PLA/NBR compounds in 20, 25 and 30% NBR with OMMT after tensile testing
NBR 20
NBR 25
NBR 30
NBR 20
NBR 25
NBR 30

PART III.IIPART III.II Mechanical properties Modulus
Figure 40 Modulus of PLA virgin and PLA/NBR compounds with OMMT in different weight content of NBR
Faculty of Engineering and Industrial Technology, Silpakorn UniversityFaculty of Engineering and Industrial Technology, Silpakorn University 68

PART III.IIPART III.II Mechanical propertiesMaximum
Tensile Strength
Figure 41 Maximum Tensile Strength of PLA virgin and PLA/NBR compounds with OMMT in different weight content of
NBRFaculty of Engineering and Industrial Technology, Silpakorn UniversityFaculty of Engineering and Industrial Technology, Silpakorn University 69

PART III.IIPART III.II Mechanical properties
Figure 42 Modulus of PLA virgin and PLA/NBR compounds with OMMT in different weight content of NBR
Faculty of Engineering and Industrial Technology, Silpakorn UniversityFaculty of Engineering and Industrial Technology, Silpakorn University 70
% Elongation at Break

Conclusion
Faculty of Engineering and Industrial Technology, Silpakorn UniversityFaculty of Engineering and Industrial Technology, Silpakorn University 71

Faculty of Engineering and Industrial Technology, Silpakorn UniversityFaculty of Engineering and Industrial Technology, Silpakorn University 72
PLA/NBR blendsPLA/NBR blends
1. NBR resulted to PLA increase crystallinity2. NBR resulted to PLA increase Td
3. NBR resulted to PLA/NBR blends Increase elongation at breakDecrease modulusDecrease maximum tensile strength
4. NBR was disperse phase in PLA matrix

Faculty of Engineering and Industrial Technology, Silpakorn UniversityFaculty of Engineering and Industrial Technology, Silpakorn University 73
PLA/NBR compoundsPLA/NBR compounds
1. DCP resulted to PLA decrease crystallinity2. DCP resulted to PLA increase Td
3. DCP resulted to PLA/NBR compounds Increase elongation at breakDecrease modulusDecrease maximum tensile strength
4. DCP improved miscibility between PLA and NBR

Faculty of Engineering and Industrial Technology, Silpakorn UniversityFaculty of Engineering and Industrial Technology, Silpakorn University 74
PLA/NBR blends + OMMTPLA/NBR blends + OMMT
1. OMMT resulted to PLA increase crystallinity.2. OMMT resulted to PLA increase Td.
3. OMMT resulted to PLA/NBR blends Decrease elongation at breakDecrease modulusDecrease maximum tensile strength

Faculty of Engineering and Industrial Technology, Silpakorn UniversityFaculty of Engineering and Industrial Technology, Silpakorn University 75
PLA/NBR compoundsPLA/NBR compounds
1. OMMT resulted to PLA increase crystallinity.2. OMMT resulted to PLA increase Td.
3. OMMT resulted to PLA/NBR compounds Increase elongation at breakDecrease modulusDecrease maximum tensile strength

Faculty of Engineering and Industrial Technology, Silpakorn UniversityFaculty of Engineering and Industrial Technology, Silpakorn University 76

ConclusionConclusion Thermal properties Tg
Faculty of Engineering and Industrial Technology, Silpakorn UniversityFaculty of Engineering and Industrial Technology, Silpakorn University 68
Figure 4.43 Tg of PLA/NBR blends in different weight content of NBR

Faculty of Engineering and Industrial Technology, Silpakorn UniversityFaculty of Engineering and Industrial Technology, Silpakorn University 69
ConclusionConclusion Thermal properties Tm1
Figure 4.44 Tm1 of PLA/NBR blends in different weight content of NBR

Faculty of Engineering and Industrial Technology, Silpakorn UniversityFaculty of Engineering and Industrial Technology, Silpakorn University 70
ConclusionConclusion Thermal properties Tm2
Figure 4.45 Tm2 of PLA/NBR blends in different weight content of NBR

Faculty of Engineering and Industrial Technology, Silpakorn UniversityFaculty of Engineering and Industrial Technology, Silpakorn University 71
ConclusionConclusion Thermal properties %Xc
Figure 4.46 %Xc of PLA/NBR blends in different weight content of NBR

Faculty of Engineering and Industrial Technology, Silpakorn UniversityFaculty of Engineering and Industrial Technology, Silpakorn University 72
ConclusionConclusion Thermal properties Td
Figure 4.47 Tm2 of PLA/NBR blends in different weight content of NBR

ConclusionConclusion Mechanical properties Modulus
Faculty of Engineering and Industrial Technology, Silpakorn UniversityFaculty of Engineering and Industrial Technology, Silpakorn University
Figure 4.48 Modulus of PLA/NBR blends in different weight content of NBR
82

ConclusionConclusion Mechanical propertiesMaximum
Tensile Strength
Faculty of Engineering and Industrial Technology, Silpakorn UniversityFaculty of Engineering and Industrial Technology, Silpakorn University 83
Figure 4.49 Maximum tensile strength of PLA/NBR blends in different weight content of NBR

ConclusionConclusion Mechanical properties% Elongation
at Break
Faculty of Engineering and Industrial Technology, Silpakorn UniversityFaculty of Engineering and Industrial Technology, Silpakorn University 84
Figure 4.50 Maximum tensile strength of PLA/NBR blends in different weight content of NBR