보건의료경제학의 기본 개념과 도구snu-dhpm.ac.kr/pds/files/2 140907...
TRANSCRIPT

보건의료경제학의기본 개념과 도구
보건의료경제학
2014. 9. 17.

Society’s Trade-Off Between Guns and Butter
(Production Possibilities Frontier)
(Infeasible)
(Inefficient)
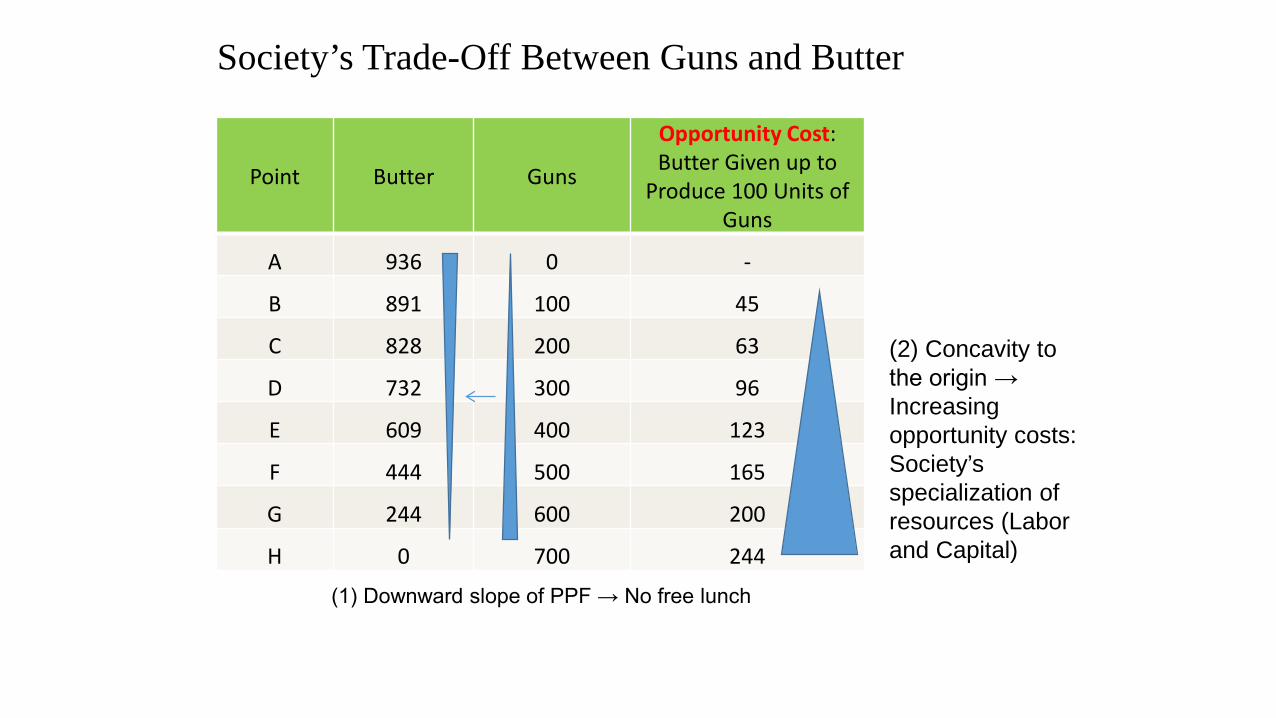
Society’s Trade-Off Between Guns and Butter
Point Butter Guns
Opportunity Cost: Butter Given up to
Produce 100 Units of Guns
A 936 0 -
B 891 100 45
C 828 200 63
D 732 300 96
E 609 400 123
F 444 500 165
G 244 600 200
H 0 700 244
(2) Concavity to the origin →Increasing opportunity costs:Society’s specialization of resources (Labor and Capital)
(1) Downward slope of PPF → No free lunch

Practice With Supply and Demand
4Copyright © 2010 Pearson Education, Inc. Publishing as Prentice Hall

Demand Curve and Demand Shifters
• Income• Prices of Other Goods• Insurance• Tastes
5Copyright © 2010 Pearson Education, Inc. Publishing as Prentice Hall

Supply Curve and Supply Shifters
• Technological Change• Input Prices• Prices of Production-Related
Goods• Size of Industry• Weather
6Copyright © 2010 Pearson Education, Inc. Publishing as Prentice Hall
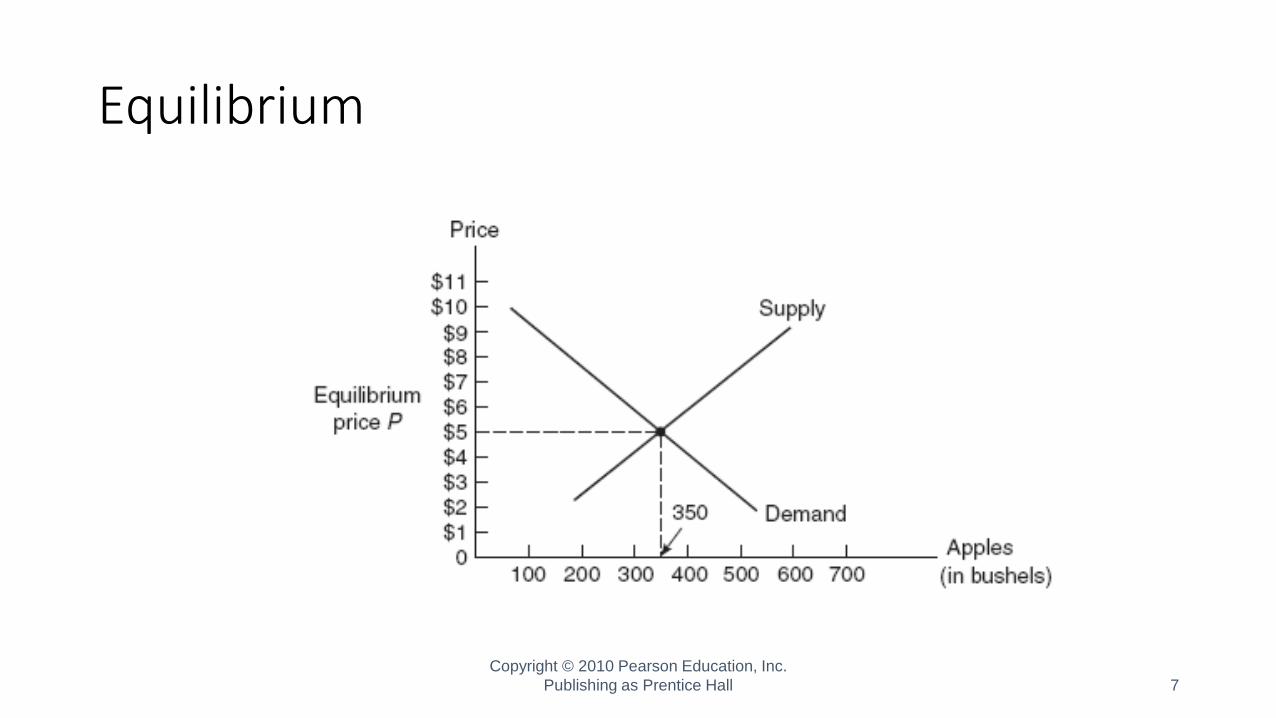
Equilibrium
7Copyright © 2010 Pearson Education, Inc.
Publishing as Prentice Hall

Market Effects of Supply and Demand Shifts
8Copyright © 2010 Pearson Education, Inc. Publishing as Prentice Hall

Comparative Statics
• A national health insurance program is passed that that provides comprehensive health insurance to everyone – demand curve shifts to the right resulting in an increase in the equilibrium price and quantity.
• A new law requires that hospitals hire only nurses with B.A. degrees –cost of hospital care rises shifting supply curve to the left resulting in an increase in the equilibrium price and a reduction in the equilibrium quantity of care.
9Copyright © 2010 Pearson Education, Inc.
Publishing as Prentice Hall

Functions and Curves
10Copyright © 2010 Pearson Education, Inc. Publishing as Prentice Hall
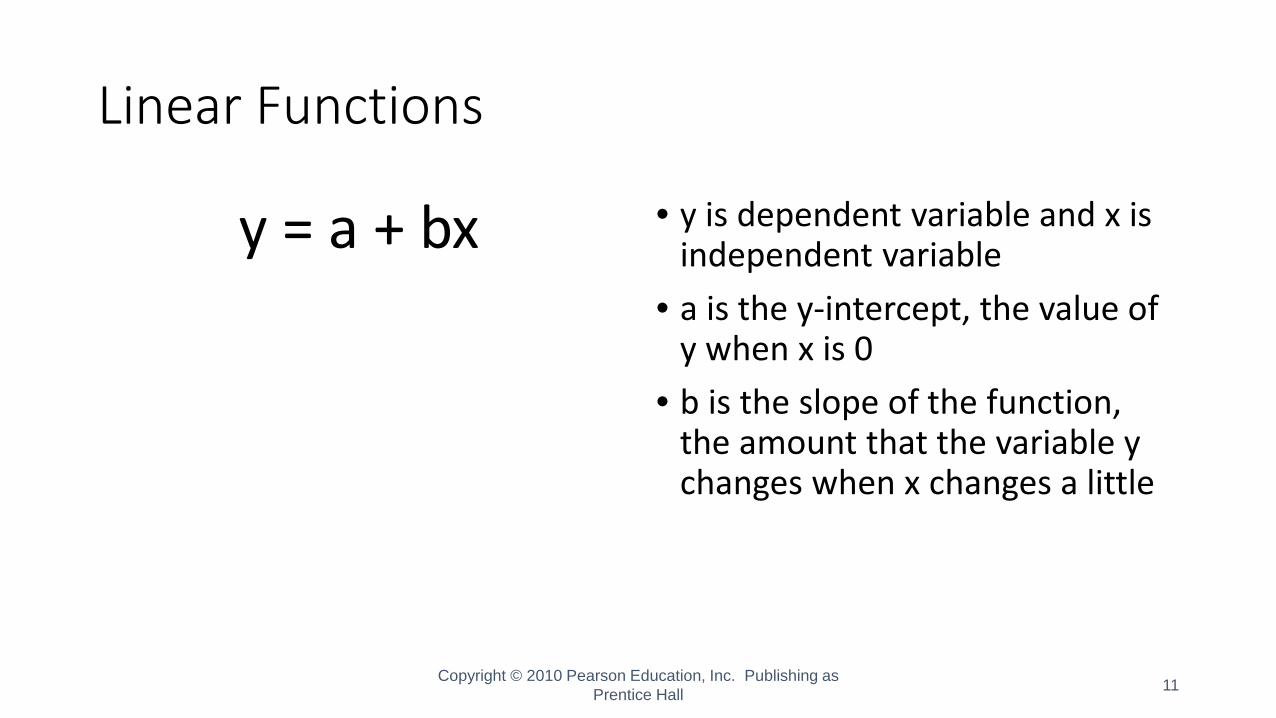
Linear Functions
y = a + bx • y is dependent variable and x is independent variable
• a is the y-intercept, the value of y when x is 0
• b is the slope of the function, the amount that the variable y changes when x changes a little
11Copyright © 2010 Pearson Education, Inc. Publishing as Prentice Hall
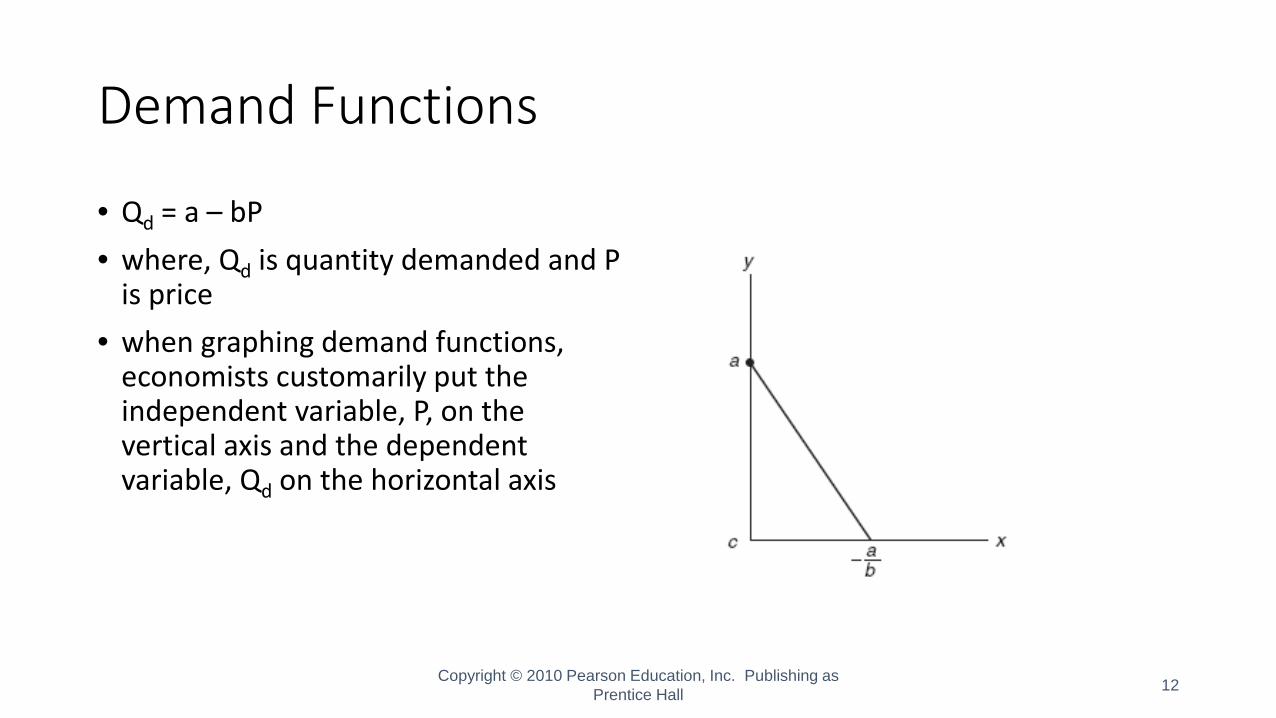
Demand Functions
• Qd = a – bP• where, Qd is quantity demanded and P
is price• when graphing demand functions,
economists customarily put the independent variable, P, on the vertical axis and the dependent variable, Qd on the horizontal axis
12Copyright © 2010 Pearson Education, Inc. Publishing as Prentice Hall

Multivariate Demand Function
• Qd = f (Ps, Po, Y, Z )• for example, the quantity of spaghetti demanded is a function of the
price of spaghetti (Ps), the price of related goods (Po), the individual’s income (Y) and tastes and preferences (Z)
13Copyright © 2010 Pearson Education, Inc.
Publishing as Prentice Hall
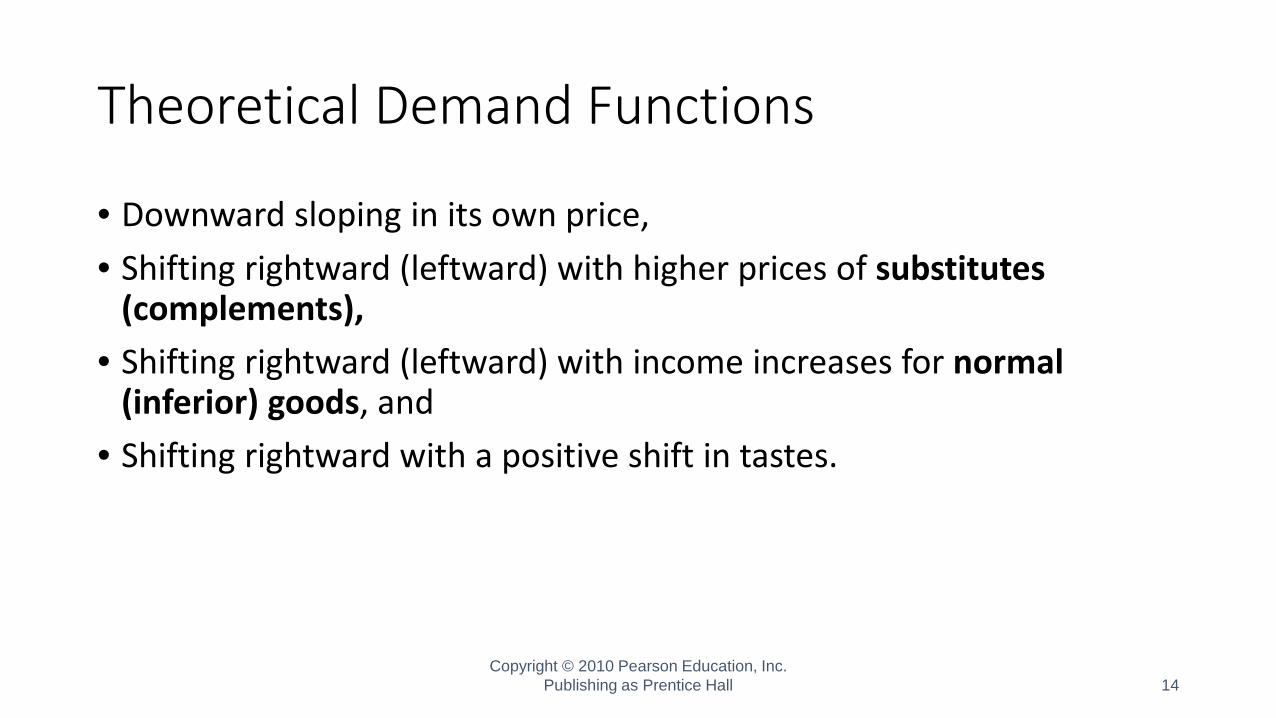
Theoretical Demand Functions
• Downward sloping in its own price,• Shifting rightward (leftward) with higher prices of substitutes
(complements),• Shifting rightward (leftward) with income increases for normal
(inferior) goods, and• Shifting rightward with a positive shift in tastes.
14Copyright © 2010 Pearson Education, Inc.
Publishing as Prentice Hall
Derived Demand
• Demand by consumers for a final good or service may stimulate the provider of that service in turn to demand factors of production.
15Copyright © 2010 Pearson Education, Inc.
Publishing as Prentice Hall

Consumer theory: Ideas behind the demand curve
16Copyright © 2010 Pearson Education, Inc. Publishing as Prentice Hall

Utility
• Utility is a measure of an individual’s satisfaction with various combinations of consumer goods
• Marginal utility is the extra utility achieved by consuming one more unit of a good
17Copyright © 2010 Pearson Education, Inc.
Publishing as Prentice Hall

Indifference Curves
• Indifference curves summarize a person’s preferences with regards to two goods
• They are downward sloping and convex
• The combinations A, E, F and G on indifference curve U1 provide the same level of utility
18Copyright © 2010 Pearson Education, Inc. Publishing as Prentice Hall

Budget Constraint
• The budget constraint indicates the set of bundles the consumer can afford with a given income
• Slope of the budget constraint to the right is Pc/Pb, and measures how much beef must be sacrificed to get one more pound of chicken
19Copyright © 2010 Pearson Education, Inc. Publishing as Prentice Hall
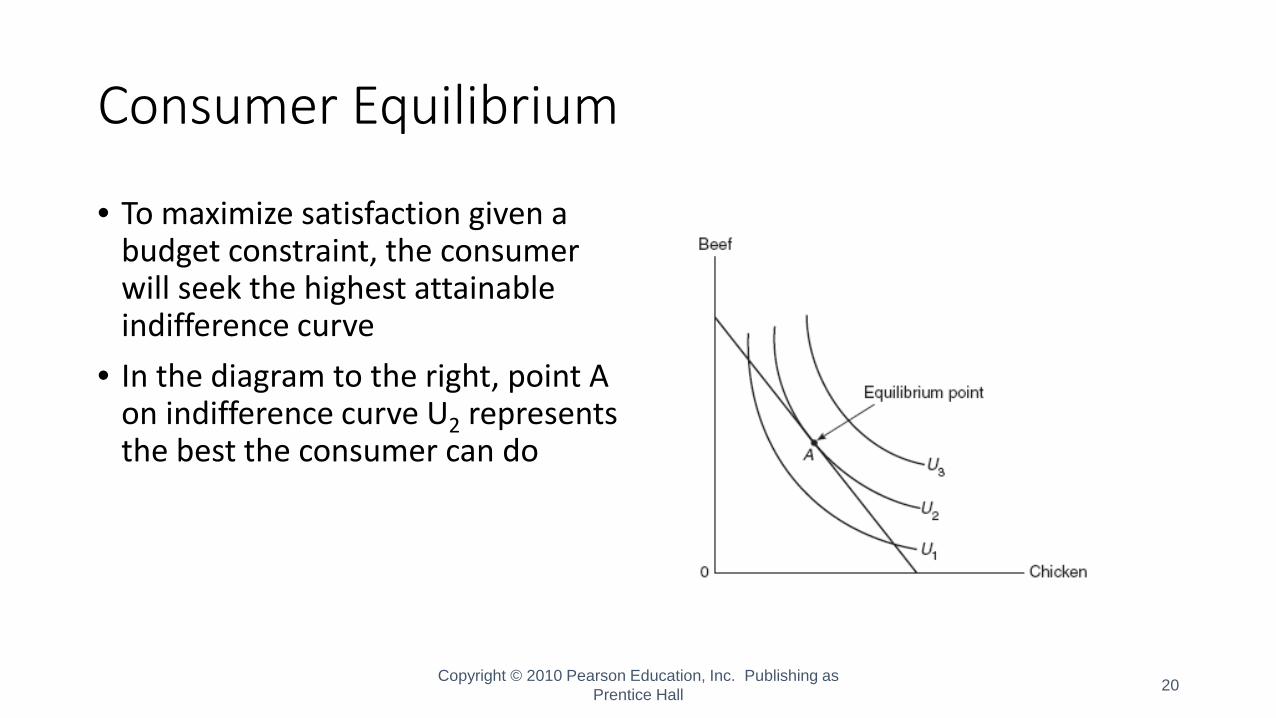
Consumer Equilibrium
• To maximize satisfaction given a budget constraint, the consumer will seek the highest attainable indifference curve
• In the diagram to the right, point A on indifference curve U2 represents the best the consumer can do
20Copyright © 2010 Pearson Education, Inc. Publishing as Prentice Hall
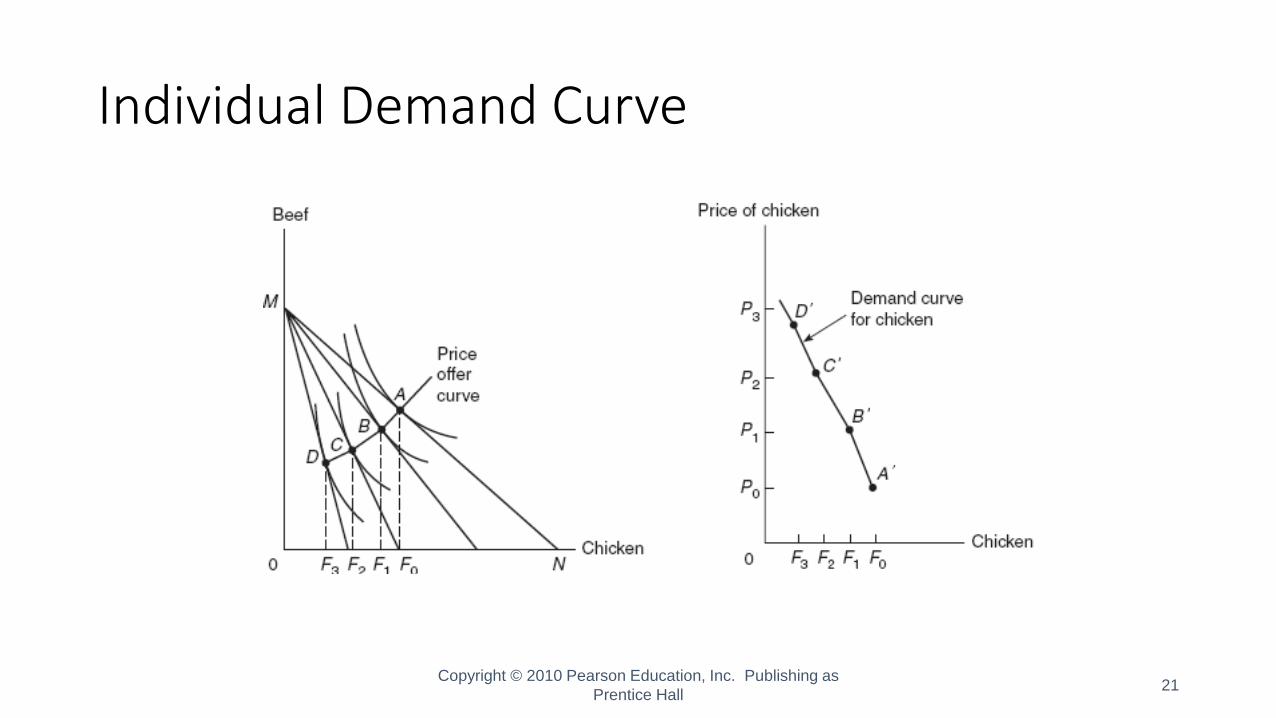
Individual Demand Curve
21Copyright © 2010 Pearson Education, Inc. Publishing as Prentice Hall

Individual and Market Demand
22Copyright © 2010 Pearson Education, Inc. Publishing as Prentice Hall

Elasticities
23Copyright © 2010 Pearson Education, Inc. Publishing as Prentice Hall

Price Elasticity
• Elasticity is defined as the responsiveness of a dependent variable to changes in an independent variable, for price elasticity that would be the responsiveness of quantity demanded to changes in price
Ep= % change in Qd ÷ % change in P= (ΔQ/Q) ÷ (ΔP/P)
24Copyright © 2010 Pearson Education, Inc. Publishing as Prentice Hall
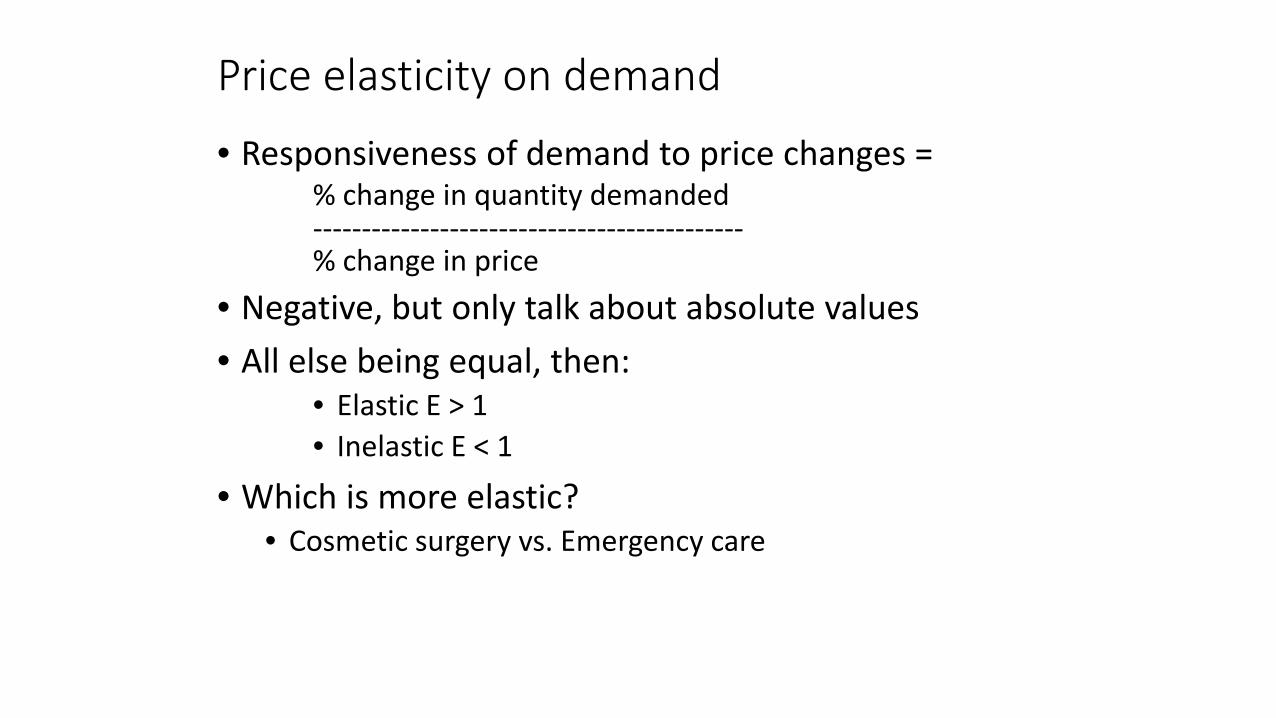
Price elasticity on demand
• Responsiveness of demand to price changes =% change in quantity demanded--------------------------------------------% change in price
• Negative, but only talk about absolute values• All else being equal, then:
• Elastic E > 1• Inelastic E < 1
• Which is more elastic?• Cosmetic surgery vs. Emergency care
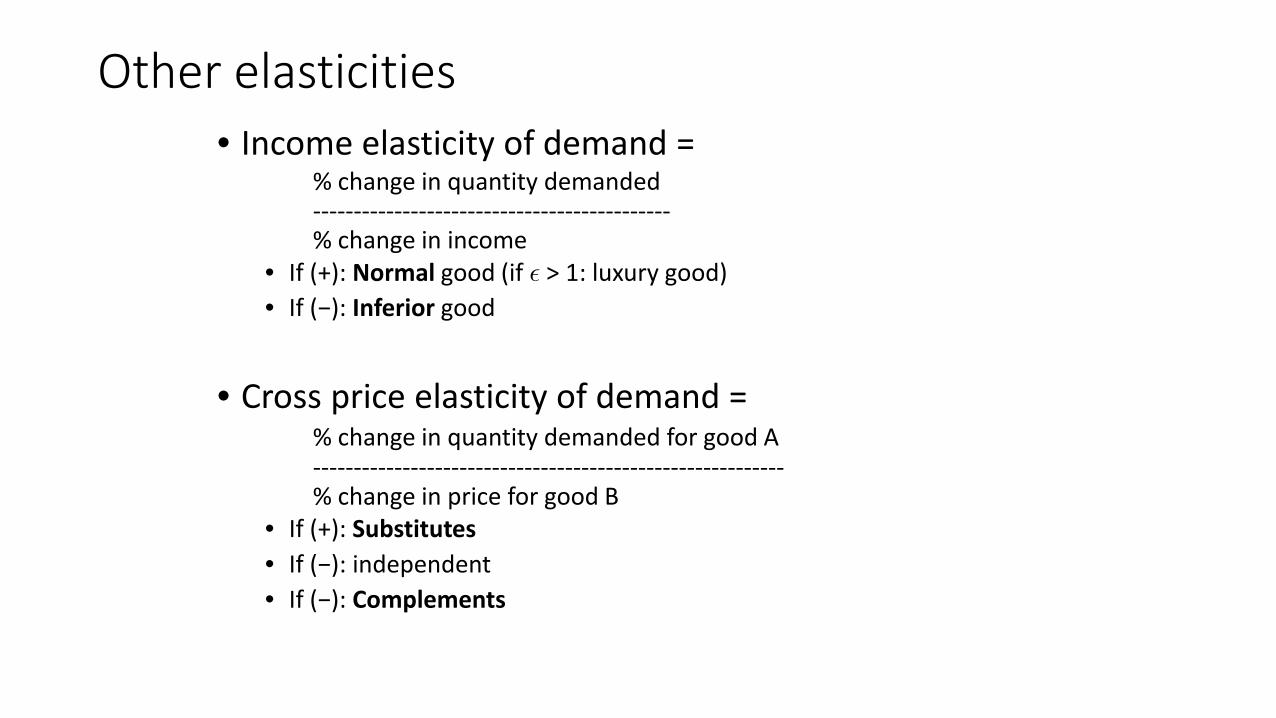
Other elasticities• Income elasticity of demand =
% change in quantity demanded--------------------------------------------% change in income
• If (+): Normal good (if > 1: luxury good)• If (−): Inferior good
• Cross price elasticity of demand =% change in quantity demanded for good A----------------------------------------------------------% change in price for good B
• If (+): Substitutes• If (−): independent• If (−): Complements
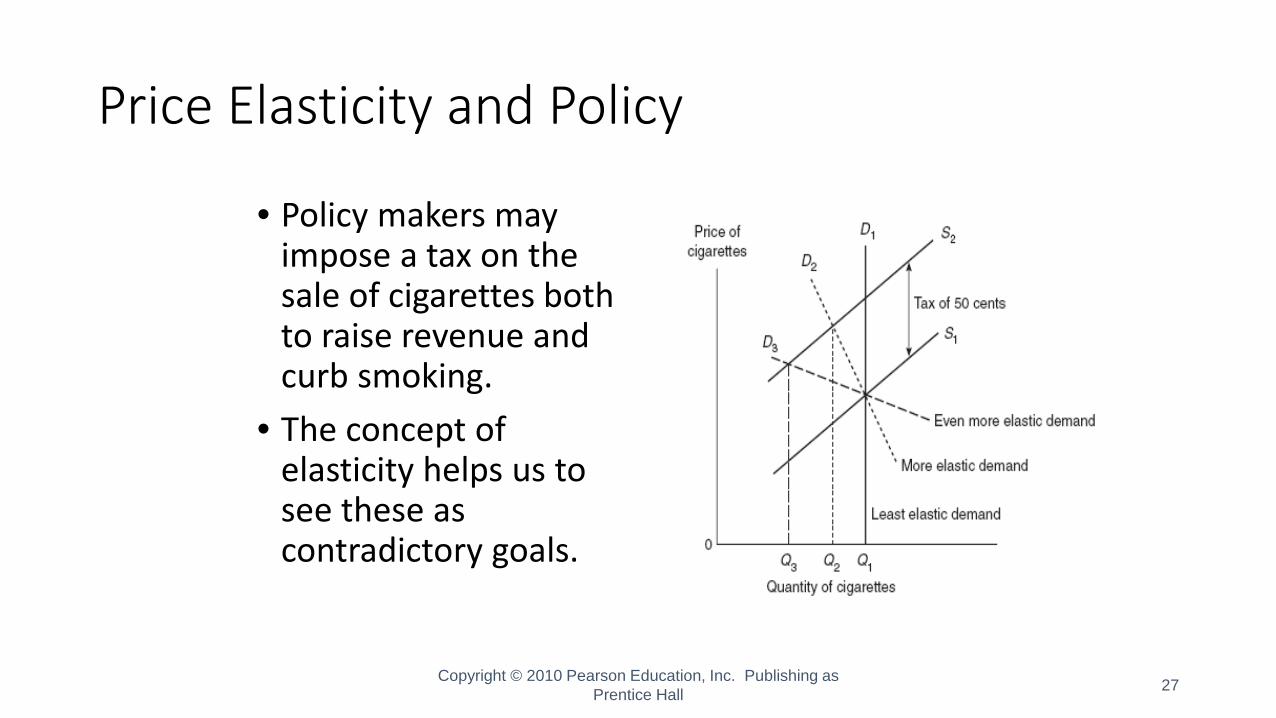
Price Elasticity and Policy
• Policy makers may impose a tax on the sale of cigarettes both to raise revenue and curb smoking.
• The concept of elasticity helps us to see these as contradictory goals.
27Copyright © 2010 Pearson Education, Inc. Publishing as Prentice Hall
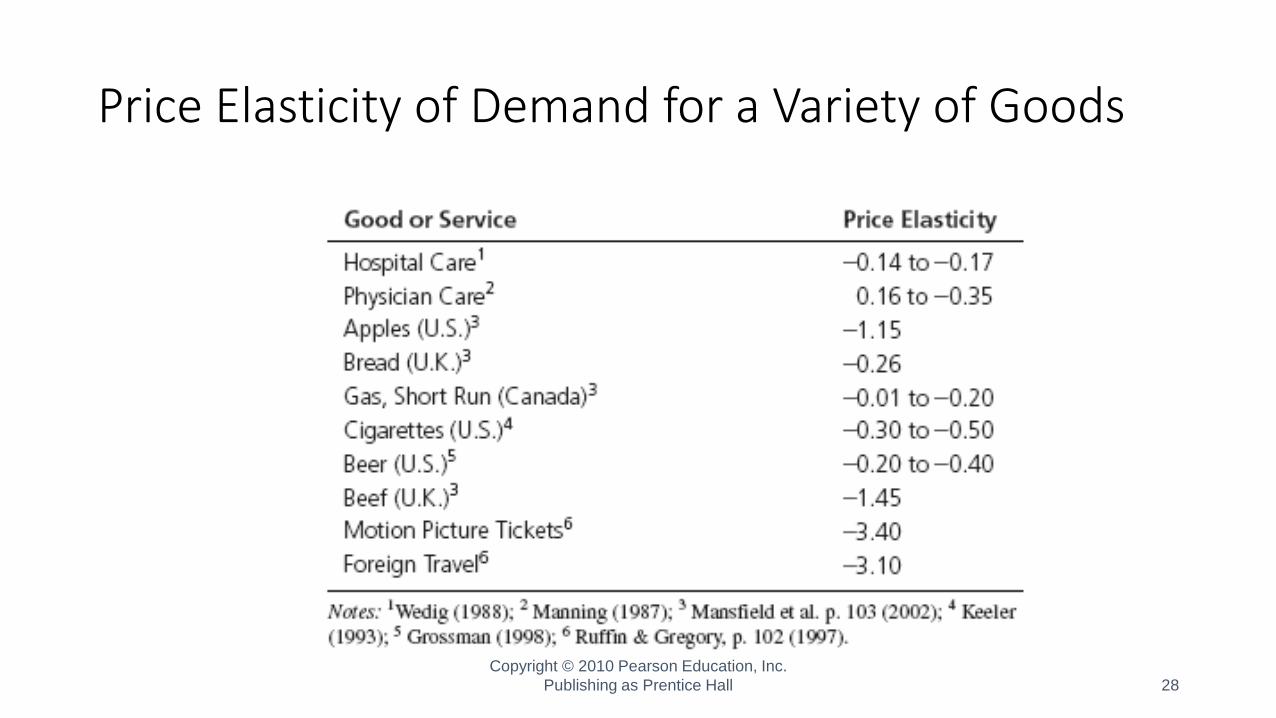
Price Elasticity of Demand for a Variety of Goods
28Copyright © 2010 Pearson Education, Inc.
Publishing as Prentice Hall

Exercise

Production and market supply
30Copyright © 2010 Pearson Education, Inc. Publishing as Prentice Hall
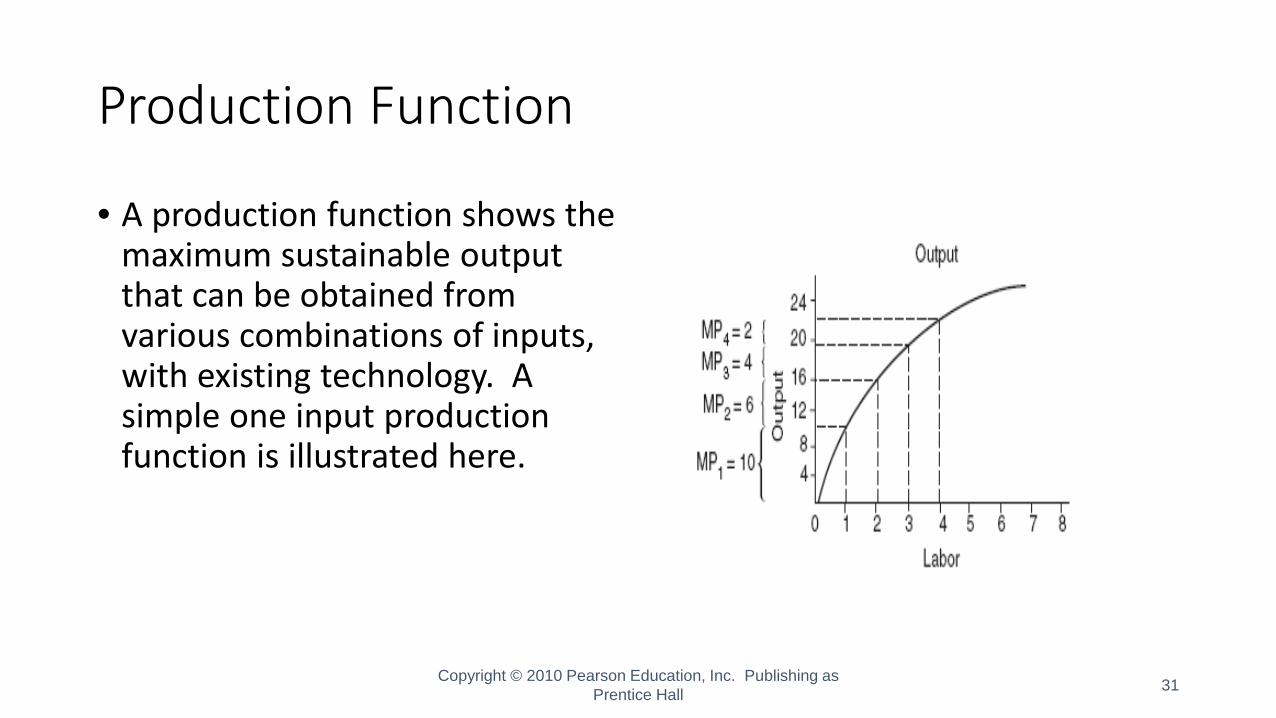
Production Function
• A production function shows the maximum sustainable output that can be obtained from various combinations of inputs, with existing technology. A simple one input production function is illustrated here.
31Copyright © 2010 Pearson Education, Inc. Publishing as Prentice Hall
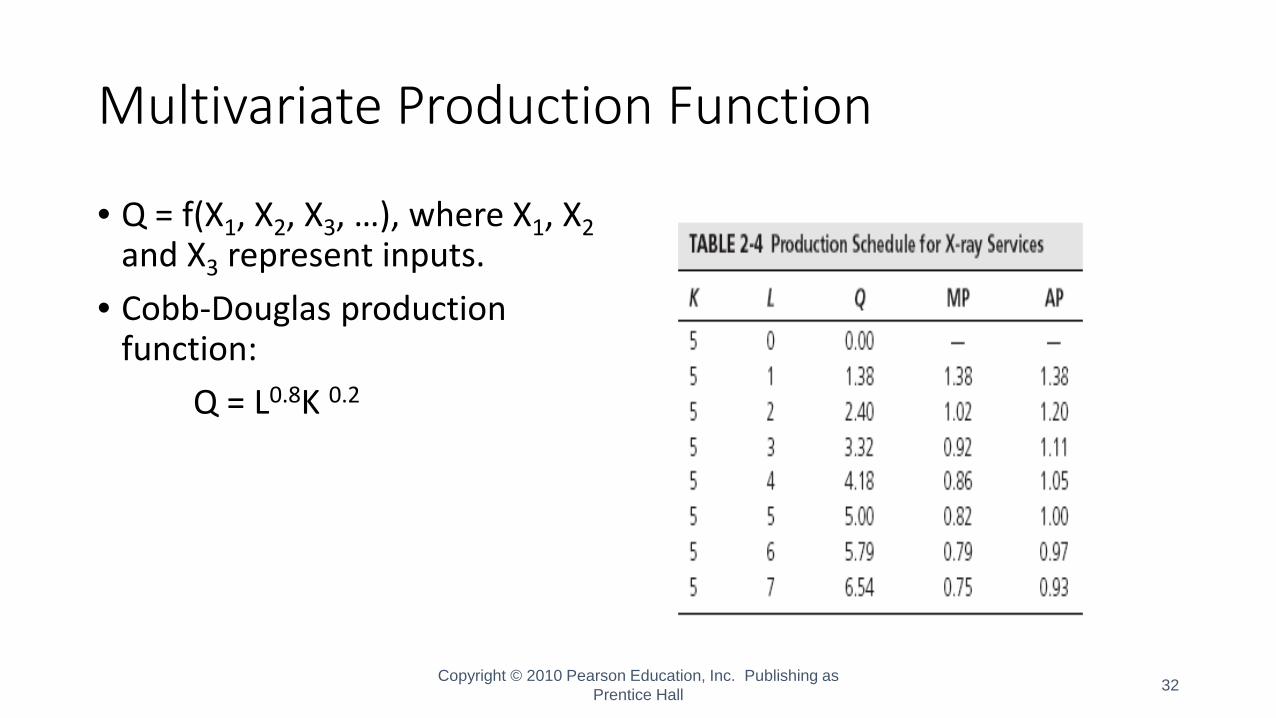
Multivariate Production Function
• Q = f(X1, X2, X3, …), where X1, X2and X3 represent inputs.
• Cobb-Douglas production function:
Q = L0.8K 0.2
32Copyright © 2010 Pearson Education, Inc. Publishing as Prentice Hall
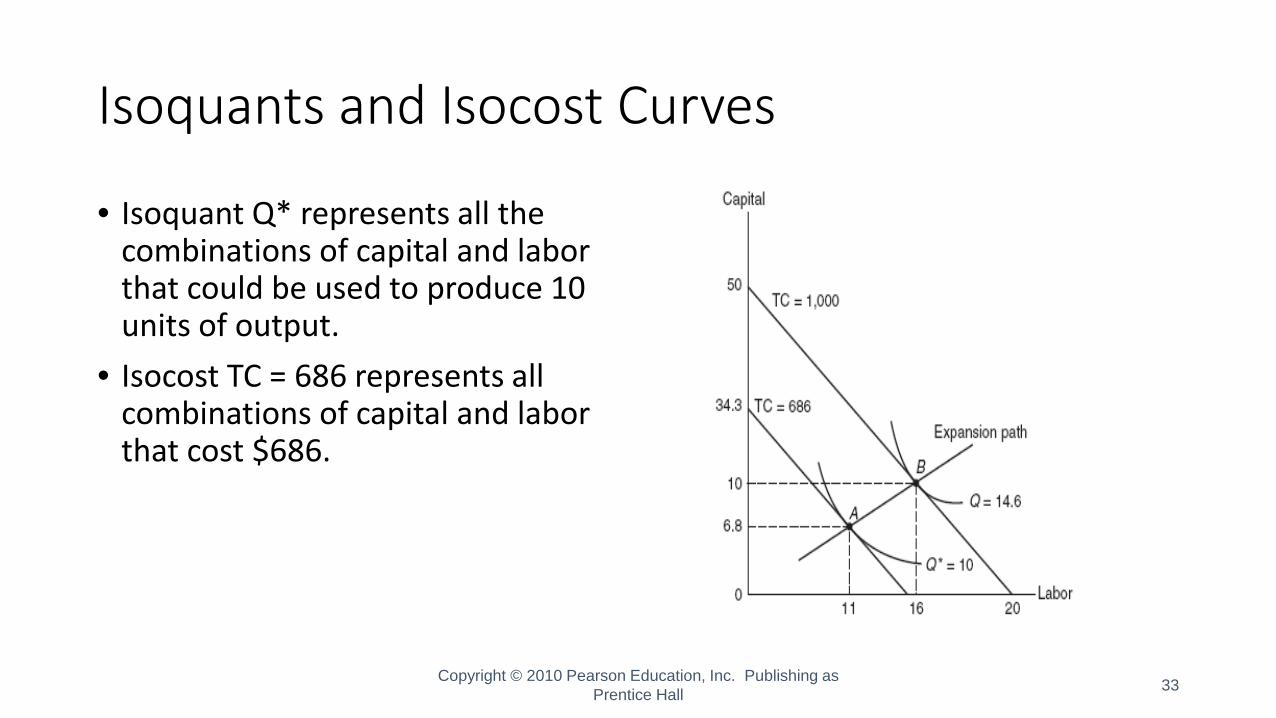
Isoquants and Isocost Curves
• Isoquant Q* represents all the combinations of capital and labor that could be used to produce 10 units of output.
• Isocost TC = 686 represents all combinations of capital and labor that cost $686.
33Copyright © 2010 Pearson Education, Inc. Publishing as Prentice Hall
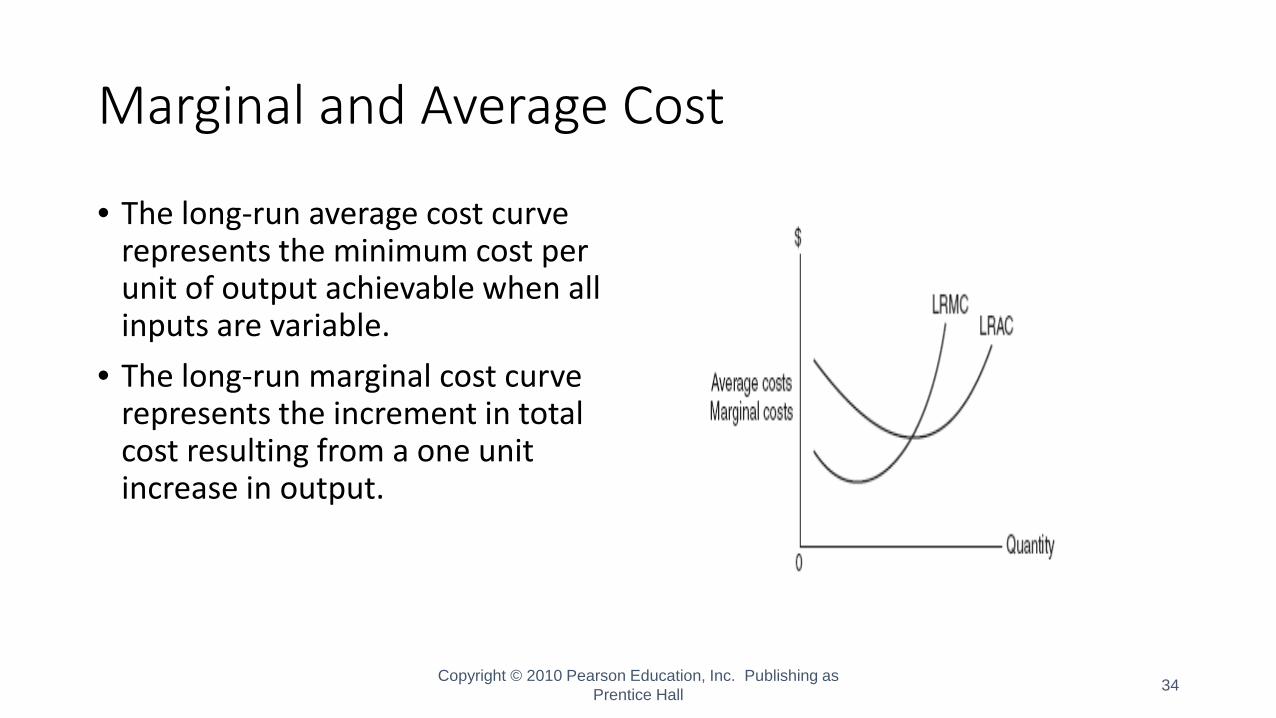
Marginal and Average Cost
• The long-run average cost curve represents the minimum cost per unit of output achievable when all inputs are variable.
• The long-run marginal cost curve represents the increment in total cost resulting from a one unit increase in output.
34Copyright © 2010 Pearson Education, Inc. Publishing as Prentice Hall

Firm supply under perfect competition
35Copyright © 2010 Pearson Education, Inc. Publishing as Prentice Hall

Competitive Model
• A sufficient number of buyers and sellers of the good exist so that no single buyer or seller has any power over the price.
• The good is homogeneous; that is, all producers produce the exact same good.
• Information is perfect. All buyers and sellers have information on all relevant variables such as prices and qualities.
• No barriers to entry or exit are present.
36Copyright © 2010 Pearson Education, Inc.
Publishing as Prentice Hall
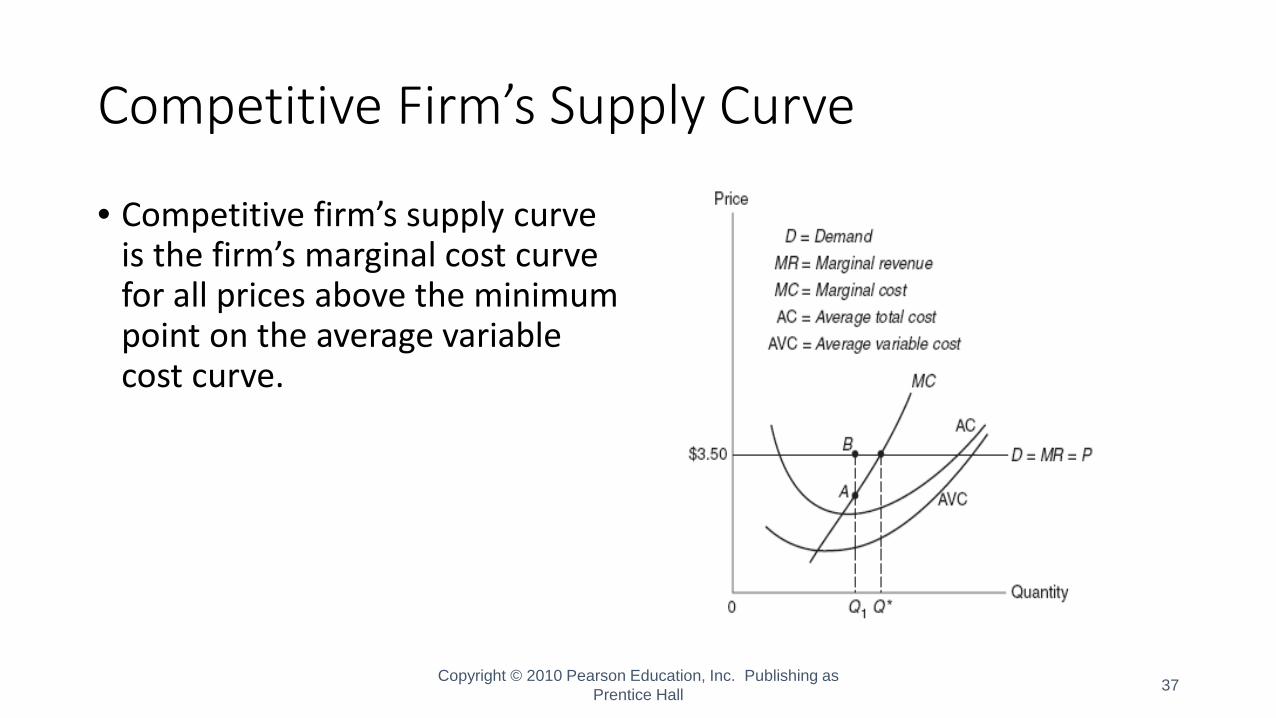
Competitive Firm’s Supply Curve
• Competitive firm’s supply curve is the firm’s marginal cost curve for all prices above the minimum point on the average variable cost curve.
37Copyright © 2010 Pearson Education, Inc. Publishing as Prentice Hall

Monopoly and other market structures
38Copyright © 2010 Pearson Education, Inc. Publishing as Prentice Hall
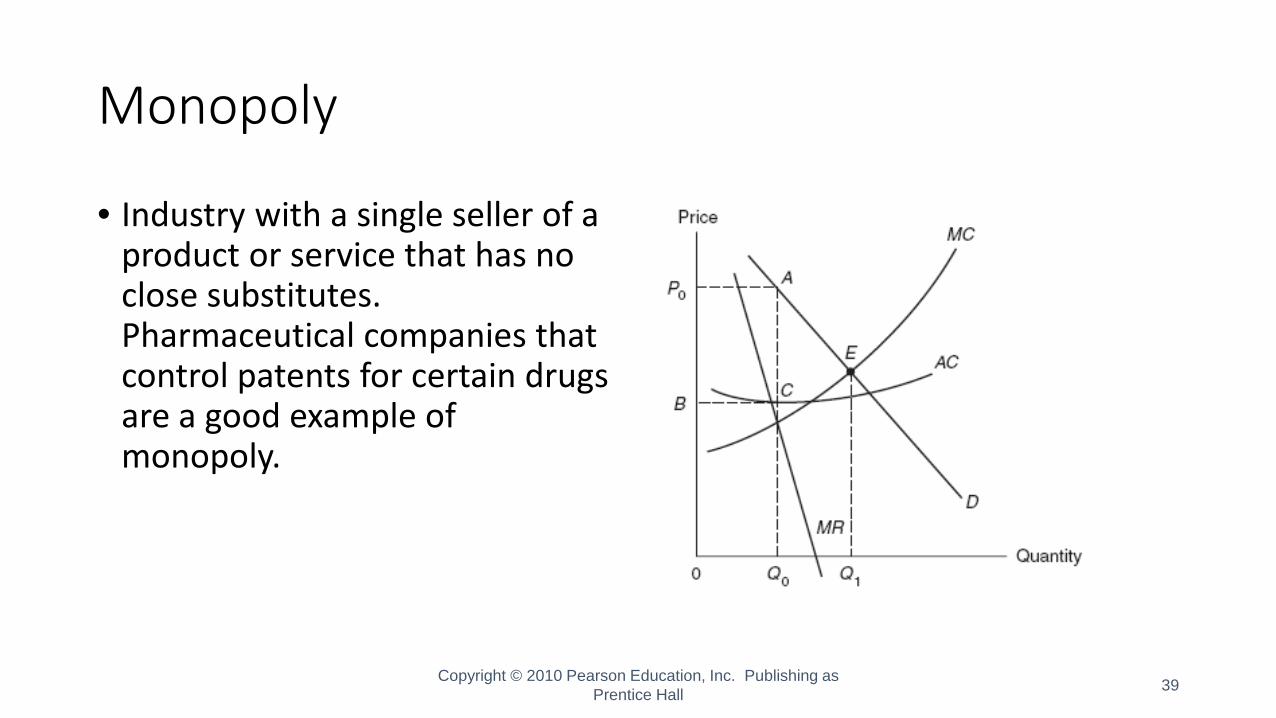
Monopoly
• Industry with a single seller of a product or service that has no close substitutes. Pharmaceutical companies that control patents for certain drugs are a good example of monopoly.
39Copyright © 2010 Pearson Education, Inc. Publishing as Prentice Hall

Monopolistic Competition
• Industry with many sellers of a product or service that is differentiable between sellers. Individual physician practices differentiated by reputation, patient loyalty, and patient/practice distance would be an example of a monopolistically competitive market.
40Copyright © 2010 Pearson Education, Inc.
Publishing as Prentice Hall

Oligopoly
• Industry with few sellers of a good or service. Many towns have only a couple of hospitals to choose from making the market for hospital services in that town oligopolistic.
41Copyright © 2010 Pearson Education, Inc.
Publishing as Prentice Hall
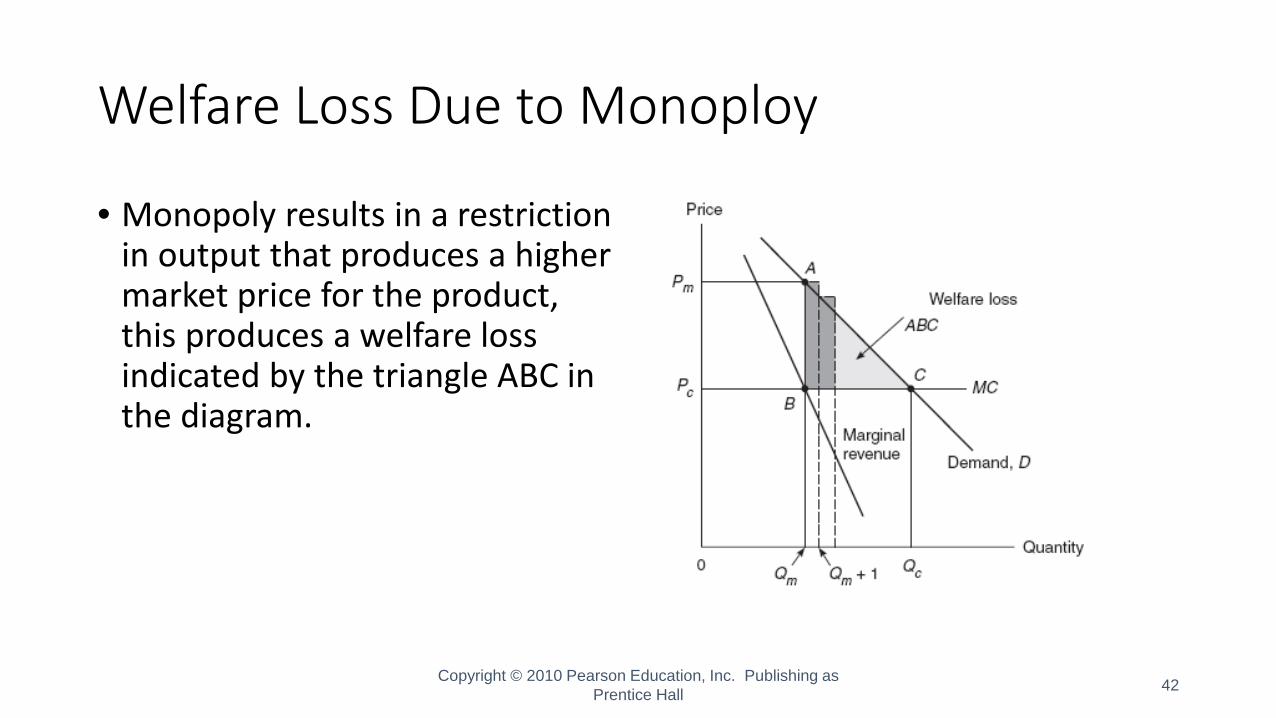
Welfare Loss Due to Monoploy
• Monopoly results in a restriction in output that produces a higher market price for the product, this produces a welfare loss indicated by the triangle ABC in the diagram.
42Copyright © 2010 Pearson Education, Inc. Publishing as Prentice Hall

Statistical Tools for Health Economics
• Multiple regression analysis• All else equal (ceteris paribus)
• Endogeneity• Simultaneity (Reverse causality)• Omitted variable bias
• Natural experiment & Quasi-experimental study design• Modeling of variables of health care use and behaviors

Multiple Regression Analysis• Y = a + bx + Stuff• Stuff (a set of control variables) is included to make
other things being equal (ceteris paribus) than x.• It’s often hard to know whether Stuff is sufficient or
not.

Endogeneity (1)• Violation of the assumption of ceteris paribus• Two main sources
• Omitted variable bias (residual confounding)• Risk of lung cancer = # Lighters in in house + X
• Reverse causality (simultaneity)• Rates of violent crimes = # Police officers + X
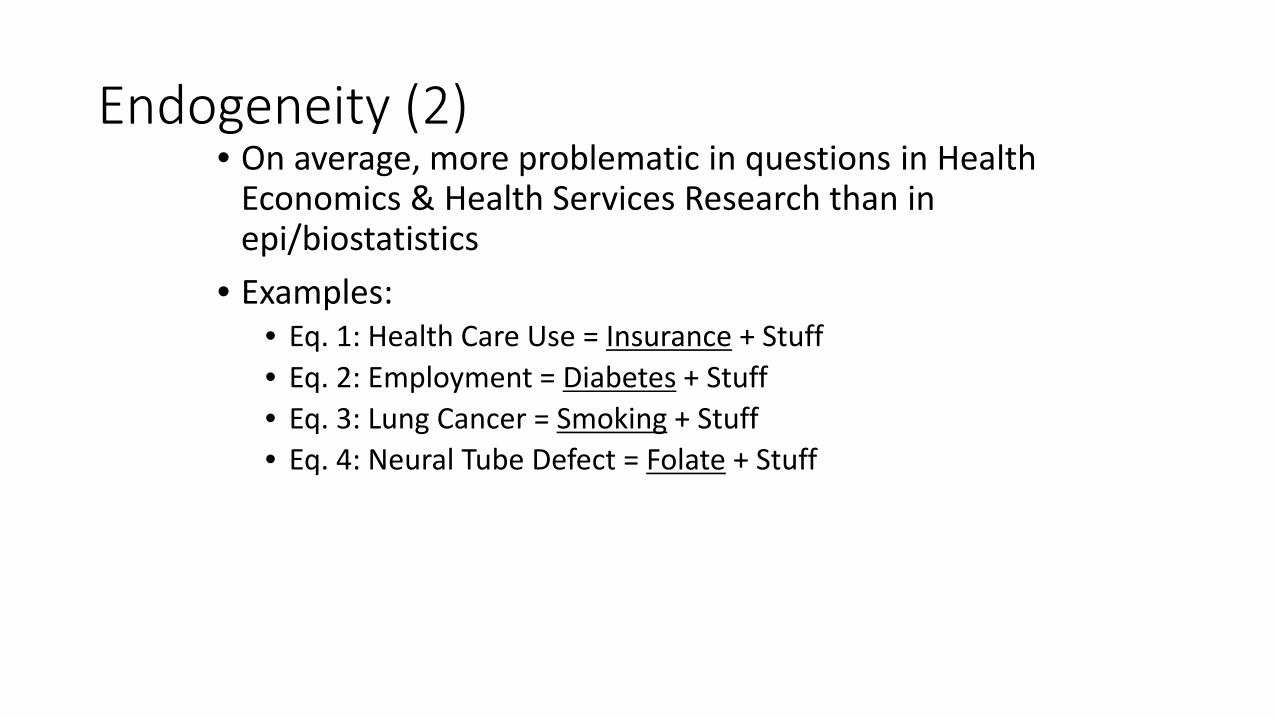
Endogeneity (2)• On average, more problematic in questions in Health
Economics & Health Services Research than in epi/biostatistics
• Examples:• Eq. 1: Health Care Use = Insurance + Stuff• Eq. 2: Employment = Diabetes + Stuff• Eq. 3: Lung Cancer = Smoking + Stuff• Eq. 4: Neural Tube Defect = Folate + Stuff
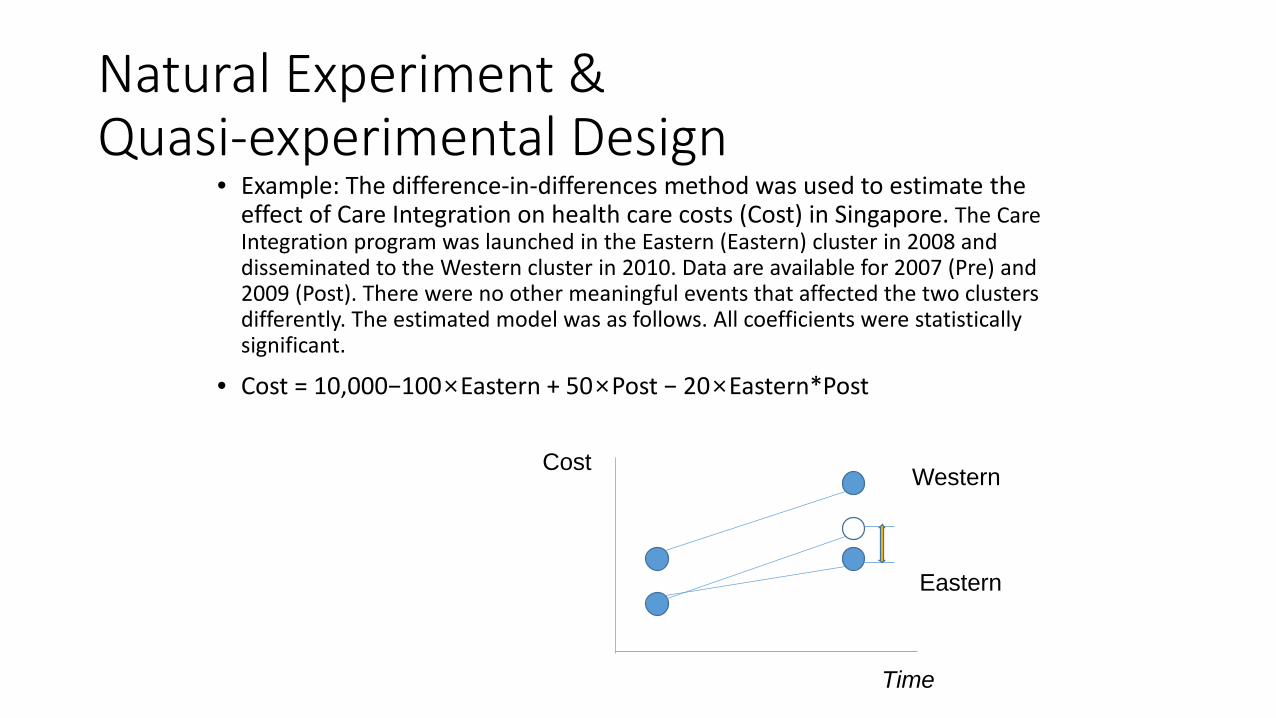
Natural Experiment & Quasi-experimental Design
• Example: The difference-in-differences method was used to estimate the effect of Care Integration on health care costs (Cost) in Singapore. The Care Integration program was launched in the Eastern (Eastern) cluster in 2008 and disseminated to the Western cluster in 2010. Data are available for 2007 (Pre) and 2009 (Post). There were no other meaningful events that affected the two clusters differently. The estimated model was as follows. All coefficients were statistically significant.
• Cost = 10,000−100×Eastern + 50×Post − 20×Eastern*Post
Time
Western
Eastern
Cost

Modeling of variables of health care use and health behaviors
• Example• Health care use and expenditure• Cigarette use
• Features• Participant vs. non-participant• Among participants, right-skewed distribution
• Modeling• Two-part model: Logit for participation, Logged y for participants• Count model