1 香港僱員信心、工作滿意度 及勞資關係調查 employee confidence, job satisfaction...
Post on 21-Dec-2015
225 views
TRANSCRIPT

1
香港僱員信心、工作滿意度及勞資關係調查
Employee Confidence, Job Satisfaction and Industrial Relations Survey
香港城市大學管理學系應用研究梁覺博士、葉景明博士
Applied Research Conducted by Prof. Kwok LEUNG and Dr. Olivia IP
Department of Management, City University of Hong Kong
Press Release on 02 May 2006

2
背景資料 Background Information
• 調查旨在了解香港僱員對目前工作的信心指數,及工作滿意度和勞資關係。
• 調查以電話訪問進行,於 2006 年 3 月 24 日至 4 月 8 日期間成功訪問本港 925 位 18 歲或以上,現正全職工作的僱員。
• 調查的結果可幫助上司了解僱員的心態及需要,從而知道如何提升僱員的工作滿意度及競爭能力,亦可以協助僱員對這方面加深了解,促進勞資之間溝通,及對自己的職業規劃作出妥善安排。
• The survey aims at understanding the confidence of Hong Kong employees towards their jobs, their job satisfaction and their perception of industrial relations.
• It was conducted during March 24 – April 8, 2006. A total of 925 Hong Kong citizens aged 18 or above, currently holding a full time job, were interviewed.

3
樣本概況 Sample Overview• 樣本總數: 925• 性別:男 (56%) / 女 (44%)• 年齡: 30 以下 (25%) / 30 – 39 (29.4%) / 40 或以上 (45.5%)• 婚姻狀況:未婚 (36.8%) / 已婚 (61.7%)• 職級:低層 (40.5%) / 中層 (51.9%) / 高層 (7.6%)• 教育程度:小學及中學 (60.3%) / 大專或以上 (39.7%)• 在公司工作平均年數:七年
• Total sample: 925• Sex: Male (56%) / Female (44%)• Age: Below 30 (25%) / 30 – 39 (29.4%) / 49 or above (45.5%)• Marriage status: Single (36.8%) / Married (61.7%)• Job position: Lower level (40.5%) / Middle level (51.9%) / Upper level (7.6
%)• Education level: Primary and Secondary (60.3%) / Tertiary or above (39.7
%)• Average year of working with the current company: 7 years

4
香港僱員信心指數 Hong Kong Employee Confidence Index
(HKECI)

5
• 香港僱員信心指數 (HKECI – 簡稱 ECI ) 量度僱員對工作上不同層面的樂觀及滿意程度。
• ECI 內的 10 題問題包括 3 個方面:工作滿意度、工作安全感,及工作前景。
• Hong Kong Employee Confidence Index (HKECI – shortened to ECI ) aims to measure employees’ views and satisfaction towards various aspects of their jobs.
• The 10 questions in ECI fall into 3 categories: Well-Being, Job Security, and Job Prospect.

6
• ECI 是以 0-10 分來評分,分數越高便表示僱員的信心越高。
• 此外,受訪者也被問及對目前香港的就業市場的看法。
• ECI is measured on a scale of 0-10. A higher score represents a higher overall confidence of the employee.
• In addition, respondents were also asked about their views on the overall job market in Hong Kong.

7
僱員信心指數 – 分層分析及與 2005 年比較ECI – Analyses by Sectors and Comparis
on with 2005

8
Employee Confidence Index (ECI) 僱員信心指數Well-Being 工作滿意度
6.42
6.81
7.04
7.56
6.12
6.15
6.72
7.21
2 4 6 8 10
Being appreiciated by boss被上司賞識
Clear company goals 清晰的公司目標
Job performance 個人工作表現
Relationship w/ colleagues和其他同事的關係
Mean 平均值
05'
06'
11-point scale: 0 – lowest; 10 – highest
十一分制 : 0 – 最低 , 10 – 最高

9
Employee Confidence Index (ECI) 僱員信心指數Job Security 工作安全感
6.58
6.95
6.24
6.77
2 4 6 8 10
Optimistic companyprospect 對公司前景樂
觀
Maintain position 留任機會
Mean 平均值
05'
06'
11-point scale: 0 – lowest; 10 – highest
十一分制 : 0 – 最低 , 10 – 最高

10
Employee Confidence Index (ECI) 僱員信心指數
Job Prospect 工作前景
2.97
3.83
3.82
5.21
3.00
3.60
3.79
5.19
2 4 6 8
Opp. for promotion 晉升機 會
Opp. for salary raise 加薪機會
Opp. for finding a better job找到待遇更好的工作
Opp. for enhancing skills 提/升知識技能的機會
Mean 平均值
05'
06'
11-point scale: 0 – lowest; 10 – highest
十一分制 : 0 – 最低 , 10 – 最高

11
主要研究結果 (I) Major Findings (I)
• ECI 的工作滿意度及安全感比 2005 年進步,但在工作前景方面變化不大,只有在加薪機會比去年為好 ( 由 3.6 上升 3.83) ,這亦與整體薪酬趨勢調查一致。
• Well-being and Job Security of ECI are better than the results in 2005 but Job Prospect remains unchanged, except that opportunity for salary raise is better than that of 2005, which is consistent with recent pay trends.

12
Employee Confidence Index (ECI) 僱員信心指數
11-point scale: 0 – lowest; 10 – highest
十一分制 : 0 – 最低 , 10 – 最高
4.22
3.87
5.72
5.48
0 2 4 6 8
Mean 平均值
Overall job market整體就業市場
Overall ECI整體就業信心指數
05'
06'

13
Employee Confidence Index (ECI) 僱員信心指數
5.48
5.72
Mean平均值
26.0% 71.0% 3.0%
33.0% 65.0% 2.0%
0% 20% 40% 60% 80% 100%
06'
05'
Overall ECI 整體就業信心指數
Low 低 Medium 中 High 高
11-point scale: 0-4.9 low; 5-7.9 medium; 8-10 high
十一分制 : 0-4.9 低 ; 5-7.9 中 ; 8-10 高

14
ECI Subindexes 僱員信心指數分層分析
52.31% 45.84% 1.84%
11.14% 61.95% 26.91%
3.46% 79.03% 17.51%
0% 20% 40% 60% 80% 100%
ECI Subindex 3 Job ProspectECI 3 分層 工作前景
ECI Subindex 2 Job SecurityECI 2 分層 工作安全感
ECI Subindex 1 Well-BeingECI 1 分層 工作滿意度
Low 低 Medium 中 High 高
6.96
3.96
Mean平均值
11-point scale: 0-4 low; 5-8 medium; 9-10 high
十一分制 : 0-4 低 ; 5-8 中 ; 9-10 高
6.77
2006 2005
6.55
6.51
3.90

15
3.87
4.22
Mean平均值
11-point scale: 0-4 low; 5-8 medium; 9-10 high
十一分制 : 0-4 低 ; 5-8 中 ; 9-10 高
48.0% 50.0% 2.0%
56.9% 41.8% 1.3%
0% 20% 40% 60% 80% 100%
06'
05'
Overall Job Market 整體就業市場
Low 低 Medium 中 High 高

16
主要研究結果 (II) Major Findings (II)
• 本調查顯示香港僱員的就業信心只屬一般,平均有 5.72 分,但較 05 年略微上升大約百份之四。
• 約有七成的受訪者的就業信心指數是屬於中等。
• This survey shows that the employment confidence level of Hong Kong employees is moderate, with an ECI mean of 5.72. However, it is a bit 4% higher than year of 2005.
• About 70% of the respondents have an average level of ECI.

17
• 另外,香港僱員對香港的整體就業市場的信心中等偏下(平均 4.22 分) , 五成被訪者認為一般,這表示他們認為目前在香港「搵工」尚算可以。
• 相比起 05 年的平均 3.87 分,被訪者認為整體就業市場明顯改善了(平均 4.22 分)。
• There is relatively moderate optimism amongst employees in Hong Kong towards the overall job market (average score 4.22). About 50% of them think that it is moderate. For them, finding a job is not relatively difficult.
• Compared to ECI of 2005 (average score 3.87), respondents think that the overall job market has improved (average score 4.22).

18
• 工作滿意度 ( 平均值 6.96) 及工作安全感 ( 平均值6.77) 都比工作前景 ( 平均值 3.96) 為高,顯示出被訪者認為工作上及市場的環境比去年為好,但對於找到一份理想的工作還是信心不大。
• The mean scores of Well-being (6.96) and Job security (6.77) are higher than those of Job prospect (3.96), which shows that respondents regarded their well-being and the market as better than before, but they didn’t have enough confidence for finding a better job.

19
• 大部份受訪者對工作都有中等 (79.03%) 的滿意度;工作安全感方面,約有百分之六十一的受訪者表示感到中等的安全感,及超過兩成半受訪者感到有高的安全感;工作前景方面,超過一半受訪者(52.31%) 感到前景比較差,及約四成半只感到中等的工作前景。
• Most of the respondents (79.03%) reported a medium level of well-being. Regarding job security, about 61% of the respondents expressed a medium level, while over 25% reported a high level. For job prospect, over half of the respondents (52.31%) expressed a low level and about 45% expressed a medium level.

20
僱員信心指數 – 不同行業分析 ( 分層 )ECI – Analyses by Industry (by Sector)

21
ECI – Analyses by Industries 不同行業的信心指數
5.49 5.21
5.86 6.01
5.19
5.596.14
5.71
0
2
4
6
8
Mea
n 平均值Overall ECI 整體信心指數
Manufacturing 製造業
Construction 建造業
Wholesale, retail 批發、零售
Import & export traders 進出口貿易
Restaurants & hotels 飲食及酒店業
Transport, storage & communications運輸、倉庫及通訊業
Financing, insurance, real estate &business services金融、保險、地產及商用服務
Community, social & personal services社區、社會及個人服務業
(N = no. of respondents)
(N=77)
(N=97)
(N=84)
(N=102)
(N=61)
(N=84)
(N=148)
(N=200)
Mean ECI = 5.72
製造業 建造業 批發零售
進出口貿易
飲食及酒店業
運輸、倉庫及通訊
金融、保險地產
社區、社會及個人服務
11-point scale: 0 – lowest; 10 – highest
十一分制 : 0 – 最低 , 10 – 最高

22
Employee Confidence Index (ECI) 僱員信心指數Manufacturing 製造業
4.03
2.55
3.793.9
4.65
6.09
7.31
6.06
6.79
7.27
6.48
5.49
7.56
7.046.81
6.426.58
5.21
3.83
2.97
4.22
3.82
6.95
5.72
0
1
2
3
4
5
6
7
8
Overall ECI
Overall Mean整體平均值
Well-Being工作滿意度
11-point scale: 0-4 low; 5-8 medium; 9-10 high
十一分制 : 0-4 低 ; 5-8 中 ; 9-10 高
Job Security工作安全感
Job Prospect工作前景

23
Employee Confidence Index (ECI) 僱員信心指數Construction 建造業
3.77
2.44
2.69
3.44
4.63
5.786.
026.19
6.13
7.26
6.13
5.21
5.72
6.81
6.42
6.95
6.58
5.21
3.83
2.97
7.56
4.223.82
7.04
0
1
2
3
4
5
6
7
8
Overall ECI
Overall Mean整體平均值
Well-Being工作滿意度
11-point scale: 0-4 low; 5-8 medium; 9-10 high
十一分制 : 0-4 低 ; 5-8 中 ; 9-10 高
Job Security工作安全感
Job Prospect工作前景

24
Employee Confidence Index (ECI) 僱員信心指數Restaurants & hotels 飲食及酒店業
4.26
2.38
3.10
3.48
4.33
6.186.31
5.62
6.566.
74
7.21
5.19
5.72
7.56
7.046.81
6.42
6.956.58
5.21
3.83
2.97
4.223.82
0
1
2
3
4
5
6
7
8
Overall ECI
Overall Mean整體平均值
Well-Being工作滿意度
11-point scale: 0-4 low; 5-8 medium; 9-10 high
十一分制 : 0-4 低 ; 5-8 中 ; 9-10 高
Job Security工作安全感
Job Prospect工作前景

25
• 從行業方面,飲食及酒店業 ( 平均值 5.19) 、建造業 ( 平均值 5.21) 及製造業 ( 平均值 5.49) 從業員的信心指數比其他行業為低。
• Regarding industries, restaurants and hotels (average score 5.19), construction (average score 5.21) and manufacturing (average score 5.49) are worse than others.
主要研究結果 (III) Major Findings (III)

26
ECI Subindexes 製造業、建造業、飲食及酒店業僱員信心指數
6.6% 82% 11.4%
4.1% 77.3% 16.6%
3.9% 85.7% 10.4%
0% 20% 40% 60% 80% 100%
Restaurants & hotels飲食及酒店業
Construction 建造業
Manufacturing 製造業
Well-Being 工作滿意度
Low 低 Medium 中 High 高
6.7
Mean平均值
11-point scale: 0-4 low; 5-8 medium; 9-10 high
十一分制 : 0-4 低 ; 5-8 中 ; 9-10 高
6.8
6.5
(Overall mean: 6.96)

27
ECI Subindexes 製造業、建造業、飲食及酒店業僱員信心指數
11.5% 68.9% 19.6%
18.6% 70.1% 11.3%
13.0% 58.5% 28.5%
0% 20% 40% 60% 80% 100%
Restaurants & hotels 飲食及酒店業
Construction 建造業
Manufacturing 製造業
Job Security 工作安全感
Low 低 Medium 中 High 高
6.7
Mean平均值
11-point scale: 0-4 low; 5-8 medium; 9-10 high
十一分制 : 0-4 低 ; 5-8 中 ; 9-10 高
6.8
6.5
(Overall mean: 6.77)

28
ECI Subindexes 製造業、建造業、飲食及酒店業僱員信心指數
62.3% 37.7%
66% 34%
52% 45.5% 2.5%
0% 20% 40% 60% 80% 100%
Restaurants & hotels 飲食及酒店業
Construction 建造業
Manufacturing 製造業
Job Prospect 工作前景
Low 低 Medium 中 High 高
3.7
Mean平均值
11-point scale: 0-4 low; 5-8 medium; 9-10 high
十一分制 : 0-4 低 ; 5-8 中 ; 9-10 高
3.3
3.3
(Overall mean: 3.96)

29
主要研究結果 (IV) Major Findings (IV)• 三個行業都有中等的工作滿意度及安全感,但是
在工作前景方面,他們的平均值都屬於低。建造業、飲食及酒店業有超過六成受訪者感到較差的工作前景;而製造業的受訪者亦有超過五成感到較差的工作前景。
• The three industries reported moderate well-being and job security, but the mean score is low for job prospect. No respondent from the construction industry and restaurants and hotels industry expressed a high level of job prospect, but over 60% of the respondents reported a low level. Over 50% from the manufacturing industry also reported a low level of job prospect.

30
僱員信心指數 – 分層分析ECI – Analyses by Demographics

31
5.49
6.00
2
4
6
8
Mea
n 平均值
Male 男 Female 女
Employee Confidence Index by Gender僱員信心指數分層分析 – 性別
11-point scale: 0 – lowest; 10 – highest
十一分制 : 0 – 最低 , 10 – 最高

32
6.766.49
3.73
7.207.12
4.24
2
4
6
8
Mea
n 平均值
Male 男 Female 女Well-Being 工作滿意度 Job Security 工作安全感Job Prospect 工作前景
Employee Confidence Index by Gender僱員信心指數分層分析 – 性別
11-point scale: 0 – lowest; 10 – highest
十一分制 : 0 – 最低 , 10 – 最高

33
6.01 5.98
5.40
2
4
6
8
Mea
n 平均值
Below 30 years old 30歲以下
30-39 years old 30-39歲 40 years old or above 40歲或以上
Employee Confidence Index by Age Group僱員信心指數分層分析 – 年齡
11-point scale: 0 – lowest; 10 – highest
十一分制 : 0 – 最低 , 10 – 最高
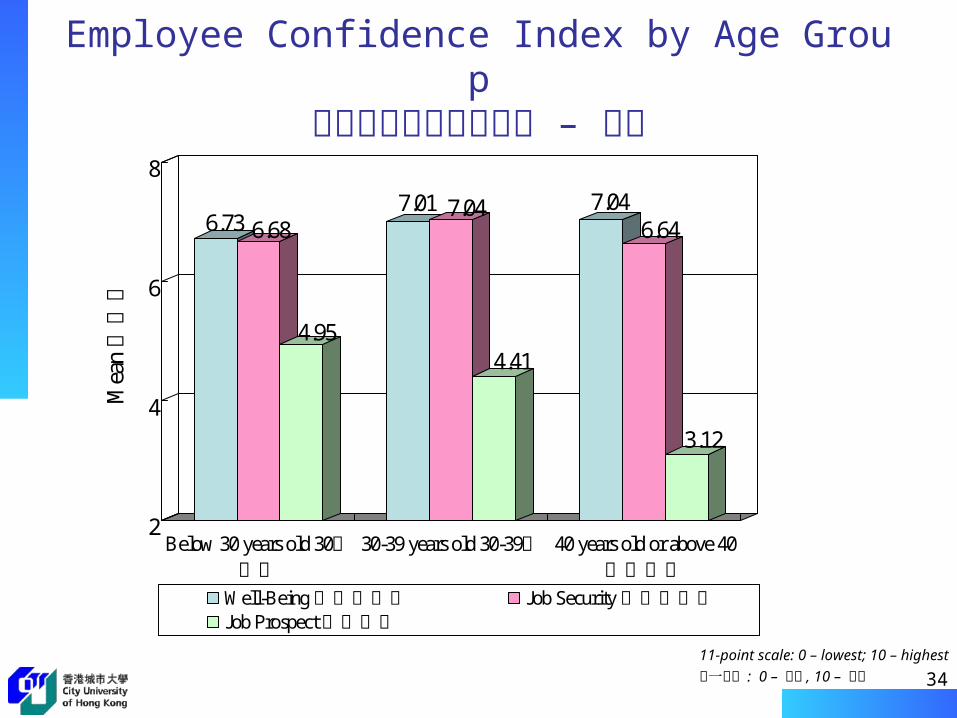
34
6.73 6.68
4.95
7.01 7.04
4.41
7.046.64
3.12
2
4
6
8
Mea
n 平均值
Below 30 years old 30歲以下
30-39 years old 30-39歲 40 years old or above 40歲或以上
Well-Being 工作滿意度 Job Security 工作安全感Job Prospect 工作前景
Employee Confidence Index by Age Group僱員信心指數分層分析 – 年齡
11-point scale: 0 – lowest; 10 – highest
十一分制 : 0 – 最低 , 10 – 最高

35
5.46
6.12
2
4
6
8
Mea
n 平均值
Primary and Secondary levels 小學及中學
Tertiary or above 大專或以上
Employee Confidence Index by Education Level僱員信心指數分層分析 – 學歷
11-point scale: 0 – lowest; 10 – highest
十一分制 : 0 – 最低 , 10 – 最高

36
6.886.55
3.49
7.07 7.11
4.67
2
4
6
8
Mea
n 平均值
Primary and Secondary levels 小學及中學
Tertiary or above 大專或以上
Well-Being 工作滿意度 Job Security 工作安全感Job Prospect 工作前景
Employee Confidence Index by Education Level僱員信心指數分層分析 – 學歷
11-point scale: 0 – lowest; 10 – highest
十一分制 : 0 – 最低 , 10 – 最高

37
5.29
5.966.36
2
4
6
8
Mea
n 平均值
Lower level 低層 Middle level 中層 Upper level 高層
Employee Confidence Index by Job Position僱員信心指數分層分析 – 職位
11-point scale: 0 – lowest; 10 – highest
十一分制 : 0 – 最低 , 10 – 最高

38
6.596.44
3.43
7.146.89
4.32
7.69 7.73
4.35
2
4
6
8
Mea
n 平均值
Lower level 低層 Middle level 中層 Upper level 高層Well-Being 工作滿意度 Job Security 工作安全感Job Prospect 工作前景
Employee Confidence Index by Job Position僱員信心指數分層分析 – 職位
11-point scale: 0 – lowest; 10 – highest
十一分制 : 0 – 最低 , 10 – 最高

39
主要研究結果 (V) Major Findings (V)
• 女性的信心指數較男性高。• 40 歲以上和學歷較低人士,信心指數最低。• 低職位人士相對於中級和高級職位人士,信心指
數較低。
• ECI of females is higher than that of males.• Employees aged above 40, and with less educat
ion tend to have lower ECI.• Compared with people holding middle or senior
positions, people in low-level positions tend to have lower ECI.

40
5.75
5.44
5.78
5.70
6.06
6.29
5.01
5.20
4.88
Elementary occupations 非技術工人
Plant, machine operators &assemblers機台及機器操作員及裝配員
Craft and related workers工藝及有關人員
Shop sales workers 商店銷售員
Service workers 服務工作文員
Clerks 文員
Associate professionals 輔助專業人員
Professionals 專業人員
Managers and administrators經理及行政人員
Mean 平均值
Employee Confidence Index by Occupations僱員信心指數分層分析 – 職業界別
Mean ECI = 5.72
(N=no. of respondents)
(N=150)
(N=119)
(N=109)
(N=223)
(N=111)
(N=38)
(N=62)
(N=46)
(N=38)
11-point scale: 0 – lowest; 10 – highest
十一分制 : 0 – 最低 , 10 – 最高

41
2.85
4.22
3.36
4.08
3.99
4.51
4.74
6.32
6.63
6.67
6.96
6.81
6.46
7.22
7.27
7.02
6.77
6.96
7.04
7.03
3.15
2.72
5.41
7.35
6.63
6.52
6.64
2 4 6 8
Elementary occupations 非技術工人
Plant, machine operators and assemblers機台、機器操作員及裝配員
Craft and related workers 工藝及有關人員
Shop sales workers 商店銷售員
Service workers 服務工作文員
Clerks 文員
Associate professionals 輔助專業人員
Professionals 專業人員
Managers and administrators 經理及行政人員
Mean 平均值
Well-Being 工作滿意度
Job Security 工作安全感
Job Prospect 工作前景
Employee Confidence Index by Occupations僱員信心指數分層分析 – 職業界別
11-point scale: 0 – lowest; 10 – highest
十一分制 : 0 – 最低 , 10 – 最高

42
主要研究結果 (VI) Major Findings (VI)
• 經理及行政人員及專業人員的信心指數最高,而工藝及有關人員及非技術工人的信心指數最低。
• Managers and administrators and professionals tend to have higher ECI, while craft and related workers in elementary occupations have lower ECI.

43
Employees’ Well-being Indexes僱員工作滿意度指標

44
• 僱員工作滿意度指標量度僱員對工作上不同方面的滿意程度。
• 這個指標共有 11條問題,包括對薪酬、福利及工作時數等的滿意程度。
• 這個指標是以 1 – 7 分來評分,分數越高便表示僱員的滿意度越高。
• Employees’ Well-being Index aims to measure employees’ satisfaction towards various aspects of their work.
• There are 11 questions in this index, including satisfaction about salary, fringe benefits and work hour, etc.
• The index is based on a scale of 1 – 7, and a higher score represents a higher overall satisfaction of the employees.

45
4.755.03
2.00
3.00
4.00
5.00
6.00
Mea
n 平均值
2005 2006
Overall Job Satisfaction整體僱員工作滿意指數
Employees’ Job Satisfaction 僱員工作滿意度指標
7-point scale: 1 – Extremely dissatisfied ; 7 – Extremely satisfied
七分制 : 1 – 極之不滿意 , 7 – 極之滿意

46
Employees’ Job Satisfaction 僱員工作滿意度指標
4.6
4.14
4.514.39
4.71 4.73
3.41 3.44
4.45
4.89
5.51
2
3
4
5
6
7
Salary 薪酬
Fringe ben
efits 福利
Work hour 工
作時數
Workload 工
作量
Work enviro
nment 工作環境
Opp. to use
personal
abilities 運
用個人才能的機會
Promotion
晉升機會
Training 提
供的培訓
Job secur
ity 工作保障
Relation with s
uperiors 與上司的關係
Relation with c
olleagues
與同事的關係
Mea
n 平均值
7-point scale: 1 – Extremely dissatisfied ; 7 – Extremely satisfied
七分制 : 1 – 極之不滿意 , 7 – 極之滿意

47
Job Satisfaction Ranking 工作滿意度排名
34.9%
28.7%
19.3%
14.1%
6%
16.6%
18.2%
15.1%
17.3%
14.2%
16.8%
20.8%
18.1%
18.6%
18.2%
9.6%
31.2%
31.9%
50%
54%
56.1%
55%
57.8%
62.8%
62.1%
67.7%
84.4%
52.2%
49.9%
29.7%
28.2%
21.4%
19.1%
0% 20% 40% 60% 80% 100%
Promotion 晉升機會
Training 提供的培訓
Fringe benefits 福利
Workload 工作量
Job security 工作保障
Work hour 工作時數
Salary 薪酬
Work environment 工作環境
Opportunity to use personal abilities 運用個人才能的機會
Relation with superior 與上司的關係
Relation with colleagues 與同事的關係
Low 低 Medium 中 High 高
5.5
Mean平均值
7-point scale: 1-3 low; 4 medium; 5-7 high
七分制 : 1-3 低 ; 4 中 ; 5-7 高
4.9
4.7
4.7
4.6
4.5
4.5
4.4
4.2
3.5
3.4
1
2
3
4
5
6
7
8
9
10
11

48
主要研究結果 (I) Major Findings (I)
• 本調查顯示香港僱員對整體工作滿意度較高,平均有 5.03 分。
• 僱員在工作上最滿意是與同事的關係,其次是與上司的關係及運用個人才能的機會。
• 至於最不滿意的是晉升機會及提供的培訓。
• Employees are most satisfied with their relationships with colleagues; the next is relationship with superiors, and opportunity to use personal abilities.
• They are least satisfied with promotion and training.

49
Employees’ Job Satisfaction – by Industry 僱員工作滿意度指標 – 行業
5.004.77
5.08 5.08 5.034.89
5.05 5.14
2.00
3.00
4.00
5.00
6.00
7.00
Manufacturing
製造業
Construction 建造
業
Wholesale, reta
il 批發、零售
Import & expor
t traders 進出
口貿易
Restaurants &
hotels 飲食及
酒店業
Transport, storage & communicat
ions 運輸、倉
庫及通訊業
Financing, insu
rance, real es
tate & busin
ess services 金
融、保險、地
產及商用服務
Communicty, socia
l & personal ser
vices 社區、社
會及個人服務
業
Mea
n 平均值
7-point scale: 1 – Extremely dissatisfied ; 7 – Extremely satisfied
七分制 : 1 – 極之不滿意 , 7 – 極之滿意
Mean JS = 5.03

50
Employees’ Job Satisfaction – Manufacturing Industry
僱員工作滿意度指標 – 製造業
5.27
4.81
3.99
3.223.
45
4.944.74
4.47
4.35
3.99
4.48
4.6
4.14
4.514.73
3.44
4.45
4.89
5.51
3.41
4.714.39
1
2
3
4
5
6
Salary 薪酬
Fringe benefits 福利
Work hour 工作時數
Workload 工作量
Work environment 工作環境
Opp. to use personal abilities 運用
個人才能的機會
Promotion 晉升機會
Training 提供的培訓
Job security 工作保障
Relation with superiors 與上司的關係
Relation with colleagues 與同事的關係
Overall Mean 整體平均值
7-point scale: 1 – Extremely dissatisfied ; 7 – Extremely satisfied
七分制 : 1 – 極之不滿意 , 7 – 極之滿意Higher than the respective mean 比對應平均值高Lower than the respective mean 比對應平均值低

51
Employees’ Job Satisfaction – Construction Industry
僱員工作滿意度指標 – 建造業
5.57
4.63
3.8
3.09
2.89
4.68
4.46
4.344.49
3.49
4.2
4.6
4.14
4.514.39
4.71 4.73
3.44
4.45
4.89
5.51
3.41
1
2
3
4
5
6
Salary 薪酬
Fringe benefits 福利
Work hour 工作時數
Workload 工作量
Work environment 工作環境
Opp. to use personal abilities 運用
個人才能的機會
Promotion 晉升機會
Training 提供的培訓
Job security 工作保障
Relation with superiors 與上司的關係
Relation with colleagues 與同事的關係
Overall Mean 整體平均值
7-point scale: 1 – Extremely dissatisfied ; 7 – Extremely satisfied
七分制 : 1 – 極之不滿意 , 7 – 極之滿意Higher than the respective mean 比對應平均值高Lower than the respective mean 比對應平均值低

52
Employees’ Job Satisfaction – Restaurants & Hotels Industry 僱員工作滿意度指標 – 飲食及酒店業
5.34
4.82
4.31
3.52
3.51
4.314.
59
4.52
4.16
4.034.
33
4.6
4.14
4.514.73
4.45
4.89
5.51
3.443.41
4.714.39
1
2
3
4
5
6
Salary 薪酬
Fringe benefits 福利
Work hour 工作時數
Workload 工作量
Work environment 工作環境
Opp. to use personal abilities 運用
個人才能的機會
Promotion 晉升機會
Training 提供的培訓
Job security 工作保障
Relation with superiors 與上司的關係
Relation with colleagues 與同事的關係
Overall Mean 整體平均值
7-point scale: 1 – Extremely dissatisfied ; 7 – Extremely satisfied
七分制 : 1 – 極之不滿意 , 7 – 極之滿意Higher than the respective mean 比對應平均值高Lower than the respective mean 比對應平均值低

53
5.00
5.10
5.00
5.24
5.02
4.81
4.87
5.11
4.97
3 4 5 6
Elementary occupations 非技術工人
Plant, machine operators &assemblers機台、機器操作員及裝配員
Craft and related workers工藝及有關人員
Shop sales workers 商店銷售員
Service workers 服務工作人員
Clerks 文員
Associate professionals 輔助專業人員
Professionals 專業人員
Managers and administrators經理及行政人員
Mean 平均值
Employees’ Job Satisfaction – by Occupation 僱員工作滿意度指標 – 職業界別
7-point scale: 1 – Extremely dissatisfied ; 7 – Extremely satisfied
七分制 : 1 – 極之不滿意 , 7 – 極之滿意
Mean JS = 5.03

54
4.805.13
5.60
2.00
3.00
4.00
5.00
6.00
7.00
Mea
n 平均值
Lower level 低層 Middle level 中層 Upper level 高層
Employees’ Job Satisfaction – by Job Position僱員工作滿意度指標 – 職位
7-point scale: 1 – Extremely dissatisfied ; 7 – Extremely satisfied
七分制 : 1 – 極之不滿意 , 7 – 極之滿意

55
4.945.14
2
4
6
8
Mea
n 平均值
Male 男 Female 女
Employees’ Job Satisfaction – by Gender 僱員工作滿意度指標 – 性別
7-point scale: 1 – Extremely dissatisfied ; 7 – Extremely satisfied
七分制 : 1 – 極之不滿意 , 7 – 極之滿意

56
4.845 5.16
2
4
6
8
Mea
n 平均值
Below 30 years old 30歲以下
30-39 years old 30-39歲 40 years old or above 40歲或以上
Employees’ Job Satisfaction – by Age Group 僱員工作滿意度指標 – 年齡
7-point scale: 1 – Extremely dissatisfied ; 7 – Extremely satisfied
七分制 : 1 – 極之不滿意 , 7 – 極之滿意

57
主要研究結果 (II) Major Findings (II)• 調查顯示屬於經理及行政人員的受訪者有最高的工作滿意
指數。• 而屬於工藝及有關人員和機台及機器操作員及裝配員的受
訪者則有較低的工作滿意指數。• 職位越高,女性和年紀越大的受訪者有較高的工作滿意度。
• This survey shows that respondents working as managers and administrators tend to have higher job satisfaction.
• Respondents working as craft and related workers, and plant and machine operators and assemblers have lower job satisfaction.
• Respondents who hold senior positions, or are female or older, tend to have higher job satisfaction.

58
Industrial Relations Index (IRI)勞資關係指數

59
• 勞資關係指數 (IRI) 是一個量度勞方及資方關係的指標。
• IRI 內的五條問題以 1 – 5 分來評分,分數越高表示僱員對勞資關係的看法比較正面。
• Industrial Relations Index (IRI) aims to measure the relation between labour and employers.
• The 5 questions in the IRI are based on a scale of 1 – 5, and a higher score represents a more positive view of labour relations.

60
Industrial Relations Index (IRI) 勞資關係指數
3.09
3.54
2.37
3.57
2.93
3.38
1.00 2.00 3.00 4.00 5.00
Consideration of both side's benefitswhen making decision by the employers資方作出決定時會照顧勞資雙方利益
Respect between employers andemployees 勞方方及資方互相尊重
*Hostility between employers andemployees 勞方及資方充滿敵意
Cooperation between employers andemployees 勞方和資方盡力合作
*Distrust between employers andemployees 勞方及資方互相不信任
Overall IRI 整體勞資關係指數
Mean 平均值
5-point scale: 1 – Extremely disagree; 5 – Extremely agree
五分制 : 1 – 極之不同意 , 5 – 極之同意
Mean IRI = 3.38
*Lower score represents better relation.低分表示良好關係

61
Industrial Relations Index (IRI) – Industry勞資關係指數 – 行業
3.38 3.46 3.40 3.46 3.40 3.303.47
3.353.23
1
2
3
4
Overall IRI 整體
勞資關係指數
Manufactur
ing 製造業
Constructio
n 建造業
Wholesale,
retail 批發
、零售
Import & exp
ort trader
s 進出口貿易
Restaurants
& hotels 飲食及酒店業
Transport, s
torage & com
munications
運輸、倉庫及通訊業
Financin
g, insuran
ce, real es
tate & busi
ness serv
ices 金融、保險、地產及商用服務
Community, soc
ial & pers
onal servi
ces 社區、社會及個人服務業
Mea
n 平均值
5-point scale: 1 – Extremely disagree; 5 – Extremely agree
五分制 : 1 – 極之不同意 , 5 – 極之同意
Mean IRI = 3.38

62
3.253.43
3.80
1.00
2.00
3.00
4.00
5.00
Mea
n 平均值
Lower level 低層 Middle level 中層 Upper level 高層
Industrial Relations Index (IRI) – Job Position勞資關係指數 – 職位
5-point scale: 1 – Extremely disagree; 5 – Extremely agree
五分制 : 1 – 極之不同意 , 5 – 極之同意
63
3.303.48
1.00
2.00
3.00
4.00
5.00
Mea
n 平均值
Male 男 Female 女
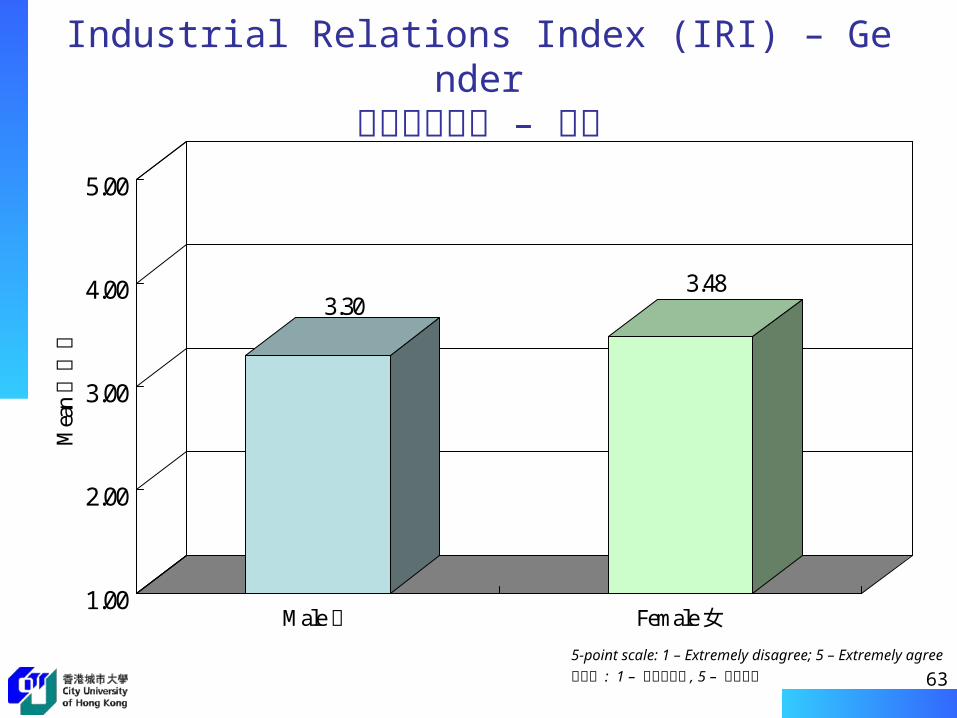
Industrial Relations Index (IRI) – Gender勞資關係指數 – 性別
5-point scale: 1 – Extremely disagree; 5 – Extremely agree
五分制 : 1 – 極之不同意 , 5 – 極之同意

64
3.49
3.35
3.36
3.35
3.40
3.59
3.10
3.28
3.19
1.00 2.00 3.00 4.00 5.00
Elementary occupations 非技術工人
Plant, machine operators &assemblers機台、機器操作員及裝配員
Craft and related workers工藝及有關人員
Shop sales workers 商店銷售員
Service workers 服務工作文員
Clerks 文員
Associate professionals 輔助專業人員
Professionals 專業人員
Managers and administrators經理及行政人員
Mean 平均值
Industrial Relations Index (IRI)– by Occupation 勞資關係指數 – 職業界別
5-point scale: 1 – Extremely disagree; 5 – Extremely agree
五分制 : 1 – 極之不同意 , 5 – 極之同意
Mean IRI = 3.38

65
主要研究結果 (I) Major Findings (I)
• 受訪者的評分為中間偏好,反映出勞資關係尚算協調。• 建造業的勞資關係指數較低。• 職位越高,勞資關係指數亦會越高,即是勞資關係越好。
• This survey shows that the industrial relations of Hong Kong employees is moderate, with an IRI mean of 3.38.
• Respondents from the construction industry have a lower IRI.
• The higher the position, the higher the IRI, which indicates a better relation between the employers and employees.

66
• 女性的勞資關係指數較男性高。• 經理及行政人員及商店銷售員的勞資關係指數較
高;而非技術工人及工藝及有關人員的勞資關係指數較差。
• Female respondents reported a higher IRI than male respondents.
• Respondents working as managers and administrators and shop sales workers reported a higher IRI, while craft and related workers and respondents working in elementary occupations indicated a lower IRI.