1 recipient of james watt gold medal united nations association march 18th 2011 the twin challenges...
TRANSCRIPT

1
Recipient of James Watt Gold Medal
United Nations AssociationMarch 18th 2011
The twin challenges facing the world: Energy Security and Climate Change: Hard Choices Ahead
Keith Tovey ( 杜伟贤 ) M.A., PhD, CEng, MICE, CEnvReader Emeritus: University of East Anglia
2
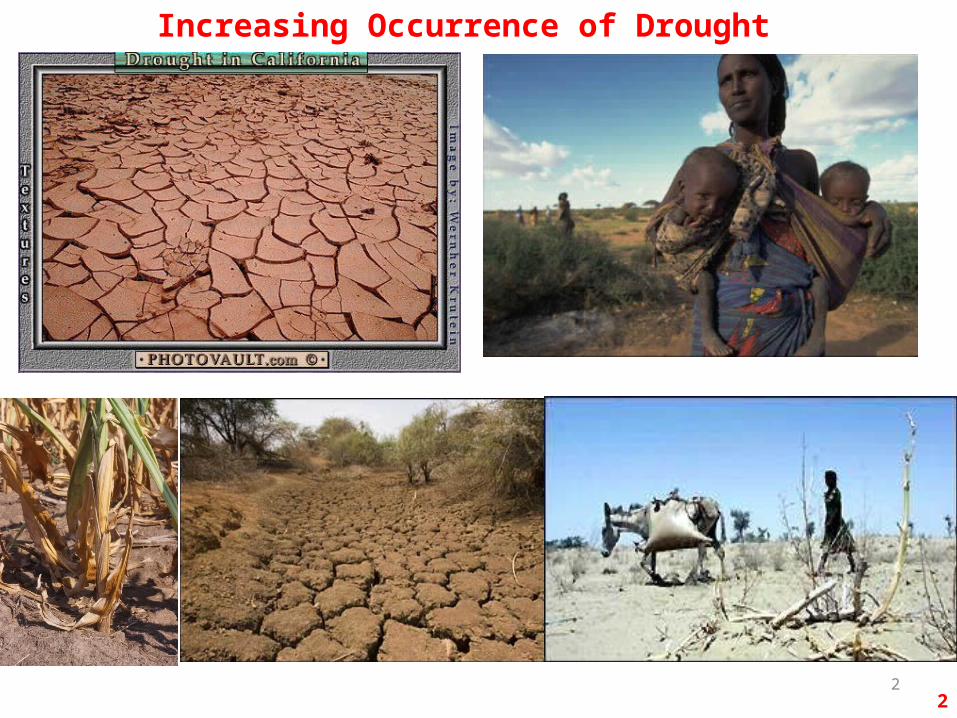
Increasing Occurrence of Drought
2

3
Increasing Occurrence of Flood
3

4
19792003
Climate Change: Changes in the Artic 1979 - 2003
• Summer ice coverage of Arctic Polar Region
• NASA satellite imagery• في الجليد الصيف
الشمالي القطبالمنطقة تغطيةالقطبيه
• الصور ناساالفضاءيه
Source: Nasa http://www.nasa.gov/centers/goddard/news/topstory/2003/1023esuice.html
•20% reduction in 24 years
في ٪ 20• سنوات 24تخفيض
المناختغير كاب القطبيه الجليديه على 2003 - 1979 اثار
44

Is Global Warming natural or man-made?
Natural causes• Earth’s Orbit• Sunspot Activity• Volcanic Eruptions • Etc.
Reasonable agreement up to ~ 1960
Man-made causes do not show particularly good agreement in early part of period.
BUT including both man- made and natural gives good agreement
5

Global Surface TemperatureIn 2010 we had one of the warmest ever January – February periods. Some people say surely it was coldest for 30 yearsBut why do people not account for the record breaking high
temperatures in the tropics, Australia etc?5th Warmest -
6

• Winter: October – March: • Summer: April to September• Compared to 1960 – in 2010,
– 13.1% less heating needed– And 106% more cooling.
Temperature variations in East Anglia
Temperature rise in East Anglia over last 50 years is unequivocal
2010 was one a particularly warm year despite cold spells in Europe in January and December
NASA says it tied as being warmest
www.nasa.gov/home/hqnews/.../HQ_11-014_Warmest_Year.htm
7

8Per capita Carbon Emissions
UK
How does UK compare with other countries?
Why do some countries emit more CO2 than others?
What is the magnitude of the CO2 problem?
France
8

9
Carbon Emissions and Electricity
UK
France
9

r
10
Electricity Generation i n selected Countries
10

0
20
40
60
80
100
120
140
2000 2004 2008 2012 2016 2020
Bil
lion
cu
bic
met
res
Actual UK production
Actual UK demandProjected productionProjected demand
Import Gap
Whether we believe in Climate Change or not Energy Security is a critical issue for the UK
On 13th Jan 2010: UK Production was only 41%: 14% from storage and 44% imports. In January 2011: Uk Production < 40% 11

12
Options for Electricity Generation in 2020 - Non-Renewable Methods
UK becomes net importer of gas
Completion of Langeled Gas Line to Norway
Oil reaches $140 a barrel
Wholesale Electricity Price surge in January and December 2010 when Gas imports are high.
Gas CCGT0 - 80%
(currently 45-50%)
Available now (but is now running out
rapidly~2p +
Potential contribution to supply in 2020
Original Projection (energy Review 2002) p /
kWh
Projections (Jan 2011) Electricity Market Reform/
FITs
~8.3p +/- 3p
UK Gas Supply @ 11:00am on 15th March 2011
12

New Coal ~ 10.5p with CCS ~ 13.5p
"Clean Coal"
Coal currently ~40% but
scheduled to fall
Available now: Not viable without Carbon Capture & Sequestration
2.5 - 3.5p
nuclear fusion unavailablenot available until 2040 at earliest not until 2050 for
significant impact
13
Options for Electricity Generation in 2020 - Non-Renewable Methods
Gas CCGT0 - 80%
(currently 45-50%)
Available now (but is now running out
rapidly~2p +
Potential contribution to supply in 2020
Original Projection (energy Review 2002) p /
kWh
Projections (Jan 2011) Electricity Market Reform/
FITs
~8.3p +/- 3p
nuclear fission (long term)
0 - 20% (France 80%) - (currently 18%
and falling)
new inherently safe designs - some
development needed2.5 - 3.5p
~ 9.7p for 1st new nuclear
subsequently 7.0p
Nuclear New Build assumes one new station is completed each year after 2020.
0
2000
4000
6000
8000
10000
12000
14000
1950 1960 1970 1980 1990 2000 2010 2020 2030 2040
Inst
all
ed
Cap
acit
y (
MW
)
New Build ?
ProjectedActual
Carbon sequestration either by burying it or using methanolisation to create a new transport fuel will not be
available at scale required until mid 2020s if then
?
13

14
Options for Electricity Generation in 2020 - Renewable
ResourcePotential contribution to electricity
supply in 2020 and drivers/barriers
Original estimate of cost (p / kWh)
Latest projections [Gas ~8.3
p/kWh]
On Shore Wind
~25% [~15000 x 3 MW turbines]
available now for commercial exploitation
~ 2+p ~8.8p +/- 0.8p
Future prices from DECC Consultation Document on Electricity Market Reform Jan 2011.

15
Options for Electricity Generation in 2020 - Renewable
On Shore Wind
~25% [~15000 x 3 MW turbines]
available now for commercial exploitation
~ 2+p ~8.8p +/- 0.8p
ResourcePotential contribution to electricity
supply in 2020 and drivers/barriers
Original estimate of cost (p / kWh)
Latest projections [Gas ~8.3
p/kWh]
Off Shore Wind
25 - 50%Some development needed to reduce
costs.~2.5 - 3p
~13.5 -14p for early projects ~11.5p later
Scroby Sands had a Load factor of 28.8% but nevertheless produced sufficient electricity on average for 2/3rds of demand of houses in Norwich. At Peak time sufficient for all houses in Norwich and Ipswich

16
Options for Electricity Generation in 2020 - Renewable
On Shore Wind
~25% [~15000 x 3 MW turbines]
available now for commercial exploitation
~ 2+p ~8.8p +/- 0.8p
Off Shore Wind
25 - 50%
some technical development
needed to reduce costs.
~2.5 - 3p~13.5 -14p for early projects ~11.5p later
ResourcePotential contribution to electricity
supply in 2020 and drivers/barriers
Original estimate of cost (p / kWh)
Latest projections [Gas ~8.3
p/kWh]
Hydro (mini - micro)
5%technically mature,
but limited potential
2.5 - 3p11p for 2MW
projects
Micro Hydro Scheme operating on Siphon Principle installed at Itteringham Mill,
Norfolk.
Rated capacity 5.5 kW
Future prices from Electricity Market Reform for Wind or RO/FITs for other technologies

On Shore Wind ~25% [~15000 x 3 MW turbines]
available now for commercial exploitation
~ 2+p ~8.8p +/- 0.8p
Off Shore Wind
25 - 50%
some technical development
needed to reduce costs.
~2.5 - 3p~13.5 -14p for early projects ~11.5p later
Hydro (mini - micro) 5%
technically mature, but limited potential
2.5 - 3p11p for 2MW
projects
ResourcePotential contribution to
electricity supply in 2020 and drivers/barriers
Original estimate of cost (p / kWh)
Latest projections [Gas ~8.3
p/kWh]
Options for Electricity Generation in 2020 - Renewable
Photovoltaic
<<5% even assuming 10
GW of installation
available, research needed to bring
down costs15+ p ~27 - 41p
Future prices from Electricity Market Reform for Wind or RO/FITs for other technologies17

On Shore Wind ~25 available now ~ 2+p ~8.8p +/- 0.8p
Off Shore Wind 25 - 50% available now ~2.5 - 3p ~11.5 -14p
Hydro (mini - micro)
5% limited potential 2.5 - 3p 11p for 2MW
Photovoltaic <<5%available, but
costly15+ p ~27 - 41p
Sewage, Landfill, Energy Crops/ Biomass/Biogas
??5% available, but research needed in some areas
2.5 - 4p7 - 13p depending on technology
Future prices from Electricity Market Reform for Wind or RO/FITs for other technologies
ResourcePotential contribution to electricity supply in 2020
Original estimate of cost (p / kWh)
Latest projections [Gas ~8.3
p/kWh]
Options for Electricity Generation in 2020 - Renewable
Transport Fuels:
• Biodiesel?
• Bioethanol?
• Compressed gas from methane from waste.
To provide 5% of UK electricity needs will require area of Norfolk and Suffolk devoted to biomass
18

On Shore Wind ~25 available now ~ 2+p ~8.8p +/- 0.8pOff Shore Wind 25 - 50% available now ~2.5 - 3p ~11.5 -14pHydro (mini - micro)
5% limited potential 2.5 - 3p 11p for 2MW
Photovoltaic <<5%available, but
costly15+ p ~27 - 41p
Biomass ??5% available, but research needed
2.5 - 4p7 - 13p depending on technology
ResourcePotential contribution to electricity supply in 2020
Original estimate of cost (p / kWh)
Latest projections [Gas ~8.3
p/kWh]
Options for Electricity Generation in 2020 - Renewable
Future prices from Electricity Market Reform for Wind or RO/FITs for other technologies
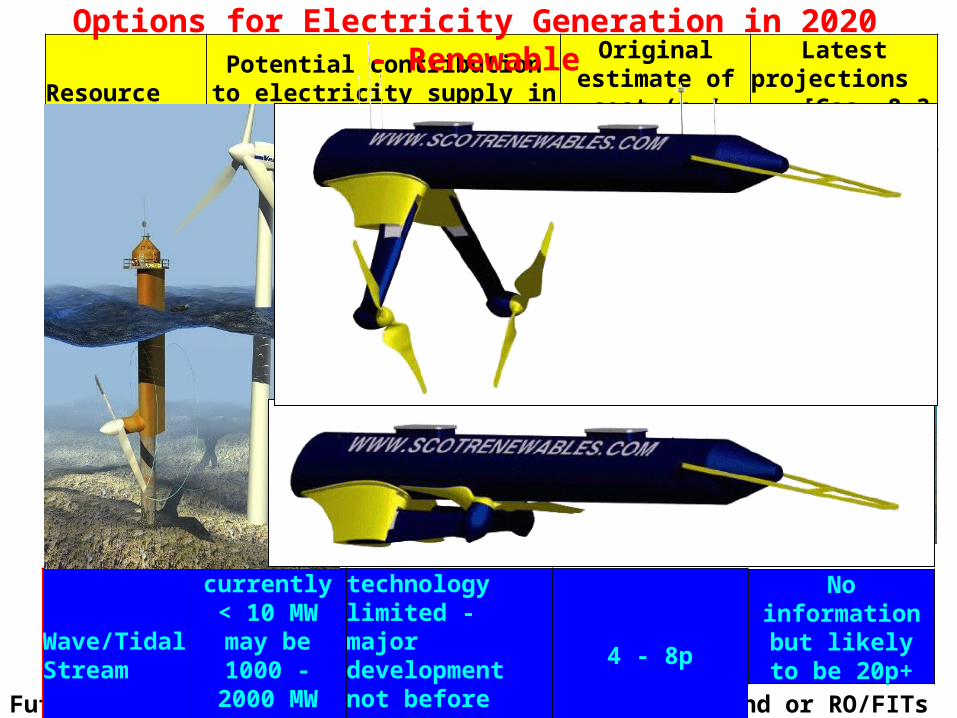
Wave/Tidal Stream
currently < 10 MW may be 1000 - 2000
MW (~0.1%)
technology limited - major development not before 2020
4 - 8pNo information but likely to be
20p+19
On Shore Wind ~25 available now ~ 2+p ~8.8p +/- 0.8pOff Shore Wind 25 - 50% available now ~2.5 - 3p ~11.5 -14pHydro (mini - micro)
5% limited potential 2.5 - 3p 11p for 2MW
Photovoltaic <<5%available, but
costly15+ p ~27 - 41p
Biomass ??5% available, but research needed
2.5 - 4p7 - 13p depending on technology
ResourcePotential contribution to electricity supply in 2020
Original estimate of cost (p / kWh)
Latest projections [Gas ~8.3
p/kWh]
Options for Electricity Generation in 2020 - Renewable
Future prices from Electricity Market Reform for Wind or RO/FITs for other technologies
Wave/Tidal Stream
currently < 10 MW may be 1000 - 2000
MW (~0.1%)
technology limited - major development not before 2020
4 - 8pNo information but likely to be
20p+
Wave/Tidal Stream
~0.1% technology limited - 4 - 8p 20p+ ??
Future prices from Electricity Market Reform for Wind or RO/FITs for other technologies
ResourcePotential contribution to electricity supply in 2020
Original estimate of cost (p / kWh)
Latest projections [Gas ~8.3
p/kWh]On Shore Wind ~25 available now ~ 2+p ~8.8p +/- 0.8pOff Shore Wind 25 - 50% available now ~2.5 - 3p ~11.5 -14pHydro (mini - micro)
5% limited potential 2.5 - 3p 11p for 2MW
Photovoltaic <<5%available, but
costly15+ p ~27 - 41p
Biomass ??5% available, but research needed
2.5 - 4p7 - 13p depending on technology
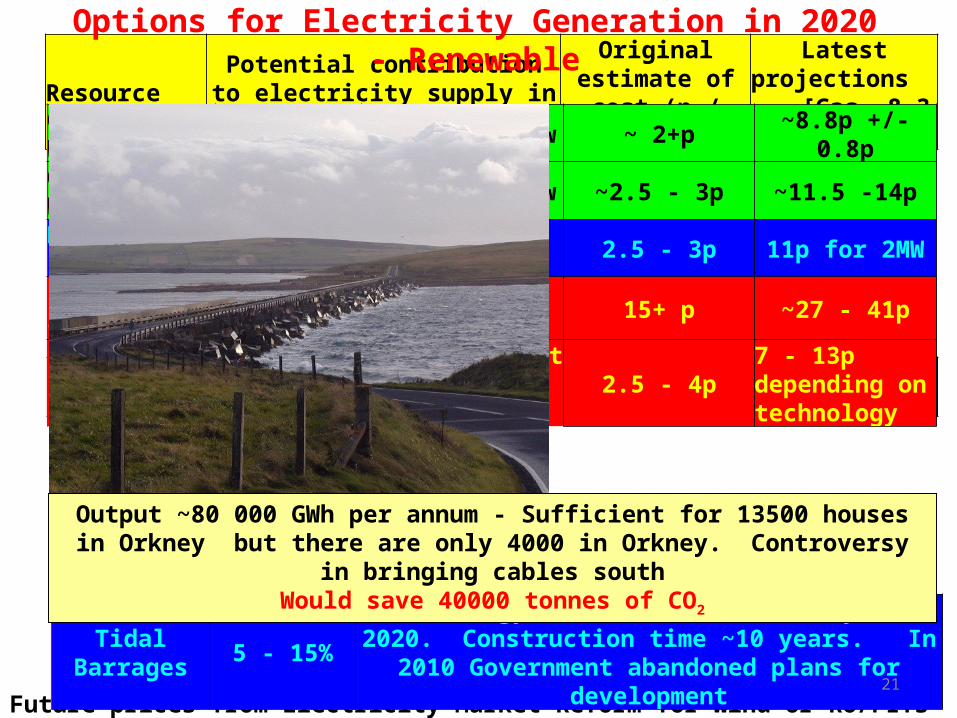
Tidal Barrages 5 - 15%technology available but unlikely for 2020. Construction time ~10 years. In 2010 Government abandoned plans
for development
Output ~80 000 GWh per annum - Sufficient for 13500 houses in Orkney but there are only 4000 in Orkney. Controversy in bringing cables south
Would save 40000 tonnes of CO2
Options for Electricity Generation in 2020 - Renewable
21

Wave/Tidal Stream
~0.1% technology limited - 4 - 8p 20p+ ??
Future prices from Electricity Market Reform for Wind or RO/FITs for other technologies
ResourcePotential contribution to electricity supply in 2020
Original estimate of cost (p / kWh)
Latest projections [Gas ~8.3
p/kWh]On Shore Wind ~25 available now ~ 2+p ~8.8p +/- 0.8pOff Shore Wind 25 - 50% available now ~2.5 - 3p ~11.5 -14pHydro (mini - micro)
5% limited potential 2.5 - 3p 11p for 2MW
Photovoltaic <<5%available, but
costly15+ p ~27 - 41p
Biomass ??5% available, but research needed
2.5 - 4p7 - 13p depending on technology
Tidal Barrages 5 - 15%technology available but unlikely for 2020.
Construction time ~10 years. In 2010 Government abandoned plans for development
Options for Electricity Generation in 2020 - Renewable
Geothermal unlikely for electricity generation before 2050 if then -
not to be confused with ground sourced heat pumps which consumed electricity
22

23
Do we want to exploit available renewables i.e onshore/offshore wind and biomass?.
Photovoltaics, tidal, wave are not options for next 20 years.
If our answer is NO
Do we want to see a renewal of nuclear power ?
Are we happy on this and the other attendant risks?
If our answer is NO
Do we want to return to using coal? •then carbon dioxide emissions will rise significantly
•unless we can develop carbon sequestration within 10 years UNLIKELY
If our answer to coal is NO
Do we want to leave things are they are and see continued exploitation of gas for both heating and electricity generation? >>>>>>
Our Choices: They are difficult

24
Our Choices: They are difficult
If our answer is YES
By 2020 • we will be dependent on GAS
for around 70% of our heating and electricity
imported from countries like Russia, Iran, Iraq, Libya, Algeria
Are we happy with this prospect? >>>>>>If not:
We need even more substantial cuts in energy use.
Or are we prepared to sacrifice our future to effects of Global Warming? - the North Norfolk Coal Field?
Do we wish to reconsider our stance on renewables?
Inaction or delays in decision making will lead us down the GAS option route and all the attendant Security issues that raises.

0
50
100
150
200
250
300
350
400
450
1970 1975 1980 1985 1990 1995 2000 2005 2010 2015 2020
bil
lio
ns
of
kWh
nuclear new nuclear coal
new coal oil renewablesgas medium renewables high renewables
Our looming over-dependence on gas for electricity generation
We need an integrated energy supply which is diverse and secure.
We need to take Energy out of Party Politics.! 25

26
How many people know what 9 tonnes of CO2 looks like?
5 hot air balloons per person per year.
On average each person in UK causes the emission of 9 tonnes of CO2 each year.
"Nobody made a greater mistake
than he who did nothing because he thought he could do only a little."
Edmund Burke (1727 – 1797)

27
Raising Awareness
• A Toyota Corolla (1400cc): 1 party balloon every 60m.
• 10 gms of carbon dioxide has an equivalent volume of 1 party balloon.
• Standby on electrical appliances up to 20 - 150+ kWh a year - 7500 balloons. (up to £15 a year)
• A Mobile Phone charger: > 10 kWh per year ~ 500 balloons each year.
• Filling up with petrol (~£50 for a full tank – 40 litres) --------- 90 kg of CO2 (5% of one hot air balloon)
How far does one have to drive in a small family car (e.g. 1400 cc Toyota Corolla) to emit as much carbon dioxide as heating an old persons room for 1 hour?
1.6 miles
At Gao’an No 1 Primary School in Xuhui District, Shanghai
上海徐汇区高第一小学
• A tumble dryer uses 4 times as much energy as a washing machine. Using it 5 times a week will cost ~ £100 a year just for this appliance alone and emit over half a tonne of CO2.
School children at the Al Fatah University, Tripoli, Libya

28
0
1000
2000
3000
4000
0 1 2 3 4 5 6
kWh
in p
erio
d
No of people in household
Electricity Consumption
1 person2 people3 people4 people5 people6 people
• Social Attitudes have a profound effect on actual electricity consumption
• For a given size of household electricity consumption for appliances [NOT HEATING or HOT WATER or COOKING] can vary by as much as 9 times.
Data courtesy of Karla Alcantar
• Significant savings in money can arise from effective awareness raising
• When income levels are accounted for, variation is still 6 times
Raising Awareness
28

Average Domestic Consumption of Electricity
kWh % cost Rank kWh % cost RankNorwich 3,535 79% 6 Breckland 5,028 112% 312Cambridge 4,050 90% 80 East Cambridgeshire 5,118 114% 326Peterborough 4,222 94% 116 Forest Heath 5,174 116% 336Ipswich 4,349 97% 159 Babergh 5,252 117% 343Waveney 4,417 99% 181 South Norfolk 5,347 119% 358Broadland 4,618 103% 231 Suffolk Coastal 5,371 120% 360North Hertfordshire
4,645 104% 240South Cambridgeshire
5,498 123% 374
Huntingdon 4,655 104% 243 North Norfolk 5,641 126% 385Great Yarmouth 4,699 105% 252 Mid Suffolk 5,723 128% 390
St Edmundsbury 4,869 109% 280King's Lynn and West Norfolk
5,731 128% 393
Fenland 4,899 109% 287 Uttlesford 5,884 131% 396UK Average 4478 District 1080 4,942
Consumption of Local Authority Districts, • % of average cost of electricity bills compared to National Average • Rank position in UK out of 408 Local Authorities
In Norwich average household emits 1.87 tonnes of CO2
In Uttlesford 3.12 tonnes of CO2
Raising Awareness - there is wide geographic variation
29

30
Involving the local Community -The BroadSol Project
Annual Solar Gain 826 kWh
Solar Collectors installed 27th January 2004
Members of community agreed to purchase Solar Panels at same time. Significantly reduced costs
Overall Solar Energy Gain
0
1
2
3
4
5
Jan Feb Mar Apr May Jun Jul Aug Sep Oct Nov Dec
kWh
per d
ay
2007 20082009 2010

31
Ways to Respond to the Challenge: Technical Solutions: Solar Photovoltaic
Photovoltaic cells are expensive, but integration of ideas is needed.
Output depends on orientation and type but varies from ~70kWh to ~100kWh per square meter per year.
The New Feed In Tariff since April 1st 2010 has made things more attractive. 41.3p per unit generated – an extra 3p if exported.
But those who have installed PV will get the benefit from increased payments for electricity by those who have not.

32
Energy Source Scale Generation Tariff (p/kWh) Duration
< 31/03/2012 > 01/04/12 (years)
Anaerobic digestion ≤500kW 11.5 11.5 20Anaerobic digestion >500kW 9 9 20Hydro ≤15 kW 19.9 19.9 20Hydro >15 - 100kW 17.8 17.8 20Hydro >100kW - 2MW 11 11 20Hydro >2kW - 5MW 4.5 4.5 20Micro-CHP***** <2 kW 10 10 10Solar PV ≤4 kW new 36.1 33.0 25Solar PV ≤4 kW retrofit 41.3 37.8 25Solar PV >4-10kW 36.1 33.0 25Solar PV >10 - 100kW 31.4 28.7 25Solar PV >100kW - 5MW 29.3 26.8 25Solar PV Standalone 29.3 26.8 25Wind ≤1.5kW 34.5 32.6 20Wind >1.5 - 15kW 26.7 25.5 20Wind >15 - 100kW 24.1 23.0 20Wind >100 - 500kW 18.8 18.8 20Wind >500kW - 1.5MW 9.4 9.4 20Wind >1.5MW - 5MW 4.5 4.5 20Existing generators transferred from RO 9 9 to 2027
Feed in Tariffs – Introduced 1st April 2010
** for first 20000 installations Emergency Review for PV > 50kW announced 09/02/2011

Levels of supportTariff name Eligible
technology Eligible sizes Tariff rate
(p/kWh) duration(Years)
Small biomass Solid biomass;
Municipal Solid Waste (incl. CHP)
Less than 200 kWth
Tier 1: 7.6Tier 2: 1.9
20
Medium biomass
200 kWth and above; less than 1,000 kWth
Tier 1: 4.7Tier 2: 1.9
Large biomass
1,000 kWth and above
2.6
Small ground source
Ground-source heat pumps; Water-source heat pumps; deep geothermal
Less than 100 kWth 4.3
20 Large ground source
100 kWth and above 3
Solar thermal
Solar thermal Less than 200 kWth
8.5 20
Renewable Heat Incentive – Announced 10th March 2011
Note: there are significant changes to the RHI since it was first proposed in March 2010
33

34
1.33 billion people
0.94 billion people
Raw materials
1.03 billion people
Products: 478 M
tonnes
CO 2 increase in
3 years
Aid
& E
du
cation
The Unbalanced Triangular Trade
Each person in Developed Countries has been responsible for an extra 463 kg of CO2 emissions in goods imported from China in just 3 years
Water issues are equally important.
Each tonne of steel imported from a developing country consumes ~ 40 - 50 tonnes of water
Ethical Issues

Conclusions• Global Warming will affect us all - in next few decades
• Energy Security will become increasingly important. Inaction over making difficult decisions now will make Energy Insecurity more likely in future.
• Move towards energy conservation and LOCAL generation of renewable energy and small changes in behaviour
It is as much about the individual’s response to use of energy as any technical measures the Government may take.
• Global Warming will not only have adverse effects on our brothers and sisters in the developing world, but within the next 10 years we could also be faced with energy shortages unless we act now.
• Where would we stand if we had to make the choice of whether we drive 1.6 miles or heat an old person’s room?
35

WEBSITE www.cred-uk.org/
This presentation will be available from tomorrow at above WEB Site: follow Academic Links
And Finally
Are you up to the Challenges facing us?:
Lao Tzu (604-531 BC) Chinese Artist and Taoist philosopher
"If you do not change direction, you may end up where you are heading."
(直译):“如果你不改变,你将止步于原地。”
Keith Tovey ( 杜伟贤 ) M.A., PhD, CEng, MICE, CEnvReader Emeritus: University of East Anglia
36