2012-2013 academic report (executive summary)
DESCRIPTION
A 24-page executive summary of the academic progress - and challenges - of the Olentangy Local School District. The individual building reports are available at www.Olentangy.K12.oh.us on each schools' home page.TRANSCRIPT


Olentangy Local Schools
Annual Report
2012—2013
2013 Annual Report
Table of Contents
District
Summary of Report Contents 1 Summary of Results 2-3 Benchmark 1 4-5 Benchmark 2 6 Benchmark 3 7-9 Benchmark 4 10-11 Benchmark 5 12-13 Benchmark 6 14-16 Benchmark 7 17-18 Benchmark 8 18-19 2013—2014 Performance Benchmarks 20-21
Buildings—Elementary Schools
Alum Creek Elementary 22-29 Arrowhead Elementary 30-37 Cheshire Elementary 38-45 Freedom Trail Elementary 46-53 Glen Oak Elementary 54-61 Heritage Elementary 62-69 Indian Springs Elementary 70-77 Johnnycake Corners Elementary 78-85 Liberty Tree Elementary 86-93 Oak Creek Elementary 94-101 Olentangy Meadows Elementary 102-109 Scioto Ridge Elementary 110-117 Tyler Run Elementary 118-125 Walnut Creek Elementary 126-133 Wyandot Run Elementary 134-141
Buildings—Middle Schools
Olentangy Berkshire Middle School 142-149 Olentangy Hyatts Middle School 150-157 Olentangy Liberty Middle School 158-165 Olentangy Orange Middle School 166-173 Olentangy Shanahan Middle School 174-181
Buildings—High Schools
Olentangy High School 182-193 Olentangy Liberty High School 194-205 Olentangy Orange High School 206-217
2013 Annual Report
District
1
The Annual Report includes historic as well as current data for all district and state testing instruments currently administered. Olentangy Local School District is committed to analyzing data beyond the state report card to measure improvement in academic achievement. The goal of the Annual Report is to organize district data around Continuous Improvement Plan (CIP) benchmarks, which go beyond state report cards to provide a more in-depth review of Olentangy student achievement. Each section includes a graphic representation of the data, as well as brief analysis summary points. You can find additional data and reports by visiting our website—www.olentangy.k12.oh.us. It remains a goal of Olentangy’s Continuous Improvement Plan to develop other benchmarks, beyond test scores and surveys, to measure overall district quality and improvement. The difficulty in measuring arts, athletics, academics, and other areas includes determining if measuring awards earned or participation rates are the best measure of quality. Also, the data need to be easily quantified and collected. Efforts to draft benchmarks in these areas will be ongoing. In addition to Olentangy data, data from state comparison districts is also included. The Office of Policy Research and Analysis of the Ohio Department of Education generates a state comparison group for every district each year. Utilizing numerous variables, a rank order list of the twenty districts most like Olentangy is created. As often as possible, all of the data from these twenty districts are included for comparison. In any data report of this magnitude, it is inevitable that some corrections may have been missed during the editing process. If any concerns about accuracy or format are noted during the review of this document, please contact the Curriculum and Instruction Department at (740)657-4055.

2013 Annual Report
District
2
Summary of Results—Annual Benchmark Progress MET indicates that the benchmark was met at the overall building level. The legend below will be used throughout the report to let you know, at a glance, whether or not the benchmark has been met.
MET
NOT MET
Benchmark 1: Achievement at or above projected performance levels
Increase or maintain at least 80 percent of students achieving at or above their projected performance level. MET—11 of 19 subjects increased from the previous year or maintained 80%.
Benchmark 2: Facilitate a year or more in achievement for a year of instruction
Overall district/building growth is at or above a year’s worth of growth. MET—Overall growth rating above a year’s worth of growth with a letter grade of “A”.
Majority of subjects and grade levels will meet or exceed a year’s worth of growth. MET—Majority of subjects and grade levels met a year’s worth of growth.
Benchmark 3: Meet state standards at the District and Building levels
Seventy-five percent or more of students will score proficient or above in all subjects and grade levels. MET—All subjects above state benchmark.
Meet Annual Measurable Objectives (AMO) for all subgroups in Reading and Math. NOT MET—African American students did not meet AMO in Reading. IEP students did not meet AMO in Reading and Math. The final score was 89.0 with a letter grade of “B”.
State performance index will increase or maintain at least 106.5. MET—Performance Index increased from 107.3 to 107.5.
Benchmark 4: Top of State and Nation
Will surpass the advanced and accelerated percentages of the similar district group in a majority of subjects and grade levels. MET—15 of 19 subjects surpassed similar district average.
State performance index ranking will increase or remain in the top ten percent of all school districts. MET—Performance Index ranking increased from the top 6.4% to the top 5.2% in the State.
Benchmark 5: Increased percentages of students at advanced and accelerated levels
Increase or maintain at least 50 percent of students scoring at advanced and accelerated levels. MET—18 of 19 subjects increased from the previous year or maintained 50%.
Increase or maintain at least 50 percent of juniors and seniors participating in Advanced Placement courses. MET—Percentage of juniors and seniors participating in AP increased from 67.5% to 68.9%.
Increase or maintain at least 75 percent of juniors and seniors earning a score of three or higher on Advanced Placement exams. MET—Percentage of students scoring a 3 or higher increased from 80.8% to 81.2%.

2013 Annual Report
District
3
Benchmark 6: Graduates prepared for educational/vocational pursuit of their choice
Increase from the three-year average or maintain above 90 percent of seniors giving top two ratings on the exit survey. MET—Majority of items showed an increase in percentage or maintained above 90% of seniors giving top two ratings.
Increase or maintain 50 percent of students meeting all four ACT college readiness benchmarks. NOT MET—Percentage decreased from 50% to 48%, meeting all four benchmarks.
ACT mean scores will increase or remain high at 25. NOT MET—District ACT mean scores decreased from 24.8 to 24.2.
Ohio Board of Regents college data will show decrease in percentage of students taking developmental course work in college. MET—Percentage of students taking developmental course work in college decreased from 25% to 24%.
Our high schools will continue to be ranked in the top 500 high schools in the nation as ranked by the Challenge Index. MET—All three high schools were ranked in the top 500 high school in the nation as ranked by the Challenge Index.
Benchmark 7: Responsible financial management • Obtain annual GFOA (Government Finance Officer Association) award for excellence in financial
reporting for the district’s CAFR. MET—The District received the GFOA Award for Excellence in Financial Reporting for the District’s FY12 CAFR on September 4, 2013.
• Maintain or increase the district’s bond rating with both Moody’s and Standard & Poor’s. MET—The District received Aa1 and AA+ bond ratings by Moody’s and Standard & Poor’s respectively on June 13 &14, 2013.
• Receive a successful unqualified audit with fewer than five minor compliance citations. MET—The District received an unqualified audit opinion with less than five minor compliance citations on January 24, 2013.
• Maintain or decrease the total expenditure per pupil ranking and the administrative expenditure per pupil ranking as benchmarked against comparable districts as determined by the state of Ohio and OLSD Board of Education. NOT MET—The District’s total expenditure per pupil ranking did not decrease as benchmarked against comparable districts and other OLSD selected comparable districts. The District decreased its administrative expenditure per pupil from FY11 to FY12, but did not meet the goal of maintaining its administrative expenditure per pupil ranking from FY11 to FY12.
Benchmark 8: Resource Allocation and Utilization that balance fiscal responsibility as they support student achievement
• Achieve an “overall pupil/certified teacher ratio” at a level of 15:1 or higher as measured yearly on the OLSD 5-year forecast. This includes all certified staff such as guidance, special education, special area teachers, etc. recognizing that most individual classroom ratios will be higher. MET—“Overall pupil/certified teacher ratio” was 15.85:1 for the 2012-13 school year.
• Provide a Capital Improvement Plan and update report on a yearly basis.

2013 Annual Report
District
4
Benchmark 1: Achievement at or above projected performance levels
Increase or maintain at least 80 percent of students achieving at or above their projected performance level. MET—11 of 19 subjects increased from the previous year or maintained 80%.
OAA Projection Met 3rd R 3rd M 4th R 4th M 5th R 5th M 5th SC
OLSD 2013 84.6% 68.8% 86.2% 77.7% 78.8% 74.7% 80.7%
OLSD 2012 75.5% 82.3% 78.7% 73.6% 84.8% 81.3% 77.7%
OLSD 2011 74.8% 86.4% 94.3% 83.8% 88.2% 74.2% 87.0%
N Matched (2013) 1425 1425 1311 1311 1262 1263 1265
OAA Projection Met 6th R 6th M 7th R 7th M 8th R 8th M 8th SC
OLSD 2013 71.1% 76.8% 76.6% 88.4% 86.0% 92.9% 76.1%
OLSD 2012 90.5% 88.1% 79.8% 79.2% 82.9% 87.2% 78.2%
OLSD 2011 79.6% 76.3% 76.6% 83.0% 84.6% 86.5% 87.6%
N Matched (2013) 1252 1253 1232 1235 1116 1118 1117
0%
20%
40%
60%
80%
100%
3rd R 3rd M 4th R 4th M 5th R 5th M 5th SC
OAA Projection Met—Elementary Schools (Met 4 of 7)
OLSD 2013 OLSD 2012 OLSD 2011
0%
20%
40%
60%
80%
100%
6th R 6th M 7th R 7th M 8th R 8th M 8th SC
OAA Projection Met—Middle Schools (Met 3 of 7)
OLSD 2013 OLSD 2012 OLSD 2011
2013 Annual Report
District
5
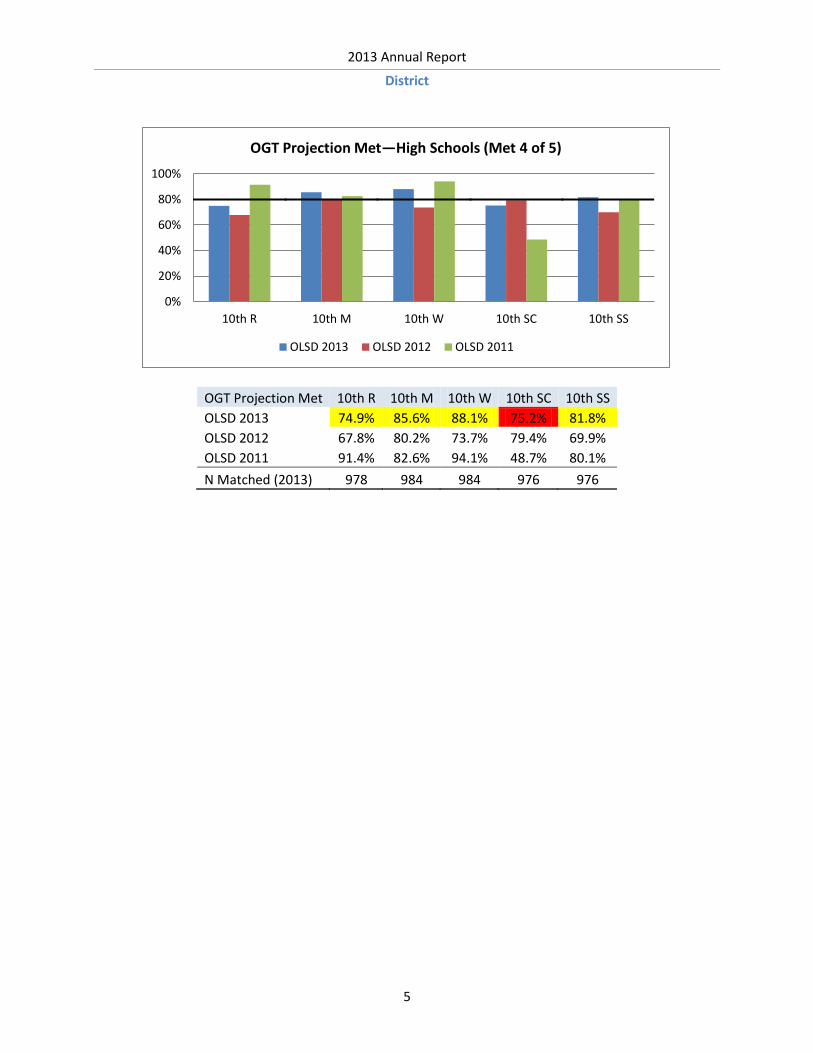
OGT Projection Met 10th R 10th M 10th W 10th SC 10th SS
OLSD 2013 74.9% 85.6% 88.1% 75.2% 81.8%
OLSD 2012 67.8% 80.2% 73.7% 79.4% 69.9%
OLSD 2011 91.4% 82.6% 94.1% 48.7% 80.1%
N Matched (2013) 978 984 984 976 976
0%
20%
40%
60%
80%
100%
10th R 10th M 10th W 10th SC 10th SS
OGT Projection Met—High Schools (Met 4 of 5)
OLSD 2013 OLSD 2012 OLSD 2011

2013 Annual Report
District
6
Benchmark 2: Facilitate a year or more in achievement for a year of instruction The data from the State tests over multiple years are examined through a series of calculations to produce an overall Value-Added designation as well as the progress of three specific groups of students: gifted students, students in the lowest 20% of achievement, and students with disabilities. There are five designations, from the highest to the lowest: Dark Green (DG), Light Green (LG), Yellow (Y), Orange (O), and Red (R). A letter grade was designated for overall students and each subgroup based on the Value-Added index that measures the progress. Subgroups of less than 6 students in every grade/subject are not rated (NR).The tests included in the calculation for the progress ratings are Grade 4—8 Reading and Math. Student growth on Grade 3 Reading, Math, Science and Social Studies, Grade 4—8 Science and Social Studies, Grade 10 Reading, Math, Writing, Science, Social Studies, and ACT Quality Core English 9, English 10, English 11, English 12, Algebra I, Algebra II, Geometry, Pre-Calculus, Biology, Chemistry, and US History are calculated by Battelle for Kids’ SOAR growth model and reported at the building level but are not factored into the progress ratings.
Overall district/building growth is at or above a year’s worth of growth. MET—Overall growth rating above a year’s worth of growth with a letter grade of “A”.
Majority of subjects and grade levels will meet or exceed a year’s worth of growth. MET—Majority of subjects and grade levels met a year’s worth of growth.
Progress Score
Subgroup (All Grades)—OLSD Reading Math All Tests Letter Grade
Overall 9.28 9.99 12.34 A
Gifted Students -1.54 5.27 1.90 B
Students in the Lowest 20% of Achievement 2.23 1.21 2.29 A
Students with Disabilities 3.42 2.31 3.82 A
Progress by Grade and Subject
Year 4 R 4 M 5 R 5 M 6 R 6 M 7 R 7 M 8 R 8 M
OLSD 2013 DG R DG DG O LG R DG DG DG
OLSD 2012 Y DG DG LG O DG O LG DG Y
OLSD 2011 DG DG DG DG R R Y DG Y R
OLSD 3-Yr Avg DG DG DG DG R LG R DG DG Y
DG Progress significantly above the average school (above +2 standard error)
LG Progress moderately above the average school (between +1 and +2 standard error)
Y Progress not detectably different from the average school (between -1 and +1 standard error)
O Progress moderately below the average school (between -2 and -1 standard error)
R Progress significantly below the average school (below -2 standard error)

2013 Annual Report
District
7
Benchmark 3: Meet state standards at the District and Building levels
Seventy-five percent or more of students will score proficient or above in all subjects and grade levels. MET—All subjects above state benchmark.
Meet Annual Measurable Objectives (AMO) for all subgroups in Reading and Math. NOT MET—African American students did not meet AMO in Reading. IEP students did not meet AMO in Reading and Math. The final score was 89.0 with a letter grade of “B”.
State performance index will increase or maintain at least 106.5. MET—Performance Index increased from 107.3 to 107.5.
OAA (Proficient or above) 3rd R 3rd M 4th R 4th M 5th R 5th M 5th SC
OLSD 2013 94.8% 92.3% 97.5% 93.1% 92.5% 85.7% 88.4%
OLSD 2012 92.4% 94.3% 95.1% 94.0% 92.7% 88.2% 91.7%
OLSD 2011 94.7% 94.0% 96.5% 92.8% 90.7% 84.5% 89.1%
OAA (Proficient or above) 6th R 6th M 7th R 7th M 8th R 8th M 8th SC
OLSD 2013 96.5% 93.7% 92.7% 91.5% 96.4% 94.4% 91.4%
OLSD 2012 97.1% 94.9% 93.1% 91.0% 95.6% 92.5% 92.9%
OLSD 2011 96.2% 93.3% 91.8% 90.3% 95.8% 89.7% 89.5%
0%
20%
40%
60%
80%
100%
3rd R 3rd M 4th R 4th M 5th R 5th M 5th SC
OAA (Proficient or above)—Elementary Schools (Met 7 of 7)
OLSD 2013 OLSD 2012 OLSD 2011
0%
20%
40%
60%
80%
100%
6th R 6th M 7th R 7th M 8th R 8th M 8th SC
OAA (Proficient or above)—Middle Schools (Met 7 of 7)
OLSD 2013 OLSD 2012 OLSD 2011

2013 Annual Report
District
8
Prof. or above 10th R 10th M 10th W 10th SC 10th SS 11th R 11th M 11th W 11th SC 11th SS
OLSD 2013 98.1% 97.1% 97.7% 94.8% 96.7% 98.9% 98.6% 98.8% 97.7% 98.0%
OLSD 2012 97.1% 96.3% 96.0% 93.0% 95.9% 98.9% 98.4% 98.5% 97.8% 98.7%
OLSD 2011 97.9% 96.8% 97.0% 93.2% 96.7% 98.8% 98.0% 99.1% 97.6% 97.9%
Annual Measurable Objectives (AMO) The Annual Measurable Objectives (AMO) score is determined using multiple data points. For each student subgroup, the percentage of students at or above proficient is compared to the statewide goal (83.4% for reading and 78.5% for math). A hundred points are earned if the subgroup met the statewide goal. Alternatively, points are awarded based on the improvement from the result last year, which is compared to the gap between the current result and the goal. Subgroups of less than 30 students are not rated (NR).
12-13 AMO Goals—OLSD Reading Math
Student Group % Prof. Goal Gap Imp* Points % Prof. Goal Gap Imp* Points
All Students 95.4 83.4 N/A 0.8 100.0 92.4 78.5 N/A -0.5 100.0
Economically Disadvantaged 84.5 83.4 N/A 0.4 100.0 81.8 78.5 N/A 1.5 100.0
Asian/Pacific Islander 96.2 83.4 N/A 1.3 100.0 95.7 78.5 N/A 0.4 100.0
African American 84.9 83.4 N/A -3.7 100.0 77.5 78.5 1.0 -2.4 0.0
American Indian/Alaskan Native NR 83.4 NR NR NR NR 78.5 NR NR NR
Hispanic 89.0 83.4 N/A 6.1 100.0 87.1 78.5 N/A 6.7 100.0
Multiracial 93.8 83.4 N/A 2.5 100.0 81.8 78.5 N/A 2.0 100.0
White 96.1 83.4 N/A 0.8 100.0 92.9 78.5 N/A -0.9 100.0
IEP 78.7 83.4 4.7 0.1 2.1 66.8 78.5 11.7 -1.9 0.0
LEP 81.2 83.4 2.2 4.3 100.0 81.7 78.5 N/A 4.9 100.0
*Improvement (Imp): Improvement (Imp): Improvement from the result last year. If the improvement is greater than the gap, then 100.0 points are earned. Otherwise, partial points may be awarded. It is impossible to earn more than 100 or less than zero points.
0%
20%
40%
60%
80%
100%
10th R 10th M 10th W 10th SC 10th SS 11th R 11th M 11th W 11th SC 11th SS
OGT (Proficient or above)—High Schools (Met 10 of 10)
OLSD 2013 OLSD 2012 OLSD 2011

2013 Annual Report
District
9
Performance Index Score The performance Index Score reflects the achievement of every tested student. The score is a weighted average of all tested subjects in grade 3—8 and grade 10. The most weight is given to the advanced students (1.2), then the weights decrease for each performance level. This creates a scale of 0 to 120 points. Performance Index Scores over time show trends in school achievement.
Performance Index 12-13 11-12 10-11 09-10 08-09
Olentangy Local Schools 107.5 107.3 106.9 105.8 105.1
Alum Creek Elementary 106.7 105.3 105.3 105.0 106.1
Arrowhead Elementary 99.7 104.6 103.0 99.8 101.1
Cheshire Elementary 107.3 107.5 105.4 N/A N/A
Freedom Trail Elementary 106.6 107.1 106.2 105.2 N/A
Glen Oak Elementary 101.1 101.7 101.4 99.1 101.7
Heritage Elementary 104.7 N/A N/A N/A N/A
Indian Springs Elementary 106.2 107.8 105.9 106.3 104.4
Johnnycake Corners Elementary 107.6 108.6 109.7 111.0 108.6
Liberty Tree Elementary 106.5 106.6 106.5 100.1 102.4
Oak Creek Elementary 102.3 104.8 103.1 102.7 105.6
Olentangy Meadows Elementary 104.1 104.2 105.0 104.5 102.8
Scioto Ridge Elementary 109.8 108.8 108.3 107.1 103.7
Tyler Run Elementary 108.1 108.1 107.3 105.9 106.4
Walnut Creek Elementary 107.4 108.4 107.3 106.6 108.1
Wyandot Run Elementary 107.4 108.0 106.6 105.7 107.0
Olentangy Berkshire Middle 107.6 107.9 N/A N/A N/A
Olentangy Hyatts Middle 108.0 107.5 105.5 104.0 102.2
Olentangy Liberty Middle 108.0 107.5 107.0 106.2 105.6
Olentangy Orange Middle 105.1 105.5 104.6 103.0 100.8
Olentangy Shanahan Middle 107.2 106.3 106.4 105.5 103.9
Olentangy High School 112.2 110.2 110.3 109.5 109.7
Olentangy Liberty High School 111.8 110.1 112.0 110.8 112.0
Olentangy Orange High School 109.0 108.5 109.8 109.9 109.0

2013 Annual Report
District
10
Benchmark 4: Top of State and Nation
Will surpass the advanced and accelerated percentages of the similar district group in a majority of subjects and grade levels. MET—15 of 19 subjects surpassed similar district average.
State performance index ranking will increase or remain in the top ten percent of all school districts. MET—Performance Index ranking increased from the top 6.4% to the top 5.2% in the State.
OAA (Adv. and Acc.) 3rd R 3rd M 4th R 4th M 5th R 5th M 5th SC
OLSD 2013 85.0% 62.8% 64.2% 65.8% 32.1% 62.8% 70.9%
Similar District 82.6% 62.3% 62.6% 66.4% 31.8% 62.9% 69.8%
OAA (Adv. and Acc.) 6th R 6th M 7th R 7th M 8th R 8th M 8th SC
OLSD 2013 57.0% 74.3% 59.9% 61.7% 80.2% 64.7% 59.7%
Similar District 57.9% 71.0% 60.6% 58.3% 78.4% 62.3% 54.0%
0%
20%
40%
60%
80%
100%
3rd R 3rd M 4th R 4th M 5th R 5th M 5th SC
OAA (Adv. and Acc.)—Elementary Schools (Met 5 of 7)
OLSD 2013 Similar District
0%
20%
40%
60%
80%
100%
6th R 6th M 7th R 7th M 8th R 8th M 8th SC
OAA (Adv. and Acc.)—Middle Schools (Met 5 of 7)
OLSD 2013 Similar District

2013 Annual Report
District
11
OGT (Adv. and Acc.) 10th R 10th M 10th W 10th SC 10th SS
OLSD 2013 79.0% 87.6% 76.7% 74.9% 83.7%
Similar District 78.3% 84.1% 69.1% 74.6% 79.6%
Similar District Comparison Group There are twenty school districts the state of Ohio determines are most like Olentangy based on several criteria. The criteria are: enrollment, percentage of poverty, median income, percentage of land that is used for agriculture, population density, percentage of minorities, and percentage of population with a college degree. Because these criteria change annually so does our group. The twenty schools in our similar district group this year are: Avon Lake City, Avon Local, Beavercreek City, Centerville City, Dublin City, Forest Hills Local, Gahanna-Jefferson City, Hilliard City, Hudson City, Lakota Local, Loveland City, Mason City, New Albany-Plain Local, Perrysburg Exempted Village, Pickerington Local, Solon City, Springboro Community City, Sylvania City, Upper Arlington City, and Worthington City. Performance Index Ranking The following rankings represent the school district’s position among all school districts with a similar grade span in the State of Ohio, based on the Performance Index Score. There were 610 school districts with similar grade span and available data at the time of this report.
Performance Index 12-13 11-12 10-11 09-10 08-09
OLSD rank among all buildings 32 39 35 43 45
OLSD within top % of the State 5.2% 6.4% 5.7% 7.0% 7.4%
0%
20%
40%
60%
80%
100%
10th R 10th M 10th W 10th SC 10th SS
OGT (Adv. and Acc.)—High Schools (Met 5 of 5)
OLSD 2013 Similar District

2013 Annual Report
District
12
Benchmark 5: Increased percentages of students at advanced and accelerated levels
Increase or maintain at least 50 percent of students scoring at advanced and accelerated levels. MET—18 of 19 subjects increased from the previous year or maintained 50%.
Increase or maintain at least 50 percent of juniors and seniors participating in Advanced Placement courses. MET—Percentage of juniors and seniors participating in AP increased from 67.5% to 68.9%.
Increase or maintain at least 75 percent of juniors and seniors earning a score of three or higher on Advanced Placement exams. MET—Percentage of students scoring a 3 or higher increased from 80.8% to 81.2%.
OAA (Adv. and Acc.) 3rd R 3rd M 4th R 4th M 5th R 5th M 5th SC
OLSD 2013 85.0% 62.8% 64.2% 65.8% 32.1% 62.8% 70.9%
OLSD 2012 79.1% 68.8% 56.1% 67.3% 46.8% 66.4% 72.0%
OLSD 2011 79.8% 64.6% 63.7% 67.6% 41.5% 60.2% 72.0%
OAA (Adv. and Acc.) 6th R 6th M 7th R 7th M 8th R 8th M 8th SC
OLSD 2013 57.0% 74.3% 59.9% 61.7% 80.2% 64.7% 59.7%
OLSD 2012 68.1% 77.7% 57.2% 53.5% 72.3% 55.8% 62.6%
OLSD 2011 61.2% 72.6% 62.5% 54.7% 70.6% 51.4% 62.8%
0%
20%
40%
60%
80%
100%
3rd R 3rd M 4th R 4th M 5th R 5th M 5th SC
OAA (Adv. and Acc.)—Elementary Schools (Met 6 of 7)
OLSD 2013 OLSD 2012 OLSD 2011
0%
20%
40%
60%
80%
100%
6th R 6th M 7th R 7th M 8th R 8th M 8th SC
OAA (Adv. and Acc.)—Middle Schools (Met 7 of 7)
OLSD 2013 OLSD 2012 OLSD 2011

2013 Annual Report
District
13
OGT (Adv. and Acc.) 10th R 10th M 10th W 10th SC 10th SS
OLSD 2013 79.0% 87.6% 76.7% 74.9% 83.7%
OLSD 2012 79.8% 84.3% 66.7% 75.2% 79.7%
OLSD 2011 82.8% 86.0% 75.9% 68.8% 85.0%
Advanced Placement
Advanced Placement 12-13 11-12 10-11 09-10 08-09
OLSD % students taking AP Courses 68.9% 67.5% 68.2% 58.0% 54.7%
OLSD % students scoring 3, 4, or 5 81.2% 80.8% 77.2% 75.7% 72.9%
0%
20%
40%
60%
80%
100%
10th R 10th M 10th W 10th SC 10th SS
OGT (Adv. and Acc.)—High Schools (Met 5 of 5)
OLSD 2013 OLSD 2012 OLSD 2011

2013 Annual Report
District
14
Benchmark 6: Graduates prepared for educational/vocational pursuit of their choice
Increase from the three-year average or maintain above 90 percent of seniors giving top two ratings on the exit survey. MET—Majority of items showed an increase in percentage or maintained above 90% of seniors giving top two ratings.
Increase or maintain 50 percent of students meeting all four ACT college readiness benchmarks. NOT MET—Percentage decreased from 50% to 48%, meeting all four benchmarks.
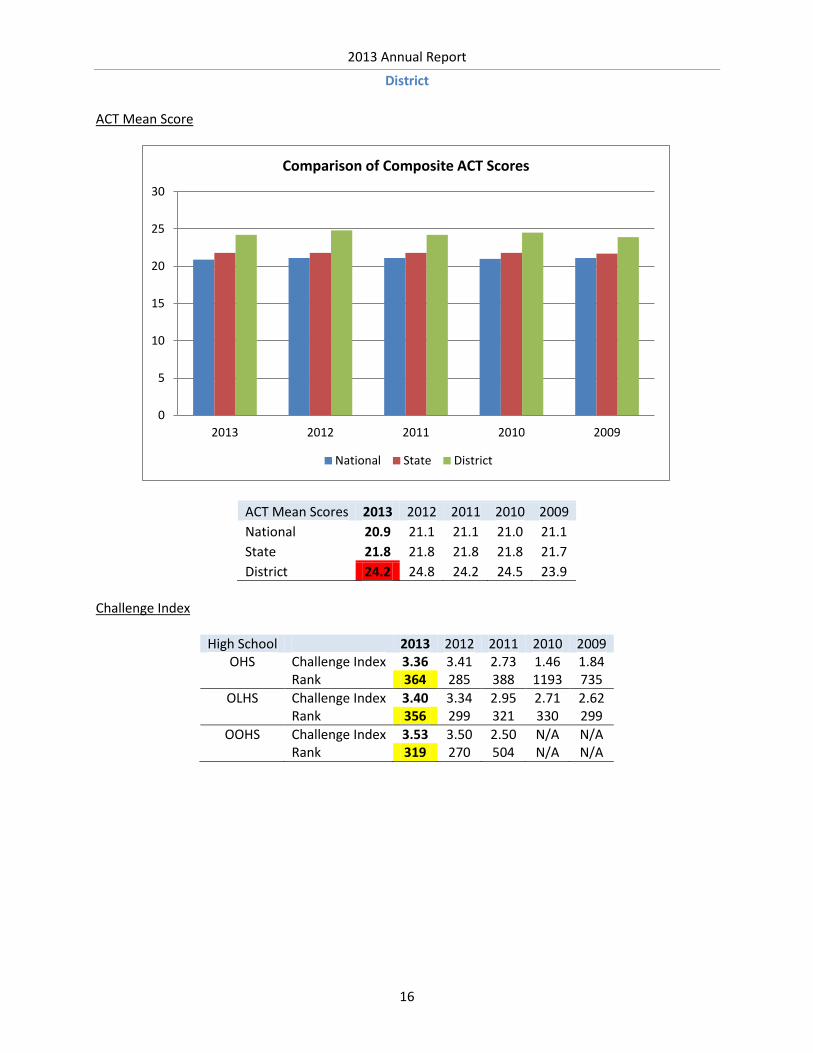
ACT mean scores will increase or remain high at 25. NOT MET—District ACT mean scores decreased from 24.8 to 24.2.
Ohio Board of Regents college data will show decrease in percentage of students taking developmental course work in college. MET—Percentage of students taking developmental course work in college decreased from 25% to 24%.
Our high schools will continue to be ranked in the top 500 high schools in the nation as ranked by the Challenge Index. MET—All three high schools were ranked in the top 500 high school in the nation as ranked by the Challenge Index.
Senior Survey The Senior Survey is given to the graduating class annually in May of students’ senior year.
% Choosing Yes 2013 3-Yr 2012 2011 2010
Did OLSD provide a safe, caring, respectful environment? 94.3% 97.5% 97.1% 98.3% 97.1%
Did OLSD prepare you for what you want to do after graduation?
91.4% 92.7% 95.7% 94.2% 88.3%
Were you encouraged to attempt advanced coursework? 89.9% 88.7% 90.2% 90.8% 85.2%
Did your teachers have high expectations for quality work? 94.9% 96.0% 96.7% 96.2% 95.1%
Did your teachers provide you with frequent feedback to show you where and how you needed to improve your achievement?
84.3% 83.5% 87.0% 83.9% 79.7%
Did OLSD facilitate maximum learning for you? 89.4% 87.6% 90.3% 89.4% 83.1%
% Choosing Highest 2 Ratings 2013 3-Yr 2012 2011 2010
Overall, my math courses were challenging. 88.5% 87.0% 89.3% 87.7% 84.1%
Overall, my science courses were challenging. 89.0% 88.0% 91.2% 87.7% 85.1%
Overall, my social studies courses were challenging. 79.3% 69.9% 79.9% 74.2% 55.7%
Overall, my English courses were challenging. 76.9% 74.6% 75.0% 80.8% 68.0%
OLSD actively partners with parents and community. 60.7% 61.9% 62.7% 68.0% 55.0%
OLSD offers a focused and challenging curriculum. 87.7% 86.1% 89.1% 87.8% 81.4%
Staff at OLSD work together to improve student achievement. 80.6% 79.4% 83.1% 80.9% 74.3%
Teachers and counselors used information about my learning to drive decisions about my course selection and opportunities.
72.7% 72.4% 75.4% 75.9% 66.0%
Instruction in my classes was focused on students being actively involved in understanding the material.
78.7% 77.5% 82.1% 78.3% 72.1%
2013 Annual Report
District
15
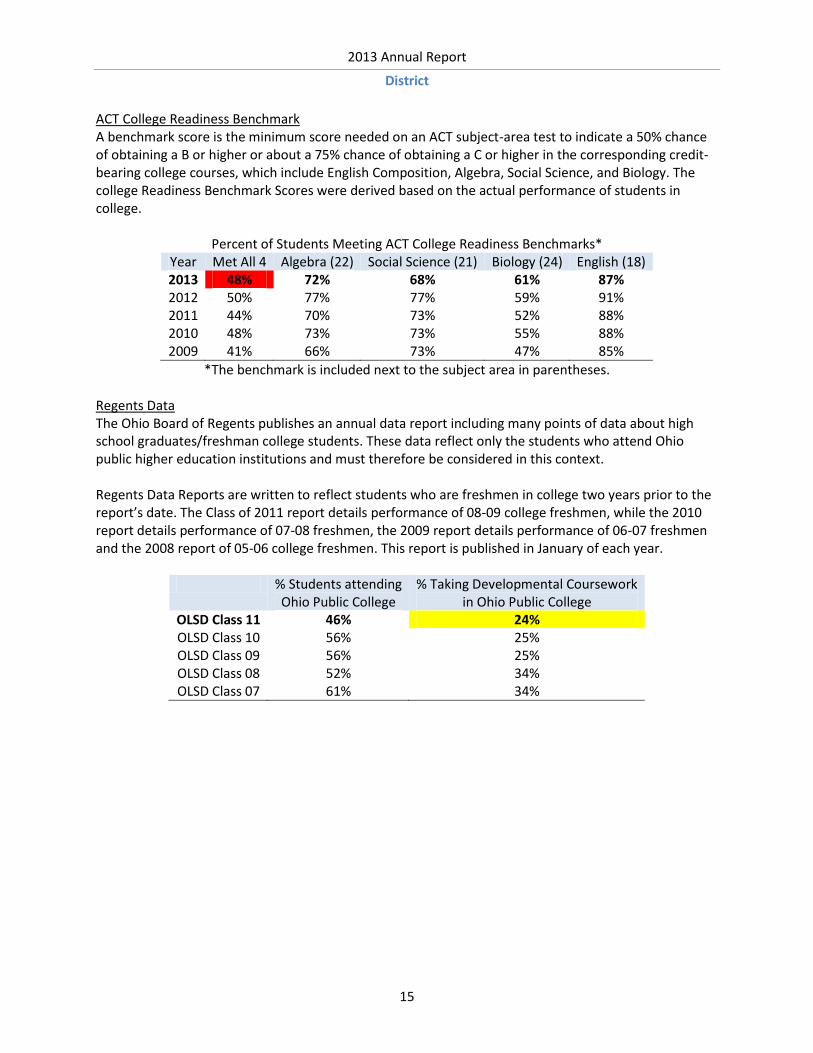
ACT College Readiness Benchmark A benchmark score is the minimum score needed on an ACT subject-area test to indicate a 50% chance of obtaining a B or higher or about a 75% chance of obtaining a C or higher in the corresponding credit-bearing college courses, which include English Composition, Algebra, Social Science, and Biology. The college Readiness Benchmark Scores were derived based on the actual performance of students in college.
Percent of Students Meeting ACT College Readiness Benchmarks* Year Met All 4 Algebra (22) Social Science (21) Biology (24) English (18) 2013 48% 72% 68% 61% 87% 2012 50% 77% 77% 59% 91% 2011 44% 70% 73% 52% 88% 2010 48% 73% 73% 55% 88% 2009 41% 66% 73% 47% 85%
*The benchmark is included next to the subject area in parentheses. Regents Data The Ohio Board of Regents publishes an annual data report including many points of data about high school graduates/freshman college students. These data reflect only the students who attend Ohio public higher education institutions and must therefore be considered in this context. Regents Data Reports are written to reflect students who are freshmen in college two years prior to the report’s date. The Class of 2011 report details performance of 08-09 college freshmen, while the 2010 report details performance of 07-08 freshmen, the 2009 report details performance of 06-07 freshmen and the 2008 report of 05-06 college freshmen. This report is published in January of each year.
% Students attending Ohio Public College
% Taking Developmental Coursework in Ohio Public College
OLSD Class 11 46% 24% OLSD Class 10 56% 25% OLSD Class 09 56% 25% OLSD Class 08 52% 34% OLSD Class 07 61% 34%
2013 Annual Report
District
16
ACT Mean Score
ACT Mean Scores 2013 2012 2011 2010 2009
National 20.9 21.1 21.1 21.0 21.1
State 21.8 21.8 21.8 21.8 21.7
District 24.2 24.8 24.2 24.5 23.9
Challenge Index
High School 2013 2012 2011 2010 2009 OHS Challenge Index 3.36 3.41 2.73 1.46 1.84
Rank 364 285 388 1193 735
OLHS Challenge Index 3.40 3.34 2.95 2.71 2.62 Rank 356 299 321 330 299
OOHS Challenge Index 3.53 3.50 2.50 N/A N/A Rank 319 270 504 N/A N/A
0
5
10
15
20
25
30
2013 2012 2011 2010 2009
Comparison of Composite ACT Scores
National State District

2013 Annual Report
District
17
Benchmark 7: Responsible financial management • Obtain annual GFOA (Government Finance Officer Association) award for excellence in financial
reporting for the district’s CAFR. MET—The District received the GFOA Award for Excellence in Financial Reporting for the District’s FY12 CAFR on September 4, 2013. The District submitted the FY12 CAFR to the national Governmental Finance Officer Association. Its review resulted in the District once again receiving their Award for Excellence in Financial Reporting. This is the 15th year the district has received this award.
• Maintain or increase the district’s bond rating with both Moody’s and Standard & Poor’s. MET—The District received Aa1 and AA+ bond ratings by Moody’s and Standard & Poor’s respectively on June 13 & 14, 2013. The agencies reaffirmed the ratings as part of issuance of general obligation $33,315,000 refunding bonds and $7,055,000 construction bonds that settled on August 12, 2013.
• Receive a successful unqualified audit with fewer than five minor compliance citations. MET—The District received an unqualified audit opinion with less than five minor compliance citations on January 24, 2013.
• Maintain or decrease the total expenditure per pupil ranking and the administrative expenditure per pupil ranking as benchmarked against comparable districts as determined by the state of Ohio and OLSD Board of Education. NOT MET—The District’s total expenditure per pupil ranking did not decrease as benchmarked against comparable districts and other OLSD selected comparable districts. The District decreased its administrative expenditure per pupil from FY11 to FY12, but did not meet the goal of maintaining its administrative expenditure per pupil ranking from FY11 to FY12. Making these comparisons year to year can be misleading because the ODE comparison districts do change from year to year based on the socioeconomic factors in districts.

2013 Annual Report
District
18
Total Expenditure per Pupil Administrative expenditure per pupil and total cost per pupil data is released by the Ohio Department of Education annually.
Admin Exp
per Pupil FY12
Admin Exp
per Pupil FY11
Total Cost
per Pupil FY12
Total Cost
per Pupil FY11
Perrysburg Exempted Village $473 $455 Avon Local $7,274 $7,181 Avon Local $763 $751 Springboro Community City $7,812 $7,928 Mason City $800 $811 Perrysburg Exempted Village $8,581 $8,590 Springboro Community City $811 $744 Lakota Local $8,618 $9,387 Hilliard City $843 $1,077 Big Walnut Local $9,342 $9,261 Centerville City $860 $828 Pickerington Local $9,520 $9,865 Olentangy Local $865 $868 Olentangy Local $9,599 $9,465 Delaware City $907 $927 Delaware City $9,681 $10,009 Forest Hills Local $934 $999 Buckeye Valley Local $9,748 $9,938 Beavercreek City $1,037 $1,073 Loveland City $9,843 $9,755 Pickerington Local $1,048 $1,050 Forest Hills Local $10,208 $10,496 Lakota Local $1,064 $988 Beavercreek City $10,308 $10,692 Loveland City $1,082 $987 Mason City $10,413 $10,125 Westerville City $1,136 $1,221 Sylvania City $10,660 $11,574 Dublin City $1,155 $1,229 Westerville City $10,720 $10,890 Big Walnut Local $1,155 $1,249 Avon Lake City $10,858 $10,904 Brecksville-Broadview Heights City $1,156 $1,222 Hilliard City $11,336 $11,398 Avon Lake City $1,185 $1,141 Gahanna-Jefferson City $11,425 $11,625 Buckeye Valley Local $1,255 $1,243 Centerville City $11,528 $11,086 Gahanna-Jefferson City $1,257 $1,242 Brecksville-Broadview Heights City $11,636 $11,665 New Albany-Plain Local $1,319 $1,293 New Albany-Plain Local $12,138 $12,249 Upper Arlington City $1,338 $1,379 Dublin City $12,709 $13,013 Sylvania City $1,352 $1,402 Hudson City $13,211 $13,671 Solon City $1,368 $1,422 Solon City $13,214 $13,387 Bexley City $1,409 $1,451 Worthington City $13,366 $13,305 Worthington City $1,427 $1,418 Bexley City $14,347 $14,337 Hudson City $1,429 $1,404 Upper Arlington City $15,157 $15,172
Benchmark 8: Resource Allocation and Utilization that balance fiscal responsibility as they support student achievement
• Achieve an “overall pupil/certified teacher ratio” at a level of 15:1 or higher as measured yearly on the OLSD 5-year forecast. This includes all certified staff such as guidance, special education, special area teachers, etc. recognizing that most individual classroom ratios will be higher. MET—“Overall pupil/certified teacher ratio” was 15.85:1 for the 2012-13 school year.
• Provide a Capital Improvement Plan and update report on a yearly basis. Overall Pupil/Certified Teacher Ratio The positive trend in “overall pupil/certified teacher ratio” is a direct result of on-going efforts to identify staffing efficiencies that enable us to deliver a higher quality educational product at a low cost.
School Year 12-13 11-12 10-11 09-10 08-09 Overall Pupil/Certified Teacher Ratio 15.85 15.42 15.34 14.74 14.57

2013 Annual Report
District
19
Recent examples of staffing efficiencies: • Slight increase in student/teacher classroom ratio at the elementary, middle and high school
levels, but still below contractual limit • Eighth (8th) grade staffing model • Elementary Orchestra Program (outside the school day) • Elementary literacy support staff (reduced staff from 2 to 1) • High School physical education waiver
Facilities and Maintenance During the 2012/2013 school year, the Business Management Department created a plan that allows for the projection of anticipated capital improvements for all OLSD facilities. The creation of the plan took into account the life cycle of the District’s fixed assets. Additional improvement needs were identified at various shareholder group meetings in 2012 and 2013. The costs for the capital improvements were obtained and the data consolidated into spreadsheets. The information was detailed out to reflect OLSD District totals, costs per building, yearly costs, and improvements needed by category type. For the summer of 2013, we planned over 265 “improvement projects” throughout all of the OLSD facilities. The largest projects were:
Asphalt Improvements OHS, OSMS, OBMS, HES, SRES, AES, ACES, TRES ($275,000 FY13 budget and $182,654 advanced from FY14) $457,654 Grandstand Replacement OSMS $148,285 Hot Water Heating Needs OHMS, ISES, OSMS $121,870 Safety Improvements All Sites $65,096 New Corridor Lockers OOHS, OLHS, OSMS $78,048 HVAC Improvements OHS, WRES, OLMS, OLHS, East Transportation $49,633 Tennis Court Re-surfacing OOHS and OLHS $43,930
The budget for all 28 facilities for 2013 was $1,100,000. Actual costs for 2013 came in at $1,045,742. The number of projects completed and the cost per site is as follows:
Facility Type Number of Projects Total Spent High Schools 72 permanent improvement projects $251,468 Middle Schools 73 permanent improvement projects $355,652 Elementary Schools 99 permanent improvement projects $400,995 Central Office 13 permanent improvement projects $14,307 Transportation/Other 10 permanent improvement projects $23,317
The balance of the 2013 funding is being deferred to 2014, for needed repairs to the track at Liberty High School. The repairs to the track were put on hold in 2013 due to the installation of artificial turf at the same location in the summer of 2013. Planning to identify all capital improvement needs and estimated costs for 2014 (and beyond) is currently underway.

2013 Annual Report
District
20
Olentangy Local Schools
2013—14 Performance Benchmarks
Benchmark 1: Achievement at or above projected performance levels • Increase or maintain at least 80 percent of students achieving at or above their projected
performance level in a majority of subject and grade levels. Benchmark 2: Facilitate a year or more of growth for every year of instruction
• Overall district/building growth will meet or exceed a year’s worth of growth. • Gifted students will meet or exceed a year’s worth of growth. • Students with disabilities will meet or exceed a year’s worth of growth. • Students in the lowest twenty percent of achievement statewide will meet or exceed a year’s
worth of growth. Benchmark 3: Meet or exceed State’s achievement and gap closing standards at the district and building levels
• Eighty percent or more of students will score proficient or above in all subjects and grade levels. • State Performance Index will increase or maintain at least 108.0. • Meet Annual Measurable Objectives (AMOs) for all subgroups in reading and math.
Benchmark 4: Top of State and Nation
• Increase or maintain at least 60 percent of students scoring at advanced and accelerated levels. • Surpass the advanced and accelerated percentages of the similar-district group in a majority of
subjects and grade levels. • State Performance Index ranking will increase or remain in the top ten percent of all school
districts. • Increase or maintain at least 65 percent of juniors and seniors participating in Advanced
Placement courses or dual enrollment. • Increase or maintain at least 75 percent of juniors and seniors earning a score of three or higher
on Advanced Placement exams. Benchmark 5: Graduates prepared for educational/vocational pursuit of their choice
• Increase or maintain at least 90 percent of seniors giving top two ratings on the exit survey. • Increase or maintain 50 percent of students meeting all four ACT college readiness benchmarks. • ACT mean scores will increase or remain high at 25. • Ohio Board of Regents college data will show decrease in percentage of students taking
developmental course work in college. • Our high schools will continue to be ranked in the top 500 high schools in the nation as ranked
by US News and World Report, Newsweek, and The Washington Post.

2013 Annual Report
District
21
Benchmark 6: Responsible financial management • Obtain annual GFOA (Government Finance Officer Association) award for excellence in financial
reporting for the district’s CAFR. • Maintain or increase the district’s bond rating with both Moody’s and Standard & Poor’s. • Receive a successful unqualified audit with fewer than five minor compliance citations.
Benchmark 7: Resource allocation and utilization that balance fiscal responsibility as they support student achievement
• Maintain or decrease the District’s expenditure cost per pupil from fiscal year 2013. The District’s ranking should be in the top quartile as benchmarked against “comparable districts” as established by the Ohio Department of Education.
• The District’s percent of their operating expenditures for classroom instruction vs. non-classroom purposes should be ranked in the top quartile as benchmarked against “comparable districts” as established by the Ohio Department of Education.
• Achieve an “overall pupil/certified teacher ratio” at a level of 15.5:1 or higher as measured yearly on the OLSD 5-year forecast. This includes all certified staff such as guidance, special education, special area teachers, etc. recognizing that most individual classroom ratios will be higher.
• Identify annually needed improvements throughout the district. • Produce cost projections annually for short-term improvement projects identified. • Forecast annually long-term funding that will be needed to maintain district equipment and
facilities. • Annually review projects identified and funding requirements with applicable OLSD staff and
various shareholder groups. Benchmark 8: High community engagement and stakeholder satisfaction
• Community survey results equal or surpass the previous year in areas related to educational quality, future direction, and fiscal management.
• Measurable community outreach at all levels of administration include quarterly board/community dialogue, tri-annual community forums, and annual reports from principals to the superintendent on community engagement.